Embed Size (px)
Citation preview

Do not put content
on the brand
signature area
Primary Colours
RGB = 198, 12, 48
RGB = 0, 179, 190
RGB = 30, 30, 30
Secondary Colours
RGB = 146, 214, 227
RGB = 39, 104, 143
RGB = 174, 39, 95
RGB = 188, 190, 192
RGB = 199, 243, 251
RGB = 201, 204, 221
RGB = 225, 203, 209
RGB = 230, 231, 232
Tertiary Colours
RGB = 163, 207, 98
RGB = 253, 185, 19
RGB = 124, 33, 72
RGB = 210, 189, 86
AUTO HOME BUSINESS
Investor Presentation
Intact Financial Corporation (TSX: IFC)
February 2018
Do not put content
on the brand
signature area
Primary Colours
RGB = 198, 12, 48
RGB = 0, 179, 190
RGB = 30, 30, 30
Secondary Colours
RGB = 146, 214, 227
RGB = 39, 104, 143
RGB = 174, 39, 95
RGB = 188, 190, 192
RGB = 199, 243, 251
RGB = 201, 204, 221
RGB = 225, 203, 209
RGB = 230, 231, 232
Tertiary Colours
RGB = 163, 207, 98
RGB = 253, 185, 19
RGB = 124, 33, 72
RGB = 210, 189, 86
2
Canada’s largest home, auto
and business insurer
5.9%
6.4%
9.1%
10.4%
17.3%
#5
#4
#3
#2
IFC
Largest market share
in a fragmented industry
10-year outperformance
versus the industry Distinct brands
Industry data: IFC estimates based on MSA Research Inc. Please refer to Important notes on page 3 of the Q4-2017 MD&A for further information.
All market share and outperformance data as at December 31, 2016. 1 Premium growth includes the impact of industry pools. 2 Combined ratio includes the market yield adjustment (MYA). 3 ROEs reflect IFRS beginning in 2010. Since 2011, IFC's ROE is adjusted return on common shareholders' equity (AROE).
4.1 pts
3.3 pts
5.4 pts
Top 5
represent
49% market share
Premium
growth 1
Combined
ratio 2
Return on
equity 3
New U.S. platform
Do not put content
on the brand
signature area
Primary Colours
RGB = 198, 12, 48
RGB = 0, 179, 190
RGB = 30, 30, 30
Secondary Colours
RGB = 146, 214, 227
RGB = 39, 104, 143
RGB = 174, 39, 95
RGB = 188, 190, 192
RGB = 199, 243, 251
RGB = 201, 204, 221
RGB = 225, 203, 209
RGB = 230, 231, 232
Tertiary Colours
RGB = 163, 207, 98
RGB = 253, 185, 19
RGB = 124, 33, 72
RGB = 210, 189, 86
3
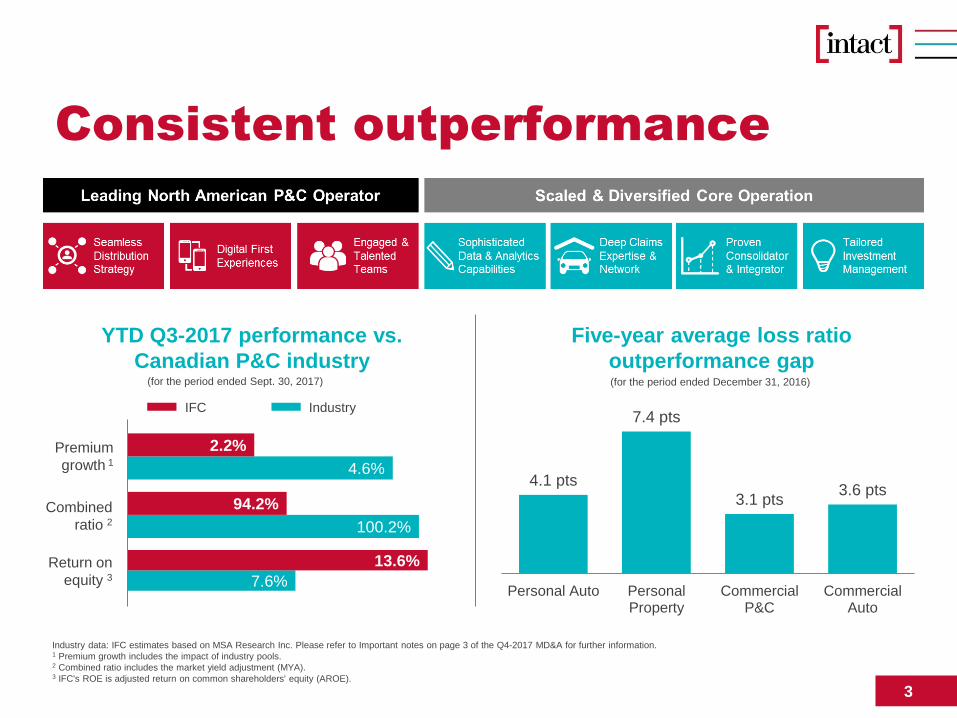
Consistent outperformance
4.1 pts
7.4 pts
3.1 pts 3.6 pts
Personal Auto PersonalProperty
CommercialP&C
CommercialAuto
Five-year average loss ratio
outperformance gap
YTD Q3-2017 performance vs.
Canadian P&C industry (for the period ended December 31, 2016) (for the period ended Sept. 30, 2017)
Industry data: IFC estimates based on MSA Research Inc. Please refer to Important notes on page 3 of the Q4-2017 MD&A for further information. 1 Premium growth includes the impact of industry pools. 2 Combined ratio includes the market yield adjustment (MYA). 3 IFC's ROE is adjusted return on common shareholders' equity (AROE).
4.6%
2.2%
100.2%
94.2%
7.6%
13.6%
Premium
growth 1
Combined
ratio 2
Return on
equity 3
IFC Industry
Do not put content
on the brand
signature area
Primary Colours
RGB = 198, 12, 48
RGB = 0, 179, 190
RGB = 30, 30, 30
Secondary Colours
RGB = 146, 214, 227
RGB = 39, 104, 143
RGB = 174, 39, 95
RGB = 188, 190, 192
RGB = 199, 243, 251
RGB = 201, 204, 221
RGB = 225, 203, 209
RGB = 230, 231, 232
Tertiary Colours
RGB = 163, 207, 98
RGB = 253, 185, 19
RGB = 124, 33, 72
RGB = 210, 189, 86
4
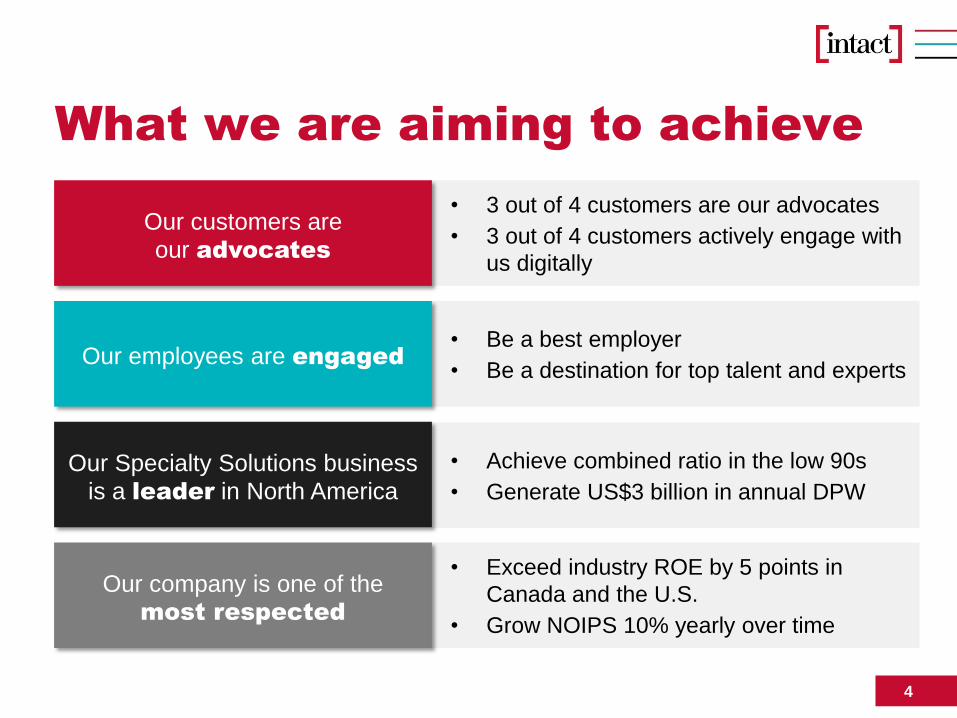
What we are aiming to achieve
Our customers are our advocates
Our employees are engaged
Our Specialty Solutions business
is a leader in North America
Our company is one of the most respected
• 3 out of 4 customers are our advocates
• 3 out of 4 customers actively engage with
us digitally
• Be a best employer
• Be a destination for top talent and experts
• Achieve combined ratio in the low 90s
• Generate US$3 billion in annual DPW
• Exceed industry ROE by 5 points in
Canada and the U.S.
• Grow NOIPS 10% yearly over time
Do not put content
on the brand
signature area
Primary Colours
RGB = 198, 12, 48
RGB = 0, 179, 190
RGB = 30, 30, 30
Secondary Colours
RGB = 146, 214, 227
RGB = 39, 104, 143
RGB = 174, 39, 95
RGB = 188, 190, 192
RGB = 199, 243, 251
RGB = 201, 204, 221
RGB = 225, 203, 209
RGB = 230, 231, 232
Tertiary Colours
RGB = 163, 207, 98
RGB = 253, 185, 19
RGB = 124, 33, 72
RGB = 210, 189, 86
0
100
200
300
400
500
600
700
5-year avg. FY2016 YTD Q3-17
5
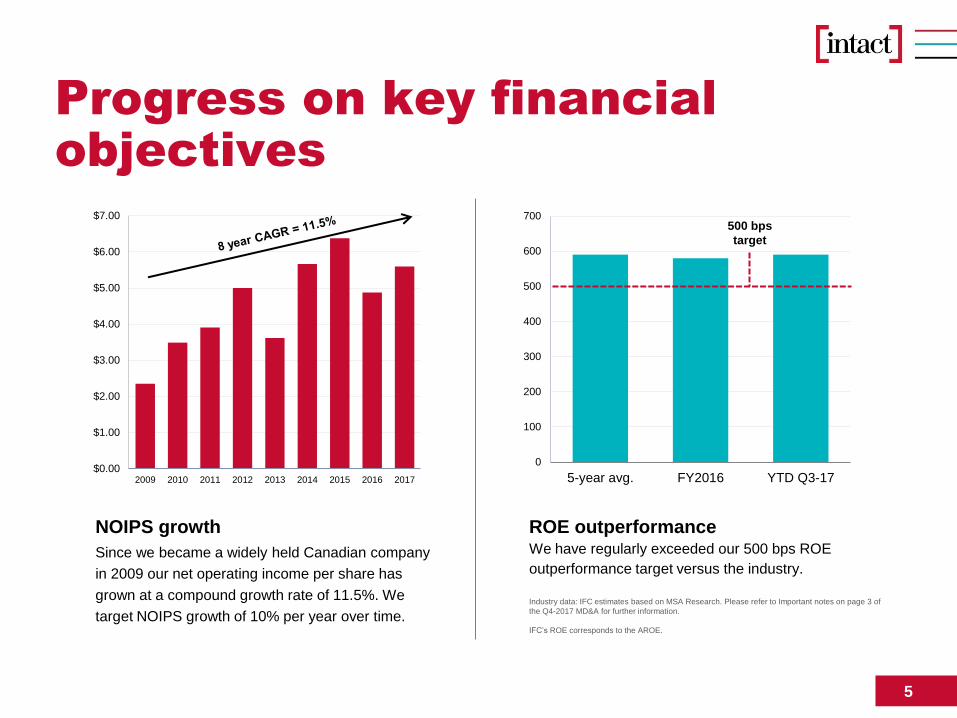
Progress on key financial
objectives
$0.00
$1.00
$2.00
$3.00
$4.00
$5.00
$6.00
$7.00
2009 2010 2011 2012 2013 2014 2015 2016 2017
Since we became a widely held Canadian company
in 2009 our net operating income per share has
grown at a compound growth rate of 11.5%. We
target NOIPS growth of 10% per year over time.
NOIPS growth We have regularly exceeded our 500 bps ROE
outperformance target versus the industry.
ROE outperformance
Industry data: IFC estimates based on MSA Research. Please refer to Important notes on page 3 of
the Q4-2017 MD&A for further information.
IFC’s ROE corresponds to the AROE.
500 bps
target
Do not put content
on the brand
signature area
Primary Colours
RGB = 198, 12, 48
RGB = 0, 179, 190
RGB = 30, 30, 30
Secondary Colours
RGB = 146, 214, 227
RGB = 39, 104, 143
RGB = 174, 39, 95
RGB = 188, 190, 192
RGB = 199, 243, 251
RGB = 201, 204, 221
RGB = 225, 203, 209
RGB = 230, 231, 232
Tertiary Colours
RGB = 163, 207, 98
RGB = 253, 185, 19
RGB = 124, 33, 72
RGB = 210, 189, 86
6
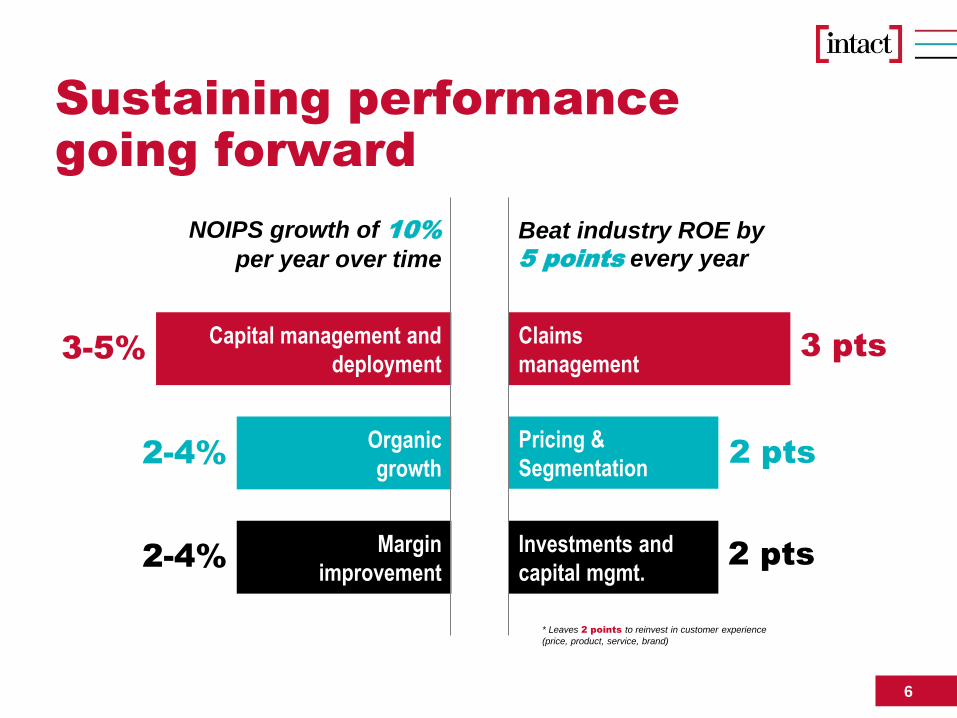
* Leaves 2 points to reinvest in customer experience
(price, product, service, brand)
Sustaining performance
going forward
Beat industry ROE by
5 points every year
NOIPS growth of 10%
per year over time
Capital management and
deployment 3-5%
Organic
growth 2-4%
Margin
improvement 2-4%
Claims
management 3 pts
Pricing &
Segmentation 2 pts
Investments and
capital mgmt. 2 pts
Do not put content
on the brand
signature area
Primary Colours
RGB = 198, 12, 48
RGB = 0, 179, 190
RGB = 30, 30, 30
Secondary Colours
RGB = 146, 214, 227
RGB = 39, 104, 143
RGB = 174, 39, 95
RGB = 188, 190, 192
RGB = 199, 243, 251
RGB = 201, 204, 221
RGB = 225, 203, 209
RGB = 230, 231, 232
Tertiary Colours
RGB = 163, 207, 98
RGB = 253, 185, 19
RGB = 124, 33, 72
RGB = 210, 189, 86
7
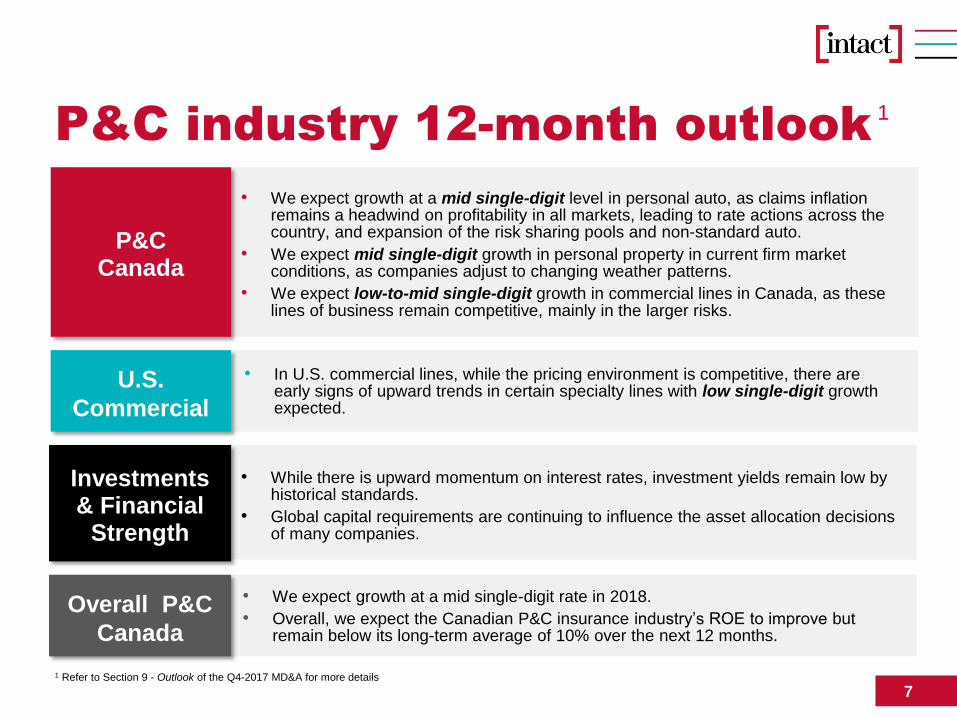
P&C industry 12-month outlook
• While there is upward momentum on interest rates, investment yields remain low by historical standards.
• Global capital requirements are continuing to influence the asset allocation decisions of many companies.
• We expect growth at a mid single-digit level in personal auto, as claims inflation remains a headwind on profitability in all markets, leading to rate actions across the country, and expansion of the risk sharing pools and non-standard auto.
• We expect mid single-digit growth in personal property in current firm market conditions, as companies adjust to changing weather patterns.
• We expect low-to-mid single-digit growth in commercial lines in Canada, as these lines of business remain competitive, mainly in the larger risks.
• We expect growth at a mid single-digit rate in 2018.
• Overall, we expect the Canadian P&C insurance industry’s ROE to improve but remain below its long-term average of 10% over the next 12 months.
P&C Canada
Overall P&C
Canada
Investments & Financial
Strength
• In U.S. commercial lines, while the pricing environment is competitive, there are early signs of upward trends in certain specialty lines with low single-digit growth expected.
U.S.
Commercial
1 Refer to Section 9 - Outlook of the Q4-2017 MD&A for more details
1
Do not put content
on the brand
signature area
Primary Colours
RGB = 198, 12, 48
RGB = 0, 179, 190
RGB = 30, 30, 30
Secondary Colours
RGB = 146, 214, 227
RGB = 39, 104, 143
RGB = 174, 39, 95
RGB = 188, 190, 192
RGB = 199, 243, 251
RGB = 201, 204, 221
RGB = 225, 203, 209
RGB = 230, 231, 232
Tertiary Colours
RGB = 163, 207, 98
RGB = 253, 185, 19
RGB = 124, 33, 72
RGB = 210, 189, 86
8
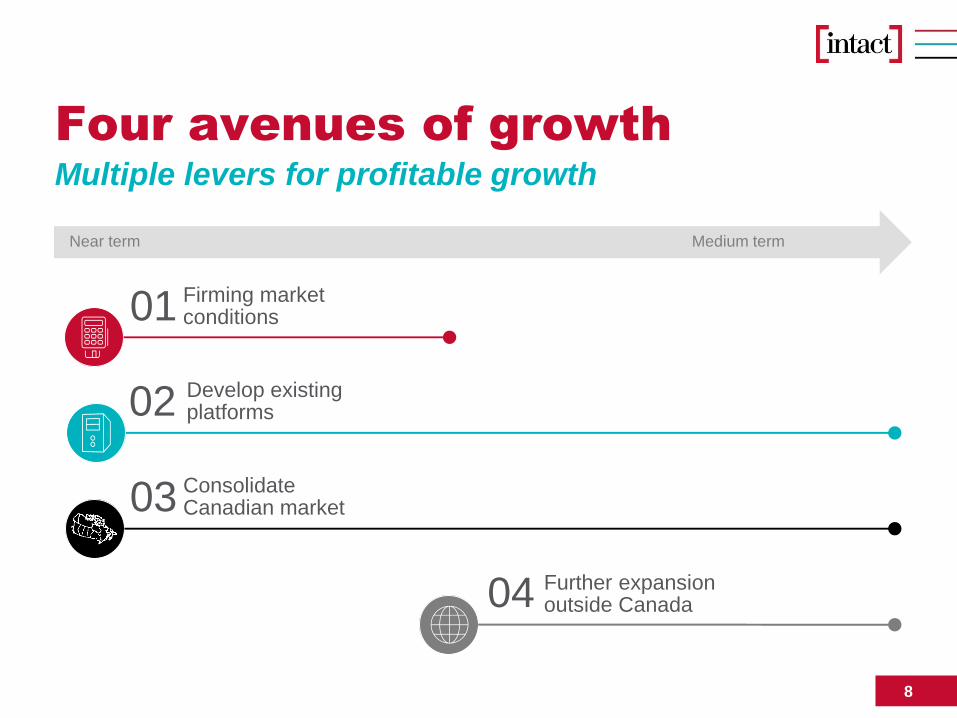
Develop existing platforms 02
Firming market conditions 01
Consolidate Canadian market 03
Four avenues of growth
Near term Medium term
Multiple levers for profitable growth
Further expansion outside Canada 04
Do not put content
on the brand
signature area
Primary Colours
RGB = 198, 12, 48
RGB = 0, 179, 190
RGB = 30, 30, 30
Secondary Colours
RGB = 146, 214, 227
RGB = 39, 104, 143
RGB = 174, 39, 95
RGB = 188, 190, 192
RGB = 199, 243, 251
RGB = 201, 204, 221
RGB = 225, 203, 209
RGB = 230, 231, 232
Tertiary Colours
RGB = 163, 207, 98
RGB = 253, 185, 19
RGB = 124, 33, 72
RGB = 210, 189, 86
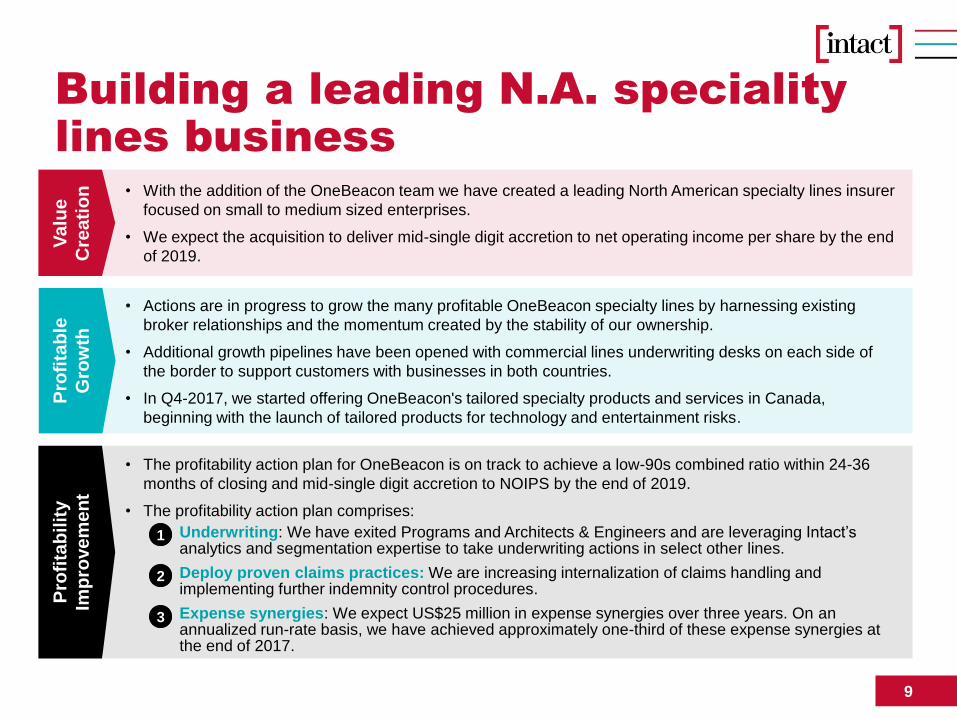
Building a leading N.A. speciality
lines business
Timeline
9
Va
lue
Cre
ati
on
Pro
fita
ble
Gro
wth
Pro
fita
bilit
y
Imp
rove
me
nt
• The profitability action plan for OneBeacon is on track to achieve a low-90s combined ratio within 24-36
months of closing and mid-single digit accretion to NOIPS by the end of 2019.
• The profitability action plan comprises:
Underwriting: We have exited Programs and Architects & Engineers and are leveraging Intact’s analytics and segmentation expertise to take underwriting actions in select other lines.
Deploy proven claims practices: We are increasing internalization of claims handling and implementing further indemnity control procedures.
Expense synergies: We expect US$25 million in expense synergies over three years. On an annualized run-rate basis, we have achieved approximately one-third of these expense synergies at the end of 2017.
• Actions are in progress to grow the many profitable OneBeacon specialty lines by harnessing existing
broker relationships and the momentum created by the stability of our ownership.
• Additional growth pipelines have been opened with commercial lines underwriting desks on each side of
the border to support customers with businesses in both countries.
• In Q4-2017, we started offering OneBeacon's tailored specialty products and services in Canada,
beginning with the launch of tailored products for technology and entertainment risks.
• With the addition of the OneBeacon team we have created a leading North American specialty lines insurer
focused on small to medium sized enterprises.
• We expect the acquisition to deliver mid-single digit accretion to net operating income per share by the end
of 2019.
1
2
3
Do not put content
on the brand
signature area
Primary Colours
RGB = 198, 12, 48
RGB = 0, 179, 190
RGB = 30, 30, 30
Secondary Colours
RGB = 146, 214, 227
RGB = 39, 104, 143
RGB = 174, 39, 95
RGB = 188, 190, 192
RGB = 199, 243, 251
RGB = 201, 204, 221
RGB = 225, 203, 209
RGB = 230, 231, 232
Tertiary Colours
RGB = 163, 207, 98
RGB = 253, 185, 19
RGB = 124, 33, 72
RGB = 210, 189, 86
10
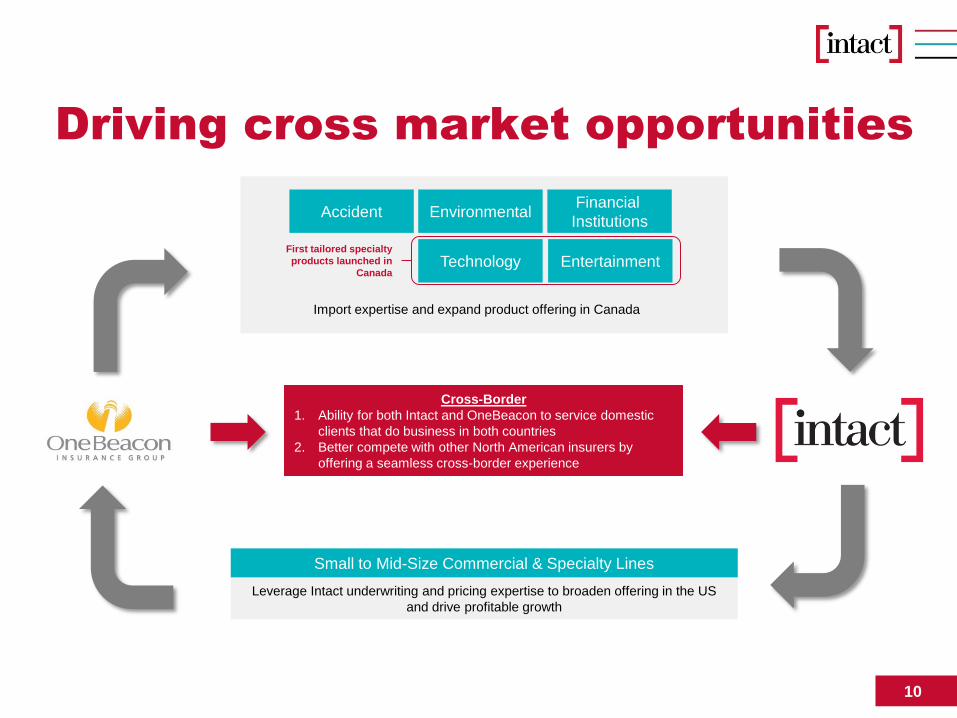
Driving cross market opportunities
Accident Environmental
Entertainment
Import expertise and expand product offering in Canada
Leverage Intact underwriting and pricing expertise to broaden offering in the US
and drive profitable growth
Financial
Institutions
Cross-Border
1. Ability for both Intact and OneBeacon to service domestic
clients that do business in both countries
2. Better compete with other North American insurers by
offering a seamless cross-border experience
Small to Mid-Size Commercial & Specialty Lines
Technology First tailored specialty
products launched in
Canada

Do not put content
on the brand
signature area
Primary Colours
RGB = 198, 12, 48
RGB = 0, 179, 190
RGB = 30, 30, 30
Secondary Colours
RGB = 146, 214, 227
RGB = 39, 104, 143
RGB = 174, 39, 95
RGB = 188, 190, 192
RGB = 199, 243, 251
RGB = 201, 204, 221
RGB = 225, 203, 209
RGB = 230, 231, 232
Tertiary Colours
RGB = 163, 207, 98
RGB = 253, 185, 19
RGB = 124, 33, 72
RGB = 210, 189, 86
11
A.M. Best DBRS Moody’s Fitch
Financial strength ratings of IFC’s principal Canadian P&C
insurance subsidiaries A+ AA (low) A1 AA-
Senior unsecured debt ratings of IFC a- A Baa1 A-
Financial strength ratings of OneBeacon U.S. regulated entities A - A2 AA-
in total capital
margin
debt-to-total
capital ratio (returning to 20% in 2019)
* All data as of December 31, 2017
1 Refer to Section 17.2 – Ratings of the Q3-2017 MD&A for additional commentary. 2 Refer to Section 24– Sensitivity analyses of the Q4-2017 MD&A for additional commentary.
Low BVPS sensitivity to capital markets volatility2
per 100 bps
increase in
interest rates
per 5% decrease
in preferred share
prices
per 10% decrease
in common share
prices
23.1%
Strong financial position
Credit ratings1
Our balance sheet is
strong
($0.40) ($1.45) ($0.35) $1.1B
Do not put content
on the brand
signature area
Primary Colours
RGB = 198, 12, 48
RGB = 0, 179, 190
RGB = 30, 30, 30
Secondary Colours
RGB = 146, 214, 227
RGB = 39, 104, 143
RGB = 174, 39, 95
RGB = 188, 190, 192
RGB = 199, 243, 251
RGB = 201, 204, 221
RGB = 225, 203, 209
RGB = 230, 231, 232
Tertiary Colours
RGB = 163, 207, 98
RGB = 253, 185, 19
RGB = 124, 33, 72
RGB = 210, 189, 86
12
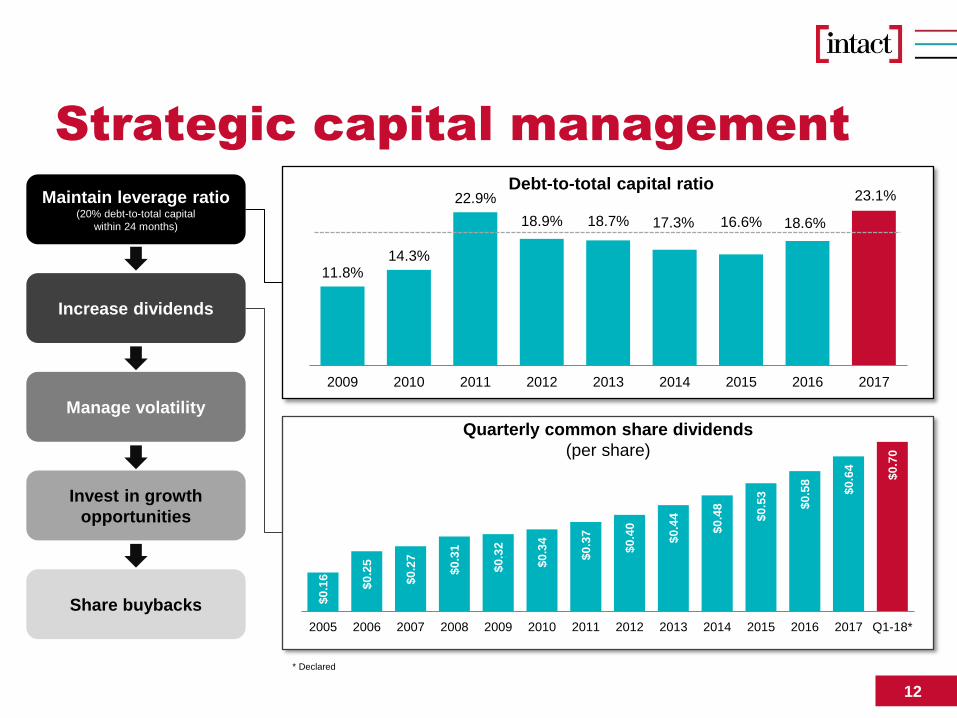
Strategic capital management
Maintain leverage ratio (20% debt-to-total capital
within 24 months)
Increase dividends
Debt-to-total capital ratio
Quarterly common share dividends
(per share)
Manage volatility
Invest in growth
opportunities
Share buybacks $0
.16
$0
.25
$0
.27
$0
.31
$0
.32
$0
.34
$0
.37
$0
.40
$0
.44
$0
.48
$0
.53
$0
.58
$0
.64
$0
.70
2005 2006 2007 2008 2009 2010 2011 2012 2013 2014 2015 2016 2017 Q1-18*
11.8% 14.3%
22.9%
18.9% 18.7% 17.3% 16.6% 18.6%
23.1%
2009 2010 2011 2012 2013 2014 2015 2016 2017
* Declared
Do not put content
on the brand
signature area
Primary Colours
RGB = 198, 12, 48
RGB = 0, 179, 190
RGB = 30, 30, 30
Secondary Colours
RGB = 146, 214, 227
RGB = 39, 104, 143
RGB = 174, 39, 95
RGB = 188, 190, 192
RGB = 199, 243, 251
RGB = 201, 204, 221
RGB = 225, 203, 209
RGB = 230, 231, 232
Tertiary Colours
RGB = 163, 207, 98
RGB = 253, 185, 19
RGB = 124, 33, 72
RGB = 210, 189, 86
13
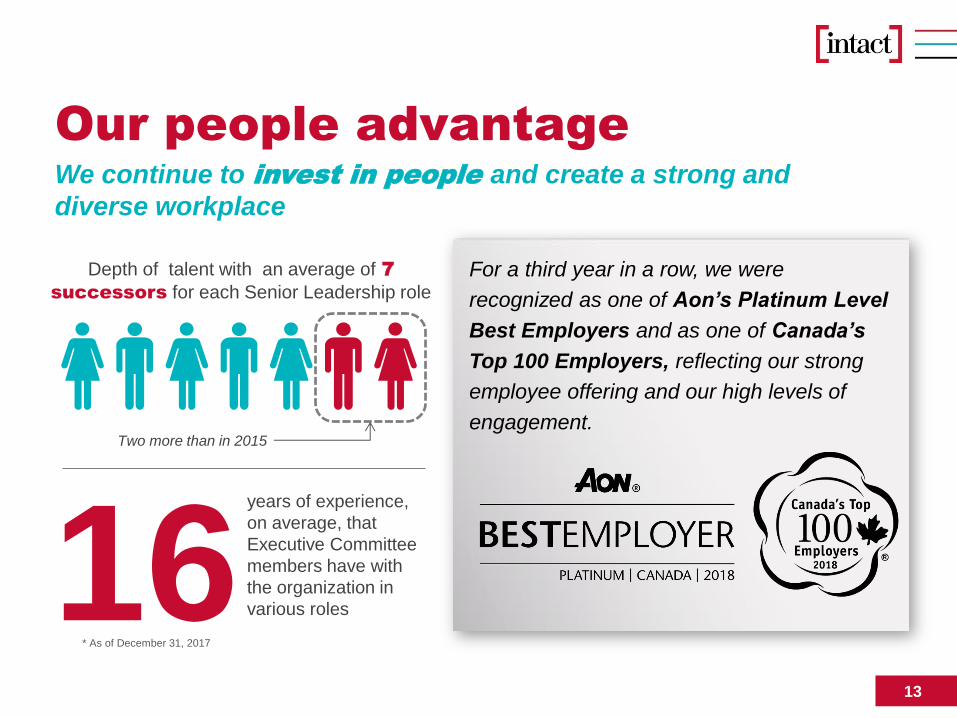
Our people advantage
We continue to invest in people and create a strong and
diverse workplace
Depth of talent with an average of 7
successors for each Senior Leadership role
Two more than in 2015
years of experience,
on average, that
Executive Committee
members have with
the organization in
various roles 16
For a third year in a row, we were
recognized as one of Aon’s Platinum Level
Best Employers and as one of Canada’s
Top 100 Employers, reflecting our strong
employee offering and our high levels of
engagement.
* As of December 31, 2017
Do not put content
on the brand
signature area
Primary Colours
RGB = 198, 12, 48
RGB = 0, 179, 190
RGB = 30, 30, 30
Secondary Colours
RGB = 146, 214, 227
RGB = 39, 104, 143
RGB = 174, 39, 95
RGB = 188, 190, 192
RGB = 199, 243, 251
RGB = 201, 204, 221
RGB = 225, 203, 209
RGB = 230, 231, 232
Tertiary Colours
RGB = 163, 207, 98
RGB = 253, 185, 19
RGB = 124, 33, 72
RGB = 210, 189, 86
14
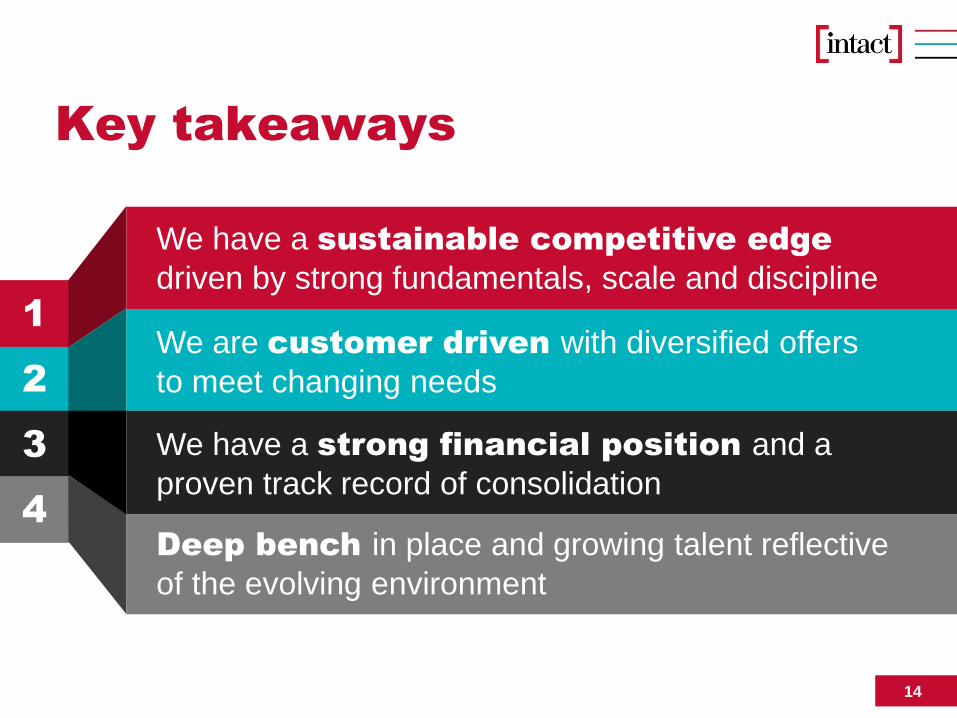
Key takeaways
2
3
4
1
14
Deep bench in place and growing talent reflective
of the evolving environment
We have a strong financial position and a
proven track record of consolidation
We have a sustainable competitive edge
driven by strong fundamentals, scale and discipline
We are customer driven with diversified offers
to meet changing needs

Do not put content
on the brand
signature area
Primary Colours
RGB = 198, 12, 48
RGB = 0, 179, 190
RGB = 30, 30, 30
Secondary Colours
RGB = 146, 214, 227
RGB = 39, 104, 143
RGB = 174, 39, 95
RGB = 188, 190, 192
RGB = 199, 243, 251
RGB = 201, 204, 221
RGB = 225, 203, 209
RGB = 230, 231, 232
Tertiary Colours
RGB = 163, 207, 98
RGB = 253, 185, 19
RGB = 124, 33, 72
RGB = 210, 189, 86
Appendices
Do not put content
on the brand
signature area
Primary Colours
RGB = 198, 12, 48
RGB = 0, 179, 190
RGB = 30, 30, 30
Secondary Colours
RGB = 146, 214, 227
RGB = 39, 104, 143
RGB = 174, 39, 95
RGB = 188, 190, 192
RGB = 199, 243, 251
RGB = 201, 204, 221
RGB = 225, 203, 209
RGB = 230, 231, 232
Tertiary Colours
RGB = 163, 207, 98
RGB = 253, 185, 19
RGB = 124, 33, 72
RGB = 210, 189, 86
16
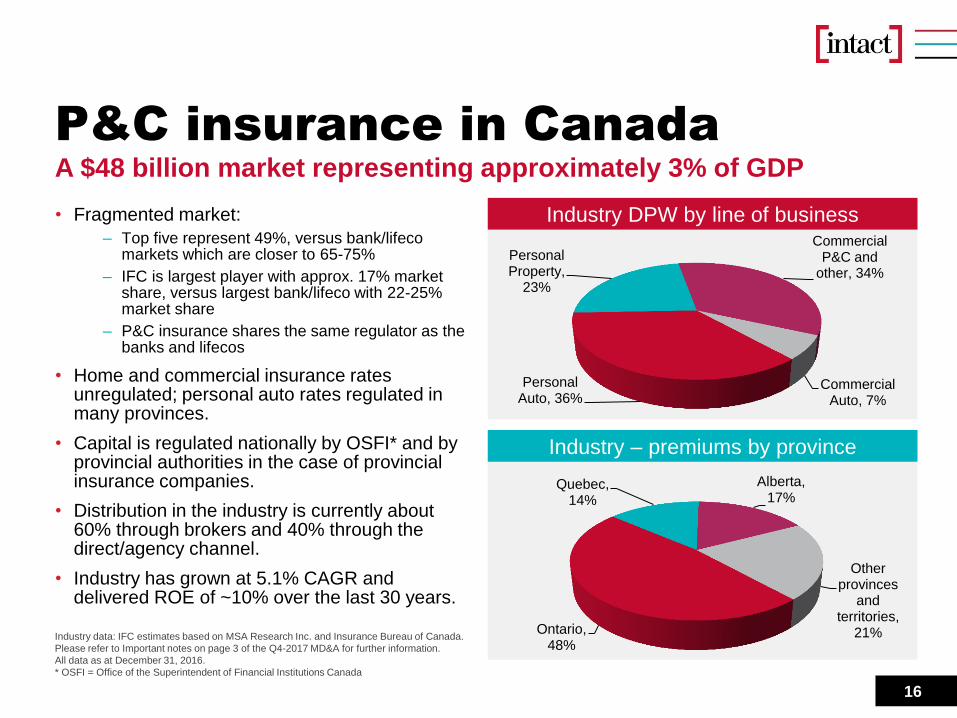
P&C insurance in Canada
A $48 billion market representing approximately 3% of GDP
Industry DPW by line of business
Industry – premiums by province
• Fragmented market:
– Top five represent 49%, versus bank/lifeco markets which are closer to 65-75%
– IFC is largest player with approx. 17% market share, versus largest bank/lifeco with 22-25% market share
– P&C insurance shares the same regulator as the banks and lifecos
• Home and commercial insurance rates unregulated; personal auto rates regulated in many provinces.
• Capital is regulated nationally by OSFI* and by provincial authorities in the case of provincial insurance companies.
• Distribution in the industry is currently about 60% through brokers and 40% through the direct/agency channel.
• Industry has grown at 5.1% CAGR and delivered ROE of ~10% over the last 30 years.
Industry data: IFC estimates based on MSA Research Inc. and Insurance Bureau of Canada.
Please refer to Important notes on page 3 of the Q4-2017 MD&A for further information.
All data as at December 31, 2016.
* OSFI = Office of the Superintendent of Financial Institutions Canada
Personal Auto, 36%
Personal Property,
23%
Commercial P&C and
other, 34%
Commercial Auto, 7%
Ontario, 48%
Quebec, 14%
Alberta, 17%
Other provinces
and territories,
21%
Do not put content
on the brand
signature area
Primary Colours
RGB = 198, 12, 48
RGB = 0, 179, 190
RGB = 30, 30, 30
Secondary Colours
RGB = 146, 214, 227
RGB = 39, 104, 143
RGB = 174, 39, 95
RGB = 188, 190, 192
RGB = 199, 243, 251
RGB = 201, 204, 221
RGB = 225, 203, 209
RGB = 230, 231, 232
Tertiary Colours
RGB = 163, 207, 98
RGB = 253, 185, 19
RGB = 124, 33, 72
RGB = 210, 189, 86
17
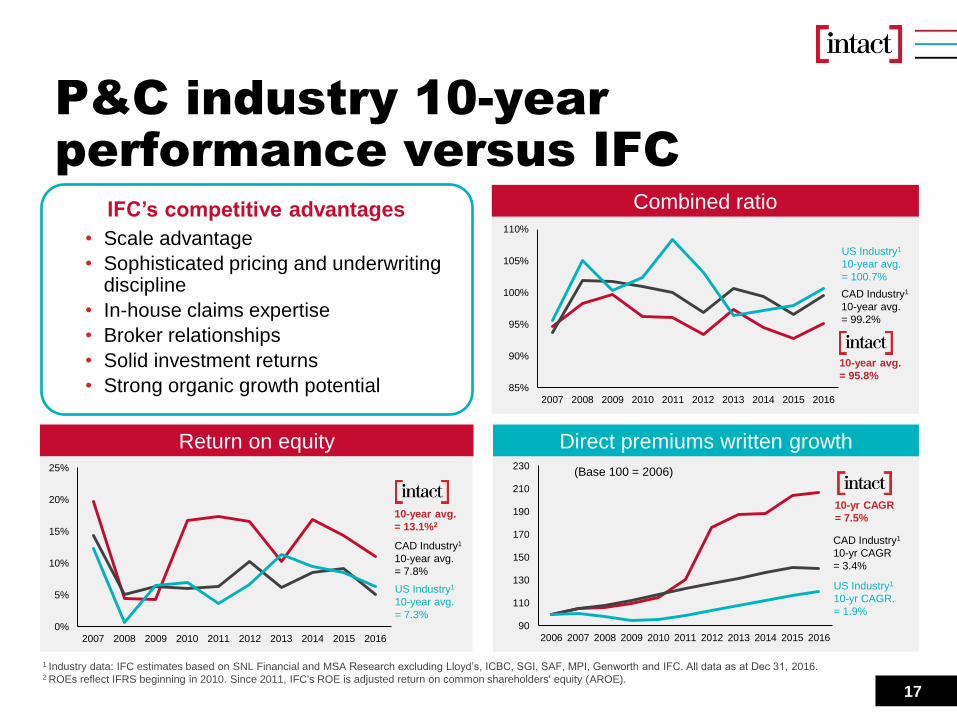
P&C industry 10-year
performance versus IFC
Return on equity Direct premiums written growth
Combined ratio IFC’s competitive advantages
• Scale advantage
• Sophisticated pricing and underwriting discipline
• In-house claims expertise
• Broker relationships
• Solid investment returns
• Strong organic growth potential
CAD Industry1
10-year avg.
= 7.8%
10-year avg.
= 13.1%2
CAD Industry1
10-year avg.
= 99.2%
10-year avg.
= 95.8%
10-yr CAGR
= 7.5%
CAD Industry1
10-yr CAGR
= 3.4%
(Base 100 = 2006)
90
110
130
150
170
190
210
230
2006 2007 2008 2009 2010 2011 2012 2013 2014 2015 20160%
5%
10%
15%
20%
25%
2007 2008 2009 2010 2011 2012 2013 2014 2015 2016
85%
90%
95%
100%
105%
110%
2007 2008 2009 2010 2011 2012 2013 2014 2015 2016
1 Industry data: IFC estimates based on SNL Financial and MSA Research excluding Lloyd’s, ICBC, SGI, SAF, MPI, Genworth and IFC. All data as at Dec 31, 2016. 2 ROEs reflect IFRS beginning in 2010. Since 2011, IFC's ROE is adjusted return on common shareholders' equity (AROE).
US Industry1
10-year avg.
= 7.3%
US Industry1
10-year avg.
= 100.7%
US Industry1
10-yr CAGR.
= 1.9%

Do not put content
on the brand
signature area
Primary Colours
RGB = 198, 12, 48
RGB = 0, 179, 190
RGB = 30, 30, 30
Secondary Colours
RGB = 146, 214, 227
RGB = 39, 104, 143
RGB = 174, 39, 95
RGB = 188, 190, 192
RGB = 199, 243, 251
RGB = 201, 204, 221
RGB = 225, 203, 209
RGB = 230, 231, 232
Tertiary Colours
RGB = 163, 207, 98
RGB = 253, 185, 19
RGB = 124, 33, 72
RGB = 210, 189, 86
18
Improved business mix with
OneBeacon
• Provides a more balanced portfolio by line of business
• Expands presence in attractive Specialty Lines sector
• Adds meaningful geographic diversification providing access to a new market for future growth
85%
15%
2016 DPW by LOB 2017 DPW (pro forma) by LOB 2017 DPW (pro forma) by
business segment
+ +
NOTE: DPW (pro forma) for 2017 are comprised of the DPW of P&C Canada and the DPW (pro forma) of P&C U.S., using an exchange rate of 1.30.
Personal Auto 44%
Personal Property
24%
Specialty 8%
Commercial
24%
Personal Auto 39%
Personal Property
21%
Commercial
Lines
Canada
25%
Commercial
Lines U.S.
15%
=
Do not put content
on the brand
signature area
Primary Colours
RGB = 198, 12, 48
RGB = 0, 179, 190
RGB = 30, 30, 30
Secondary Colours
RGB = 146, 214, 227
RGB = 39, 104, 143
RGB = 174, 39, 95
RGB = 188, 190, 192
RGB = 199, 243, 251
RGB = 201, 204, 221
RGB = 225, 203, 209
RGB = 230, 231, 232
Tertiary Colours
RGB = 163, 207, 98
RGB = 253, 185, 19
RGB = 124, 33, 72
RGB = 210, 189, 86
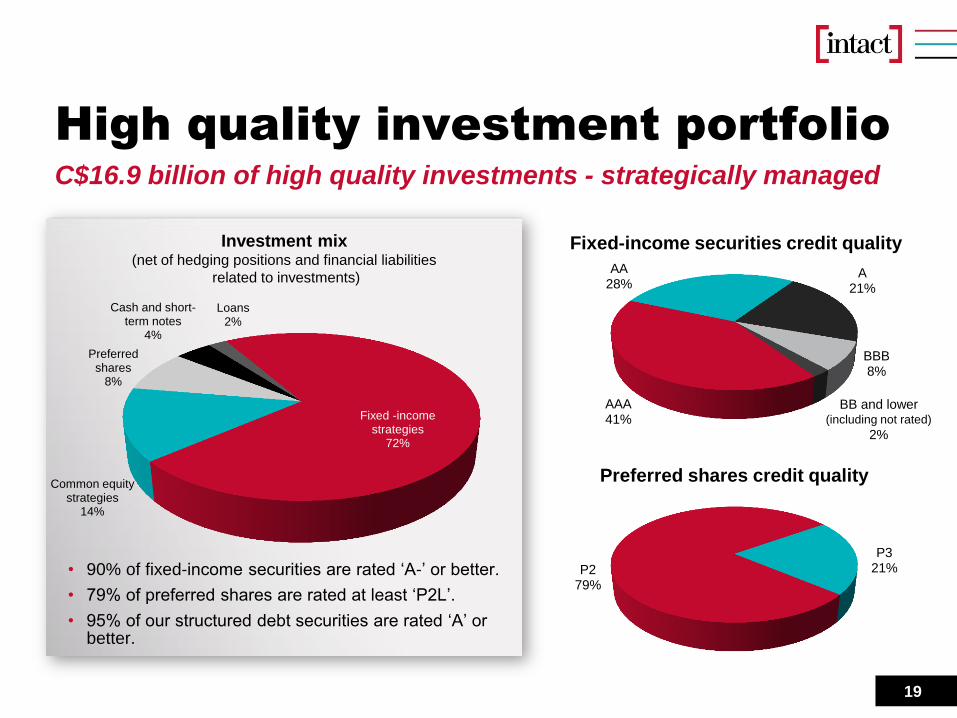
19
High quality investment portfolio
Fixed-income securities credit quality
C$16.9 billion of high quality investments - strategically managed
P2 79%
P3 21%
Preferred shares credit quality
AAA 41%
AA 28%
A 21%
BBB 8%
BB and lower (including not rated)
2%
• 90% of fixed-income securities are rated ‘A-’ or better.
• 79% of preferred shares are rated at least ‘P2L’.
• 95% of our structured debt securities are rated ‘A’ or better.
Investment mix (net of hedging positions and financial liabilities
related to investments)
Fixed -income strategies
72%
Common equity strategies
14%
Preferred shares
8%
Cash and short-term notes
4%
Loans 2%
Do not put content
on the brand
signature area
Primary Colours
RGB = 198, 12, 48
RGB = 0, 179, 190
RGB = 30, 30, 30
Secondary Colours
RGB = 146, 214, 227
RGB = 39, 104, 143
RGB = 174, 39, 95
RGB = 188, 190, 192
RGB = 199, 243, 251
RGB = 201, 204, 221
RGB = 225, 203, 209
RGB = 230, 231, 232
Tertiary Colours
RGB = 163, 207, 98
RGB = 253, 185, 19
RGB = 124, 33, 72
RGB = 210, 189, 86
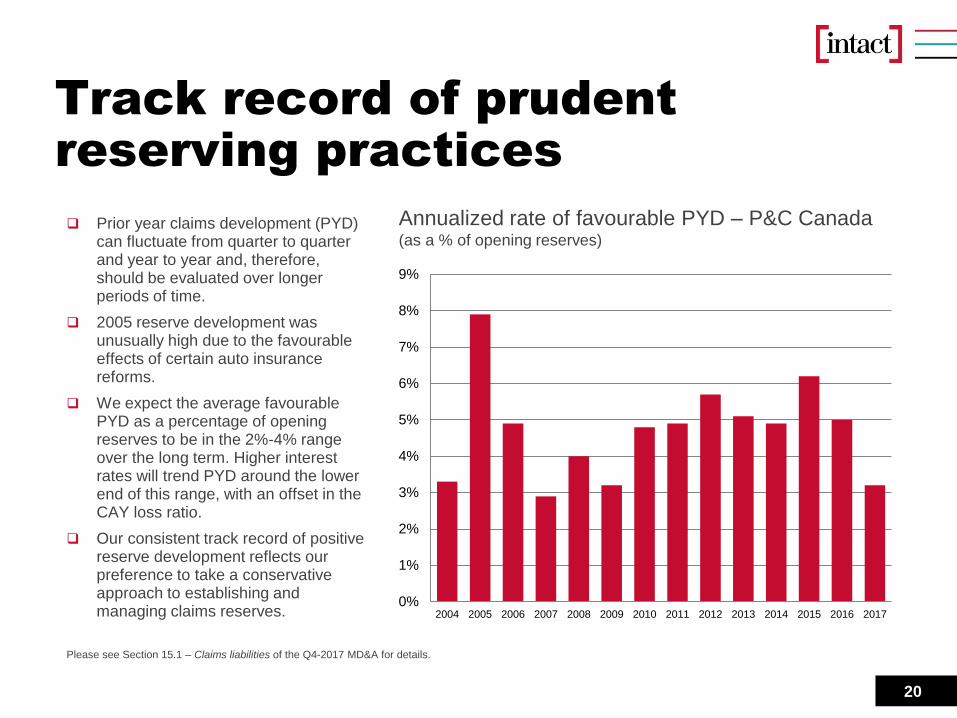
20
Track record of prudent
reserving practices
Prior year claims development (PYD) can fluctuate from quarter to quarter and year to year and, therefore, should be evaluated over longer periods of time.
2005 reserve development was unusually high due to the favourable effects of certain auto insurance reforms.
We expect the average favourable PYD as a percentage of opening reserves to be in the 2%-4% range over the long term. Higher interest rates will trend PYD around the lower end of this range, with an offset in the CAY loss ratio.
Our consistent track record of positive reserve development reflects our preference to take a conservative approach to establishing and managing claims reserves.
Annualized rate of favourable PYD – P&C Canada (as a % of opening reserves)
0%
1%
2%
3%
4%
5%
6%
7%
8%
9%
2004 2005 2006 2007 2008 2009 2010 2011 2012 2013 2014 2015 2016 2017
Please see Section 15.1 – Claims liabilities of the Q4-2017 MD&A for details.
Do not put content
on the brand
signature area
Primary Colours
RGB = 198, 12, 48
RGB = 0, 179, 190
RGB = 30, 30, 30
Secondary Colours
RGB = 146, 214, 227
RGB = 39, 104, 143
RGB = 174, 39, 95
RGB = 188, 190, 192
RGB = 199, 243, 251
RGB = 201, 204, 221
RGB = 225, 203, 209
RGB = 230, 231, 232
Tertiary Colours
RGB = 163, 207, 98
RGB = 253, 185, 19
RGB = 124, 33, 72
RGB = 210, 189, 86
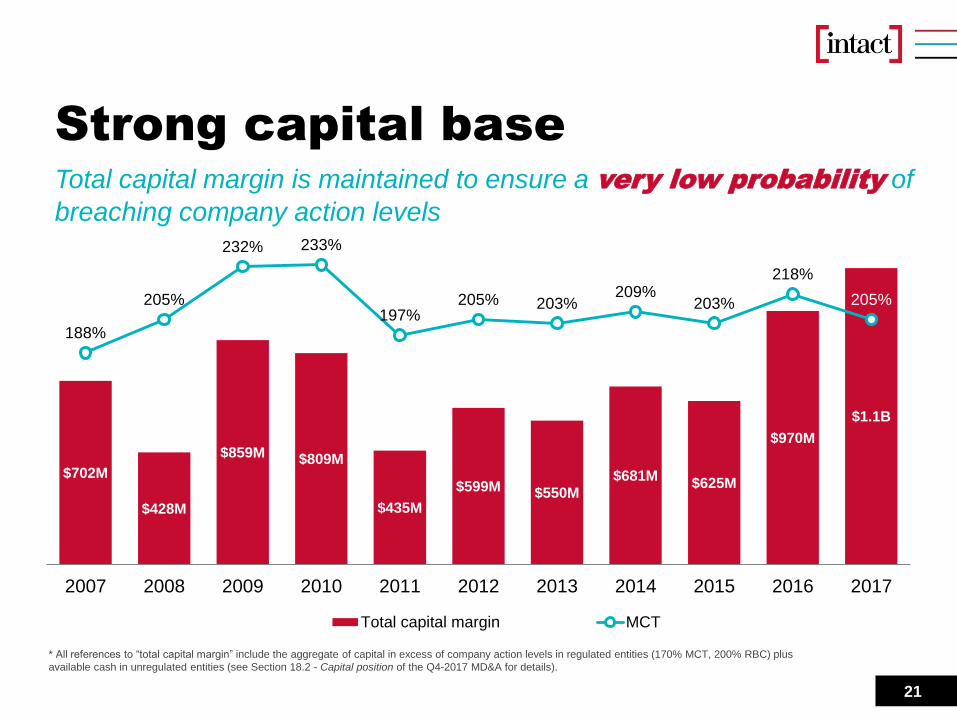
$702M
$428M
$859M $809M
$435M
$599M $550M $681M
$625M
$970M
$1.1B
188%
205%
232% 233%
197% 205% 203%
209% 203%
218%
205%
80%0
200
400
600
800
1000
1200
2007 2008 2009 2010 2011 2012 2013 2014 2015 2016 2017
Total capital margin MCT
21
Strong capital base
* All references to “total capital margin” include the aggregate of capital in excess of company action levels in regulated entities (170% MCT, 200% RBC) plus
available cash in unregulated entities (see Section 18.2 - Capital position of the Q4-2017 MD&A for details).
Total capital margin is maintained to ensure a very low probability of
breaching company action levels
Do not put content
on the brand
signature area
Primary Colours
RGB = 198, 12, 48
RGB = 0, 179, 190
RGB = 30, 30, 30
Secondary Colours
RGB = 146, 214, 227
RGB = 39, 104, 143
RGB = 174, 39, 95
RGB = 188, 190, 192
RGB = 199, 243, 251
RGB = 201, 204, 221
RGB = 225, 203, 209
RGB = 230, 231, 232
Tertiary Colours
RGB = 163, 207, 98
RGB = 253, 185, 19
RGB = 124, 33, 72
RGB = 210, 189, 86
22
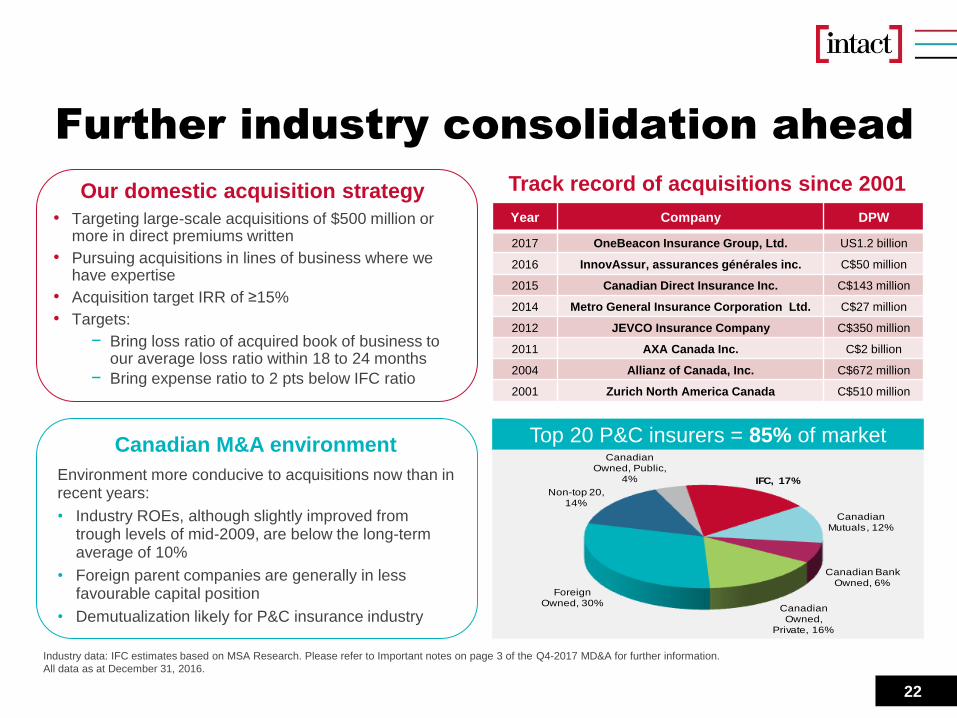
Further industry consolidation ahead
Our domestic acquisition strategy
• Targeting large-scale acquisitions of $500 million or more in direct premiums written
• Pursuing acquisitions in lines of business where we have expertise
• Acquisition target IRR of ≥15%
• Targets:
− Bring loss ratio of acquired book of business to our average loss ratio within 18 to 24 months
− Bring expense ratio to 2 pts below IFC ratio
Track record of acquisitions since 2001
Canadian M&A environment
Environment more conducive to acquisitions now than in recent years:
• Industry ROEs, although slightly improved from trough levels of mid-2009, are below the long-term average of 10%
• Foreign parent companies are generally in less favourable capital position
• Demutualization likely for P&C insurance industry Canadian Owned,
Private, 16%
Foreign Owned, 30%
Non-top 20, 14%
Canadian Owned, Public,
4% IFC, 17%
Canadian Mutuals, 12%
Canadian Bank Owned, 6%
Top 20 P&C insurers = 85% of market
Industry data: IFC estimates based on MSA Research. Please refer to Important notes on page 3 of the Q4-2017 MD&A for further information.
All data as at December 31, 2016.
Year Company DPW
2017 OneBeacon Insurance Group, Ltd. US1.2 billion
2016 InnovAssur, assurances générales inc. C$50 million
2015 Canadian Direct Insurance Inc. C$143 million
2014 Metro General Insurance Corporation Ltd. C$27 million
2012 JEVCO Insurance Company C$350 million
2011 AXA Canada Inc. C$2 billion
2004 Allianz of Canada, Inc. C$672 million
2001 Zurich North America Canada C$510 million
Do not put content
on the brand
signature area
Primary Colours
RGB = 198, 12, 48
RGB = 0, 179, 190
RGB = 30, 30, 30
Secondary Colours
RGB = 146, 214, 227
RGB = 39, 104, 143
RGB = 174, 39, 95
RGB = 188, 190, 192
RGB = 199, 243, 251
RGB = 201, 204, 221
RGB = 225, 203, 209
RGB = 230, 231, 232
Tertiary Colours
RGB = 163, 207, 98
RGB = 253, 185, 19
RGB = 124, 33, 72
RGB = 210, 189, 86
23
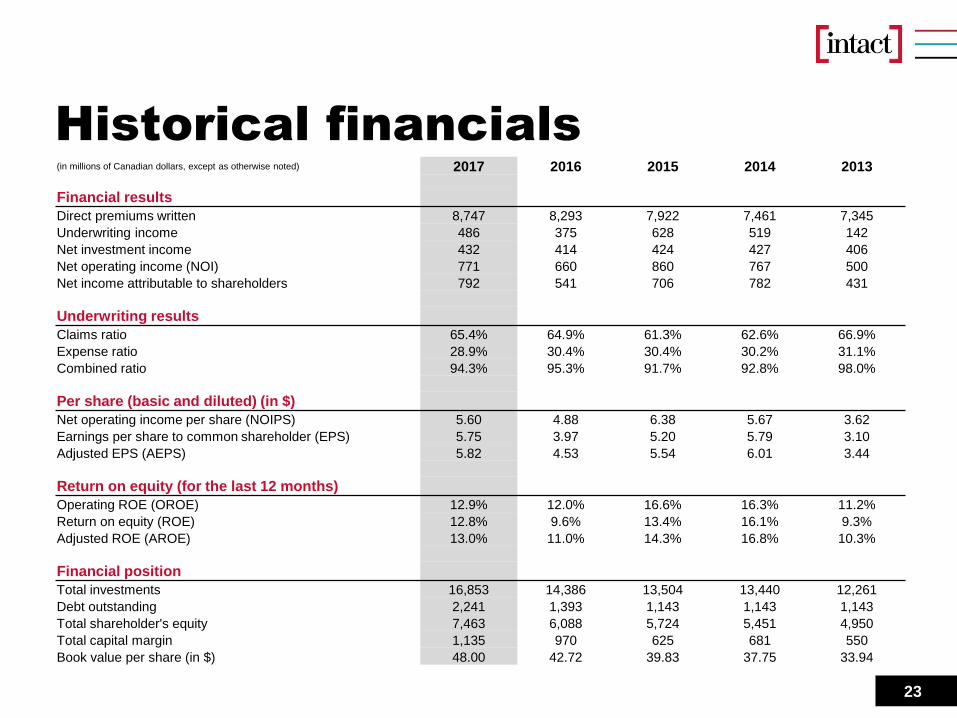
Historical financials (in millions of Canadian dollars, except as otherwise noted) 2017 2016 2015 2014 2013
Financial results
Direct premiums written 8,747 8,293 7,922 7,461 7,345
Underwriting income 486 375 628 519 142
Net investment income 432 414 424 427 406
Net operating income (NOI) 771 660 860 767 500
Net income attributable to shareholders 792 541 706 782 431
Underwriting results
Claims ratio 65.4% 64.9% 61.3% 62.6% 66.9%
Expense ratio 28.9% 30.4% 30.4% 30.2% 31.1%
Combined ratio 94.3% 95.3% 91.7% 92.8% 98.0%
Per share (basic and diluted) (in $)
Net operating income per share (NOIPS) 5.60 4.88 6.38 5.67 3.62
Earnings per share to common shareholder (EPS) 5.75 3.97 5.20 5.79 3.10
Adjusted EPS (AEPS) 5.82 4.53 5.54 6.01 3.44
Return on equity (for the last 12 months)
Operating ROE (OROE) 12.9% 12.0% 16.6% 16.3% 11.2%
Return on equity (ROE) 12.8% 9.6% 13.4% 16.1% 9.3%
Adjusted ROE (AROE) 13.0% 11.0% 14.3% 16.8% 10.3%
Financial position
Total investments 16,853 14,386 13,504 13,440 12,261
Debt outstanding 2,241 1,393 1,143 1,143 1,143
Total shareholder's equity 7,463 6,088 5,724 5,451 4,950
Total capital margin 1,135 970 625 681 550
Book value per share (in $) 48.00 42.72 39.83 37.75 33.94

Do not put content
on the brand
signature area
Primary Colours
RGB = 198, 12, 48
RGB = 0, 179, 190
RGB = 30, 30, 30
Secondary Colours
RGB = 146, 214, 227
RGB = 39, 104, 143
RGB = 174, 39, 95
RGB = 188, 190, 192
RGB = 199, 243, 251
RGB = 201, 204, 221
RGB = 225, 203, 209
RGB = 230, 231, 232
Tertiary Colours
RGB = 163, 207, 98
RGB = 253, 185, 19
RGB = 124, 33, 72
RGB = 210, 189, 86
March
Su M Tu W Th F Sa
1 2 3
4 5 6 7 8 9 10
11 12 13 14 15 16 17
18 19 20 21 22 23 24
25 26 27 28 29 30 31
24
Upcoming events
May
Su M Tu W Th F Sa
1 2 3 4 5
6 7 8 9 10 11 12
13 14 15 16 17 18 19
20 21 22 23 24 25 26
27 28 29 30 31
Monday, March 26th
2018 Investor Day
Wednesday, May 9th
Q1-2018 Earnings
Call & AGM
Do not put content
on the brand
signature area
Primary Colours
RGB = 198, 12, 48
RGB = 0, 179, 190
RGB = 30, 30, 30
Secondary Colours
RGB = 146, 214, 227
RGB = 39, 104, 143
RGB = 174, 39, 95
RGB = 188, 190, 192
RGB = 199, 243, 251
RGB = 201, 204, 221
RGB = 225, 203, 209
RGB = 230, 231, 232
Tertiary Colours
RGB = 163, 207, 98
RGB = 253, 185, 19
RGB = 124, 33, 72
RGB = 210, 189, 86
25
Contact us
Media Inquiries
Stephanie Sorensen
Director, External Communications
1 (416) 344-8027
General Inquiries
Intact Financial Corporation
700 University Avenue
Toronto, ON M5G 0A1
1 (416) 341-1464
1-877-341-1464 (toll-free in N.A.)
Investor Inquiries
1 (416) 941-5336
1-866-778-0774 (toll-free in N.A.)
Ken Anderson
VP Investor Relations & Treasurer
1 (855) 646-8228 ext. 87383
Neil Seneviratne
Director, Investor Relations
1 (416) 341-1464 ext. 45156
Do not put content
on the brand
signature area
Primary Colours
RGB = 198, 12, 48
RGB = 0, 179, 190
RGB = 30, 30, 30
Secondary Colours
RGB = 146, 214, 227
RGB = 39, 104, 143
RGB = 174, 39, 95
RGB = 188, 190, 192
RGB = 199, 243, 251
RGB = 201, 204, 221
RGB = 225, 203, 209
RGB = 230, 231, 232
Tertiary Colours
RGB = 163, 207, 98
RGB = 253, 185, 19
RGB = 124, 33, 72
RGB = 210, 189, 86
26
Forward-looking statements
Certain of the statements included in this presentation about the Company’s current and future plans, expectations and intentions, results, levels of activity, performance, goals or
achievements or any other future events or developments constitute forward-looking statements. The words “may”, “will”, “would”, “should”, “could”, “expects”, “plans”, “intends”,
“trends”, “indications”, “anticipates”, “believes”, “estimates”, “predicts”, “likely”, “potential” or the negative or other variations of these words or other similar or comparable words or
phrases, are intended to identify forward-looking statements. This presentation contains forward-looking statements with respect to the acquisition (the “Acquisition”) of OneBeacon
Insurance Group, Ltd. (“OneBeacon”) and the integration and future plans relating to the Acquisition.
Forward-looking statements are based on estimates and assumptions made by management based on management’s experience and perception of historical trends, current
conditions and expected future developments, as well as other factors that management believes are appropriate in the circumstances. Many factors could cause the Company’s
actual results, performance or achievements or future events or developments to differ materially from those expressed or implied by the forward-looking statements, including,
without limitation, the following factors: the Company’s ability to implement its strategy or operate its business as management currently expects; its ability to accurately assess the
risks associated with the insurance policies that the Company writes; unfavourable capital market developments or other factors which may affect the Company’s investments,
floating rate securities and funding obligations under its pension plans; the cyclical nature of the P&C insurance industry; management’s ability to accurately predict future claims
frequency and severity, including in the Ontario personal auto line of business, as well as the evaluation of losses relating to the Fort McMurray wildfires, catastrophe losses caused
by severe weather and other weather-related losses; government regulations designed to protect policyholders and creditors rather than investors; litigation and regulatory actions;
periodic negative publicity regarding the insurance industry; intense competition; the Company’s reliance on brokers and third parties to sell its products to clients and provide
services to the Company; the Company’s ability to successfully pursue its acquisition strategy; the Company’s ability to execute its business strategy; the Company’s ability to
achieve synergies arising from successful integration plans relating to acquisitions; economic, financial, business and political conditions, as well as their resulting effect on
management's estimates and expectations in relation to accretion, equity IRR, net operating income per share, MCT, combined and debt-to-total capital ratio and the other metrics
used in relation to the Acquisition; the terms and conditions of the Acquisition; the Company’s participation in the Facility Association (a mandatory pooling arrangement among all
industry participants) and similar mandated risk-sharing pools; terrorist attacks and ensuing events; the occurrence and frequency of catastrophe events, including a major
earthquake; the Company’s ability to maintain its financial strength and issuer credit ratings; the Company’s access to debt and equity financing; the Company's ability to compete for
large commercial business; the Company’s ability to alleviate risk through reinsurance; the Company’s ability to successfully manage credit risk (including credit risk related to the
financial health of reinsurers); the Company’s ability to contain fraud and/or abuse; the Company’s reliance on information technology and telecommunications systems and potential
failure of or disruption to those systems, including evolving cyber-attack risk; the impact of developments in technology on the Company’s products and distribution; the Company’s
dependence on and ability to retain key employees; changes in laws or regulations; the exercise of the over-allotment option in connection with the Offering; general economic,
financial and political conditions; the Company’s dependence on the results of operations of its subsidiaries and the ability of the Company’s subsidiaries to pay dividends; the
volatility of the stock market and other factors affecting the trading prices of the Company’s securities; the Company’s ability to hedge exposures to fluctuations in foreign exchange
rates; future sales of a substantial number of its common shares; changes in applicable tax laws, tax treaties or tax regulations or the interpretation or enforcement thereof.
All of the forward-looking statements included in this presentation are qualified by these cautionary statements and those made in the section entitled Risk management (Sections
19-24) of our MD&A for the year ended December 31, 2017. These factors are not intended to represent a complete list of the factors that could affect the Company. These factors
should, however, be considered carefully. Although the forward-looking statements are based upon what management believes to be reasonable assumptions, the Company cannot
assure investors that actual results will be consistent with these forward-looking statements. When relying on forward-looking statements to make decisions, investors should ensure
the preceding information is carefully considered. Undue reliance should not be placed on forward-looking statements made herein. The Company and management have no
intention and undertake no obligation to update or revise any forward-looking statements, whether as a result of new information, future events or otherwise, except as required by
law.
Do not put content
on the brand
signature area
Primary Colours
RGB = 198, 12, 48
RGB = 0, 179, 190
RGB = 30, 30, 30
Secondary Colours
RGB = 146, 214, 227
RGB = 39, 104, 143
RGB = 174, 39, 95
RGB = 188, 190, 192
RGB = 199, 243, 251
RGB = 201, 204, 221
RGB = 225, 203, 209
RGB = 230, 231, 232
Tertiary Colours
RGB = 163, 207, 98
RGB = 253, 185, 19
RGB = 124, 33, 72
RGB = 210, 189, 86
27
Disclaimer
This Presentation does not constitute or form part of any offer for sale or solicitation of any offer to buy or subscribe for any securities nor shall it or any part of
it form the basis of or be relied on in connection with, or act as any inducement to enter into, any contract or commitment whatsoever.
The information contained in this Presentation concerning the Company does not purport to be all-inclusive or to contain all the information that a prospective
purchaser or investor may desire to have in evaluating whether or not to make an investment in the Company. The information is qualified entirely by
reference to the Company’s publicly disclosed information.
No representation or warranty, express or implied, is made or given by or on behalf of the Company or any of its the directors, officers or employees as to the
accuracy, completeness or fairness of the information or opinions contained in this Presentation and no responsibility or liability is accepted by any person for
such information or opinions. In furnishing this Presentation, the Company does not undertake or agree to any obligation to provide the attendees with access
to any additional information or to update this Presentation or to correct any inaccuracies in, or omissions from, this Presentation that may become apparent.
The information and opinions contained in this Presentation are provided as at the date of this Presentation. The contents of this Presentation are not to be
construed as legal, financial or tax advice. Each prospective purchaser should contact his, her or its own legal adviser, independent financial adviser or tax
adviser for legal, financial or tax advice.
The Company uses both International Financial Reporting Standards (“IFRS”) and certain non-IFRS measures to assess performance. Non-IFRS measures
do not have any standardized meaning prescribed by IFRS and are unlikely to be comparable to any similar measures presented by other companies.
Management analyzes performance based on underwriting ratios such as combined, expense, loss and claims ratios, MCT, RBC and debt-to-total capital, as
well as other non-IFRS financial measures, namely DPW, Underlying current year loss ratio, Underwriting expenses, NOI, NOIPS, OROE, ROE, AROE, Non-
operating results, AEPS, Total capital margin, Cash flow available for investment activities, and Market-based yield. These measures and other insurance
related terms are defined in the Company’s glossary available on the Intact Financial Corporation web site at www.intactfc.com in the “Investors” section.
Additional information about the Company, including the Annual Information Form, may be found online on SEDAR at www.sedar.com.