Embed Size (px)
Citation preview

S+BI ANNUAL REPORT 2016 27
BUSINESS ENVIRONMENT AND STRATEGY 28
CAPITAL MARKET 36
BUSINESS DEVELOPMENT OF THE GROUP 42
BUSINESS DEVELOPMENT OF THE DIVISIONS 48
FINANCIAL POSITION AND NET ASSETS 50
NON-FINANCIAL PERFORMANCE INDICATORS 55
OPPORTUNITIES AND RISKS 60
OUTLOOK 66
Management report
MA
NA
GE
ME
NT
RE
PO
RT

MANAGEMENT REPORT BUSINESS ENVIRONMENT AND STRATEGY28
BUSINESS ENVIRONMENT AND STRATEGY
S + BI is one of the world’s leading providers
of customised solutions in the special long steel business. With around
8 900 employees at its own production and distribution companies
in over 30 countries across five continents, we support and supply
our customers around the globe. Besides, we offer our customers a
unique product portfolio. Our customers benefit from the Company’s
technological expertise, excellent knowledge of end use requirements,
consistent high quality and in-depth knowledge of local markets.
Special long steel – a niche market with complex customer requirements
S+Bi operates in the niche market for special long steel, i.e., long steel with
specific properties, resulting from the chemical composition of the steel, a defined crystalline struc-
ture (achieved through heat treatment), or a combination of the two. Special long steel accounts for
around 8% of total steel production worldwide. It differs significantly in a number of respects from
the rest of the steel market, which tends to have standard grades and flat products. The products
can be tailored to customers’ exact needs and specific application properties, enabling consider-
able product differentiation.
The production of tailored products calls for extensive expertise in the individual application indus-
tries. We often work closely with our customers at the development stage, which results in a high
degree of loyalty to us as a partner. Substitution pressure is less severe than for other materials as
special steel solutions combine a number of properties for a given application. Megatrends such
as population growth, urbanisation and increased mobility go hand in hand with a shortage of
resources. This development is forcing more sustainable behaviour, which is expected in turn to
drive demand for special steel solutions in terms of both volume and value in the long term.
Our business model – as market leader, we are there for our customers worldwide
S+Bi is an independent and fully integrated steel Group with operations
around the world with the two divisions: Production and Sales & Services. This enables us to sup-
port our customers worldwide along the entire supply chain: starting from joint developments,
through manufacture and processing, to complex supply chain solutions. With a premium product
portfolio and a special focus on technology and innovation, we tap into strategic growth markets
and expand our leading position in the market.

BUSINESS MODEL
PRODUCTION
Deutsche Edelstahlwerke
Finkl Steel
Steeltec
Swiss Steel
Ugitech
SALES & SERVICES
S+Bi
International
More than 70 distribution
and service branches in more
than 30 countries
S+BI GroupStrategic Management Holding
S+BI ANNUAL REPORT 2016 29
Production – specialised steelmaking, forging and rolling plants in Europe and North America;
drawing mills, bright steel production and heat treatment in northern and western Europe and
Turkey
The Production division encompasses the Business Units Deutsche Edelstahlwerke (DEW), Finkl
Steel, Steeltec, Swiss Steel and Ugitech.
S+Bi operates nine steelmaking plants in Germany, France, Canada, Swit-
zerland and the USA. Of these, six have their own melting furnaces, while three operate without
on-site melting facilities. The steel plants complement each other in terms of formats and quali-
ties, covering the entire spectrum for special long steel. Besides the three main product groups
– engineering steel, stainless steel and tool steel – the range includes special steel products.
S+Bi is represented in Denmark, Germany, Sweden, Switzerland and Turkey,
where it operates its own processing plants. These include bar and wire-drawing mills, bright steel
production plants, and heat-treatment facilities, where high-grade steel is processed to produce
bespoke long steel products to the customer’s exact specifications. Characteristics such as close
dimensional tolerance, strength and surface quality are precisely matched to the customers’ need/
requirement.
The Business Units in the Production division sell their products either via the Sales & Services
division, or directly to their customers.
Sales & Services – a reliable global partner in steel consulting, processing and supply
We combine our sales activities within the Sales & Services division, and guarantee the consistent
and reliable supply of special long steel and end-to-end customer solutions worldwide with over
70 distribution and service branches in more than 30 countries. These include technical consulting
and downstream processes such as sawing, milling and hardening, heat treatment as well as sup-
ply chain management. The product range is dominated by special long steel from the Production
division, supplemented by a selection of products from third-party providers. We pursue the goal
of offering our products and services globally – with excellent quality standards and first-class
service. We consciously and continuously extend our distribution network to achieve this goal.
We focus on attractive growth regions that will continue to ensure sustainable growth for the
S+Bi Group. In 2016, our activities as part of this expansion strategy included
opening new distribution branches in Bangkok (Thailand), Taipeh (Taiwan) and Tokyo (Japan) as
well as a storage location in Chongqing (China). Furthermore, we plan to continue with our regional
expansion strategy in the coming years.
www.schmolz-bickenbach.com/en/
group/group-structure/production/

MANAGEMENT REPORT BUSINESS ENVIRONMENT AND STRATEGY30
OUR PRODUCTS – AS CUSTOMISED AS OUR CUSTOMERS’ NEEDS
S+Bi produces a broad product range from scrap using alloys, covering the
entire application spectrum of special long steel. With our comprehensive range of steel grades,
dimensions and surface treatments as well as comprehensive pre-processing options, we offer
our partners solutions tailored to their needs. With our three product groups, engineering steel,
stainless steel and tool steel, S+Bi provides its international customers with a
unique variety of dimensions – from drawn ultra-fine wire with a diameter of 0.013 mm to open-die
forgings weighing more than 54 tonnes, from semi-finished materials to customised prefabricated
forms.
Engineering steel – special materials for extreme loads
Engineering steel is used in a multitude of applications. It is especially called for in applications
with high mechanical loads and when components need to be both reliable and durable. Examples
include drive, engine and chassis components for the automotive industry, turbine parts for power
generation, and gear components for wind-energy systems.
Stainless steel – resistant to corrosion, acids and heat
S+Bi is one of the global leaders in producing stainless steel. Stainless steel
is resistant to corrosion, acids and extreme thermal stresses. It is strong but stretchable. These
characteristics, paired with aesthetic optical design options, make stainless long steel an attractive
material for many specialised applications. Key application areas include the automotive, mechan-
ical engineering, food and chemical industries as well as medical engineering, the oil and gas
industry and aviation.
Tool steel – technical application consulting as the key to success
S+Bi is a global leader in producing tool steel. The product range spans
cold-work steel, hot-work tool steel, highspeed steel (HSS) and mould steel, which is used in
the automotive or the food packaging industry, for example. S+Bi has many
years of extensive expertise in customers’ specific application areas. This enables us to advise our
customers on the technical aspects of their products. We work closely with them to find the best
special steel solutions for their individual requirements.
Special materials - high-tech solutions for toughest requirements
As an expert technical partner, S+Bi develops innovative and customised
special steel solutions for complex high-tech applications. The product range includes powder
metallurgically produced, highly alloyed metal-matrix composites and steels, special alloys for the
dental sector as well as metal powder and continuous cast rods for deposition welding, coatings
and 3D printing. The fields of application for our special materials are diverse and constantly
growing.
S+BI ANNUAL REPORT 2016 31
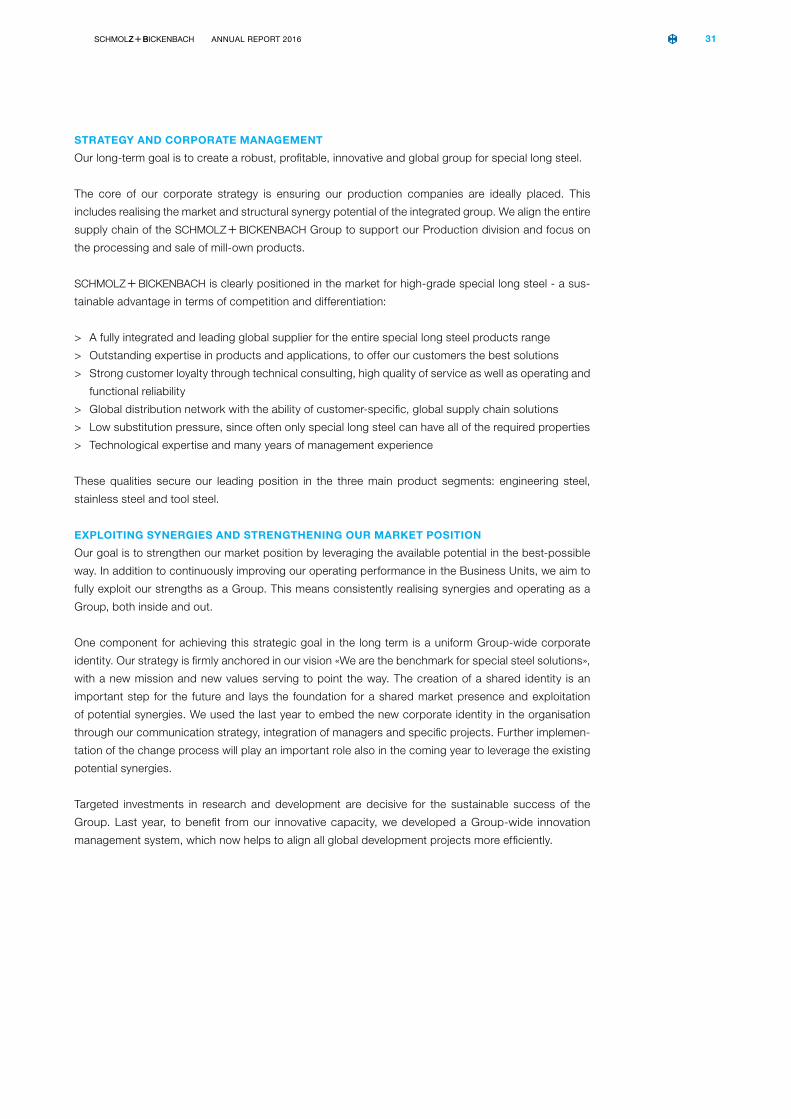
STRATEGY AND CORPORATE MANAGEMENT
Our long-term goal is to create a robust, profitable, innovative and global group for special long steel.
The core of our corporate strategy is ensuring our production companies are ideally placed. This
includes realising the market and structural synergy potential of the integrated group. We align the entire
supply chain of the S+Bi Group to support our Production division and focus on
the processing and sale of mill-own products.
S+Bi is clearly positioned in the market for high-grade special long steel - a sus-
tainable advantage in terms of competition and differentiation:
> A fully integrated and leading global supplier for the entire special long steel products range
> Outstanding expertise in products and applications, to offer our customers the best solutions
> Strong customer loyalty through technical consulting, high quality of service as well as operating and
functional reliability
> Global distribution network with the ability of customer-specific, global supply chain solutions
> Low substitution pressure, since often only special long steel can have all of the required properties
> Technological expertise and many years of management experience
These qualities secure our leading position in the three main product segments: engineering steel,
stainless steel and tool steel.
EXPLOITING SYNERGIES AND STRENGTHENING OUR MARKET POSITION
Our goal is to strengthen our market position by leveraging the available potential in the best-possible
way. In addition to continuously improving our operating performance in the Business Units, we aim to
fully exploit our strengths as a Group. This means consistently realising synergies and operating as a
Group, both inside and out.
One component for achieving this strategic goal in the long term is a uniform Group-wide corporate
identity. Our strategy is firmly anchored in our vision «We are the benchmark for special steel solutions»,
with a new mission and new values serving to point the way. The creation of a shared identity is an
important step for the future and lays the foundation for a shared market presence and exploitation
of potential synergies. We used the last year to embed the new corporate identity in the organisation
through our communication strategy, integration of managers and specific projects. Further implemen-
tation of the change process will play an important role also in the coming year to leverage the existing
potential synergies.
Targeted investments in research and development are decisive for the sustainable success of the
Group. Last year, to benefit from our innovative capacity, we developed a Group-wide innovation
management system, which now helps to align all global development projects more efficiently.

MANAGEMENT REPORT BUSINESS ENVIRONMENT AND STRATEGY32
We closely work together as an integrated group in the area of sales as well: product and market
development strategies are coordinated in a body overarching the Business Units. As part of further
Group-wide initiatives, expert teams are working on identifying and realising additional synergies.
These initiatives mainly relate to procurement, energy efficiency, logistics, personnel planning, as
well as health and industrial safety. Last but not least, the bundling of the essential central functions
of the Group headquarters in Lucerne led to a considerable reinforcement of the Group’s identity.
CONTINUOUS OPERATIONAL IMPROVEMENTS AND COST CUTTING
For 2016 and 2017, the Executive Board launched an extensive programme across all Business
Units to boost growth and earnings and improve operational earning power and the capital struc-
ture in a sustainable manner, with EBITDA improvement of EUR 70 million. Besides tighter integra-
tion of Business Units and optimisation of commodities procurement and logistics, restructuring
DEW is a central element of the Group’s programme. Along with the implemented cost-cutting
measures and signing of a restructuring labour contract with DEW employees, sustainable reor-
ganisation of the Business Unit was initiated.
In addition to systematically pursuing these programmes, we are constantly working on defining
additional improvement measures to strengthen our position in the long term.
Strategic growth potential
We strive to extend our leading position in our core business and have identified key potential to
do so as follows:
> Enhance and optimise the product portfolio continuously (focusing on technical products)
> Expand sales activities by strengthening our international sales network
> Continue to deepen know-how in application industries and expand operations in new applica-
tion areas
> Safeguard our position as technology leader and strengthen customer loyalty
> Improve the power to innovate through internal measures and targeted collaboration with cus-
tomers and other external partners such as universities and trade associations
> Position and strengthen S+Bi as an attractive brand in the sales, capital
and employment markets
> Exploit synergies and complementary strengths within the Group to the fullest extent
> Take M & A opportunities as they arise with a focus on growth regions and consolidation oppor-
tunities
Management KPIs
In keeping with our sustainable strategic alignment, our corporate management focuses on key
figures that include:
> Absolute EBITDA
> EBITDA margin
> Capital expenditure
> Adjusted EBITDA leverage (ratio of net debt to adjusted EBITDA)
> Amount of the net working capital (as a % of revenue)

GDP development in selected markets in %
RU IN BR CNCA USESIT FR DE
20152016
– 0.6
6.6
– 3.5
6.7
1.31.63.2
0.91.31.7
– 3.7
7.6
– 3.8
6.9
0.92.63.2
0.71.31.5
Source: IMF, January 2017
S+BI ANNUAL REPORT 2016 33
ECONOMIC SITUATION AND DEVELOPMENT OF THE KEY MARKETS
Global economic growth weakened slightly for the second consecutive year in 2016. According to the
IMF, the global gross domestic product (GDP) growth rate was 3.1% in 2016. The industrial nations,
representing the biggest sales market for S+Bi products, saw a year-on-year
growth rate decrease, from 2.1% in 2015 to 1.6% in 2016. The emerging and developing countries
recorded slight growth compared to the prior year.
Eurozone and USA showed slower growth
Gross domestic product (GDP) in the eurozone recorded growth of 1.7% in 2016 and was thus
slightly slower compared to 2.0% in the prior year. The continuing dynamics in Germany resulted in
GDP growth of 1.7% in 2016 (2015: 1.5%). While France stagnated with GDP growth of 1.3%, Italy
recorded a year-on-year economic growth from 0.7% to 0.9%. In contrast, Spain saw a convincing
GDP increase of 3.2%. Supported by the ECB’s comprehensive monetary policy measures, the
eurozone continued to resist the negative effects of economic and political uncertainties. With
GDP growth of just 1.6% in 2016, the economy in the USA was much weaker than the positive
growth of 2.6% seen in the prior year.
Emerging countries with slight upward trend, China stable
Economic and financial prospects in the emerging countries struggled due to a series of fac-
tors, such as declining commodity prices, foreign currency debts, revaluation of the US dollar
and the prospects of higher interest rates in the USA. Still, in 2016, the GDP growth reported by
IMF remained stable at 4.1%. The Chinese economy recorded growth of 6.7%, within the range
targeted by the government of 6.5% to 7.0%.

MANAGEMENT REPORT BUSINESS ENVIRONMENT AND STRATEGY34
DEVELOPMENT OF THE GLOBAL STEEL MARKET
2016 again proved to be a challenging year for the steel industry. Global overcapacities of steel-
producing countries continued to pose major challenges.
After a decline of 3.0% in 2015, and with an increase of 0.2% to around 1.5 billion tonnes in 2016,
the global steel demand remained almost unchanged year-on-year. In the largest market, China,
it dropped by 1.0% compared to the prior year. Especially, after the demand already dropped by
5.4% in the prior year. Brazil recorded the steepest fall in demand by 14.4%, followed by Russia
(–3.6%), USA (–1.2%) and Japan (–0.4%). In Germany, one of the most important markets for
S+Bi, demand increased by 2.0%.
Automotive: strong increase in automotive production
Global automotive production grew by 4.4% in 2016. More cars were produced both in Europe and
North America, increase by 2.6% and 2.0% respectively, as well as in South Asia (4.1%). In China
and the regions Middle East/Africa, automotive production even recorded a double-digit increase
of 12.8% and 19.2% respectively. By contrast, Japan/Korea and South America recorded a sharp
decline in production by 3.1% and 10.5% respectively.
On the sales side, whereas new registrations stagnated at the level of 2015 in the USA, they saw a
strong increase in Europe (6.5%), China (17.8%) and India (7.0%). In Russia (–11.0%), Japan (–1.6%)
and Brazil (–19.8%), new registrations continued to decline.
Mechanical and plant engineering: stable market development
S+Bi’s important market of mechanical and plant engineering in Germany
again disappointed with zero growth. The worldwide revenue of the mechanical engineering indus-
try remained constant. Whereas revenue decreased in the USA and Japan, it remained stable in
the EU. Only China recorded growth in this market.
Oil and gas industry stagnate at a low level
After the dramatic drop towards then end of 2015 and hitting rock bottom for the year at the
beginning of 2016, oil prices started to slowly recover again. In the course of the year Brent crude
increased by around 60% to almost USD 57 per barrel (prior year: USD 36) at the end of the year.
The decline in drilling activities in the oil and gas industry from 2015 continued in 2016 and reached
its lowest point in May. Following the upward trend of oil prices, drilling for oil and gas started to
slowly recover in the second half of the year, especially in North America.
Jan Feb Mar Apr May Jun Jul Aug Sep Oct Nov Dec
18
16
14
12
10
8
6
4
2
00
+ 15.5%– 41.8%
2016
2015
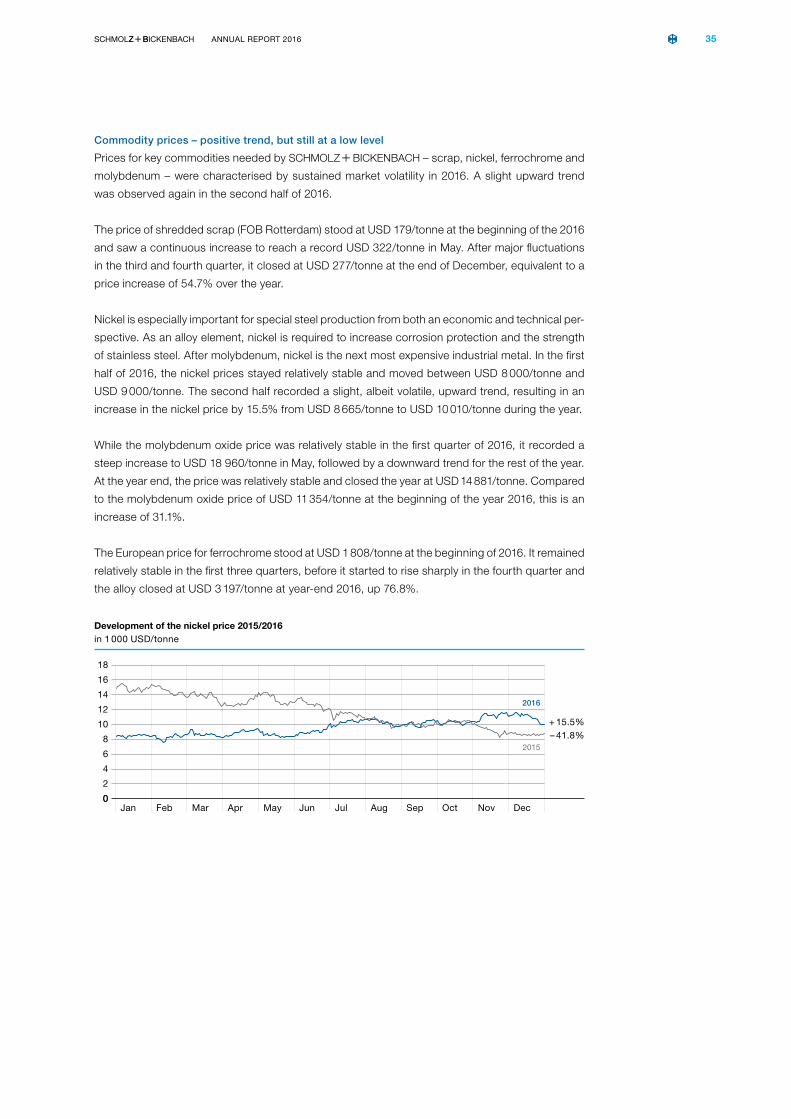
Development of the nickel price 2015/2016 in 1 000 USD/tonne
S+BI ANNUAL REPORT 2016 35
Commodity prices – positive trend, but still at a low level
Prices for key commodities needed by S+Bi – scrap, nickel, ferrochrome and
molybdenum – were characterised by sustained market volatility in 2016. A slight upward trend
was observed again in the second half of 2016.
The price of shredded scrap (FOB Rotterdam) stood at USD 179/tonne at the beginning of the 2016
and saw a continuous increase to reach a record USD 322/tonne in May. After major fluctuations
in the third and fourth quarter, it closed at USD 277/tonne at the end of December, equivalent to a
price increase of 54.7% over the year.
Nickel is especially important for special steel production from both an economic and technical per-
spective. As an alloy element, nickel is required to increase corrosion protection and the strength
of stainless steel. After molybdenum, nickel is the next most expensive industrial metal. In the first
half of 2016, the nickel prices stayed relatively stable and moved between USD 8 000/tonne and
USD 9 000/tonne. The second half recorded a slight, albeit volatile, upward trend, resulting in an
increase in the nickel price by 15.5% from USD 8 665/tonne to USD 10 010/tonne during the year.
While the molybdenum oxide price was relatively stable in the first quarter of 2016, it recorded a
steep increase to USD 18 960/tonne in May, followed by a downward trend for the rest of the year.
At the year end, the price was relatively stable and closed the year at USD 14 881/tonne. Compared
to the molybdenum oxide price of USD 11 354/tonne at the beginning of the year 2016, this is an
increase of 31.1%.
The European price for ferrochrome stood at USD 1 808/tonne at the beginning of 2016. It remained
relatively stable in the first three quarters, before it started to rise sharply in the fourth quarter and
the alloy closed at USD 3 197/tonne at year-end 2016, up 76.8%.

The year 2016 was characterised by high volatility on the international stock exchanges. The
beginning of the year saw strong, in some cases, double-digit price drops. After a brief recovery
in March and April, the stock markets were subsequently burdened by economic and political
uncertainties. In particular, UK’s plan to exit the European Union and the presidential elections in
the USA had an influence. Towards the end of the year, the scepticism in the markets gave way
to a more positive mood. Additionally, a lack of attractive investment alternatives led to increasing
share prices around the world. As at 31 December, the Dow Jones Industrial closed 13.4% higher
compared to year-end 2015. The Euro Stoxx 50® as well as the Japanese index Nikkei 225 closed
the year 2016 with a slight plus of 0.7% and 0.4%, respectively, compared to end of year 2015.
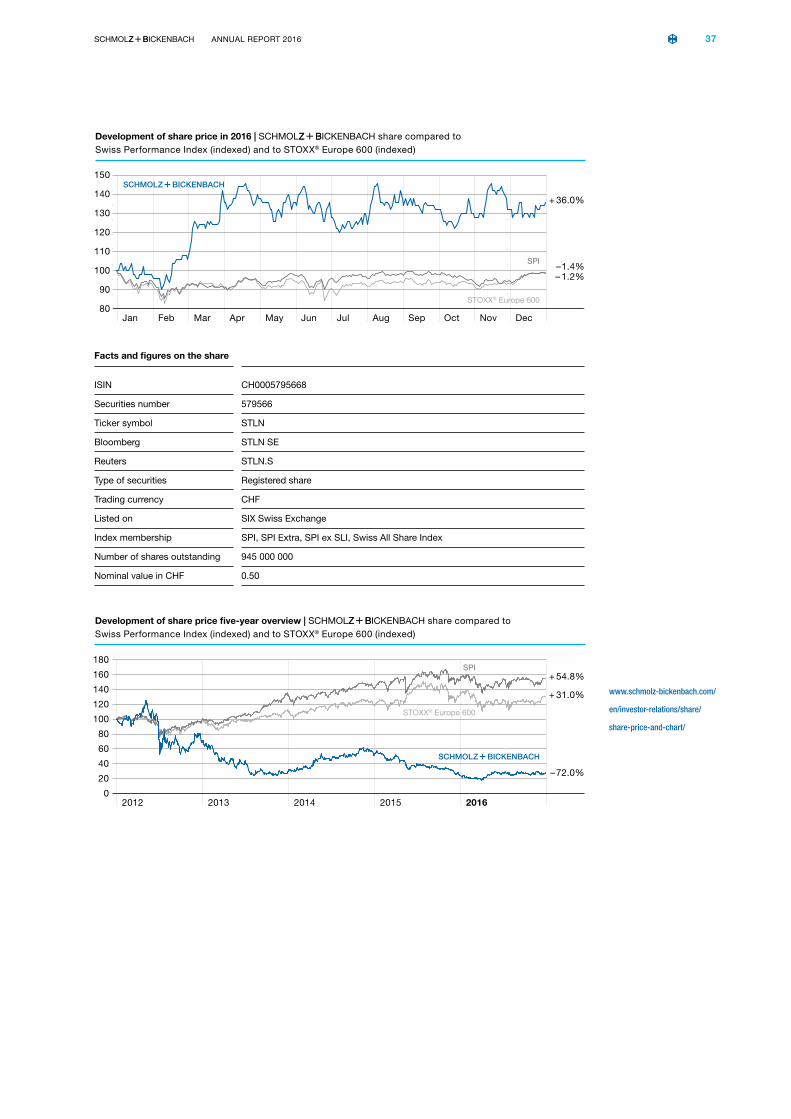
S + bi share price development in 2016
The S+Bi share rallied strongly in 2016 after experiencing a price drop at the
end of 2015. This was mainly attributable to the operative progress of the Group. Besides, the
mood in the capital market towards the steel industry improved in the course of the year. The rea-
sons being the improved income stemming from rising commodity prices, unrestrained demand
from the automotive industry as well as the introduction of punitive duties on Chinese steel in the
EU. This also had a positive influence on the S+Bi share. As at 31 December
2016, the share was quoted at CHF 0.68, higher by 36.0% compared to 31 December 2015. By
comparison, the Stoxx® Europe 600 index ended the year negative, down 1.2%. The broad-based
Swiss Performance Index (SPI), which includes the S+Bi share, closed at the
end of December down 1.4% compared to year-end 2015.
In 2016, the average daily trading volume was 0.56 million S+Bi shares.
By comparison, the average daily trading volume was 1.97 million shares in 2015.
CAPITAL MARKET
The S + Bi share is listed on the SIX Swiss
Exchange in accordance with the International Reporting Standard.
Prompt and open communication with capital market stakeholders
is very important to us. To this end, we regularly inform investors and
financial analysts about the operative and strategic development
of the Company.
MANAGEMENT REPORT CAPITAL MARKET36
Jan Feb Mar Apr May Jun Jul Aug Sep Oct Nov Dec
150
140
130
120
110
100
90
80
+ 36.0%
– 1.4%– 1.2%
Development of share price in 2016 | S+Bi share compared to Swiss Performance Index (indexed) and to STOXX® Europe 600 (indexed)
S+Bi
SPI
STOXX® Europe 600
www.schmolz-bickenbach.com/
en/investor-relations/share/
share-price-and-chart/
Facts and figures on the share
ISIN CH0005795668
Securities number 579566
Ticker symbol STLN
Bloomberg STLN SE
Reuters STLN.S
Type of securities Registered share
Trading currency CHF
Listed on SIX Swiss Exchange
Index membership SPI, SPI Extra, SPI ex SLI, Swiss All Share Index
Number of shares outstanding 945 000 000
Nominal value in CHF 0.50
2012 2013 2014 2015 2016
180
160
140
120
100
80
60
40
20
0
+ 31.0%
+ 54.8%
– 72.0%
S+Bi
STOXX® Europe 600
Development of share price five-year overview | S+Bi share compared to Swiss Performance Index (indexed) and to STOXX® Europe 600 (indexed)
SPI
S+BI ANNUAL REPORT 2016 37

Dividend policy
In line with the long-term focus of the corporate strategy, S+Bi will for the
foreseeable future continue to use profits primarily to strengthen its balance sheet. This approach
will gradually increase the sustainable value of the Company. The dividend policy is subject to
continuous review by the Board of Directors and may change in the future. Generally, the Board of
Directors makes an annual dividend proposal at the Annual General Meeting, taking into account
the Company’s goals, its current financial position and results of operations, any covenants in the
financing agreements and future market prospects. For 2016, the Board of Directors’ proposal is
not to distribute a dividend.
Analyst coverage
Monitoring by four financial analysts ensures the recognition of the S+Bi
share in the capital market. As at 31 December 2016, our Company was analysed by the following
investment banks:
Financial institution Analyst
Commerzbank Ingo-Martin Schachel
Kepler Cheuvreux Rochus Brauneiser
UBS Fabian Häcki
Zurcher Kantonalbank Dr Philipp Gamper
Investor Relations
We exercised active and open communication with the existing and potential investors and finan-
cial analysts in a series of road shows, conference calls and personal discussions. In 2016, the
Investor Relations team of S+Bi travelled to the important European financial
centres such as Frankfurt a. M., London and Zurich. This was complemented by our active par-
ticipation in numerous investor conferences. In cooperation with the Executive Board, the Investor
Relations team informed investors from around the world about S+Bi’s key
figures and the operative and strategic development.
Key share figures Unit 2012 2013 2014 2015 2016
Share capital million CHF 413.4 472.5 472.5 472.5 472.5
Number of registered shares shares 118 125 000 945 000 000 945 000 000 945 000 000 945 000 000
Market capitalisation (year-end) million CHF 338.0 1 040.0 1 021.0 472.5 642.6
Share price, closing price CHF 2.86 1.10 1.08 0.50 0.68
Share price, highest CHF 7.80 1.34 1.51 1.08 0.73
Share price, lowest CHF 2.28 0.58 1.00 0.49 0.45
Dividend per share CHF 0.00 0.00 0.00 0.00 0.00
Earnings per share EUR/CHF –1.38/–1.66 –0.26/–0.32 0.05/0.06 – 0.18/– 0.19 – 0.08/– 0.09
Shareholders’ equity per share EUR/CHF 5.29/6.35 0.93/1.14 0.94/1.13 0.78/0.85 0.70/0.75
MANAGEMENT REPORT CAPITAL MARKET38
More information including our annual and interim reports, press releases, presentations and fact
sheets with financial figures, as well as documents related to our Annual General Meeting is avail-
able on the website: www.schmolz-bickenbach.com/investor-relations
The key dates in our financial calendar are accompanied by presentations and conference calls,
together with events for investors and financial analysts.
Financial calendar
9 March 2017 Annual Report 2016, Conference call for Media, Financial Analysts and Investors
8 May 2017 2017 Annual General Meeting
11 May 2017 Interim Report Q1 2017, Conference call for Media, Financial Analysts and Investors
11 August 2017 Interim Report Q2 2017, Conference call for Media, Financial Analysts and Investors
9 November 2017 Interim Report Q3 2017, Conference call for Media, Financial Analysts and Investors
Contact
Dr Ulrich Steiner | Vice President Corporate Communications & Investor Relations
Phone: +41 (0) 41 581 4120
Fax: +41 (0) 41 581 4281
[email protected] | www.schmolz-bickenbach.com
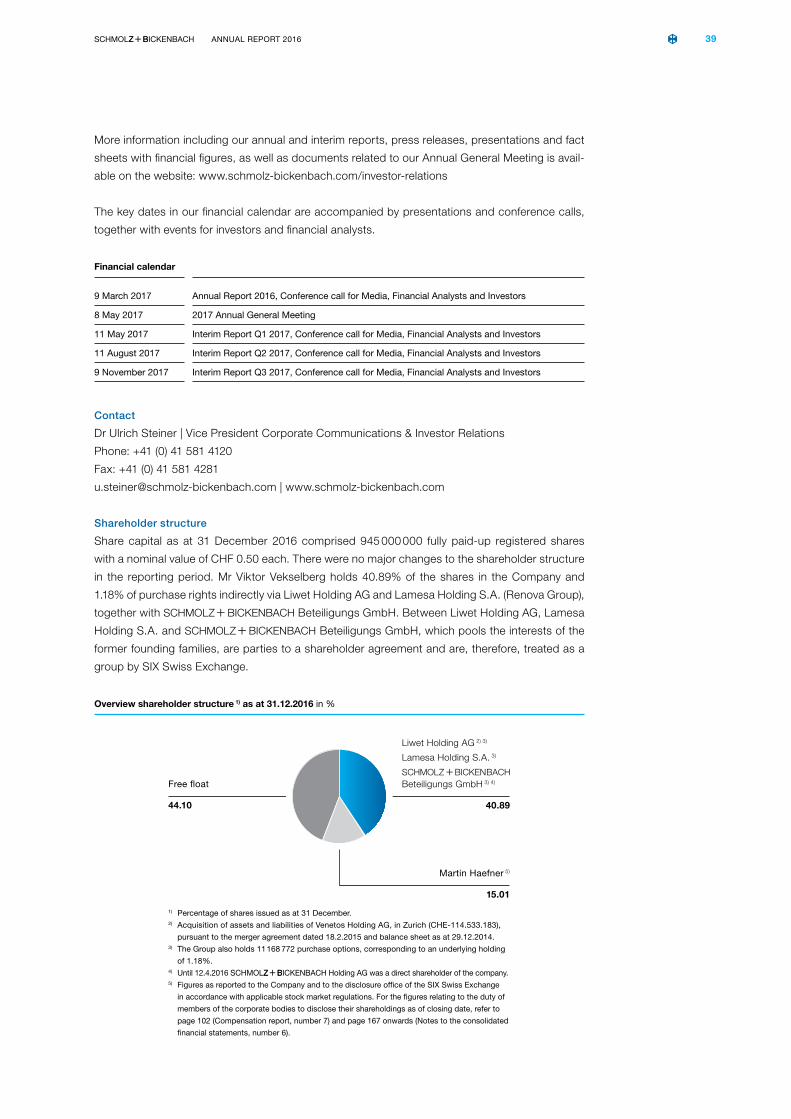
Shareholder structure
Share capital as at 31 December 2016 comprised 945 000 000 fully paid-up registered shares
with a nominal value of CHF 0.50 each. There were no major changes to the shareholder structure
in the reporting period. Mr Viktor Vekselberg holds 40.89% of the shares in the Company and
1.18% of purchase rights indirectly via Liwet Holding AG and Lamesa Holding S.A. (Renova Group),
together with S+Bi Beteiligungs GmbH. Between Liwet Holding AG, Lamesa
Holding S.A. and S+Bi Beteiligungs GmbH, which pools the interests of the
former founding families, are parties to a shareholder agreement and are, therefore, treated as a
group by SIX Swiss Exchange.
Overview shareholder structure 1) as at 31.12.2016 in %
Liwet Holding AG 2) 3)
Lamesa Holding S.A. 3)
S +Bi Beteiligungs GmbH 3) 4)
40.89
Martin Haefner 5)
15.01
Free float
44.10
1) Percentage of shares issued as at 31 December.2) Acquisition of assets and liabilities of Venetos Holding AG, in Zurich (CHE-114.533.183),
pursuant to the merger agreement dated 18.2.2015 and balance sheet as at 29.12.2014.3) The Group also holds 11 168 772 purchase options, corresponding to an underlying holding
of 1.18%. 4) Until 12.4.2016 S+BI Holding AG was a direct shareholder of the company. 5) Figures as reported to the Company and to the disclosure office of the SIX Swiss Exchange
in accordance with applicable stock market regulations. For the figures relating to the duty of
members of the corporate bodies to disclose their shareholdings as of closing date, refer to
page 102 (Compensation report, number 7) and page 167 onwards (Notes to the consolidated
financial statements, number 6).
S+BI ANNUAL REPORT 2016 39
Financial headroom at closing date in million EUR
478.4527.6
31.12.2015 31.12.2016
Cash and cash equivalents
ABS financing programme
Syndicated loan
53.243.7
110.6131.2
314.6 352.7
Net debt at closing date in million EUR
31.12.2015 31.12.2016
Other financial liabilities
Bond
ABS financing programme
Syndicated loan
One-off financing expenses/accrued interest
Cash and cash equivalents
471.2
43.3
167.7
188.5
135.4
10.553.2
420.0
36.1
167.7
170.1
97.2
7.443.7
FINANCING
S + BI financing structure is built on three main pillars: a syndicated loan, an
ABS financing programme and a corporate bond.
S + BI refinanced the syndicated loan and ABS financing programme in June
2014. The new revolving loan facility, once again a syndicated loan, and the ABS financing program,
both with standard terms until 2019, either replaced or extended the existing financial instruments.
S + BI was able to extend the maturity dates significantly by a term of five
years until April 2019. Furthermore, the Company secured better structural conditions for both
financing lines.
Unused financing lines and freely disposable funds come to around EUR 528 million as at
31 December 2016, ensuring the Company has sufficient financial resources.
MANAGEMENT REPORT CAPITAL MARKET40

Corporate bond 2012 – 2019
On 16 May 2012, S + BI issued a corporate bond with a final maturity
date of 15 May 2019. The senior secured notes were issued by our indirect subsidiary
S + BI Luxembourg S.A. (LU) at 96.957% of the nominal value and with a
coupon of 9.875% p.a. Interest is payable semi-annually on 15 May and 15 November. The senior
secured notes are listed on the Luxembourg Stock Exchange and traded on the Euro MTF market.
As at 31 December 2016, the bond was priced at 105.1%, giving an effective yield of 7.5% p.a.
Key bond facts and figures
Issuer S + BI Luxembourg S.A. (Luxembourg)
Listed on Luxembourg Stock Exchange
ISIN DE000A1G4PS9/DE000A1G4PT7
Type of security Fixed-interest notes
Trading currency EUR
Nominal volume EUR 258.0 Mio.
Outstanding volume EUR 167.7 Mio.
Pool factor 0.65253
Issue price 96.957%
Issue date 16 May 2012
Coupon 9.875%
Interest payable 15 May and 15 November
Maturity 15. Mai 2019
Denomination 1 000
Minimum trading volume 100 000
Rating agency Rating Outlook Latest rating
Moody’s B2 stable 24 May 2016
Standard & Poor’s B+ negative 19 October 2015
S+BI ANNUAL REPORT 2016 41

Key figures on results in million EUR 2016 2015
Change on prior year % Q4 2016 Q4 2015
Change on prior year %
Sales volume (kilotonnes) 1 724 1 763 – 2.2 401 401 0.0
Revenue 2 314.7 2 679.9 – 13.6 558.3 571.3 – 2.3
Adjusted operating profit before depreciation and amortisation (adjusted EBITDA) 153.2 169.6 – 9.7 43.9 40.6 8.1
Operating profit before depreciation and amortisation (EBITDA) 108.0 159.0 – 32.1 8.9 36.2 – 75.4
Adjusted EBITDA margin (%) 6.6 6.3 0.3 7.9 7.1 0.8
EBITDA margin (%) 4.7 5.9 – 1.2 1.6 6.3 – 4.7
Operating profit (EBIT) – 18.5 34.9 nm – 25.2 5.4 nm
Earnings before taxes (EBT) – 59.6 – 11.0 nm – 33.6 – 5.0 nm
Earnings after taxes from continuing operations – 75.5 – 35.4 nm – 43.5 – 14.9 nm
Net income (loss) (EAT) – 80.0 – 166.8 52.0 – 44.1 – 15.1 nm
BUSINESS DEVELOPMENT OF THE GROUP
The implementation of our cost-saving and efficiency programme con-
tinued to bear fruit in 2016. Sales volume and revenue were affected by
the challenges in the market environment. Nevertheless, we managed
to improve our adjusted EBITDA margin in comparison to the prior year.
GENERAL ECONOMIC SITUATION
There was no sustained trend reversal in affecting the steel industry in 2016. As a result, the busi-
ness climate remained challenging in the year, with the first quarter displaying a particularly strong
headwind against which we had to battle. The adverse conditions on the market are reflected in
lower sales volume and revenue as well as a decline in EBITDA. Despite these trends, we man-
aged to improve our adjusted EBITDA margin. Thanks to the strict cost-cutting and efficiency
programme, the adjusted EBITDA margin was higher than in the prior year. In addition, we were
given a boost in the second half of the year as prices for commodities such as scrap, nickel and
ferrochrome increased.
Order backlog at year-end in kt
351
452497
395
462
2012 2013 2014 2015 2016
Order backlog at quarter-end in kt
395444 454
420462
Q4 2015 Q1 2016 Q2 2016 Q3 2016 Q4 2016
MANAGEMENT REPORT BUSINESS DEVELOPMENT OF THE GROUP42
Sales volume and revenue five-year overview in kt / in million EUR
1 829
2 869.0
2014
1 763
2 679.9
20152013
2 054
3 276.7
2012
2 044
3 581.4
2 314.7
2016
1 724
Sales volume Revenue
Sales volume Revenue
Sales volume and revenue five-quarter overview in kt / in million EUR
471
618.7
Q2 2016
391
534.1
Q3 2016Q1 2016
461
603.6
Q4 2015
401
571.3 558.3
Q4 2016
401
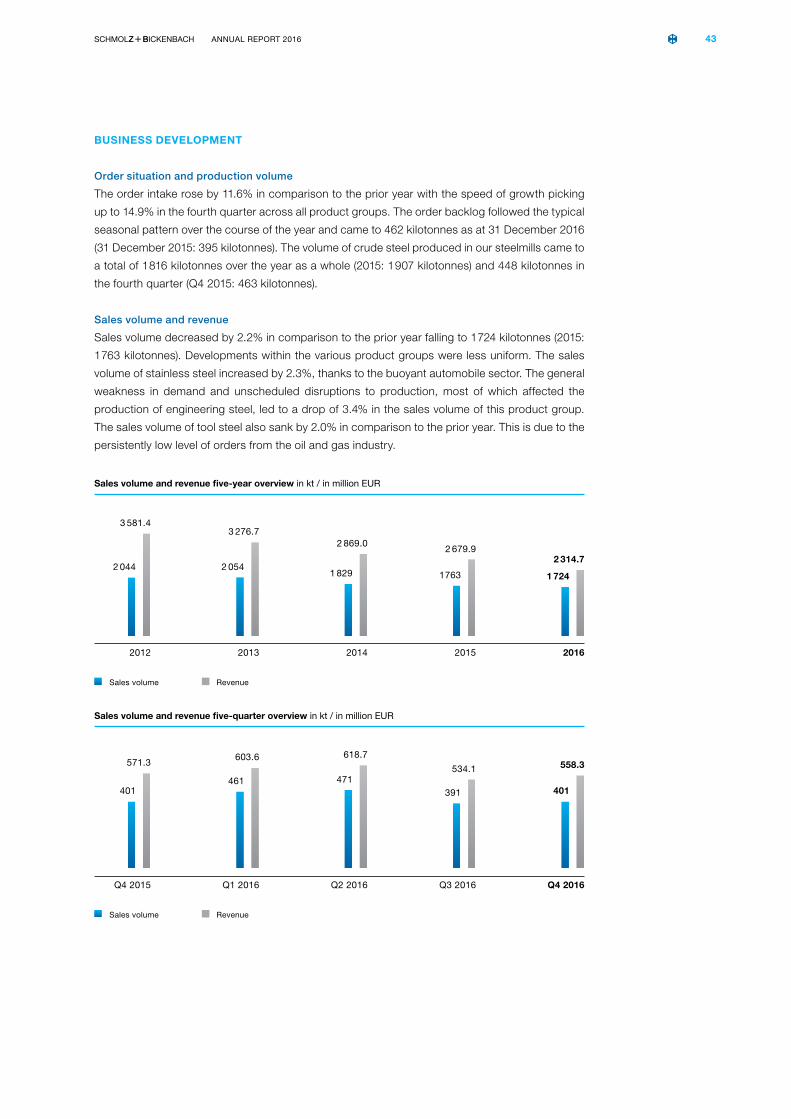
BUSINESS DEVELOPMENT
Order situation and production volume
The order intake rose by 11.6% in comparison to the prior year with the speed of growth picking
up to 14.9% in the fourth quarter across all product groups. The order backlog followed the typical
seasonal pattern over the course of the year and came to 462 kilotonnes as at 31 December 2016
(31 December 2015: 395 kilotonnes). The volume of crude steel produced in our steelmills came to
a total of 1 816 kilotonnes over the year as a whole (2015: 1 907 kilotonnes) and 448 kilotonnes in
the fourth quarter (Q4 2015: 463 kilotonnes).
Sales volume and revenue
Sales volume decreased by 2.2% in comparison to the prior year falling to 1 724 kilotonnes (2015:
1 763 kilotonnes). Developments within the various product groups were less uniform. The sales
volume of stainless steel increased by 2.3%, thanks to the buoyant automobile sector. The general
weakness in demand and unscheduled disruptions to production, most of which affected the
production of engineering steel, led to a drop of 3.4% in the sales volume of this product group.
The sales volume of tool steel also sank by 2.0% in comparison to the prior year. This is due to the
persistently low level of orders from the oil and gas industry.
S+BI ANNUAL REPORT 2016 43

Revenue by region at year-end in %
France Switzerland Italy Other Europe
America Africa Asia
Australia
Germany
7.1
38.9
1.7
11.0
18.616.3
6.47.0
39.7
1.8
11.3
19.7
13.3
7.2
20152016
Revenue by product group at year-end in %
Stainless steel Tool steel OtherEngineering steel
41.838.0
17.2
3.0
41.138.2
18.1
2.6
20152016
The trends in sales volume seen over the whole year were also seen in the fourth quarter. The sales
volume of stainless steel increased by 8.1%. With regard to engineering steel the sales volume
dropped by 2.0%. Although the sales volume of tool steel was still waning, the fall at just 0.2% was
much less severe than the decline over the year as a whole. In sum, the sales volume in the fourth
quarter of 401 kilotonnes compares with the same quarter of the prior year.
The average sales price per tonne of steel came to EUR 1 342 for the whole year of 2016 and was
therefore down significantly on the prior year (2015: EUR 1 520 per tonne). This is primarily due to
lower commodity prices. Price increases were not possible until the second half of the year carried
by an upwards trend in the prices of scrap and nickel. Correspondingly, the average sales prices
rose to EUR 1 392 per tonne in the fourth quarter of 2016, which is higher than in the third quarter
(Q3 2016: EUR 1 366 per tonne), but still lower than in the fourth quarter of 2015 of EUR 1 426 per
tonne.
Revenue in 2016 dropped by 13.6% in comparison to 2015 to EUR 2 314.7 million on account of the
decline in sales volume and lower prices. In the fourth quarter of 2016 revenue decreased by 2.3% in
comparison to the fourth quarter of the prior year to EUR 558.3 million (Q4 2015: EUR 571.3 million),
mainly on account of the erosion of prices compared to the same quarter of the prior year.
MANAGEMENT REPORT BUSINESS DEVELOPMENT OF THE GROUP44

Gross margin five-year overview in million EUR / in %
Gross margin absolute amount Gross margin in %
1 081.7 1 056.4 1 064.9971.8
2012 2013 2014 2015
913.0
2016
30.2 32.2 37.1 36.3 39.4
Gross margin five-quarter overview in million EUR / in %
205.9
Q4 2015
230.2
Q1 2016
245.1
Q2 2016
207.5
Q3 2016
230.2
Q4 2016
36.0 38,1 39.6 38.9 41.2
Over the whole year, revenue generated by the three product groups decreased, with engineering
steel dropping 15.2% to EUR 950.4 million, stainless steel by 13.2% to EUR 884.7 million and tool
steel by 9.5% to EUR 418.1 million. In the fourth quarter, by contrast, the revenue generated by
sales of stainless steel rose by 1.6% to EUR 219.1 million while the revenue from engineering steel
decreased by 4.4% (EUR 221.2 million) and tool steel by 3.0% (EUR 102.7 million), although the
decreases were lower than those recorded for the year as a whole.
At regional level, the development of revenue in 2016 varied. Africa/Asia/Australia performed com-
paratively well with a decrease in revenue of 1.9% to EUR 167.1 million. In the two growth markets
of China and India, revenue grew by double digits, albeit from a lower base line. In Europe reve-
nue decreased by 11.1% to EUR 1 840.8 million and in America by 29.9% to EUR 306.8 million;
especially in the US, this was attributable to the ongoing slump in the oil and gas industry.
The 2% decline in revenue in Europe in the fourth quarter to EUR 437.0 million was significantly
smaller than in the year as a whole. Revenue generated in Africa/Asia/Australia in the fourth quarter
(up 28.5%) was significantly higher than in the prior quarter, climbing to EUR 44.2 million. In China
revenue more than tripled.
Cost of materials and gross profit
After eliminating the changes in semi-finished and finished goods, the cost of materials decreased
by 17.9% over the year as a whole to EUR 1 401.7 million (2015: EUR 1 708.1 million) and by 10.2%
in the fourth quarter to EUR 328.2 million (Q4 2015: EUR 365.4 million). In addition to the lower
costs of commodities, measures to save costs and enhance efficiency in the procurement process
had a positive impact on the cost of materials. The gross profit decreased by 6.1% over the year
as a whole to EUR 913.0 million (2015: EUR 971.8 million) but rose by 11.8% in the fourth quarter to
EUR 230.2 million (Q4 2015: EUR 205.9 million). The gross margin was raised to 39.4% for the year
as a whole (2015: 36.3%) and to 41.2% in the fourth quarter (Q4 2015: 36.0%).
S+BI ANNUAL REPORT 2016 45

EBITDA and EBITDA margin (adjusted respectively)five-quarter overview in million EUR / in %
40.6
Q4 2015
25.0
Q1 2016
52.5
Q2 2016
31.8
Q3 2016
43.9
Q4 2016
7.14.1
8.56.0 7.9
EBITDA and EBITDA margin (adjusted respectively)five-year overview in million EUR / in %
Adjusted EBITDA Adjusted EBITDA margin
151.1178.8
256.6
169.6
2012 2013 2014 2015
153.2
2016
4.2 5.58.9
6.3 6.6
Income and expenses
For the year as a whole, other operating income rose by 14.9% on the prior year to EUR 51.7 million
(2015: EUR 45.0 million). This includes non-recurring insurance indemnification for business inter-
ruption losses at two rolling mills in the third quarter. This covered a portion of the losses caused
by the production downtime. In the fourth quarter of 2016 other operating income decreased by
17.1% compared to the same quarter of the prior year.
Personnel expenses rose to EUR 561.4 million for the year as a whole (2015: EUR 551.9 million)
and to EUR 151.4 million in the fourth quarter (Q4 2015: EUR 121.9 million). The increase is
mainly attributable to restructuring in the amount of EUR 19.3 million, mainly at the Business Units
DEW and Steeltec. The headcount was scaled back slightly to 8 877 from 8 910 at year-end 2015.
Other operating expenses were reduced by 3.5% to EUR 295.3 million for the year as a whole
(2015: EUR 305.9 million). They increased again by 28.4% in the fourth quarter to EUR 85.4 mil-
lion (Q4 2015: EUR 66.5 million) due to restructuring expenses. The measures to save costs and
enhance efficiency continued to be implemented as scheduled. Savings totalling EUR 42.0 million
were realised over the year as a whole of 2016.
ADJUSTED EBITDA, EBITDA AND EBITDA MARGINS
Adjusted EBITDA came to EUR 153.2 million in 2016, which is below the figure of the prior year
of EUR 169.6 million. Adjusted EBITDA came to EUR 43.9 million in the fourth quarter (Q4 2015:
EUR 40.6 million), representing an increase of 8.1% on the comparable quarter of the prior year.
Restructuring measures, largely related to the reorgnisation of DEW and Steeltec, as well as
extraordinary items resulted in net non-recurring expenses of EUR 45.2 million (2015: EUR 10.6 mil-
lion), which were deducted to present adjusted EBITDA. As a result of these extraordinary items,
EBITDA fell to EUR 108.0 million for the year as a whole 2016 (2015: EUR 159.0 million) and to
EUR 8.9 million in the fourth quarter (Q4 2015: EUR 36.2 million).
The adjusted EBITDA margin was raised to 6.6% for the year as a whole 2016 (2015: 6.3%) and to
7.9% in the fourth quarter (Q4 2015: 7.1%). By contrast, EBITDA margin fell to 4.7% for the year as
a whole (2015: 5.9%) and to 1.6% in the fourth quarter (Q4 2015: 6.3%).
MANAGEMENT REPORT BUSINESS DEVELOPMENT OF THE GROUP46

Depreciation, amortisation and impairments
Depreciation, amortisation and impairments came to EUR 126.5 million for the year as a whole (2015: EUR 124.1 million)
and to EUR 34.1 million in the fourth quarter, slightly above the level of the prior year (Q4 2015: EUR 30.8 million).
This contributed to the decline in EBIT for the year as a whole to EUR –18.5 million (2015: EUR 34.9 million) and
also in the fourth quarter when it fell to EUR – 25.2 million (Q4 2015: EUR 5.4 million).
Financial result
The financial expense of EUR – 46.9 million is an improvement on the prior year (2015: EUR – 47.6 million) mainly
on account of higher standby fees for loans and the fact that no measurement loss was recorded on the bond
as in 2015. Financial income increased to EUR 5.8 million (2015: EUR 1.7 million) and can be attributed to the
higher valuation of the call option on the bond issued. In sum, the financial result improved to EUR – 41.1 million for the
year as a whole (2015: EUR – 45.9 million) and to EUR – 8.4 million in the fourth quarter (Q4 2015: EUR –10.4 million).
Profit/loss from continuing operations
As a result of the developments described above, EBT deteriorated to EUR – 59.6 million for the year as a whole
(2015: EUR –11.0 million) and to EUR – 33.6 million in the fourth quarter of 2016 (Q4 2015: EUR – 5.0 million). Tax
expenses were accordingly below the level of the prior year at EUR 15.9 million for the year as a whole (2015:
EUR 24.4 million) and EUR 9.9 million for the fourth quarter (Q4 2015: EUR 9.9 million). As a result, earnings
from continuing operations came to EUR –75.5 million for the year as a whole (2015: EUR – 35.4 million) and
EUR – 43.5 million for the fourth quarter (Q4 2015: EUR –14.9 million).
Profit/loss from discontinued operations
Over the course of 2016 another loss of EUR 4.5 million was incurred in relation to the sale of Jacquet Metal
Services in 2015, which had been classified as a discontinued operation. The final agreement on the purchase
price led to a price reduction of EUR 3.5 million. The outstanding installment has since been paid. A disposal
loss of EUR –131.4 million was reported in the prior-year period.
Group result
The Group result came in at EUR – 80.0 million in 2016 as a whole (2015: EUR –166.8 million) and at EUR – 44.1 million
in the fourth quarter (Q4 2015: EUR –15.1 million).
S+BI ANNUAL REPORT 2016 47

REVENUE AND EBITDA IN THE PRODUCTION DIVISION
The Production division sustained a 14.4% fall in revenue to EUR 2 099.8 million (2015: EUR 2 452.8 mil-
lion). Revenue continued to fall in the fourth quarter, slipping by another 1.8% in comparison to the
same quarter of the prior year. This was primarily due to two factors: the fall in the annual average
commodity prices, such as scrap and nickel, and the business downturn in the oil and gas industry,
which dampened business activity particularly in North America.
Adjusted EBITDA for the Production division slumped by 11.3% over the year as a whole to
EUR 139.1 million (2015: EUR 156.9 million) although a rise was recorded in the fourth quarter to
EUR 41.8 million (Q4 2015: EUR 38.2 million). The adjusted EBITDA margin rose to 6.6% for the year as
a whole (2015: 6.4%) and to 8.3% in the fourth quarter (Q4 2015: 7.4%). The adjustments mainly related
to provisions for consulting fees as well as restructuring and led to extraordinary expenses in the
Production division of EUR 33.7 million for the year as a whole (2015: EUR 1.9 million) and
EUR 31.3 million for the fourth quarter (Q4 2015: EUR 2.1 million), which were eliminated from
EBITDA. Including these extra ordinary expenses, EBITDA comes to EUR 105.4 million for the year as a
whole (2015: EUR 155.0 million) and EUR 10.5 million in the fourth quarter (Q4 2015: EUR 36.1 million).
The EBITDA margin stands at 5.0% for the year as a whole (2015: 6.3%) and to 2.1% in the fourth
quarter (Q4 2015: 7.0%).
Key figures of the divisions in million EUR 2016 2015Change on
prior year % Q4 2016 Q4 2015Change on
prior year %
Production
Revenue 2 099.8 2 452.8 – 14.4 505.7 514.8 – 1.8
Adjusted operating profit before depreciation and amortisation (adjusted EBITDA) 139.1 156.9 – 11.3 41.8 38.2 9.4
Operating profit before depreciation and amortisation (EBITDA) 105.4 155.0 – 32.0 10.5 36.1 – 70.9
Adjusted EBITDA margin (%) 6.6 6.4 0.2 8.3 7.4 0.9
EBITDA margin (%) 5.0 6.3 – 1.3 2.1 7.0 – 4.9
Investments 94.8 115.5 – 17.9 39.6 56.5 – 29.9
Segment operating free cash flow 110.6 220.2 – 49.8 28.6 115.8 – 75.3
Employees as at closing date 7 526 7 546 – 0.3 – – -
Sales & Services
Revenue 456.5 543.5 – 16.0 110.9 117.3 – 5.5
Adjusted operating profit before depreciation and amortisation (Adjusted EBITDA) 18.5 19.6 – 5.6 4.8 3.0 60.0
Operating profit before depreciation and amortisation (EBITDA) 16.1 17.4 – 7.5 3.2 2.0 60.0
Adjusted EBITDA margin (%) 4.1 3.6 0.5 4.3 2.6 1.7
EBITDA margin (%) 3.5 3.2 0.3 2.9 1.7 1.2
Investments 4.3 3.5 22.9 1.6 1.5 6.7
Segment operating free cash flow 31.1 4.2 nm 6.4 22.3 – 71.3
Employees as at closing date 1 239 1 252 – 1.0 – – –
BUSINESS DEVELOPMENT OF THE DIVISIONS
48 MANAGEMENT REPORT BUSINESS DEVELOPMENT OF THE DIVISIONS

Revenue Production five-quarter overview in million EUR
514.8
Q4 2015
548.6
Q1 2016
564.0
Q2 2016
481.5
Q3 2016
505.7
Q4 2016
EBITDA and EBITDA-Marge (adjusted respectively) Production five-quarter overview in million EUR / in %
38.2
Q4 2015
20.6
Q1 2016
42.7
Q2 2016
34.0
Q3 2016
41.8
Q4 2016
7.43.8
7.6 7.1 8.3
Adjusted EBITDA Adjusted EBITDA margin
Adjusted EBITDA Adjusted EBITDA margin
EBITDA and EBITDA-Marge (adjusted respectively) Sales & Services five-quarter overview in million EUR / in %
3.0
Q4 2015
4.0
Q1 2016
5.3
Q2 2016
4.4
Q3 2016
4.8
Q4 2016
2.63.4
4.5 4.0 4.3
Revenue Sales & Services five-quarter overview in million EUR
Q4 2015 Q1 2016 Q2 2016 Q3 2016
110.9
Q4 2016
117.3 119.3 116.8109.5
BUSINESS DEVELOPMENT OF THE DIVISIONS
REVENUE AND EBITDA IN THE SALES & SERVICES DIVISION
A strong decline of demand in the key markets, especially in the oil and gas industry, had a negative
effect on the volume generated in 2016 and resulted in a revenue decrease of EUR 87.0 mil lion or
16.0% to EUR 456.5 million compared to the prior year. This is despite the very positive growth in
China and India, where the division expanded its market positions.
Adjusted EBITDA decreased by 5.6% over the year as a whole, but rose again in the fourth quarter by
60.0%. This is due to generally weak demand over the year as a whole and the sharp upturn towards
the end of the year. Adjusted EBITDA margin increased to 4.1% in the year as a whole (2015: 3.6%)
and to 4.3% in the fourth quarter (Q4 2015: 2.6%). The net extraordinary expenses for restructuring
measures and other special projects allocable to the Sales & Services division came to a total of
EUR 2.4 million for the year as a whole (2015: EUR 2.2 million) and EUR 1.6 million for the fourth quarter
(Q4 2015: 1.0 million). This results in EBITDA of EUR 16.1 million for the year as a whole (2015:
EUR 17.4 million) and EUR 3.2 million in the fourth quarter (Q4 2015: EUR 2.0 million). The EBITDA
margin comes to 3.5% for the year as a whole (2015: 3.2%) and to 2.9% in the fourth quarter
(Q4 2015: 1.7%).
S+BI ANNUAL REPORT 2016 49

FINANCIAL POSITION AND NET ASSETS
The primary goal of financial management is to create a solid capital
base to support the Group’s sustainable growth. The Group relies on
three pillars to secure the liquidity needed to do this: the syndicated
loan, the corporate bond, and the ABS programme. A central cash
pool ensures that our international operations have sufficient liquidity.
Key figures on the financial position and net assets Unit 2012 2013 2014 2015 2016
Change on prior year %
Shareholders’ equity million EUR 633.0 889.9 900.9 750.6 667.5 – 11.1
Equity ratio % 26.2 37.4 35.9 35.6 32.6 – 3.0
Net debt million EUR 902.8 610.1 587.2 471.1 420.0 – 10.8
Gearing % 142.6 68.6 65.2 62.8 62.9 0.1
Net working capital million EUR 1 006.0 949.5 992.3 690.8 615.4 – 10.9
Total assets million EUR 2 417.1 2 377.5 2 509.6 2 109.0 2 047.0 – 2.9
Cash flow before changes in net working capital million EUR 103.6 123.3 198.9 116.2 104.8 – 9.8
Cash flow from operating activi-ties of continuing operations million EUR 168.8 167.8 157.6 290.7 184.3 – 36.6
Cash flow from investing activi-ties of continuing operations million EUR – 124.8 – 94.1 – 92.4 – 111.7 – 92.3 17.4
Free cash flow from continuing operations million EUR 44.0 73.7 65.2 179.0 92.0 – 48.6
Depreciation and amortisation million EUR 122.2 121.5 116.4 121.9 124.7 2.3
Investments million EUR 141.0 105.7 97.3 161.9 100.8 – 37.7
50 MANAGEMENT REPORT FINANCIAL POSITION AND NET ASSETS

Shareholders’ equity and equity ratiofive-year overview in million EUR / in %
Shareholders’ equity Equity ratio
633.0
889.9 900.9
750.6
2012 2013 2014 2015
667.5
2016
26.2
37.4 35.9 35.6 32.6
Net debt and gearingfive-year overview in million EUR / in %
Net debt Gearing
902.8
610.1 587.2471.1
2012 2013 2014 2015
420.0
2016
142.6
68.6 65.2 62.8 62.9
FINANCIAL SITUATION
Shareholders’ equity and equity ratio
The lower level of equity reflects negative earnings after taxes of EUR – 80.0 million for the Group
for 2016 as a whole. As a result, equity decreased by 11.1% to EUR 667.5 million (2015: EUR 750.6 mil-
lion). Taking account of the decrease in total equity and liabilities to EUR 2 047.0 million (2015:
EUR 2 109.0 million), the equity ratio decreased to 32.6% (2015: 35.6%).
Net debt
Net debt, comprising current and non-current financial liabilities less cash and cash equivalents, came
to EUR 420.0 million, a fall of EUR 51.1 million on the figure as at 31 December 2015 (EUR 471.1 million).
The main reason for the fall is the successful reduction of net working capital leading to a steady scaling
back of financial liabilities.
The gearing, which expresses the relationship of net debt to shareholders’ equity, despite lower
equity, remained roughly stable at 62.8% (2015: 62.9%).
Cash flow
The cash flow from operating activities prior to changes in net working capital came to EUR 104.8 million,
a fall of EUR 11.4 million in comparison to the prior year. Despite further successful management
of net working capital, cash flow from operating activities decreased by EUR 106.4 million to
EUR 184.3 million (2015: EUR 290.7 million).
S+BI ANNUAL REPORT 2016 51

Cash flow from continuing operations five-year overview in million EUR
168.8
2012 2013
157.6
2014
290.7
2015
184.3
2016
from operating activities
167.8
– 124.8– 92.4
– 111.7– 92.3
from investing activities
– 94.1
2012 2013 2014 2015 2016 2012 2013 2014 2015 2016
44.065.2
179.0
92.0
Free cash flow
73.7
103.6
2012 2013
198.9
2014
116.2
2015
104.8
2016
before changes in net working capital
123.3
The cash flow from investing activities from continuing operations came to EUR – 92.3 million in the
fiscal year 2016, which is less than the cash flow of EUR –111.7 million recorded in the prior year.
In 2016 investments mainly include a facility for quenching treatment at DEW and a new hook con-
veyor at Swiss Steel. In addition, the remaining purchase price of EUR 4.5 million from JACQUET
METAL SERVICE was received.
As a result, the free cash flow from continuing operations came to EUR 92.0 million (2015: EUR
179.0 million).
The reduction of financial liabilities by EUR 63.3 million (2015: EUR 122.7 million), combined with
higher interests paid of EUR 38.1 million (2015: EUR 34.7 million), which was mainly attributable
to one-time payments to the syndicate of banks, resulted in cash flow from financing activities of
EUR –102.1 million (2015: EUR –158.4 million) from continuing operations.
MANAGEMENT REPORT FINANCIAL POSITION AND NET ASSETS52

Investments, depreciation/amortisation and investment ratio five-year overview in million EUR / in %
97.3116.4
2014
161.9
121.9
20152013
105.7121.5
2012
141.0122.2 124.7
2016
100.8
11587 84
13381
Investment ratioDepreciation/amortisationInvestments
Investments, depreciation/amortisation and investment ratio five-quarter overview in million EUR / in %
25.132.0
Q3 2016Q1 2016
17.4
30.2
Q4 2015
60.3
30.8196
5816.3
30.2
Q2 2016
5478
Q4 2016
42.0
32.3
130
Investment ratioDepreciation/amortisationInvestments
NET ASSETS
Total assets
Following the completion of the deconsolidation of distribution entities in 2015, with a correspond-
ing reduction in assets and liabilities, total assets had decreased significantly by the close of 2015.
In comparison, total assets decreased once again in 2016 due to a reduction of inventories and
financial liabilities, but also due to the net loss reported by the Group for the year. As at 31 December
2016 total assets came to EUR 2 047.0 million, a fall of EUR 62.0 million in comparison to the close
of 2015 when they came to EUR 2 109.0 million.
Non-current assets
Non-current assets decreased by 1.5% in comparison to the close of 2015 from EUR 1 010.0 mil-
lion to EUR 994.7 million. The decrease was mainly due to regular depreciation and amortisation
of assets of EUR 124.7 million, which was partly offset by investments of EUR 100.8 million in new
plant and equipment. Non-current assets account for 48.6% of total assets, a slight increase on
the prior year (prior year: 47.9%).
S+BI ANNUAL REPORT 2016 53

Net working capital and net working capital/revenue five-year overview in million / in %
1 006.0949.5 992.3
690.8
2012 2013 2014 2015
615.4
2016
28.1 29.0 29.7 30.2 27.6
Net working capital
Net working capital/revenue
Net working capital and net working capital/revenue five-quarter overview in million EUR / in %
690.8 704.4 688.6 646.6
Q4 2015 Q1 2016 Q2 2016 Q3 2016
615.4
Q4 2016
30.2 27.829.2 30.3 27.6
Net working capital
Net working capital/revenue
Net working capital
Overall, non-current assets decreased by EUR 46.7 million to EUR 1 052.3 million, mainly as a
result of a reduction of EUR 33.8 million in inventories since 31 December 2015. In sum, net work-
ing capital sank by another 10.9% to EUR 615.4 million. The ratio of net working capital to revenue
decreased to 27.6% (prior year: 30.2%).
Liabilities
Non-current liabilities totalled EUR 696.9 million as at the reporting date, down EUR 18.3 million
or 2.6% on the figure from 31 December 2015. The decrease is mainly due to the reduction in
financial liabilities. The ratio of long-term debt to total equity and liabilities rose slightly to 34.1%
(prior year: 33.9%).
Current liabilities increased by EUR 39.4 million in comparison to the end of 2015 to EUR 682.6 mil-
lion. The share of current liabilities to total equity and liabilities therefore rose to 33.3% (prior year:
30.5%).
54 MANAGEMENT REPORT FINANCIAL POSITION AND NET ASSETS | NON-FINANCIAL PERFORMANCE INDICATORS
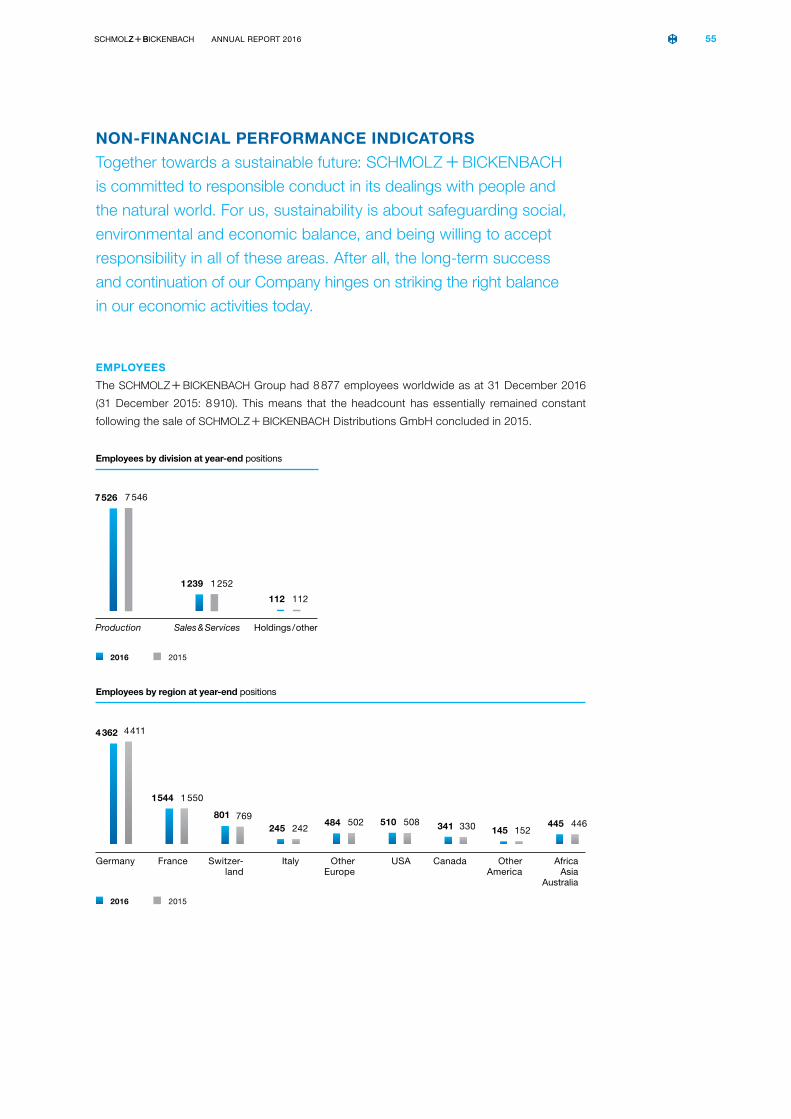
Employees by region at year-end positions
Canada Other America
USAOther Europe
Switzer-land
France Italy Germany Africa Asia
Australia
341 145510
801
1544
484245
4 362
445330 152508502
769
1 550
242
4 411
446
20152016
Employees by division at year-end positions
Production Holdings / other
7 526
112
7 546
Sales & Services
1 239 1 252
112
20152016
NON-FINANCIAL PERFORMANCE INDICATORS
Together towards a sustainable future: S + Bi
is committed to responsible conduct in its dealings with people and
the natural world. For us, sustainability is about safeguarding social,
environmental and economic balance, and being willing to accept
responsibility in all of these areas. After all, the long-term success
and continuation of our Company hinges on striking the right balance
in our economic activities today.
EMPLOYEES
The S+Bi Group had 8 877 employees worldwide as at 31 December 2016
(31 December 2015: 8 910). This means that the headcount has essentially remained constant
following the sale of S+Bi Distributions GmbH concluded in 2015.
S+BI ANNUAL REPORT 2016 55

Employees at closing date five-year overview positions
10 278 10 0959 001 8 910 8 877
2012 2013 2014 2015 2016
The consolidation of S+Bi was driven forward in 2016 by relocating the hold-
ing functions from Düsseldorf to the new Group headquarters in Lucerne. Although a generous
offer was made to all employees in Düsseldorf to relocate to Switzerland, only about 15% accepted
the offer. The resulting challenge of restaffing headquarters was mastered extremely well. In the
meantime, employees from 11 different nations work for S+Bi in Lucerne,
reflecting the cosmopolitan nature of the Company.
In 2016, changes were also seen at DEW. DEW operates in an increasingly competitive market
environment. Changes were made to the organisation to better cope with this challenge. The
underlying goal is, along with the establishment of a sales company on the one hand and a pro-
duction company on the other, to focus more strongly on customer needs and be able to respond
more rapidly to changes in the market.
Health and industrial safety
Health and safety are of very special significance at S+Bi. In 2016 we worked
hard to reach our target of zero industrial accidents in order to raise the safety level for our work-
force for the long-term. As a result, the Lost Time Injury Frequency Rate (LTIFR) sank by 34.0% in
comparison to the prior year.
ENVIRONMENT
Another major pillar of corporate social responsibility at S+Bi is the contin-
uous and sustainable development of our environmental and climate protection activities. That is
why most of our production units use environmental management systems, which are generally
certified to the internationally recognised standard ISO 14001. These days, an energy manage-
ment system is an economic necessity for all production and service processes. The divisions
with particularly energy-intensive processes already use energy management systems certified to
ISO 50001.
MANAGEMENT REPORT NON-FINANCIAL PERFORMANCE INDICATORS56

INNOVATION
Innovation is a major pillar of sustainable and responsible corporate governance. A life without
steel is inconceivable nowadays. Steel is an elementary raw material for the automobile industry.
Although there are already more than 2 300 registered types of steel, each displaying different
characteristics in use and processing, the potential for new steel developments is by no means
exhausted.
S+Bi has successfully modernised the production facilities through targeted
investment in recent years. Working in combination with market-oriented research and devel-
opment institutes, the Group is perfectly equipped to realise customer goals. This includes, for
example, lighter-weight components, high-strength or particularly homogeneous, more easily
processable materials using highly efficient, innovative production processes. The Group’s «Cor-
porate Technical Development» department supports and manages cross-divisional innovation
projects and coordinates the R & D resources of the various Business Units with newly created
online tools and harmonised processes.
In addition, S+Bi is working hard on its administrative processes to make
them more innovative and efficient by applying modern uniform IT systems and applications.
Numerous projects are being implemented throughout the Group.
MEASURES AND PROJECTS
All our Business Units are constantly working on measures and projects that address the issues of
employees, the environment and innovation, which are described below.
Global Safety Day
A group-wide initiative in the field of health and industrial safety involved participation in the Global
Safety Day of the World Steel Association. For this purpose, the issue of crane transport was
reviewed at 50 different production locations spread over 26 countries and associated corrective
measures to improve industrial safety implemented.
Our programmes in the field of health and industrial safety consider issues that are specific to the
location and also issues that are universal to all Business Units, as the following best practices
illustrate.
Hand protection workshop at Swiss Steel and Steeltec
Half of all accidents at the Swiss production units involve hand injuries. In an effort to avoid these
injuries in the future, the officers in charge in Switzerland conducted a hand-protection work-
shop involving a series of activities. The workshop was designed around psychomotor educational
methods to illicit a physical, emotional and cognitive response. Around 90% of the employees
participated in the workshop.
Systematic safety audits at DEW
With its systematic safety audits, DEW has introduced another important tool to reduce acci-
dents. The safety inspections, which had already been conducted in the past, were reinstated and
refined. The safety audits examine individual areas on the basis of a key checklist in order to iden-
tify any room for improvement. These audits and inspections were conducted with the involvement
of all levels of management and resulted in transparent presentation of the findings.
S+BI ANNUAL REPORT 2016 57

Automation and ergonomics at Ugitech
At the end of 2016 Ugitech put its first automated production facility into operation. This unit labels,
packages and loads steel coils onto pallets. The robot performs strenuous and repetitive tasks
for the employees and should help prevent accidents. In addition, a steering committee for ergo-
nomics was set up at Ugitech which prioritises investments that are aimed at improving working
conditions for the workforce. It is hoped that this will lead to a reduction in occupational illnesses
and raise working efficiency.
Improvement in safety levels in working processes and industrial safety at Sales & Services
locations in China
Six tipping machines for handling steel blocks were purchased and put into operation at the pro-
duction units of the Sales & Services locations in China. This removes the need for manual turning.
Using the new crane and tipping machine, both the working process as well as the safety and
ergonomics of the workplace for the employees have been improved.
Industrial safety and occupational health initiatives at Finkl in the US and Canada
At our US and Canadian locations, twenty different initiatives were developed and executed in
order to improve safety for employees and improve working efficiency. For example, at our plant in
Sorel, Canada, a protective system was developed and constructed to prevent falls at the casting
pits in the steelworks. Safety inspections are performed regularly by the management at the Chi-
cago location. The goal is to encourage and motivate employees to observe safety rules.
Investments for the future
The success of S+Bi depends heavily on the performance and skills sets of
its employees. Their motivation and willingness to perform facilitates our ability to change and is
vital to the continued evolution of the Group.
Talent management and development assessments
A development assessment procedure has been installed in order to assess the potential for per-
sonal development. Its objective is to identify potential competencies and develop these in order
to fill vacancies in top management positions.
Introduction of talent management software
A human capital software application was installed in the reporting year in order to enhance the
professionalism of human capital management processes worldwide. Within the next two years
this will be used to install uniform processes for the management of staff performance, talent and
training as well as recruiting.
Training at DEW
The qualification programme at DEW, KarriereWERKSTATT, offers employees a broad spectrum of
courses, seminars, and training sessions, that can be tailored to the individual needs of the respec-
tive divisions. Firstly, the training activities provide for greater transparency in terms of the talent
situation within the Company, secondly, they clarify future personnel development requirements
and thirdly, they contribute to the continuous development of the workforce and the organisation.
Trainee programme at Ugitech
Ugitech took on more than 24 trainees in 2016 in order to provide students practical insight into
professional life and discover new talent for future recruitment.
MANAGEMENT REPORT NON-FINANCIAL PERFORMANCE INDICATORS58

Energy efficiency
Work on the S+Bi network for energy efficiency that was founded in 2007
was intensified in 2016. All production units of the S+Bi Group participate in
this network. The goal of the network is to swap notes on energy saving measures and discuss the
latest technologies for energy efficiency. Most recently, the latest trends and research in thermo-
electric generators and their use in the steel industry were presented.
Innovative production processes
At the Witten rolling mill of DEW quenching lines were put into operation downstream from the hot
rolling process. This effectively combines the processes of rolling and heat treatment. The project
involved the construction and operation of a furnace to precisely heat the steel stock exploiting the
heat remaining in the material after the rolling process followed by a quenching line consisting of a
number of zones in which the bars are precisely cooled by quenching in water.
Swiss Steel was able to reduce the power consumed by the central hydraulics of the continuous
casting plant at the steel works in 2016. At the rolling mill, energy savings were made by using
regenerative drives in the new ring-handing system.
Heat recovery
The «Energy for Geisweid» project was initiated by DEW at its Siegen facility a number of years
ago. The objective of this project is to recover the waste heat from the Siegen steelworks, espe-
cially from the cooling system of the electric arc furnace to power a district heat network for the
neighbourhood, providing both heating and warm water. In a first step, approximately 4 MW in
thermal energy will be tapped from the steelworks.
Swiss Steel has entered into a license agreement with the Lucerne district heating to feed waste
heat into the Emmen Lucerne district heating network. The contract allowing Fernwärme Luzern
AG to establish a control room on the premises of Swiss Steel now allows an additional 7.5 GWh
of waste heat from the rolling mill to be exploited.
Further initiatives
In addition to the larger projects mentioned above a number of smaller measures were imple-
mented in 2016:
> The thermal properties of two aging bogie hearth furnaces were optimised at the foundry in
Krefeld
> The walking beam system in the interim furnace at the rolling mill in Witten was reinsulated
> The lighting system was renovated at two halls at the Hagen facility and converted to LEDs
Consumption of natural gas by the protective gas generator was scaled back by optimising its
controls
> A new lighting system triggered by motion sensors was installed at Finkl Steel along with smart
thermostats
> Two training courses for employees were carried out at Swiss Steel in environmental protection
and fire prevention
> At the Bourg-en-Bresse facility of Ugitech, a new type of lubricant was used to draw wire to
reduce the amount of phosphorous run-off into the ground water
> A number of smaller measures were undertaken at Ugitech to convert the lighting to LED
technology, insulate the buildings, reduce the consumption of compressed air and cut water
consumption with specific water absorption
S+BI ANNUAL REPORT 2016 59

RISK MANAGEMENT
The Group’s risk management provides support in the strategic planning and day-to-day decision-
making to pursue and to manage the Group’s objectives within the set appetite for risk. The risk
management objectives are to detect threats and exploit opportunities at an early stage and
respond in a way that is conducive to achieving strategic goals and continuously increasing the
value of the Company.
A standardised Enterprise Risk Management (ERM) system has been implemented across the
Group to ensure systematic and efficient risk management by means of consistent guidelines. The
ERM is an integral component of the annual strategy process and of the Group’s culture, enabling
risk identification, a comprehensive risk analysis including probability of occurrence, impact mea-
surement, and corresponding mitigating action. The risk management responsibilities are defined
and explained in the Corporate Policy Manual. As part of the evaluation process, the Group con-
sciously enters into appropriate, transparent and manageable risks and does not permit specula-
tion or other high-risk transactions.
Operational management is directly responsible for the early detection, monitoring and commu-
nication of risks, while responsibility for control lies with the Executive Board and ultimately the
Board of Directors. Insurance policies have been taken out for the majority of insurable risks where
this makes commercial sense. As a result the corresponding risks have been transferred to the
insurance companies. Where necessary, preventive measures to avert and avoid loss have been
implemented by the operating entities. Aspects covered by the ERM include currency, interest-rate
and credit risk management. For details of the instruments available for this purpose, please refer
to the information on «Financial Instruments» in note 28 of the notes to the consolidated financial
statements.
The IT landscape is regularly reviewed and adjusted to ensure the professional operation of com-
puter-assisted business processes within the Group and with customers, suppliers and business
partners. Existing data security measures are continually refined to eliminate or at least minimise
the risks associated with IT processes.
Our business performance is strongly influenced by the volatility of commodity and steel prices
and the Group’s economic dependency on the automotive, the mechanical and plant engineering,
and the oil and gas industries. The Group strives to balance risks by continually developing its
broad product portfolio, adopting an international sales focus, diversifying the business portfolio,
focusing on niche products and optimising the supply chain.
OPPORTUNITIES AND RISKS
S + Bi’s central risk management system is
intended to systematically minimise or completely eliminate risks through
appropriate measures. As all business activities are associated with an
element of risk, and in order to best exploit the opportunities that arise
from these, we enter into risks as necessary in a controlled manner.
MANAGEMENT REPORT OPPORTUNITIES AND RISKS60

Internal Audit
Internal Audit is an independent auditing and advisory body. For administrative purposes it is allo-
cated to the portfolio of the Chief Financial Officer (CFO) and receives audit engagements from the
Executive Board and the Audit Committee. An important component of the ERM, Internal Audit
produces risk analyses and assesses the effectiveness and efficiency of the internal control sys-
tems. The Board of Directors and the Audit Committee request periodic reports on ERM results.
In accordance with the audit plan approved by the Executive Board and Audit Committee, Internal
Audit conducted several audits and analyses in the reporting period. These were then discussed
by the Audit Committee, which passed resolutions on any necessary measures and monitored
the implementation of these in cooperation with the responsible Group and Business Unit Heads.
Compliance
The transfer of the Group functions from Germany to Switzerland in 2015 was followed by some
organisational changes. This includes the reorganisation of Corporate Legal, Corporate Compli-
ance as well as Internal Audit. Corporate Compliance was incorporated into Corporate Legal in
the fiscal year 2016, where Corporate Compliance focuses on preventing corruption and anti-
trust issues. The implementation of the Group-wide Compliance Management System progressed
further in 2016. Besides numerous enhanced special classroom training sessions, further Com-
pliance Risk Assessments were performed in 2016. The Group-wide, online-based Compliance
E-Learning-System, which complements the conventional classroom training, was successfully
implemented in the Group’s entities in 2016. Furthermore, the introduction phase of a whistleblower
system – comprising the S+B SpeakUp Line and an ombudsman – was concluded. As in the prior
years, specific compliance audits were performed in 2016. Finally, in 2016, a cross-departmental
Compliance Committee was introduced with the objective to intensify inter disciplinary exchange
with a focus on topics related to compliance.
Internal control system related to preparing the consolidated and separate financial statements
The Board of Directors is responsible for the design, implementation and maintenance of a suit-
able and appropriate internal control system related to the preparation of the consolidated and
separate financial statements. The aim is to ensure that these consolidated and separate financial
statements adhere to the local reporting guidelines and Corporate Policy Manual, present a true
and fair view of the accounting records, assets are safeguarded and proper controls are in place
to prevent and detect fraud.
Allocated to the portfolio of the CFO for administrative purposes, Corporate Accounting is respon-
sible for centrally coordinating the process of preparing the consolidated and separate financial
statements of S+Bi. It issues uniform Group reporting guidelines setting out
requirements for the local entities. These are regularly updated and made available to the relevant
employees on the intranet. In addition, it defines schedules and processes for preparing the con-
solidated financial statements, and monitors their observance.
S+Bi employs a standard software product for the IT side of consolidation
and reporting. Material developments in IFRS, as well as changes to the reporting process or IT
application, are communicated promptly. Where necessary, the relevant employees receive class-
room training. This approach ensures that reporting is of a consistent high quality.
S+BI ANNUAL REPORT 2016 61

Financial reporting is subdivided into separately identifiable sub-processes at each level. Seg-
regation of functions, dual control and clearly defined responsibilities reduce the risk of possible
misstatements in financial reporting. The financial figures supplied by local entities undergo tech-
nical validation before being processed further. Furthermore, Corporate Accounting tests them for
completeness and plausibility by comparing the prior-year, actual and budget figures.
RISK FACTORS – RISK CATEGORIES AND INDIVIDUAL RISKS
Political and regulatory risks
Some of the Group’s business activities depend heavily on the legal and regulatory environment
both nationally and internationally. Changes in submarkets can therefore be associated with risks,
leading to higher costs or other disadvantages. The Company monitors national and European leg-
islative processes via industrial associations and is a proactive voice in consultation procedures,
drawing attention to potential competitive imbalances.
The third EU emissions trading period (2013 – 2020) is expected to result in substantial costs
for electricity and gas suppliers which will be reflected in price increases for consumers.
S+Bi, as an energy-intensive industrial and trading group, faces risk of
damage to the results of operations if the costs cannot be completely passed on to custom-
ers. S+Bi is actively following the discussion via the respective associations
(e.g., International Stainless Steel Forum (ISSF) and World Steel Association (WSA)).
S+Bi operates in an energy-intensive industry. Several of its German entities
are currently entitled to a reduction on the surcharge in accordance with the German Renewable
Energies Act (EEG). In December 2013, the European Commission launched an in-depth inves-
tigation into the Federal Republic of Germany’s EEG for compatibility with EU state aid rules.
Proceedings have since been concluded. The Commission approved the applicable German laws
with certain amendments. At the same time, a revised version of the EEG was issued in Germany,
with new provisions governing the period from 1 January 2015. Our production companies meet
the requirements contained therein and have therefore received the relevant exemption.
Risks relating to the future economic development
The entrepreneurial activity of S+Bi depends on the economic development
not only of international markets but also individual industries. A change in the overall economic
situation is linked to a risk that prices and sales volumes will fluctuate more. S+Bi
employs various measures to counter this risk. Our broad, fragmented industry mix and our
uniquely wide product range and our global positioning ensure good risk diversification. In crisis
situations, this diversified base, coupled with a lean and flexible organisation, allows us to respond
quickly, appropriately and effectively.
The Group’s business performance is strongly influenced by its economic dependency on the
automotive, the mechanical and plant engineering, and the oil and gas industries. We aim to
balance risks by continuously developing our broad product portfolio as well as maintaining an
international sales focus, diversifying the business portfolio, focusing on niche products and opti-
mising the supply chain.
Prices on the sales and procurement markets and energy prices are also of fundamental impor-
tance to S+Bi. We operate a price surcharge system for scrap and alloys
to counteract price fluctuations. We have entered into long-term contracts with the suppliers to
secure gas and electricity prices over time.
MANAGEMENT REPORT OPPORTUNITIES AND RISKS62

Environmental risks
The production processes in our industrial plants are associated with risks of potential environ-
mental pollution. Taking responsibility for protecting the environment and climate is an important
corporate goal for S+Bi . Efficient use of resources and energy, recyclable
products, minimum environmental impact of activities, and open dialogue with neighbours, author-
ities and other stakeholders are the principles that underpin our environmental behaviour. For
further information about environmental and climate protection, please refer to «Environment» on
page 56 of this report.
Risks from IT/security and internal processes
The IT landscape is regularly reviewed and adjusted to ensure the professional operation of com-
puter assisted business processes within the Group and with customers, suppliers and business
partners. Existing data security measures are continually refined to eliminate, or at least minimise,
the risks associated with IT processes.
Personnel risks
S+Bi’s success hinges on the expertise and commitment of its employees. The
major challenge is therefore to recruit and retain qualified specialists. S+Bi
emphasises further education and training as one way to achieve this. For further information
about ongoing employee training and development, please refer to «Non-financial performance
indicators» on page 55 of this report.
In view of demographic developments and the later statutory retirement age in many countries,
it will be increasingly important to have a human resources policy that is aligned to these trends.
Existing structures need to be analysed in this context in order to identify any required action.
Besides the age structure analysis agreed within some collectively bargained wage agreements,
one example is the workplace stress analysis. This process examines individual stressors in the
workplace so that measures can be determined to support ergonomic standards for physical
working conditions, or for ensuring and increasing employee motivation. Ultimately, the key chal-
lenges that we face in the years ahead will be occupational health and industrial safety, age-appro-
priate workplaces, employee retention, and maintaining a motivating corporate culture.
Financial risks
Foreign currency risk
Foreign currency risks arise mainly when trade accounts receivable and payable are settled in for-
eign currencies, future revenue is planned in a foreign currency, or existing or planned fixed-price
commodity supply contracts are in a foreign currency. Currency management is country-specific,
with foreign currency amounts being translated regularly into the respective functional currency,
mainly by means of forward exchange contracts.
Interest rate risk
Interest rate risks arise mainly on interest-bearing liabilities that are denominated in euro. The Exec-
utive Board stipulates an appropriate target ratio of fixed and floating-rate liabilities and monitors
compliance with the target on an ongoing basis. Interest effects are primarily managed through the
composition of financial instruments.
S+BI ANNUAL REPORT 2016 63

Commodity price risk
The commodity price risks result from fluctuations in the prices of energy and commodities required
for steel production. Fluctuations in commodity prices can usually be passed on to customers in
the form of alloy surcharges. Where this is not possible, commodity derivative instruments are
used to hedge some of the risk. Currently, these mainly comprise forward exchange contracts for
nickel. S+Bi receives payments depending on the nickel price development,
and is therefore protected against price increases.
Credit risk
Credit risks are mainly linked to trade accounts receivable, bank balances, guarantees and deriv-
ative financial instruments. In view of the broadly diversified customer base, which spans a variety
of regions and industries, the credit risk on trade accounts receivable is limited. Moreover, some of
the trade accounts receivable are covered by credit insurance with varying deductibles.
To mitigate credit risks from operating activities, transactions with external business partners are
safeguarded either by trade credit insurance or by conducting internal credit checks and a credit
approval process. A credit risk limit is set for each contractual partner based on the internal credit
check. Each subsidiary is essentially responsible for setting and monitoring its own limits, with
various approval processes applicable depending on the credit limit. In addition, the credit and
collection policies of the local entities are captured by the internal control system and are therefore
audited periodically by Internal Audit.
All of the banks with which S+Bi maintains business relationships have good
credit ratings considering the prevailing market conditions and are in most cases members of
deposit guarantee funds. Derivative financial instruments are only entered into with these banks.
Liquidity risk
The Group ensures solvency at all times through a largely centralised cash management system.
This involves preparing liquidity plans comparing all the anticipated cash receipts and cash out-
flows for a specified time period. In addition, balances and irrevocable credit facilities are held
with banks as liquidity reserves. Financial covenants in most of our financing agreements are one
potential source of liquidity risk and are tested for compliance at the end of each quarter. Although
compliance with the covenants is monitored on an ongoing basis, they depend on a large number
of external factors, especially the general economic development. As such, they are not entirely
within our control. Depending on the financing agreement in question, failure to comply with the
covenants can lead to a substantial increase in financing costs or trigger an obligation to settle all
or part of the relevant financial liabilities.
MANAGEMENT REPORT OPPORTUNITIES AND RISKS64

OPPORTUNITY MANAGEMENT
From its starting point as a collection of complementary companies, the Group became increas-
ingly cohesive between 2003 and 2016. The Group’s market success is attributable in no small
way to its consistent and systematic strategy process, which is managed and supported by the
Board of Directors, Executive Board and Corporate Business Development. We collect and anal-
yse information about the market, production, and research and development both at division level
and centrally from a Group perspective as the basis for strategic decision-making. This allows
well-informed strategic decisions to be taken at Group level and then implemented in cooperation
with the Business Unit Heads. Our approach allows us to derive opportunities for our Company
from the risks inherent in all business activities.
Opportunities and potential for increasing the value of the Company
With global growth driven by factors such as increasing urbanisation and mobility,
S+Bi can expect many strategic and operational opportunities in the coming
years. We already offer the appropriate products for these markets. At the same time, efficient
use of resources will move up corporate agendas, creating demand for materials with increasingly
sophisticated technical qualities. The process of adapting and optimising our high-tech materials
is an ongoing one as customers demand lighter and more stress-resilient products. In the last few
years, S+Bi has evolved from a medium-sized company into an international
leader in the special long steel segment. The Group’s economic success is founded on its ability
to identify opportunities in market and technological trends, and develop operational strategies
based on these. This approach is a key component of the Group-wide strategic dialogue and con-
sists of three strategic moves: long-term systematic market observation and analysis; refinement of
the industrial production basis and employee development; consistent application-relevant align-
ment of our product development activities.
As a unique full-range supplier with a broad portfolio of highly sophisticated products, we consider
ourselves well positioned to serve both growth markets and technically demanding segments.
Our business model is aligned to the constantly evolving demands of steel products. With such
an application-driven strategy, we detect trends as they emerge, offering customised solutions in
response. We track these trends through long-term and systematic analysis of developments in
our sales industries. We work closely with research and development teams to constantly opti-
mise production processes and the product portfolio, ensuring they are adapted to meet future
challenges at all times.
S+BI ANNUAL REPORT 2016 65

This section contains forward-looking statements, including presentations of developments, plans,
intentions, assumptions, expectations, beliefs and potential impacts or descriptions of future
events, income, results, situations or outlook. They are based on the Company’s current expecta-
tions, beliefs and assumptions, which are subject to uncertainty and may differ materially from the
current facts, situation, impact or developments.
Macroeconomic environment dominated by political events
After a cooling-off period in the second half of 2015, the global economy remained sluggish in
2016, recovering only slightly. In light of the modest economic growth, the European Central Bank
(ECB) and the Federal Reserve left the gates on the money supply wide open. However, this only
provided very little growth stimulus. Political uncertainties in the USA and in Europe – the Brexit
referendum in particular – recessionary trends in some emerging markets, and a dent in the
growth curve of China necessitated constant downwards adjustments to the forecasts made at
the beginning of the year. Political developments around the globe are likely to have a major
influence on 2017 as well. It is uncertain what impact a possible change in course taken by the new
US government will have on the global economy. In Europe, other changes are expected in addi-
tion to the implementation of Brexit. The new government in Italy will have to prove whether it can
bring the ailing economy back to growth. The Netherlands will elect a new parliament in March and
France will hold both presidential and parliamentary elections between April and June. Finally, a
new parliament will also be elected in Germany in autumn, with the ensuing decision on who will
be the Chancellor of Europe’s largest economy for the coming four years.
At the beginning of the year, the economic experts at the World Bank, the OECD and the Interna-
tional Monetary Fund forecast growth rates for 2017 of between 2.7% and 3.4%. Rising interest
rates in the USA indicate that significantly higher growth is expected under the new government in
the USA than in Europe. The weaker currency could stimulate European exports and thus acce-
lerate growth. Emerging markets are expected to see average growth of 4.7%, much higher than
the industrial nations. The economic experts forecast growth of 2.3% for the USA and growth of
1.5% for the eurozone. Economic output in Germany is likely to expand at the same rate as the
eurozone average of 1.5%.
OUTLOOK
Our long-term goal is to create a robust, profitable, innovative and
global group for special long steel.
MANAGEMENT REPORT OUTLOOK66

Disparate trends in the most significant industrial sectors are expected
The boom in the automobile industry continued worldwide in 2016, despite a number of sceptical
voices to the contrary. The outlook for 2017 is more reserved, with a slowdown expected in the
automobile sector, particularly in Europe. Nevertheless, we expect to see robust demand for our
products from this sector in the fiscal year 2017. The engineering sector stagnated in 2016 due
to a lack of stimulus from the global economy. For 2017 some experts are anticipating an end to
the stagnation which, in light of the uncertainties described above, gives us cause for optimism.
From todays perspective, we believe that the more realistic scenario is for the economy to flat-line
at current levels. The energy sector, by contrast, bottomed out in 2016 when oil and gas prices
reached their lowest point. Likewise, investments in renewable energy generation using solar and
wind are on the up. This is likely to lead to solid demand in this sector, albeit from a low base line.
In sum we are forecasting a slightly more favourable business environment in comparison to the
prior year, even if the most important sectors we serve see less growth.
Outlook for 2017 for the S+BI Group
The Company has made further progress in 2016 and is now on a more stable operating and
financial foundation than it was at the end of last year. Structural measures and cost savings mean
that a lower level of revenue is needed to break even. Consequently, a clear rise in profitability was
achieved despite a significant decline in sales. This largely cushioned us from the negative conse-
quences of falling commodity prices in the first half of the year, the sustained slump in the oil and
gas industry, greater competition, particularly from imports, and a general downturn in demand.
In 2017 we plan to capitalise on what we have already established and focus our sights on expan-
ding our own strengths. We will bring the restructuring of Deutsche Edelstahlwerke and other
measures to a successful conclusion – for example, closing down production in Boxholm, Sweden.
We will make targeted investments to improve our innovative strengths and technology leadership
and align the Company more closely to the market. And last but not least, we will keep a strict
focus on cost discipline.
In the medium term, we aim to develop S+BI into an innovative, sustainably
profitable company with a high share of special long steel products which is widely diversified
across all relevant geographic areas and end markets and offers its customers high-quality stan-
dard products as well as made-to-measure solutions. Our medium-term financial goals include an
adjusted EBITDA margin of > 8% on average over an economic cycle as well as adjusted EBITDA
leverage of < 2.5.
S+BI ANNUAL REPORT 2016 67


![S N¬ h SN¤ 13S÷~¿bi ýcÐSG]åz s¯X qTÍb¥TJNf 环境影响报告书 · S N¬ h SN¤ 13S÷~¿bi ýcÐSG]åz s¯X _qTÍb¥TJNf S N¬ h SN¤ 13S÷~¿bi ýcÐSG]åz s¯X _qTÍb¥TJNf](https://img.pdfslide.us/doc/110x75/5f40f9b3dd36783d75148837/s-n-h-sn-13sbi-csgz-sx-qtbtjnf-cf-s-n.jpg)