Embed Size (px)
Citation preview
Dutch financing of food companies
A research paper prepared for Oxfam Novib
Dutch financing of food companies
A research paper prepared for Oxfam Novib
Jan Willem van GelderHassel Kroes
10 September 2013
Naritaweg 101043 BX AmsterdamThe NetherlandsTel: +31-20-8208320E-mail: [email protected]: www.profundo.nl
Contents
Summary...................................................................................................................... iIntroduction................................................................................................................1Chapter 1 Methodology....................................................................................2
1.1 Research objective.....................................................................................21.2 Selection of financial institutions.............................................................21.3 Selection of food companies....................................................................21.4 Forms of financing researched.................................................................31.5 Research period and threshold................................................................41.6 Information sources and estimates used................................................4
Chapter 2 ABN Amro.........................................................................................52.1 Shareholdings............................................................................................52.2 Share issuances.........................................................................................52.3 Bondholdings.............................................................................................52.4 Bond issuances..........................................................................................52.5 Loans...........................................................................................................5
Chapter 3 ABP...................................................................................................73.1 Shareholdings............................................................................................73.2 Share issuances.........................................................................................73.3 Bondholdings.............................................................................................73.4 Bond issuances..........................................................................................83.5 Loans...........................................................................................................8
Chapter 4 Aegon................................................................................................94.1 Shareholdings............................................................................................94.2 Share issuances.......................................................................................104.3 Bondholdings...........................................................................................104.4 Bond issuances........................................................................................114.5 Loans.........................................................................................................12
Chapter 5 ING..................................................................................................135.1 Shareholdings..........................................................................................135.2 Share issuances.......................................................................................145.3 Bondholdings...........................................................................................145.4 Bond issuances........................................................................................165.5 Loans.........................................................................................................17
Chapter 6 Pensioenfonds Zorg en Welzijn (PfZW).......................................216.1 Shareholdings..........................................................................................216.2 Share issuances.......................................................................................216.3 Bondholdings...........................................................................................216.4 Bond issuances........................................................................................22
6.5 Loans.........................................................................................................22
Chapter 7 Rabobank.......................................................................................237.1 Shareholdings..........................................................................................237.2 Share issuances.......................................................................................237.3 Bondholdings...........................................................................................237.4 Bond issuances........................................................................................237.5 Loans.........................................................................................................25
Appendix 1 References.....................................................................................30
Summary
This report provides an insight in the financial relationships between six Dutch financial institutions (including their subsidiaries) and 22 food producers and processors since 1 July 2010: 10 international food companies, which are included in Oxfam’s Behind the Brands campaign, as well as 12 major palm oil, soy and sugar traders. The research focussed on six Dutch financial institutions:
ABN Amro ABP Aegon ING Pensioenfonds Zorg en Welzijn (PfZW) Rabobank
We searched and identified all shares and bonds issued by the 22 food companies which are held by investment funds managed by the Dutch financial institutions and their subsidiaries at present (above the threshold of € 1 million). Moreover, we have researched the involvement of Dutch financial institutions in issuances of shares and bonds by these companies since 1 July 2010. Finally we identified all loans provided by Dutch financial institutions to companies on our list since 1 July 2010.
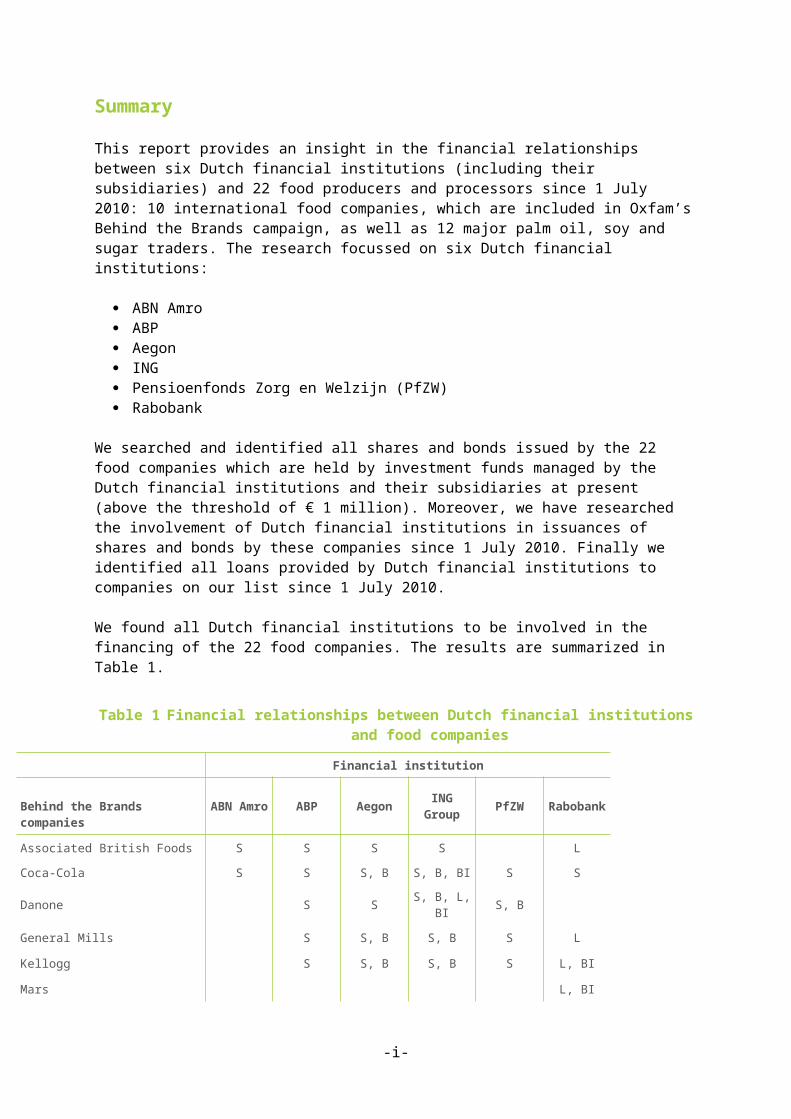
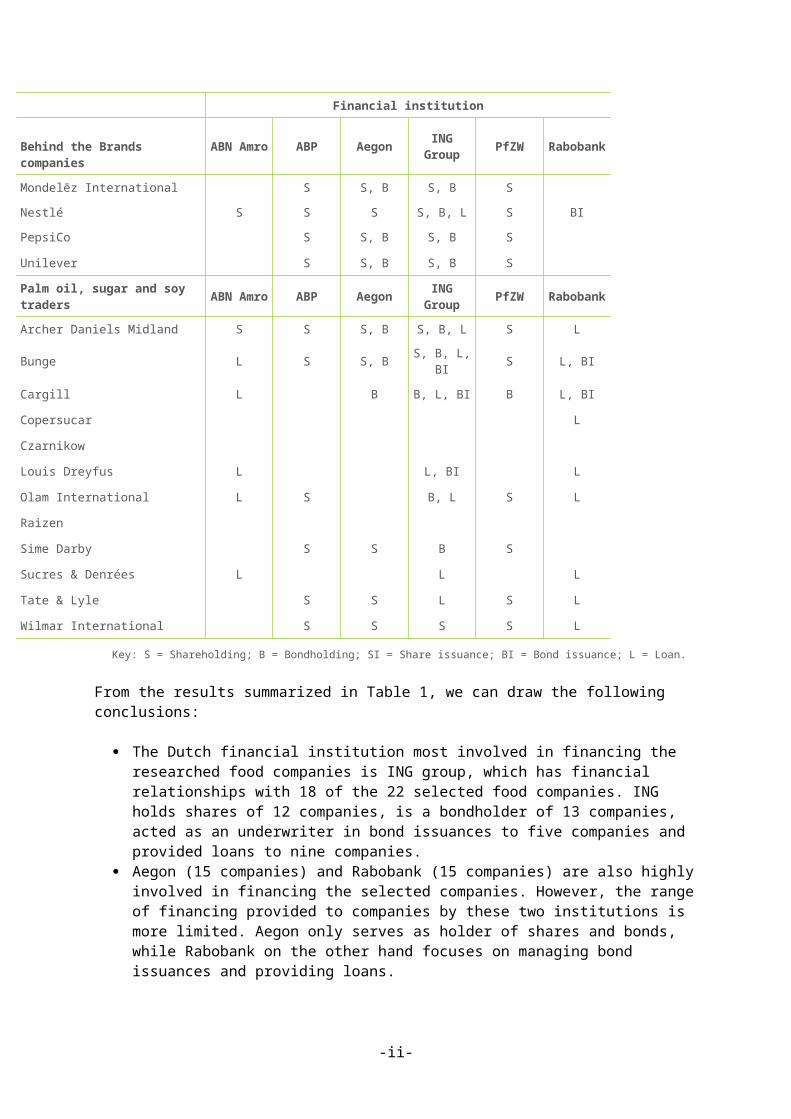
We found all Dutch financial institutions to be involved in the financing of the 22 food companies. The results are summarized in Table 1.
Table 1 Financial relationships between Dutch financial institutions and food companies
Financial institution
Behind the Brands companiesABN Amro ABP Aegon ING
Group PfZW Rabobank
Associated British Foods S S S S L
Coca-Cola S S S, B S, B, BI S S
Danone S S S, B, L, BI S, B
General Mills S S, B S, B S L
Kellogg S S, B S, B S L, BI
Mars L, BI
Mondelēz International S S, B S, B S
Nestlé S S S S, B, L S BI
PepsiCo S S, B S, B S
Unilever S S, B S, B S
Palm oil, sugar and soy traders ABN Amro ABP Aegon ING
Group PfZW Rabobank
Archer Daniels Midland S S S, B S, B, L S L
Bunge L S S, B S, B, L, BI S L, BI
Cargill L B B, L, BI B L, BI
Copersucar L
Czarnikow
Louis Dreyfus L L, BI L
-i-
Financial institution
Behind the Brands companiesABN Amro ABP Aegon ING
Group PfZW Rabobank
Olam International L S B, L S L
Raizen
Sime Darby S S B S
Sucres & Denrées L L L
Tate & Lyle S S L S L
Wilmar International S S S S L
Key: S = Shareholding; B = Bondholding; SI = Share issuance; BI = Bond issuance; L = Loan.
From the results summarized in Table 1, we can draw the following conclusions:
The Dutch financial institution most involved in financing the researched food companies is ING group, which has financial relationships with 18 of the 22 selected food companies. ING holds shares of 12 companies, is a bondholder of 13 companies, acted as an underwriter in bond issuances to five companies and provided loans to nine companies.
Aegon (15 companies) and Rabobank (15 companies) are also highly involved in financing the selected companies. However, the range of financing provided to companies by these two institutions is more limited. Aegon only serves as holder of shares and bonds, while Rabobank on the other hand focuses on managing bond issuances and providing loans.
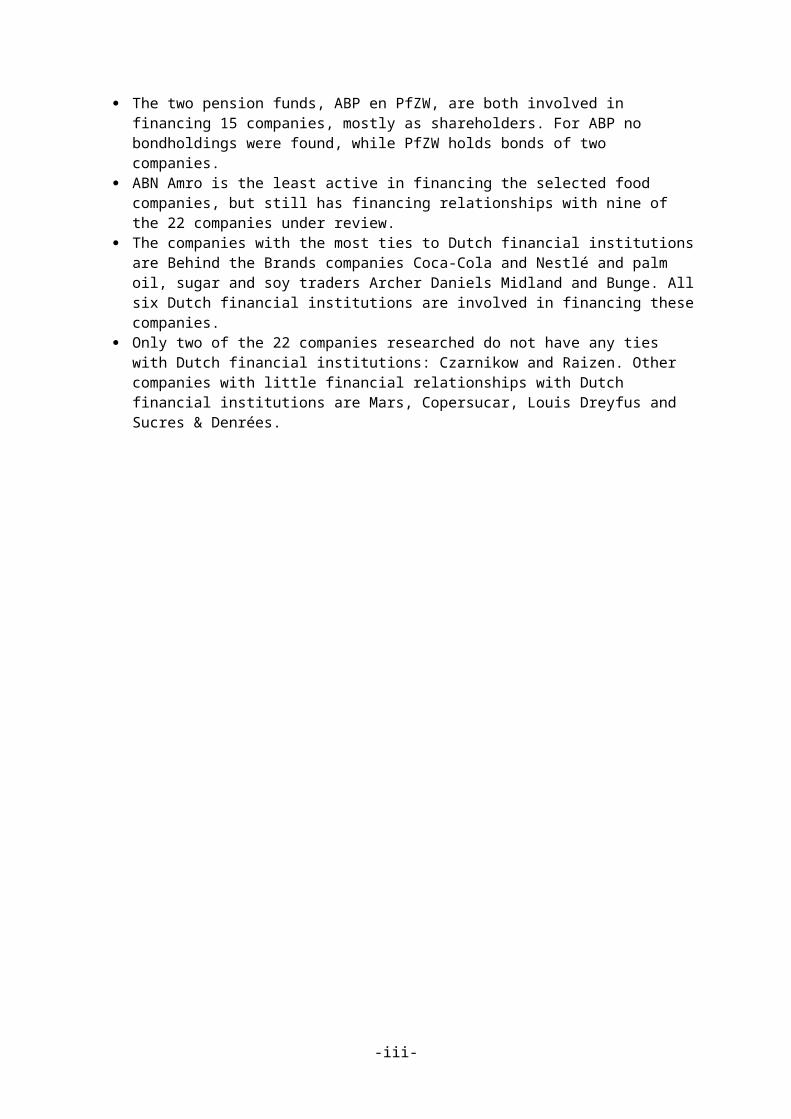
The two pension funds, ABP en PfZW, are both involved in financing 15 companies, mostly as shareholders. For ABP no bondholdings were found, while PfZW holds bonds of two companies.
ABN Amro is the least active in financing the selected food companies, but still has financing relationships with nine of the 22 companies under review.
The companies with the most ties to Dutch financial institutions are Behind the Brands companies Coca-Cola and Nestlé and palm oil, sugar and soy traders Archer Daniels Midland and Bunge. All six Dutch financial institutions are involved in financing these companies.
Only two of the 22 companies researched do not have any ties with Dutch financial institutions: Czarnikow and Raizen. Other companies with little financial relationships with Dutch financial institutions are Mars, Copersucar, Louis Dreyfus and Sucres & Denrées.
-ii-
Introduction
This report provides an insight in the financial relationships between six Dutch financial institutions (including their subsidiaries) and 22 food producers and processors since 1 July 2010: 10 international food companies, which are included in Oxfam’s Behind the Brands campaign, as well as 12 major palm oil, soy and sugar traders. The research focussed on six Dutch financial institutions:
ABN Amro ABP Aegon ING Pensioenfonds Zorg en Welzijn (PfZW) Rabobank
We searched and identified all shares and bonds issued by the 22 food companies which are held by investment funds managed by the Dutch financial institutions and their subsidiaries at present. Moreover, we have researched the involvement of Dutch financial institutions in issuances of shares and bonds by these companies since 1 July 2010. Finally we identified all loans provided by Dutch financial institutions to companies on our list since 1 July 2010.
This report is structured as follow: Chapter 1 describes the methodology used. Chapter 2 until Chapter 7 describes the findings on financial relationships between the six financial institutions and the 22 food companies in detail, in individual chapters for each financial institution. A summary of the findings of this report can be found on the first pages of this report.
-1-
Chapter 1 Methodology
1.1 Research objective
The purpose of this study is to provide an overview of the financial relationships between six Dutch financial institutions and 22 companies in the international food industry in the past three years (since 1 July 2010).
1.2 Selection of financial institutions
The six Dutch financial institutions, including their subsidiaries, are researched:
ABN Amro ABP Aegon ING Pensioenfonds Zorg en Welzijn (PfZW) Rabobank
1.3 Selection of food companies
The following 10 international food companies, which are included in Oxfam’s Behind the Brands campaign, are included in the analysis:
Associated British Foods (ABF) United Kingdom Coca-Cola United States Danone France General Mills United States Kellogg United States Mars United States Mondelēz International United States Nestlé Switzerland PepsiCo United States Unilever United Kingdom/Netherlands
Additionally, the following 12 palm oil, soy and sugar traders are also included in the analysis:
Archer Daniels Midland (ADM) United States Bunge United States Cargill United States Copersucar Brazil Czarnikow United Kingdom Louis Dreyfus France Olam International Singapore Raizen Brazil Sime Darby Malaysia Sucres & Denrées (Sucden) France Tate & Lyle United Kingdom Wilmar International Singapore
-2-
1.4 Forms of financing researched
The 6 selected financial institutions can be involved in the financing of the 22 selected companies by providing corporate loans, by assisting companies with share- and bond issuances, and by (managing) investments in shares and bonds of these companies. Below, these financing categories are discussed in more detail:
Corporate loans: The easiest way to obtain debt is to borrow money. In most cases, money is borrowed from commercial banks. Loans can be either short-term or long-term in nature. Short-term loans (including trade credits, current accounts, leasing agreements, et cetera) have a maturity of less than a year. They are mostly used as working capital for day-to-day operations. Short-term debts are often provided by a single commercial bank, which does not ask for substantial guarantees from the company.A long-term loan has a maturity of at least one year, but generally of three to ten years. Long-term corporate loans are in particular useful to finance expansion plans, which only generate rewards after some period of time. The proceeds of corporate loans can be used for all activities of the company. Often long-term loans are extended by a loan syndicate, which is a group of banks brought together by one or more arranging banks. The loan syndicate will only undersign the loan agreement if the company can provide certain guarantees that interest and repayments on the loan will be fulfilled.
Share issuances: Issuing shares on the stock exchange gives a company the opportunity to increase its equity by attracting a large number of new shareholders or increase the equity from its existing shareholders. These shareholders can be private investors as well as institutional investors.When it’s the first time a company offers its shares on the stock exchange, this is called an Initial Public Offering (IPO). When a company’s shares are already traded on the stock exchange, this is called a secondary offering of additional shares.To arrange an IPO or a secondary offering, a company needs the assistance of one or more (investment) banks, which will promote the shares and find shareholders. The role of investment banks in this process therefore is very important.
Bond issuances: Issuing bonds can best be described as cutting a large loan into small pieces, and selling each piece separately. Bonds are issued on a large scale by governments, but also by corporations. Like shares, bonds are traded on the stock exchange. Bonds are sold on the capital market, to private investors as well as institutional investors. Banks rarely buy any bonds. But to issue bonds, a company needs the assistance of one or more (investment) banks which underwrite a certain amount of the bonds. Underwriting is in effect buying with the intention of selling to investors. Still, in case the investment bank fails to sell all bonds it has underwritten, it will end up owning the bonds.
(Managing) investments in shares: Financial institutions can, through the funds they are managing, buy shares of a certain company. This provides the company with new equity, and gives the financial institution a direct influence on the company’s strategy. The magnitude of this influence depends on the size of the shareholding.
(Managing) investments in bonds: Like shares, financial institutions and private investors can buy bonds of a certain company. The main difference between owning shares and bonds is that owner of a bond is not a co-owner of the issuing company; the owner is a creditor of the company. The buyer of each bond is entitled to repayment after a certain number of years, and to a certain interest during each of these years.
-3-
1.5 Research period and threshold
This report analyses the following forms of financing:
Loans, credits and project financing (since 1 July 2010); Underwriting share and bond issuances (since 1 July 2010); Investments in shares and bonds (holdings at most recent reporting date).
Investments of (subsidiaries of) the Dutch financial institutions which are below the threshold of € 1 million are not reported.
1.6 Information sources and estimates used
The financial links between financial institutions and the selected companies are found by researching annual reports, stock exchange filings and relevant publications of the companies, archives of trade magazines, local newspapers, financial press as well as specialized financial databases (Thomson ONE Banker, Bloomberg). All sources are clearly referenced at the end of the report.
If for loans and underwritings of shares or bonds the amounts committed or underwritten per financial institution are unknown, these are estimated by using the following rules of thumb:
In the case of loans (corporate loans or revolving credit facilities), 40% of the total amount is committed by bookrunners and 60% by other participants of the syndicate. If, however, the amount of bookrunners is (almost) equal to, or higher than, the amount of participants, the reverse is used: 60% for the bookrunners and 40% for the arrangers.
In the case of share- and bond issuances, 75% of the total amount is committed by bookrunners and 25% by other participants of the syndicate. The amount provided by bookrunners should always be higher than the amount provided by participants.
In the case of share and bondholdings, the amounts are always known, so no estimate was needed.
For share and bondholdings the most recent figures are listed. In the case of shareholdings, some companies have two types of shares: ordinary shares and Depository Receipts (DRs). DRs are shares which are traded on a local stock exchange but represent a foreign company’s publicly traded shares. One of the most common types of DRs is the American Depositary Receipt (ADR), which represents a specific number of shares of a foreign stock traded on a U.S. stock exchange. If companies have two types of shares, we added the value of both types of shares.
-4-
Chapter 2 ABN Amro
2.1 Shareholdings
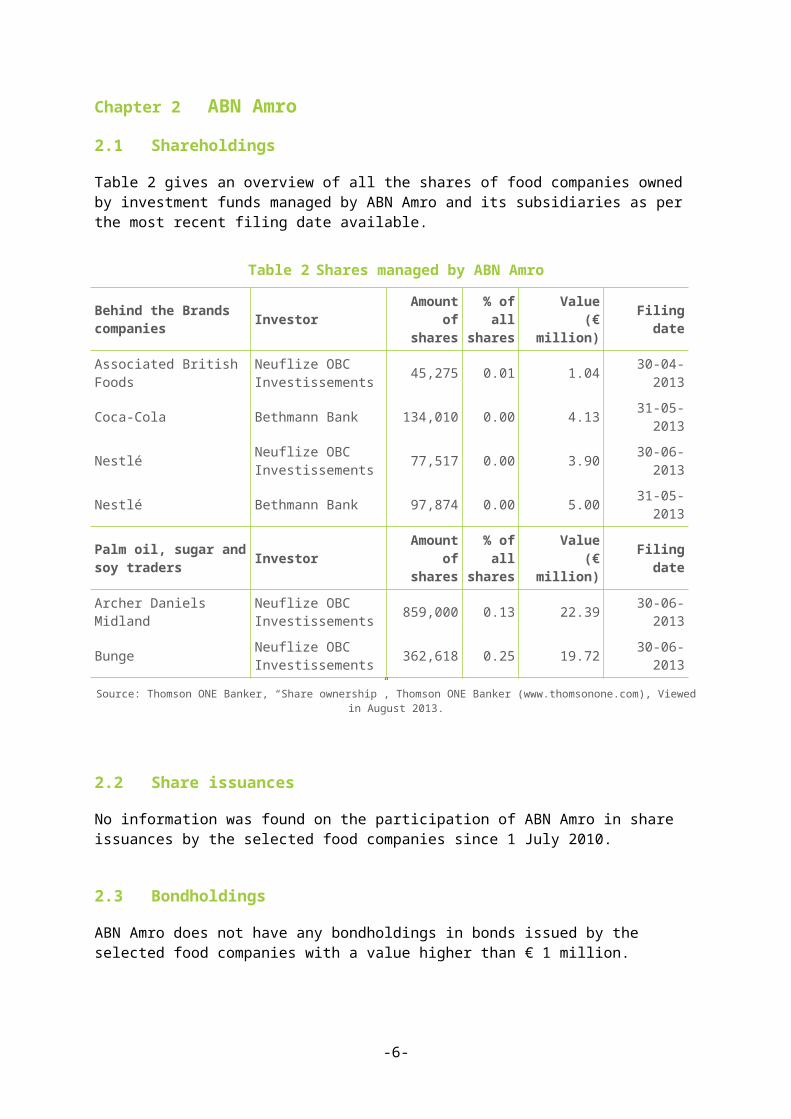
Table 2 gives an overview of all the shares of food companies owned by investment funds managed by ABN Amro and its subsidiaries as per the most recent filing date available.
Table 2 Shares managed by ABN Amro
Behind the Brands companies Investor Amount of
shares% of all shares
Value (€ million) Filing date
Associated British Foods Neuflize OBC Investissements 45,275 0.01 1.04 30-04-2013
Coca-Cola Bethmann Bank 134,010 0.00 4.13 31-05-2013
Nestlé Neuflize OBC Investissements 77,517 0.00 3.90 30-06-2013
Nestlé Bethmann Bank 97,874 0.00 5.00 31-05-2013
Palm oil, sugar and soy traders Investor Amount of
shares% of all shares
Value (€ million) Filing date
Archer Daniels Midland Neuflize OBC Investissements 859,000 0.13 22.39 30-06-2013
Bunge Neuflize OBC Investissements 362,618 0.25 19.72 30-06-2013
Source: Thomson ONE Banker, “Share ownership”, Thomson ONE Banker (www.thomsonone.com), Viewed in August 2013.
2.2 Share issuances
No information was found on the participation of ABN Amro in share issuances by the selected food companies since 1 July 2010.
2.3 Bondholdings
ABN Amro does not have any bondholdings in bonds issued by the selected food companies with a value higher than € 1 million.
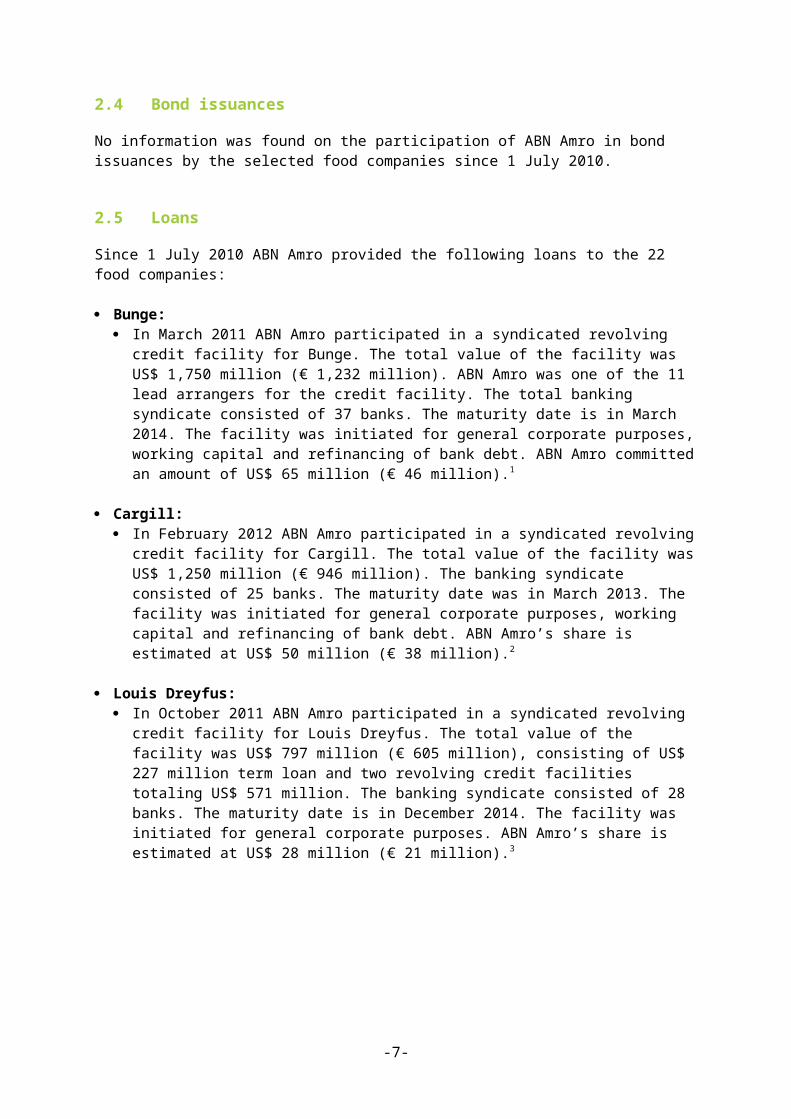
2.4 Bond issuances
No information was found on the participation of ABN Amro in bond issuances by the selected food companies since 1 July 2010.
2.5 Loans
Since 1 July 2010 ABN Amro provided the following loans to the 22 food companies:
Bunge:
-5-
In March 2011 ABN Amro participated in a syndicated revolving credit facility for Bunge. The total value of the facility was US$ 1,750 million (€ 1,232 million). ABN Amro was one of the 11 lead arrangers for the credit facility. The total banking syndicate consisted of 37 banks. The maturity date is in March 2014. The facility was initiated for general corporate purposes, working capital and refinancing of bank debt. ABN Amro committed an amount of US$ 65 million (€ 46 million).1
Cargill: In February 2012 ABN Amro participated in a syndicated revolving credit facility for
Cargill. The total value of the facility was US$ 1,250 million (€ 946 million). The banking syndicate consisted of 25 banks. The maturity date was in March 2013. The facility was initiated for general corporate purposes, working capital and refinancing of bank debt. ABN Amro’s share is estimated at US$ 50 million (€ 38 million).2
Louis Dreyfus: In October 2011 ABN Amro participated in a syndicated revolving credit facility for
Louis Dreyfus. The total value of the facility was US$ 797 million (€ 605 million), consisting of US$ 227 million term loan and two revolving credit facilities totaling US$ 571 million. The banking syndicate consisted of 28 banks. The maturity date is in December 2014. The facility was initiated for general corporate purposes. ABN Amro’s share is estimated at US$ 28 million (€ 21 million).3
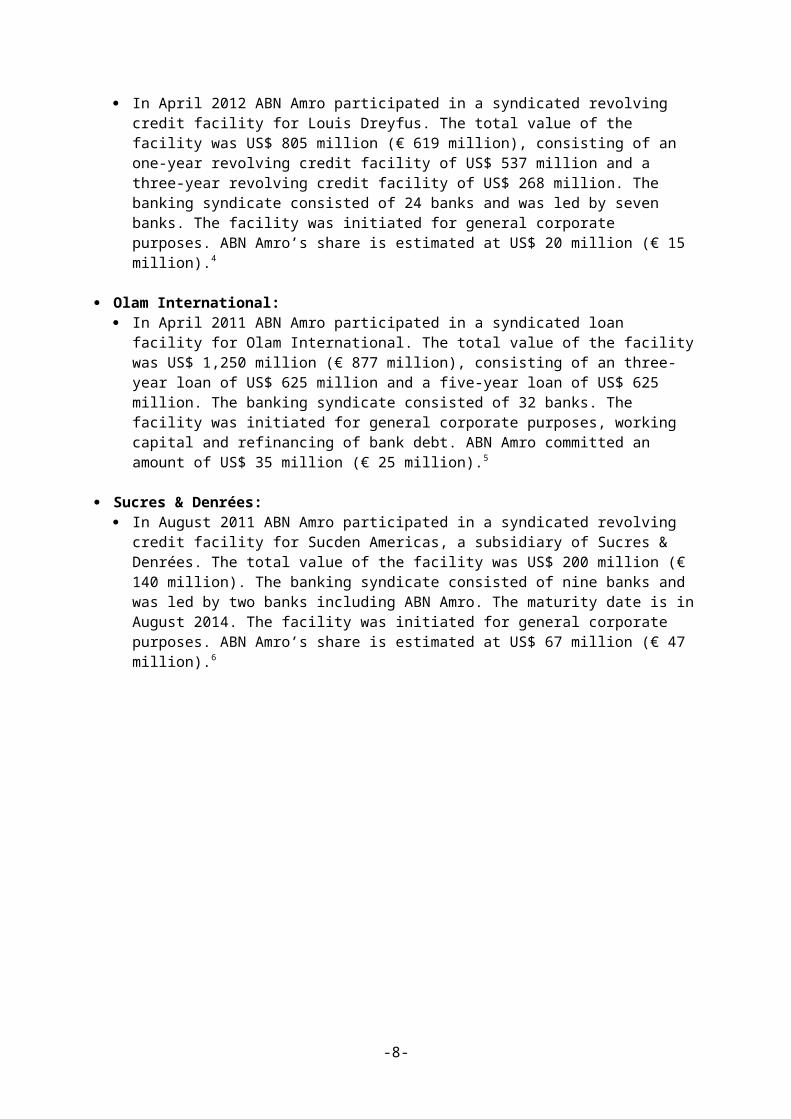
In April 2012 ABN Amro participated in a syndicated revolving credit facility for Louis Dreyfus. The total value of the facility was US$ 805 million (€ 619 million), consisting of an one-year revolving credit facility of US$ 537 million and a three-year revolving credit facility of US$ 268 million. The banking syndicate consisted of 24 banks and was led by seven banks. The facility was initiated for general corporate purposes. ABN Amro’s share is estimated at US$ 20 million (€ 15 million).4
Olam International: In April 2011 ABN Amro participated in a syndicated loan facility for Olam International.
The total value of the facility was US$ 1,250 million (€ 877 million), consisting of an three-year loan of US$ 625 million and a five-year loan of US$ 625 million. The banking syndicate consisted of 32 banks. The facility was initiated for general corporate purposes, working capital and refinancing of bank debt. ABN Amro committed an amount of US$ 35 million (€ 25 million).5
Sucres & Denrées: In August 2011 ABN Amro participated in a syndicated revolving credit facility for
Sucden Americas, a subsidiary of Sucres & Denrées. The total value of the facility was US$ 200 million (€ 140 million). The banking syndicate consisted of nine banks and was led by two banks including ABN Amro. The maturity date is in August 2014. The facility was initiated for general corporate purposes. ABN Amro’s share is estimated at US$ 67 million (€ 47 million).6
-6-
Chapter 3 ABP
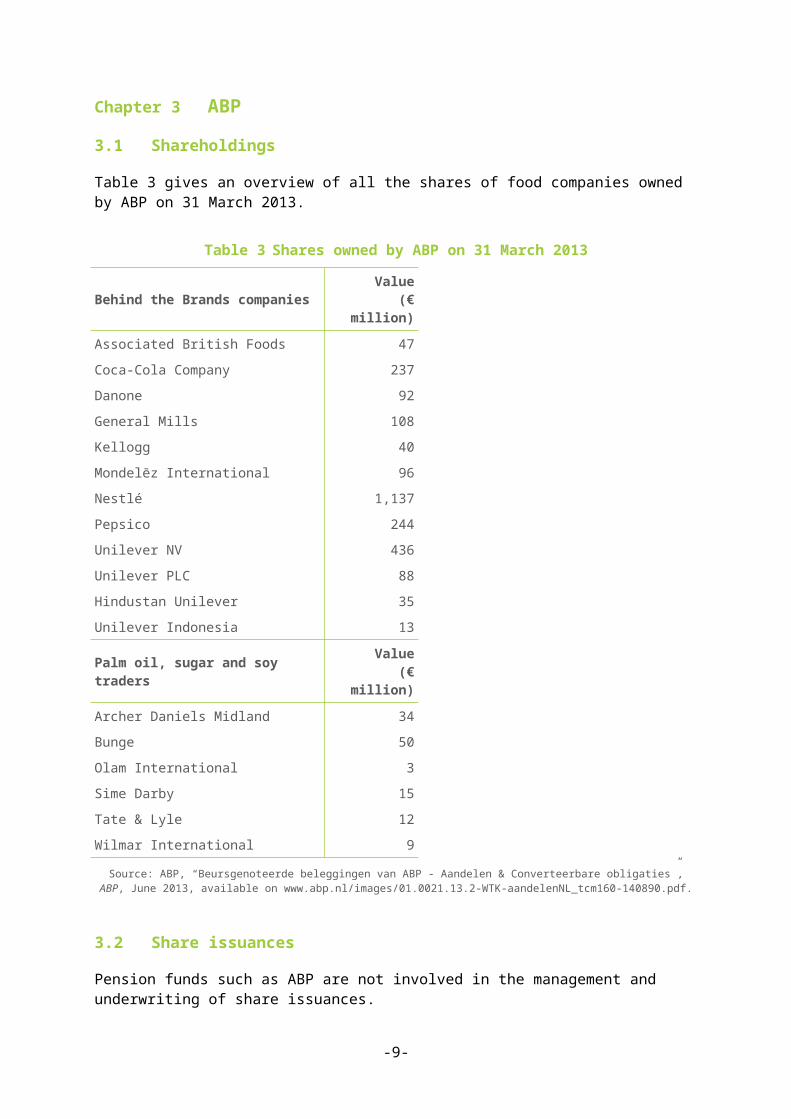
3.1 Shareholdings
Table 3 gives an overview of all the shares of food companies owned by ABP on 31 March 2013.
Table 3 Shares owned by ABP on 31 March 2013
Behind the Brands companies Value (€ million)
Associated British Foods 47
Coca-Cola Company 237
Danone 92
General Mills 108
Kellogg 40
Mondelēz International 96
Nestlé 1,137
Pepsico 244
Unilever NV 436
Unilever PLC 88
Hindustan Unilever 35
Unilever Indonesia 13
Palm oil, sugar and soy traders Value (€ million)
Archer Daniels Midland 34
Bunge 50
Olam International 3
Sime Darby 15
Tate & Lyle 12
Wilmar International 9
Source: ABP, “Beursgenoteerde beleggingen van ABP - Aandelen & Converteerbare obligaties”, ABP, June 2013, available on www.abp.nl/images/01.0021.13.2-WTK-aandelenNL_tcm160-140890.pdf.
3.2 Share issuances
Pension funds such as ABP are not involved in the management and underwriting of share issuances.
3.3 Bondholdings
No information was found on bondholdings by ABP of bonds issued by the selected food companies.
-7-
3.4 Bond issuances
Pension funds such as ABP are not involved in the management and underwriting of bond issuances.
3.5 Loans
Pension funds such as ABP are not involved in providing loans to companies.
-8-
Chapter 4 Aegon
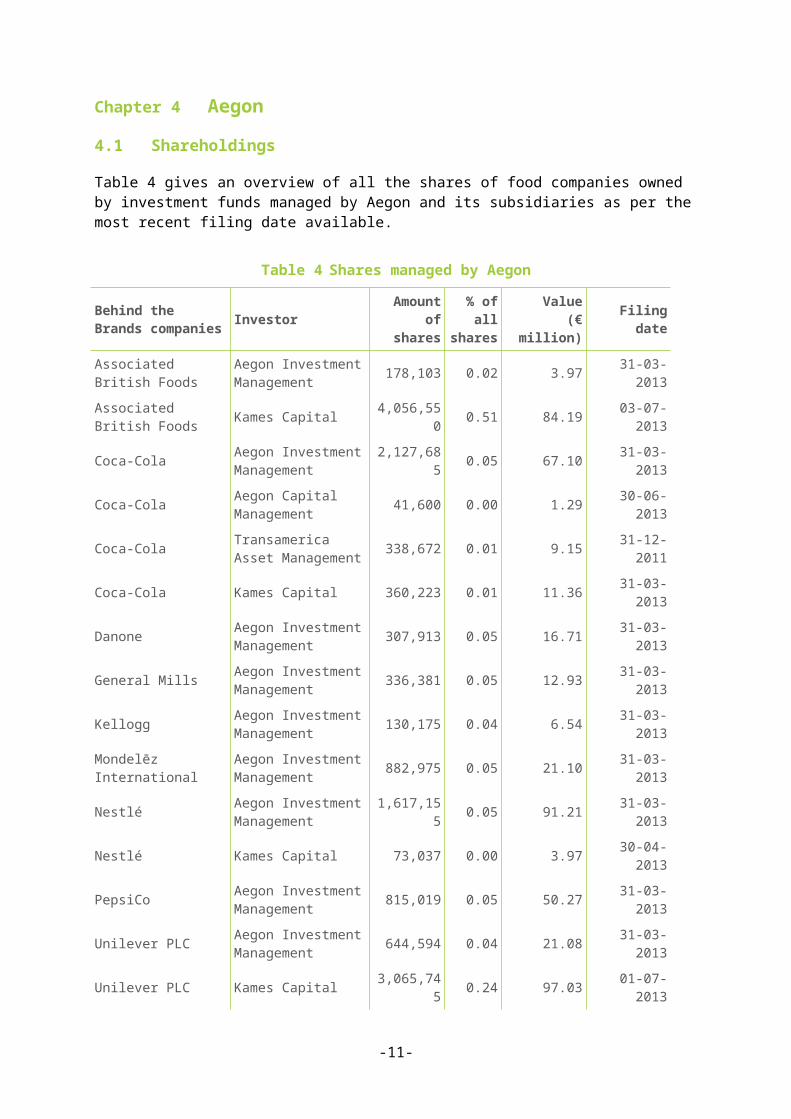
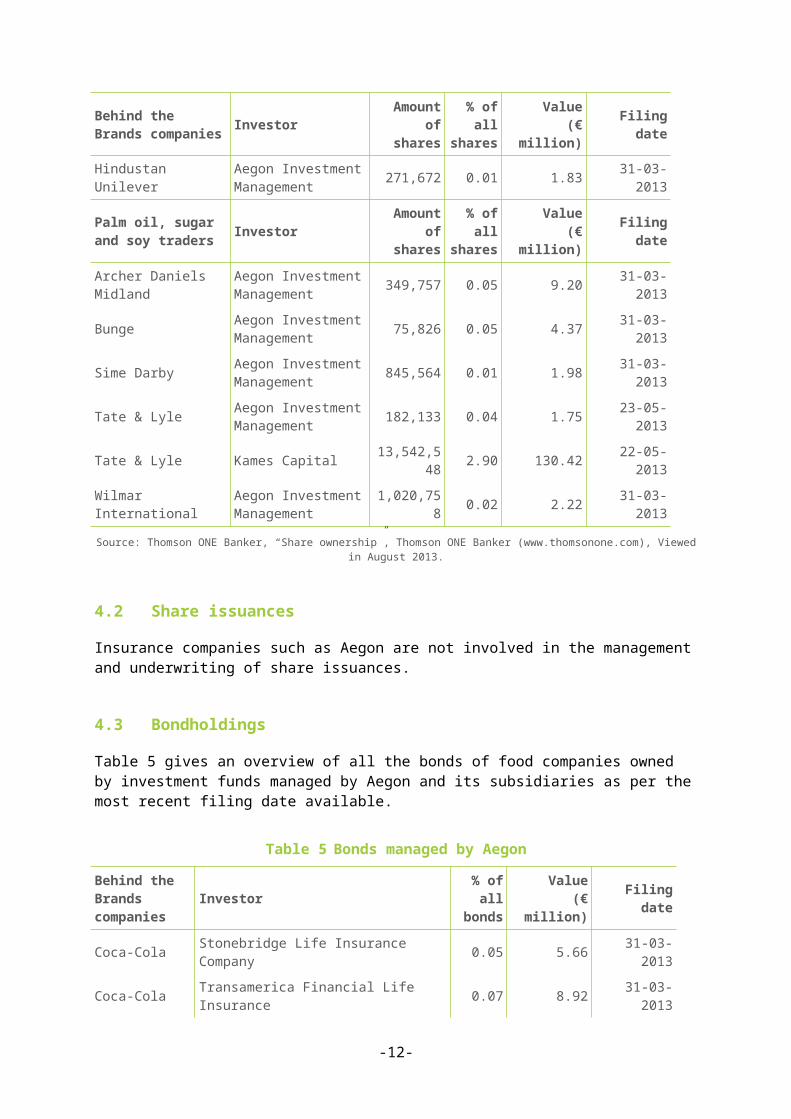
4.1 Shareholdings
Table 4 gives an overview of all the shares of food companies owned by investment funds managed by Aegon and its subsidiaries as per the most recent filing date available.
Table 4 Shares managed by Aegon
Behind the Brands companies Investor Amount of
shares% of all shares
Value (€ million) Filing date
Associated British Foods
Aegon Investment Management 178,103 0.02 3.97 31-03-2013
Associated British Foods Kames Capital 4,056,550 0.51 84.19 03-07-2013
Coca-Cola Aegon Investment Management 2,127,685 0.05 67.10 31-03-2013
Coca-Cola Aegon Capital Management 41,600 0.00 1.29 30-06-2013
Coca-Cola Transamerica Asset Management 338,672 0.01 9.15 31-12-2011
Coca-Cola Kames Capital 360,223 0.01 11.36 31-03-2013
Danone Aegon Investment Management 307,913 0.05 16.71 31-03-2013
General Mills Aegon Investment Management 336,381 0.05 12.93 31-03-2013
Kellogg Aegon Investment Management 130,175 0.04 6.54 31-03-2013
Mondelēz International
Aegon Investment Management 882,975 0.05 21.10 31-03-2013
Nestlé Aegon Investment Management 1,617,155 0.05 91.21 31-03-2013
Nestlé Kames Capital 73,037 0.00 3.97 30-04-2013
PepsiCo Aegon Investment Management 815,019 0.05 50.27 31-03-2013
Unilever PLC Aegon Investment Management 644,594 0.04 21.08 31-03-2013
Unilever PLC Kames Capital 3,065,745 0.24 97.03 01-07-2013
Hindustan Unilever Aegon Investment Management 271,672 0.01 1.83 31-03-2013
Palm oil, sugar and soy traders Investor Amount of
shares% of all shares
Value (€ million) Filing date
Archer Daniels Midland
Aegon Investment Management 349,757 0.05 9.20 31-03-2013
Bunge Aegon Investment Management 75,826 0.05 4.37 31-03-2013
Sime Darby Aegon Investment Management 845,564 0.01 1.98 31-03-2013
-9-
Behind the Brands companies Investor Amount of
shares% of all shares
Value (€ million) Filing date
Tate & Lyle Aegon Investment Management 182,133 0.04 1.75 23-05-2013
Tate & Lyle Kames Capital 13,542,548 2.90 130.42 22-05-2013
Wilmar International Aegon Investment Management 1,020,758 0.02 2.22 31-03-2013
Source: Thomson ONE Banker, “Share ownership”, Thomson ONE Banker (www.thomsonone.com), Viewed in August 2013.
4.2 Share issuances
Insurance companies such as Aegon are not involved in the management and underwriting of share issuances.
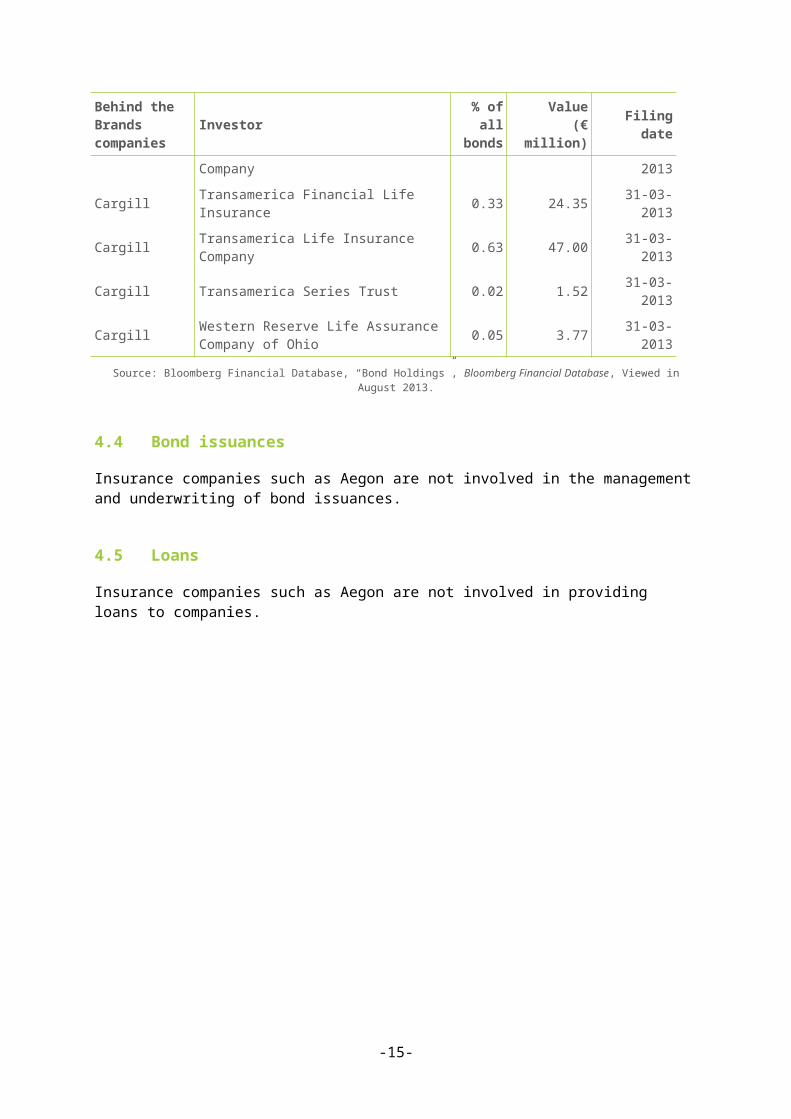
4.3 Bondholdings
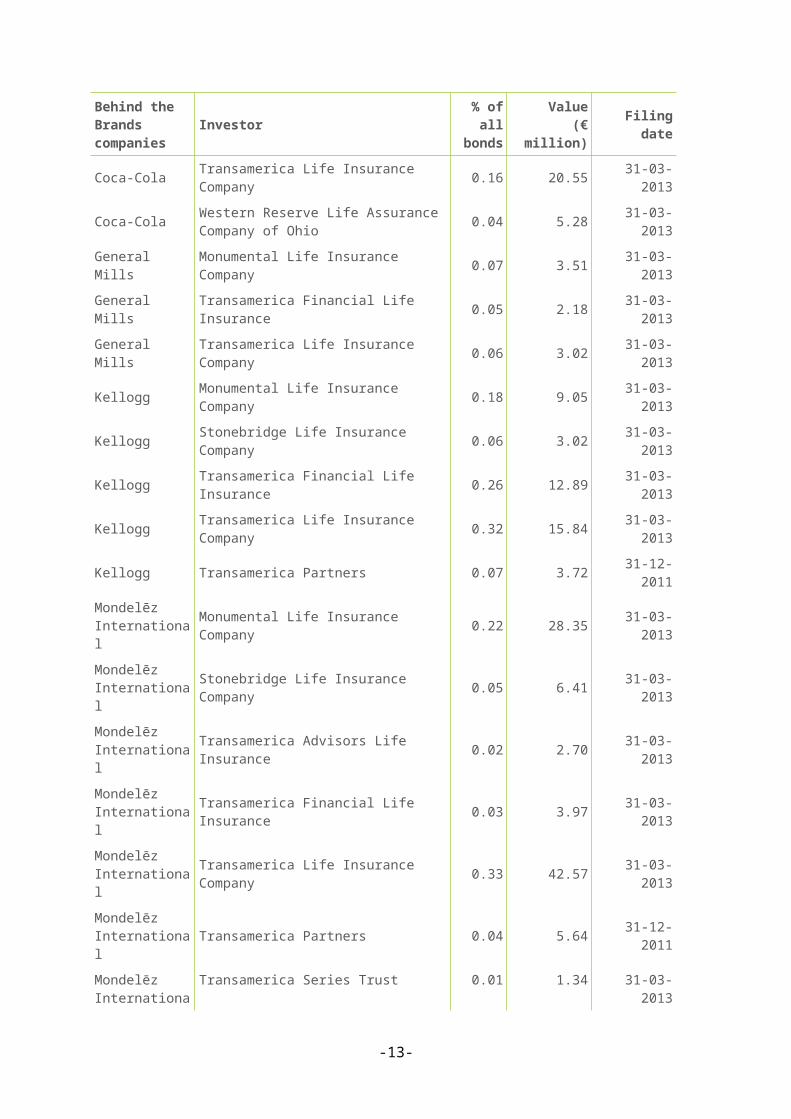
Table 5 gives an overview of all the bonds of food companies owned by investment funds managed by Aegon and its subsidiaries as per the most recent filing date available.
Table 5 Bonds managed by Aegon
Behind the Brands companies
Investor % of all bonds
Value (€ million) Filing date
Coca-Cola Stonebridge Life Insurance Company 0.05 5.66 31-03-2013
Coca-Cola Transamerica Financial Life Insurance 0.07 8.92 31-03-2013
Coca-Cola Transamerica Life Insurance Company 0.16 20.55 31-03-2013
Coca-Cola Western Reserve Life Assurance Company of Ohio 0.04 5.28 31-03-2013
General Mills Monumental Life Insurance Company 0.07 3.51 31-03-2013
General Mills Transamerica Financial Life Insurance 0.05 2.18 31-03-2013
General Mills Transamerica Life Insurance Company 0.06 3.02 31-03-2013
Kellogg Monumental Life Insurance Company 0.18 9.05 31-03-2013
Kellogg Stonebridge Life Insurance Company 0.06 3.02 31-03-2013
Kellogg Transamerica Financial Life Insurance 0.26 12.89 31-03-2013
Kellogg Transamerica Life Insurance Company 0.32 15.84 31-03-2013
Kellogg Transamerica Partners 0.07 3.72 31-12-2011
Mondelēz International Monumental Life Insurance Company 0.22 28.35 31-03-2013
Mondelēz International Stonebridge Life Insurance Company 0.05 6.41 31-03-2013
Mondelēz International Transamerica Advisors Life Insurance 0.02 2.70 31-03-2013
Mondelēz International Transamerica Financial Life Insurance 0.03 3.97 31-03-2013
Mondelēz Transamerica Life Insurance Company 0.33 42.57 31-03-2013
-10-
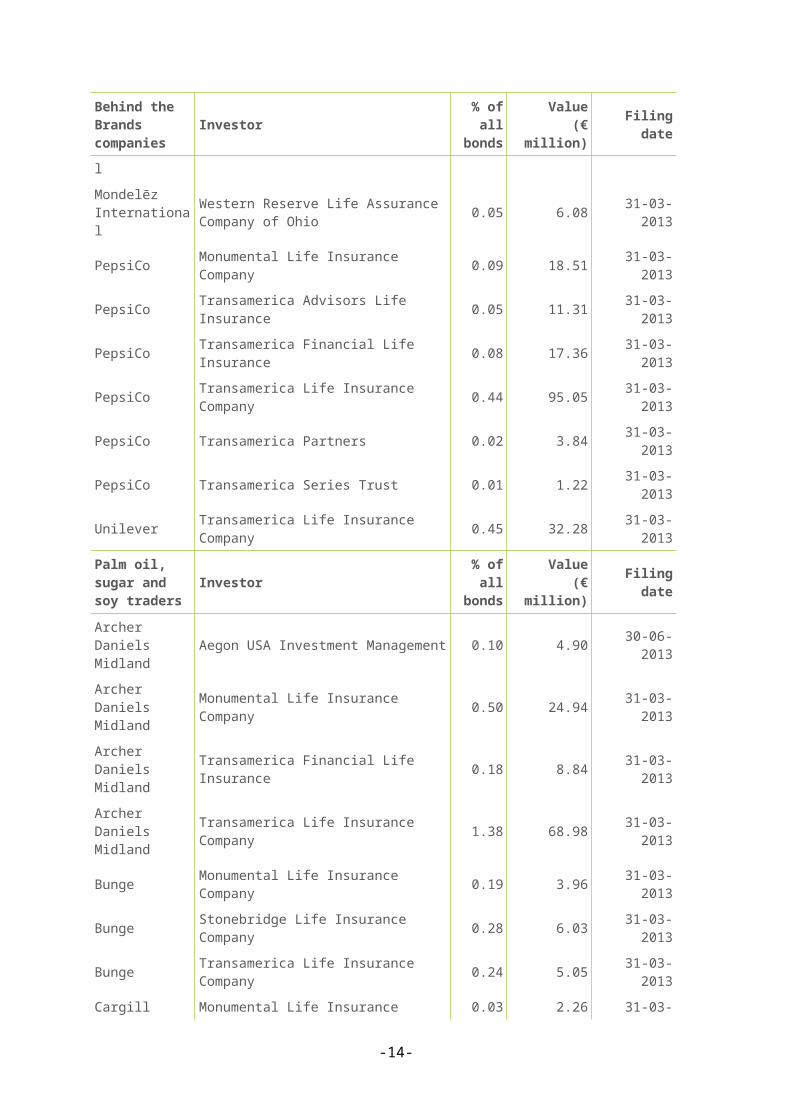
Behind the Brands companies
Investor % of all bonds
Value (€ million) Filing date
International
Mondelēz International Transamerica Partners 0.04 5.64 31-12-2011
Mondelēz International Transamerica Series Trust 0.01 1.34 31-03-2013
Mondelēz International
Western Reserve Life Assurance Company of Ohio 0.05 6.08 31-03-2013
PepsiCo Monumental Life Insurance Company 0.09 18.51 31-03-2013
PepsiCo Transamerica Advisors Life Insurance 0.05 11.31 31-03-2013
PepsiCo Transamerica Financial Life Insurance 0.08 17.36 31-03-2013
PepsiCo Transamerica Life Insurance Company 0.44 95.05 31-03-2013
PepsiCo Transamerica Partners 0.02 3.84 31-03-2013
PepsiCo Transamerica Series Trust 0.01 1.22 31-03-2013
Unilever Transamerica Life Insurance Company 0.45 32.28 31-03-2013
Palm oil, sugar and soy traders
Investor % of all bonds
Value (€ million) Filing date
Archer Daniels Midland Aegon USA Investment Management 0.10 4.90 30-06-2013
Archer Daniels Midland Monumental Life Insurance Company 0.50 24.94 31-03-2013
Archer Daniels Midland Transamerica Financial Life Insurance 0.18 8.84 31-03-2013
Archer Daniels Midland Transamerica Life Insurance Company 1.38 68.98 31-03-2013
Bunge Monumental Life Insurance Company 0.19 3.96 31-03-2013
Bunge Stonebridge Life Insurance Company 0.28 6.03 31-03-2013
Bunge Transamerica Life Insurance Company 0.24 5.05 31-03-2013
Cargill Monumental Life Insurance Company 0.03 2.26 31-03-2013
Cargill Transamerica Financial Life Insurance 0.33 24.35 31-03-2013
Cargill Transamerica Life Insurance Company 0.63 47.00 31-03-2013
Cargill Transamerica Series Trust 0.02 1.52 31-03-2013
Cargill Western Reserve Life Assurance Company of Ohio 0.05 3.77 31-03-2013
Source: Bloomberg Financial Database, “Bond Holdings”, Bloomberg Financial Database, Viewed in August 2013.
4.4 Bond issuances
Insurance companies such as Aegon are not involved in the management and underwriting of bond issuances.
-11-
4.5 Loans
Insurance companies such as Aegon are not involved in providing loans to companies.
-12-
Chapter 5 ING
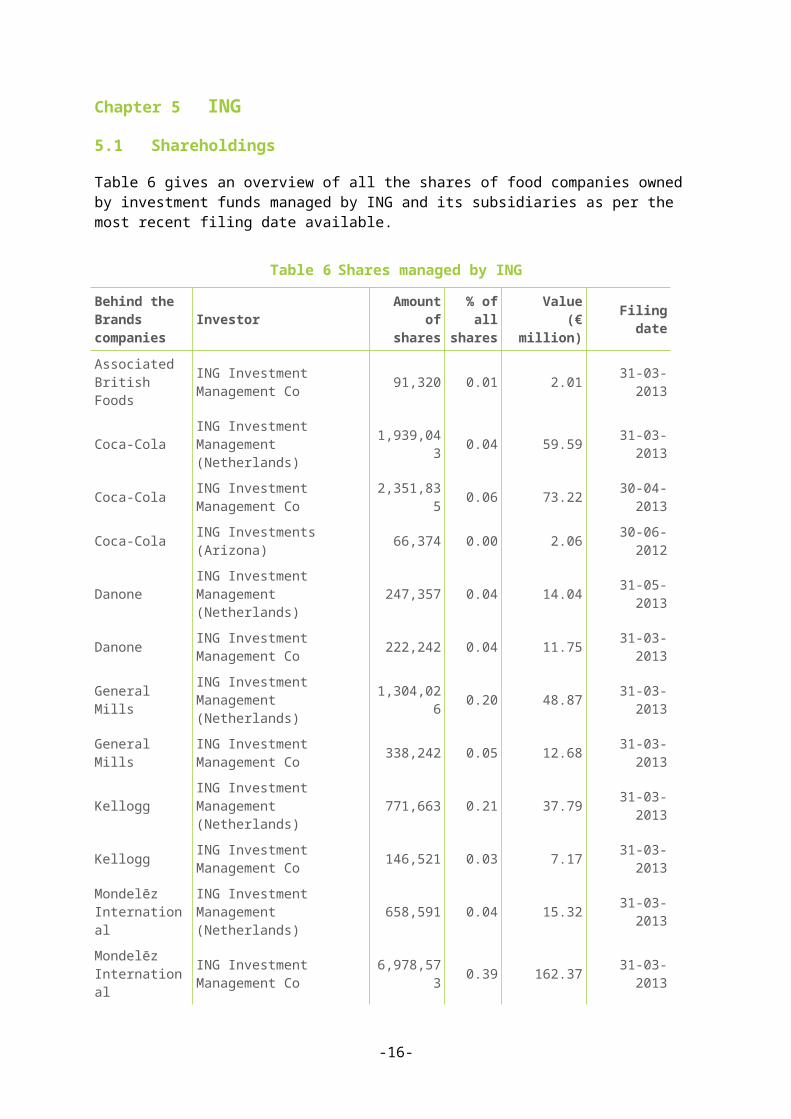
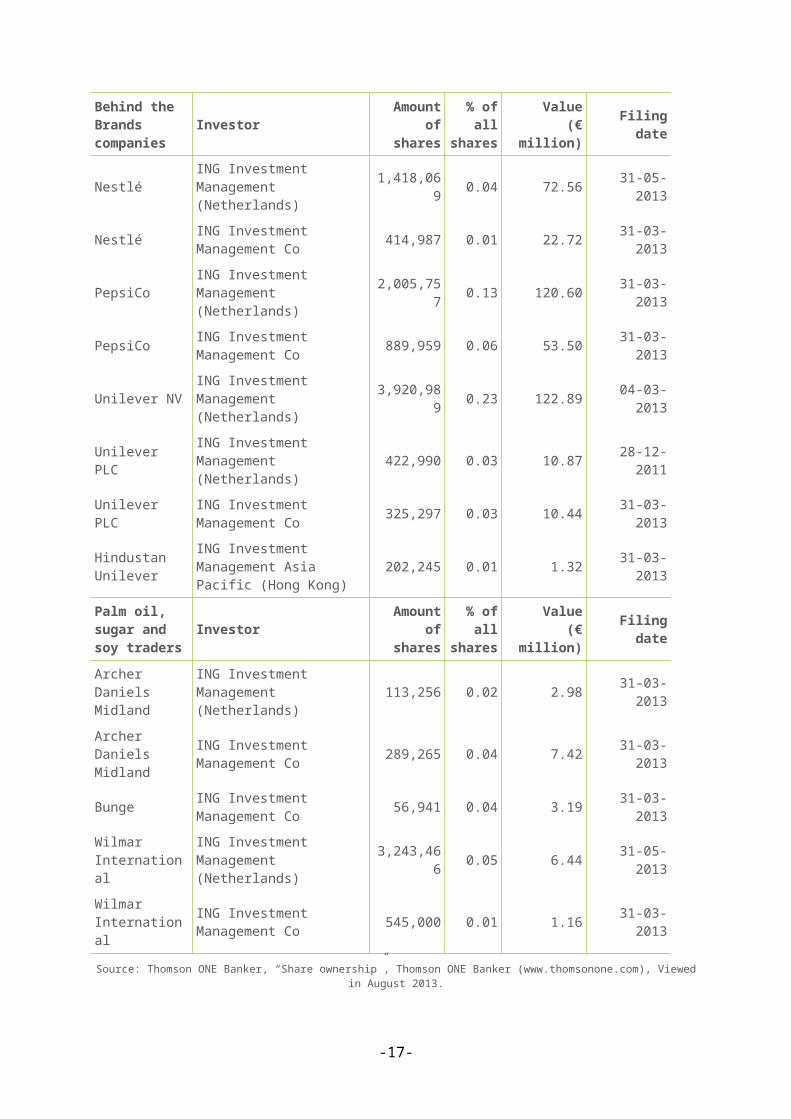
5.1 Shareholdings
Table 6 gives an overview of all the shares of food companies owned by investment funds managed by ING and its subsidiaries as per the most recent filing date available.
Table 6 Shares managed by ING
Behind the Brands companies
Investor Amount of shares
% of all shares
Value (€ million) Filing date
Associated British Foods
ING Investment Management Co 91,320 0.01 2.01 31-03-2013
Coca-Cola ING Investment Management (Netherlands) 1,939,043 0.04 59.59 31-03-2013
Coca-Cola ING Investment Management Co 2,351,835 0.06 73.22 30-04-2013
Coca-Cola ING Investments (Arizona) 66,374 0.00 2.06 30-06-2012
Danone ING Investment Management (Netherlands) 247,357 0.04 14.04 31-05-2013
Danone ING Investment Management Co 222,242 0.04 11.75 31-03-2013
General Mills ING Investment Management (Netherlands) 1,304,026 0.20 48.87 31-03-2013
General Mills ING Investment Management Co 338,242 0.05 12.68 31-03-2013
Kellogg ING Investment Management (Netherlands) 771,663 0.21 37.79 31-03-2013
Kellogg ING Investment Management Co 146,521 0.03 7.17 31-03-2013
Mondelēz International
ING Investment Management (Netherlands) 658,591 0.04 15.32 31-03-2013
Mondelēz International
ING Investment Management Co 6,978,573 0.39 162.37 31-03-2013
Nestlé ING Investment Management (Netherlands) 1,418,069 0.04 72.56 31-05-2013
Nestlé ING Investment Management Co 414,987 0.01 22.72 31-03-2013
PepsiCo ING Investment Management (Netherlands) 2,005,757 0.13 120.60 31-03-2013
PepsiCo ING Investment Management Co 889,959 0.06 53.50 31-03-2013
Unilever NV ING Investment Management (Netherlands) 3,920,989 0.23 122.89 04-03-2013
Unilever PLC ING Investment Management (Netherlands) 422,990 0.03 10.87 28-12-2011
Unilever PLC ING Investment Management Co 325,297 0.03 10.44 31-03-2013
-13-
Behind the Brands companies
Investor Amount of shares
% of all shares
Value (€ million) Filing date
Hindustan Unilever
ING Investment Management Asia Pacific (Hong Kong)
202,245 0.01 1.32 31-03-2013
Palm oil, sugar and soy traders
Investor Amount of shares
% of all shares
Value (€ million) Filing date
Archer Daniels Midland
ING Investment Management (Netherlands) 113,256 0.02 2.98 31-03-2013
Archer Daniels Midland
ING Investment Management Co 289,265 0.04 7.42 31-03-2013
Bunge ING Investment Management Co 56,941 0.04 3.19 31-03-2013
Wilmar International
ING Investment Management (Netherlands) 3,243,466 0.05 6.44 31-05-2013
Wilmar International
ING Investment Management Co 545,000 0.01 1.16 31-03-2013
Source: Thomson ONE Banker, “Share ownership”, Thomson ONE Banker (www.thomsonone.com), Viewed in August 2013.
5.2 Share issuances
No information was found on the participation of ING in share issuances by the selected food companies since 1 July 2010.
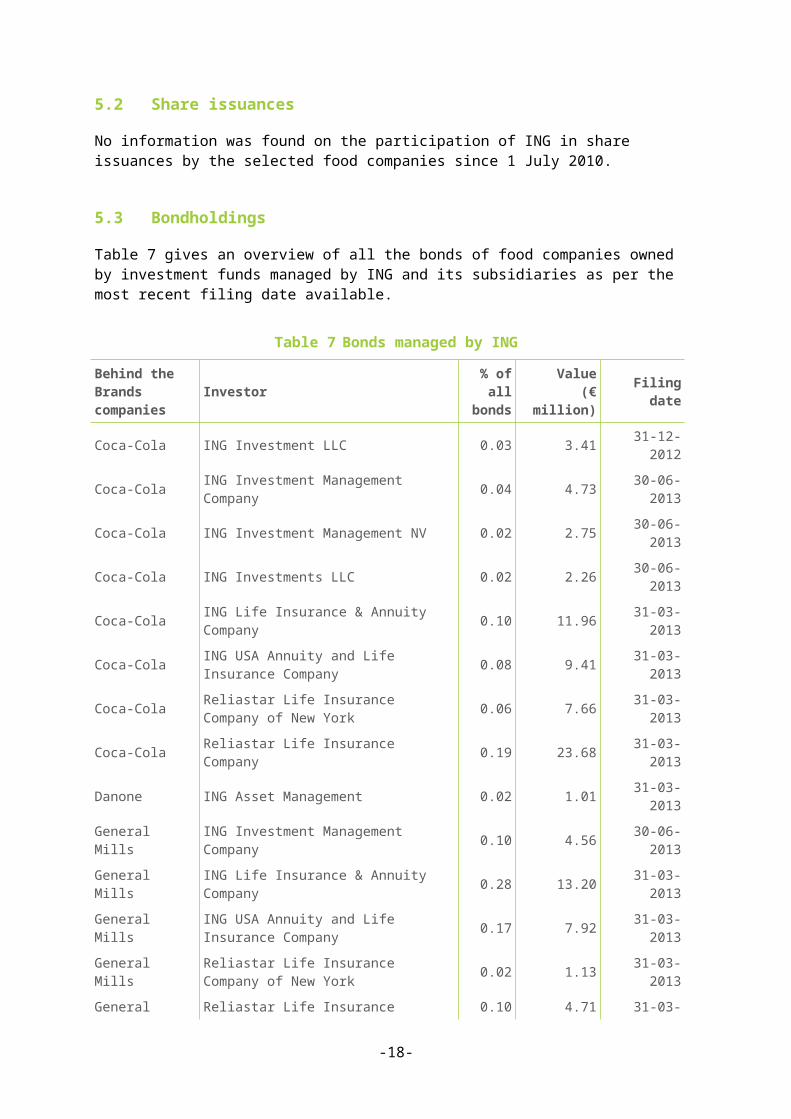
5.3 Bondholdings
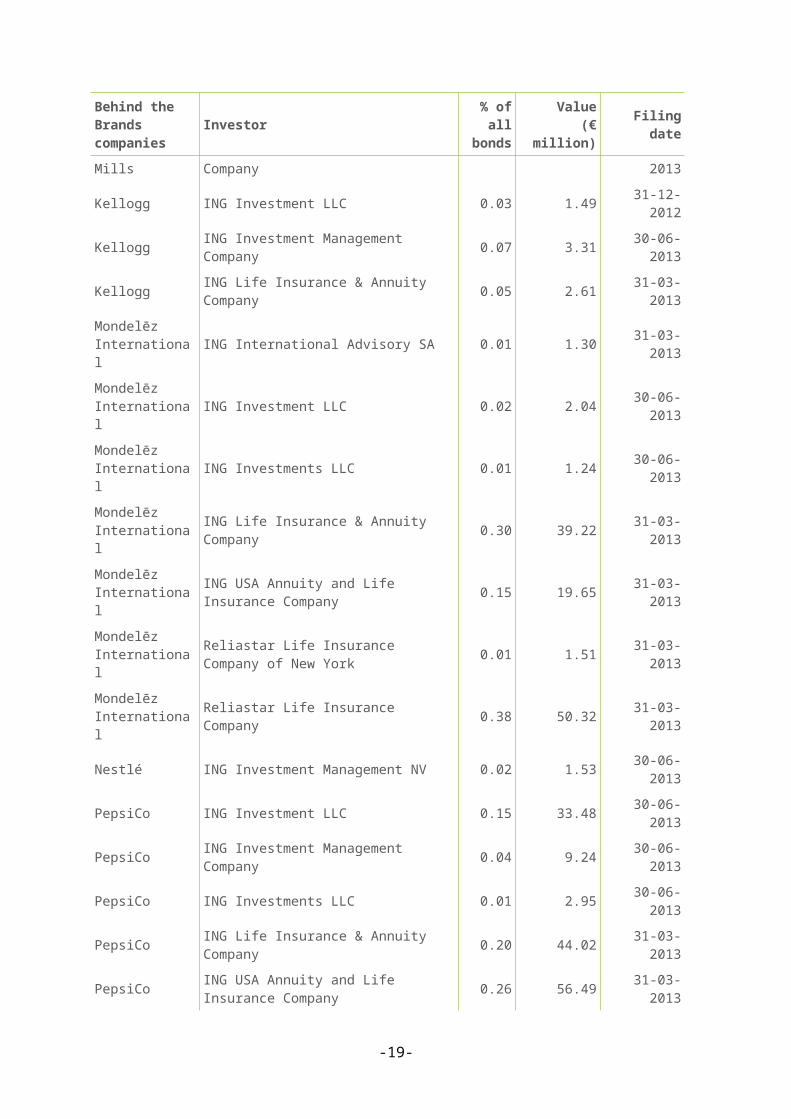
Table 7 gives an overview of all the bonds of food companies owned by investment funds managed by ING and its subsidiaries as per the most recent filing date available.
Table 7 Bonds managed by ING
Behind the Brands companies
Investor % of all bonds
Value (€ million) Filing date
Coca-Cola ING Investment LLC 0.03 3.41 31-12-2012
Coca-Cola ING Investment Management Company 0.04 4.73 30-06-2013
Coca-Cola ING Investment Management NV 0.02 2.75 30-06-2013
Coca-Cola ING Investments LLC 0.02 2.26 30-06-2013
Coca-Cola ING Life Insurance & Annuity Company 0.10 11.96 31-03-2013
Coca-Cola ING USA Annuity and Life Insurance Company 0.08 9.41 31-03-2013
Coca-Cola Reliastar Life Insurance Company of New York 0.06 7.66 31-03-2013
Coca-Cola Reliastar Life Insurance Company 0.19 23.68 31-03-2013
Danone ING Asset Management 0.02 1.01 31-03-2013
-14-
Behind the Brands companies
Investor % of all bonds
Value (€ million) Filing date
General Mills ING Investment Management Company 0.10 4.56 30-06-2013
General Mills ING Life Insurance & Annuity Company 0.28 13.20 31-03-2013
General Mills ING USA Annuity and Life Insurance Company 0.17 7.92 31-03-2013
General Mills Reliastar Life Insurance Company of New York 0.02 1.13 31-03-2013
General Mills Reliastar Life Insurance Company 0.10 4.71 31-03-2013
Kellogg ING Investment LLC 0.03 1.49 31-12-2012
Kellogg ING Investment Management Company 0.07 3.31 30-06-2013
Kellogg ING Life Insurance & Annuity Company 0.05 2.61 31-03-2013
Mondelēz International ING International Advisory SA 0.01 1.30 31-03-2013
Mondelēz International ING Investment LLC 0.02 2.04 30-06-2013
Mondelēz International ING Investments LLC 0.01 1.24 30-06-2013
Mondelēz International ING Life Insurance & Annuity Company 0.30 39.22 31-03-2013
Mondelēz International
ING USA Annuity and Life Insurance Company 0.15 19.65 31-03-2013
Mondelēz International
Reliastar Life Insurance Company of New York 0.01 1.51 31-03-2013
Mondelēz International Reliastar Life Insurance Company 0.38 50.32 31-03-2013
Nestlé ING Investment Management NV 0.02 1.53 30-06-2013
PepsiCo ING Investment LLC 0.15 33.48 30-06-2013
PepsiCo ING Investment Management Company 0.04 9.24 30-06-2013
PepsiCo ING Investments LLC 0.01 2.95 30-06-2013
PepsiCo ING Life Insurance & Annuity Company 0.20 44.02 31-03-2013
PepsiCo ING USA Annuity and Life Insurance Company 0.26 56.49 31-03-2013
PepsiCo Reliastar Life Insurance Company of New York 0.08 16.29 31-03-2013
PepsiCo Reliastar Life Insurance Company 0.23 48.87 31-03-2013
Unilever ING International Advisory SA 0.01 1.01 31-03-2013
Palm oil, sugar and soy traders Investor % of all
bondsValue
(€ million) Filing date
Archer Daniels Midland ING Life Insurance & Annuity Company 0.05 2.26 31-03-2013
Archer Daniels Midland
ING USA Annuity and Life Insurance Company 0.07 3.58 31-03-2013
Archer Daniels Midland Reliastar Life Insurance Company 0.22 11.21 31-03-2013
-15-
Behind the Brands companies
Investor % of all bonds
Value (€ million) Filing date
Bunge ING Life Insurance & Annuity Company 0.49 10.56 31-03-2013
Bunge ING USA Annuity and Life Insurance Company 0.14 3.02 31-03-2013
Bunge Reliastar Life Insurance Company 0.11 2.26 31-03-2013
Cargill ING Asset Management 0.01 1.01 31-03-2013
Cargill ING International Advisory SA 0.07 5.28 31-03-2013
Cargill ING Investment Management NV 0.05 3.76 31-08-2012
Cargill ING Life Insurance & Annuity Company 0.15 11.41 31-03-2013
Cargill Reliastar Life Insurance Company 0.15 10.89 31-03-2013
Olam International ING International Advisory SA 0.05 1.21 31-03-2013
Sime Darby ING International Advisory SA 0.09 1.09 31-03-2013
Source: Bloomberg Financial Database, “Bond Holdings”, Bloomberg Financial Database, Viewed in August 2013.
5.4 Bond issuances
Since 1 July 2010 ING assisted food companies with the following bond issuances:
Coca-Cola: In February 2013 ING co-managed a bond issuance for Coca-Cola with a total value of
US$ 2,500 million (€ 1,911 million). It was initiated for general corporate purposes. The bond issuance was divided into three tranches: a five-year 1.15% bond with a total value of US$ 1,250 million, a ten-year 2.5% bond with a total value of US$ 750 million and a two-year floating rate bond with a total value of US$ 500 million. The banking syndicate consisted of seven banks. ING’s share is estimated at US$ 208 million (€ 159 million).7
Danone: In September 2011 ING co-managed a bond issuance for Danone with a total value of
€ 500 million. It was initiated for general corporate purposes. The bonds mature in September 2016 at a fixed rate of 2.5%. The banking syndicate consisted of seven banks. ING’s share is estimated at € 71 million.8
In March 2013 ING co-managed a bond issuance for Danone with a total value of € 750 million. It was initiated for general corporate purposes. The bonds mature in June 2018 at a fixed rate of 1.25%. The banking syndicate consisted of six banks. ING’s share is estimated at € 125 million.9
In June 2013 ING co-managed a bond issuance for Danone with a total value of € 500 million. It was initiated for general corporate purposes. The bonds mature in June 2023 at a fixed rate of 2.6%. The banking syndicate consisted of five banks. ING’s share is estimated at € 100 million.10
Bunge:
-16-
In March 2011 ING co-managed a bond issuance for Bunge with a total value of US$ 500 million (€ 358 million). It was initiated for general corporate and working capital purposes. The bonds mature in March 2016 at a fixed rate of 4.1%. The banking syndicate consisted of ten banks. ING underwrote US$ 15 million (€ 11 million).11
In June 2012 ING co-managed a bond issuance for Bunge with a total value of US$ 600 million (€ 481 million). It was initiated for general corporate purposes and to reduce indebtedness. The bonds mature in June 2017 at a fixed rate of 3.2%. The banking syndicate consisted of 14 banks. ING underwrote US$ 9 million (€ 7 million).12
Cargill: In August 2012 ING co-managed a bond issuance for Cargill with a total value of € 500
million. It was initiated for general corporate purposes. The bonds mature in September 2019 at a fixed rate of 1.875%. The banking syndicate consisted of nine banks and was led by three joint book runners. ING’s share is estimated at € 28 million.13
Louis Dreyfus: In July 2013 ING co-managed a bond issuance for Louis Dreyfus with a total value of €
400 million. It was initiated for general corporate purposes. The bonds mature in July 2018 at a fixed rate of 3.875%. The banking syndicate consisted of four banks. ING’s share is estimated at € 100 million.14
5.5 Loans
Since 1 July 2010 ING provided the following loans to the food companies researched:
Danone: In July 2011 ING participated in a syndicated revolving credit facility for Danone. The
total value of the facility was € 2,000 million. The banking syndicate consisted of 12 banks. The maturity date is in July 2016. The facility was initiated for general corporate purposes and refinancing of bank debt. ING’s share is estimated at € 167 million.15
Nestlé: In October 2010 ING participated in a syndicated revolving credit facility for Nestlé. The
total value of the facility was € 5,000 million. The banking syndicate consisted of 30 banks. The maturity date is in November 2015. The facility was initiated for refinancing purposes. ING’s share is estimated at € 167 million.16
In September 2011 ING participated in a syndicated revolving credit facility for Nestlé. The total value of the facility was € 4,500 million. The banking syndicate consisted of 23 banks. The maturity date was in October 2012. The facility was initiated for general corporate purposes and refinancing of bank debt. ING’s share is estimated at € 196 million.17
In September 2012 ING participated in a syndicated revolving credit facility for Nestlé. The total value of the facility was US$ 6,328 million (€ 4,910 million). The banking syndicate consisted of 25 banks. The maturity date was in October 2013. The facility was initiated for general corporate purposes and refinancing of bank debt. ING’s share is estimated at US$ 253 million (€ 196 million).18
Archer Daniels Midland:
-17-
In October 2010 ING participated in a syndicated revolving credit facility for Archer Daniels Midland. The total value of the facility was US$ 2,000 million (€ 1,436 million). The banking syndicate consisted of 25 banks. The maturity date was in October 2011. The facility was initiated for general corporate purposes. ING’s share is estimated at US$ 80 million (€ 57 million).19
In October 2011 ING participated in a syndicated revolving credit facility for Archer Daniels Midland. The total value of the facility was US$ 2,000 million (€ 1,409 million). The banking syndicate consisted of six banks. The maturity date was in October 2016. The facility was initiated for general corporate purposes and refinancing of the existing facility. ING’s share is estimated at US$ 333 million (€ 235 million).20
In December 2012 ING participated in a syndicated revolving credit facility for Archer Daniels Midland. The total value of the facility was US$ 4,000 million (€ 3,059 million), consisting of a three-year US$ 2,000 million tranche and a one-year US$ 2,000 million tranche. The banking syndicate consisted of ten banks. The facility was initiated for general corporate purposes and refinancing of bank debt. ING’s share is estimated at US$ 400 million (€ 306 million).21
Bunge: In March 2011 ING participated in a syndicated revolving credit facility for Bunge. The
total value of the facility was US$ 1,750 million (€ 1,232 million). ING was one of the 11 lead arrangers for the credit facility. The total banking syndicate consisted of 37 banks. The maturity date is in March 2014. The facility was initiated for general corporate purposes, working capital and refinancing of bank debt. ING committed an amount of US$ 65 million (€ 46 million).22
In November 2011 ING participated in a syndicated revolving credit facility for Bunge. The total value of the facility was US$ 1,600 million (€ 1,189 million). The facility was split into two tranches with 24 banks participating in the US$ 1,000 million tranche and 19 banks participating in the US$ 600 million tranche. The maturity date of both tranches is in November 2016. The facility was initiated for general corporate purposes and refinancing of bank debt. ING committed an amount of US$ 50 million (€ 37 million).23
Cargill: In September 2010 ING participated in a syndicated revolving credit facility for Cargill.
The total value of the facility was US$ 5,000 million (€ 3,589 million), consisting of a three-year US$ 2,500 million tranche and an one-year US$ 2,500 million tranche. The banking syndicate consisted of 34 banks. The facility was initiated for refinancing of bank debt and as a standby facility. ING’s share is estimated at US$ 147 million (€ 105 million).24
In February 2011 ING participated in a syndicated revolving credit facility for Cargill. The total value of the facility was US$ 1,250 million (€ 888 million). The banking syndicate consisted of 23 banks. The maturity date was in March 2012. The facility was initiated for general corporate and working capital purposes. ING committed an amount of US$ 60 million (€ 43 million).25
In September 2011 ING participated in a syndicated revolving credit facility for Cargill. The total value of the facility was US$ 5,000 million (€ 3,524 million), consisting of an one-year US$ 2,500 million tranche and a five-year US$ 2,500 million tranche. The banking syndicate consisted of 13 banks and was led by five banks. The facility was initiated for general corporate purposes and refinancing of bank debt. ING’s share is estimated at US$ 156 million (€ 110 million).26
-18-
In February 2012 ING participated in a syndicated revolving credit facility for Cargill. The total value of the facility was US$ 1,250 million (€ 946 million). The banking syndicate consisted of 25 banks. The maturity date was in March 2013. The facility was initiated for general corporate purposes, working capital and refinancing of bank debt. ING’s share is estimated at US$ 50 million (€ 38 million).27
In September 2012 ING participated in a syndicated revolving credit facility for Cargill. The total value of the facility was US$ 5,000 million (€ 3,866 million), consisting of an one-year US$ 1,875 million tranche and a five-year US$ 3,125 million tranche. The banking syndicate consisted of 12 banks and was led by five banks. The facility was initiated for general corporate purposes and refinancing of bank debt. ING’s share is estimated at US$ 156 million (€ 121 million).28
In February 2013 ING participated in a syndicated revolving credit facility for Cargill. The total value of the facility was US$ 1,250 million (€ 965 million). The banking syndicate consisted of 31 banks. The maturity date is in March 2014. The facility was initiated for general corporate purposes and refinancing of bank debt. ING’s share is estimated at US$ 40 million (€ 31 million).29
Louis Dreyfus: In October 2011 ING participated in a syndicated revolving credit facility for Louis
Dreyfus. The total value of the facility was US$ 797 million (€ 605 million), consisting of US$ 227 million term loan and two revolving credit facilities totaling US$ 571 million. The banking syndicate consisted of 28 banks. The maturity date is in December 2014. The facility was initiated for general corporate purposes. ING’s share is estimated at US$ 28 million (€ 21 million).30
In November 2012 ING participated in a syndicated revolving credit facility for Louis Dreyfus. The total value of the facility was US$ 500 million (€ 392 million). The banking syndicate consisted of five banks and was led by two banks. The maturity date is unknown. The facility was initiated for general corporate purposes. ING’s share is estimated at US$ 55 million (€ 44 million).31
Olam International: In April 2011 ING participated in a syndicated loan facility for Olam International. The
total value of the facility was US$ 1,250 million (€ 877 million), consisting of an three-year loan of US$ 625 million and a five-year loan of US$ 625 million. The banking syndicate consisted of 32 banks. The facility was initiated for general corporate purposes, working capital and refinancing of bank debt. ING committed an amount of US$ 61.4 million (€ 43 million).32
Sucres & Denrées: In November 2010 ING participated in a syndicated revolving credit facility for Sucres &
Denrées. The total value of the facility was US$ 180 million (€ 129 million). The banking syndicate consisted of 11 banks and was led by five banks including ING. The maturity date is in March 2012. The facility was initiated for general corporate purposes and refinancing of bank debt. ING committed an amount of US$ 20 million (€ 14 million).33
In March 2012 ING participated in a syndicated revolving credit facility for Sucres & Denrées. The total value of the facility was US$ 180 million (€ 137 million). The banking syndicate consisted of 11 banks. The maturity date is in March 2013. The facility was initiated for general corporate purposes. ING’s share is estimated at US$ 16 million (€ 12 million).34
-19-
In February 2013 ING participated in a syndicated revolving credit facility for Sucres & Denrées. The total value of the facility was US$ 210 million (€ 159 million). The banking syndicate consisted of 11 banks. The maturity date is in February 2014. The facility was initiated for general corporate purposes and refinancing of bank debt. ING’s share is estimated at US$ 19 million (€ 14 million).35
Tate & Lyle: In July 2011 ING participated in a syndicated revolving credit facility for Tate & Lyle.
The total value of the facility was US$ 800 million (€ 572 million). The banking syndicate consisted of nine banks. The maturity date is in July 2016. The facility was initiated for general corporate purposes and refinancing of bank debt. ING’s share is estimated at US$ 89 million (€ 64 million).36
-20-
Chapter 6 Pensioenfonds Zorg en Welzijn (PfZW)
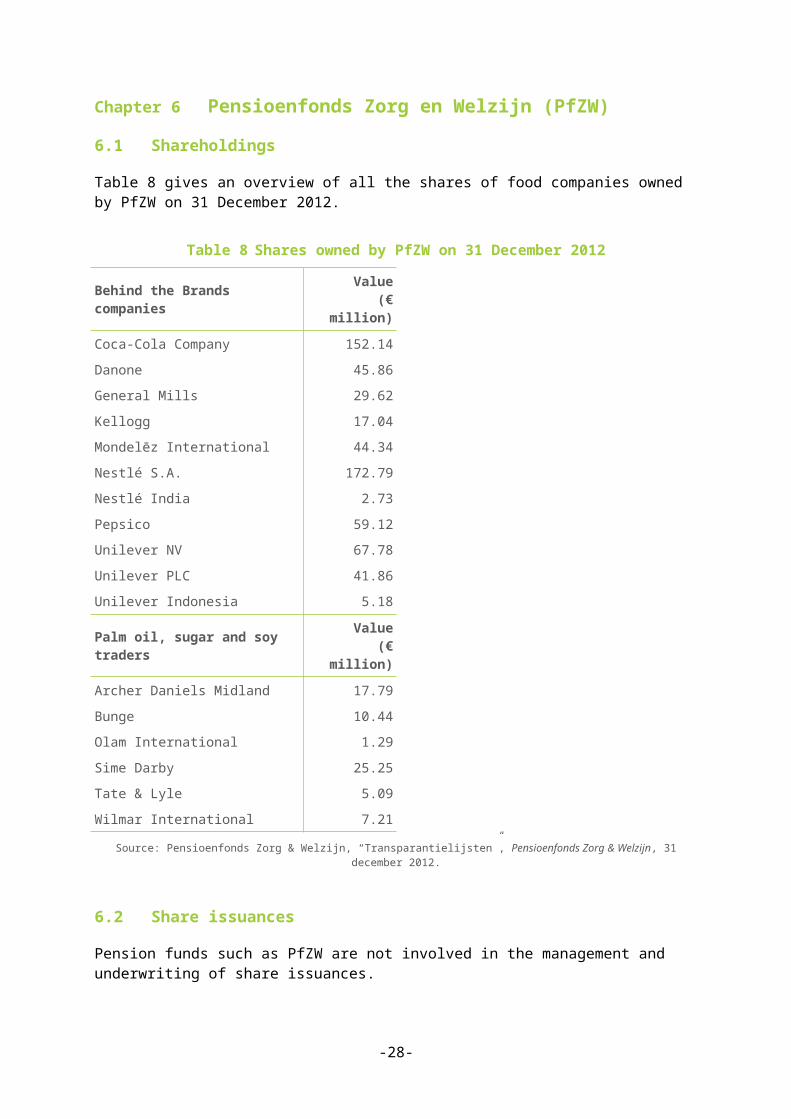
6.1 Shareholdings
Table 8 gives an overview of all the shares of food companies owned by PfZW on 31 December 2012.
Table 8 Shares owned by PfZW on 31 December 2012
Behind the Brands companies Value (€ million)
Coca-Cola Company 152.14
Danone 45.86
General Mills 29.62
Kellogg 17.04
Mondelēz International 44.34
Nestlé S.A. 172.79
Nestlé India 2.73
Pepsico 59.12
Unilever NV 67.78
Unilever PLC 41.86
Unilever Indonesia 5.18
Palm oil, sugar and soy traders Value (€ million)
Archer Daniels Midland 17.79
Bunge 10.44
Olam International 1.29
Sime Darby 25.25
Tate & Lyle 5.09
Wilmar International 7.21
Source: Pensioenfonds Zorg & Welzijn, “Transparantielijsten”, Pensioenfonds Zorg & Welzijn, 31 december 2012.
6.2 Share issuances
Pension funds such as PfZW are not involved in the management and underwriting of share issuances.
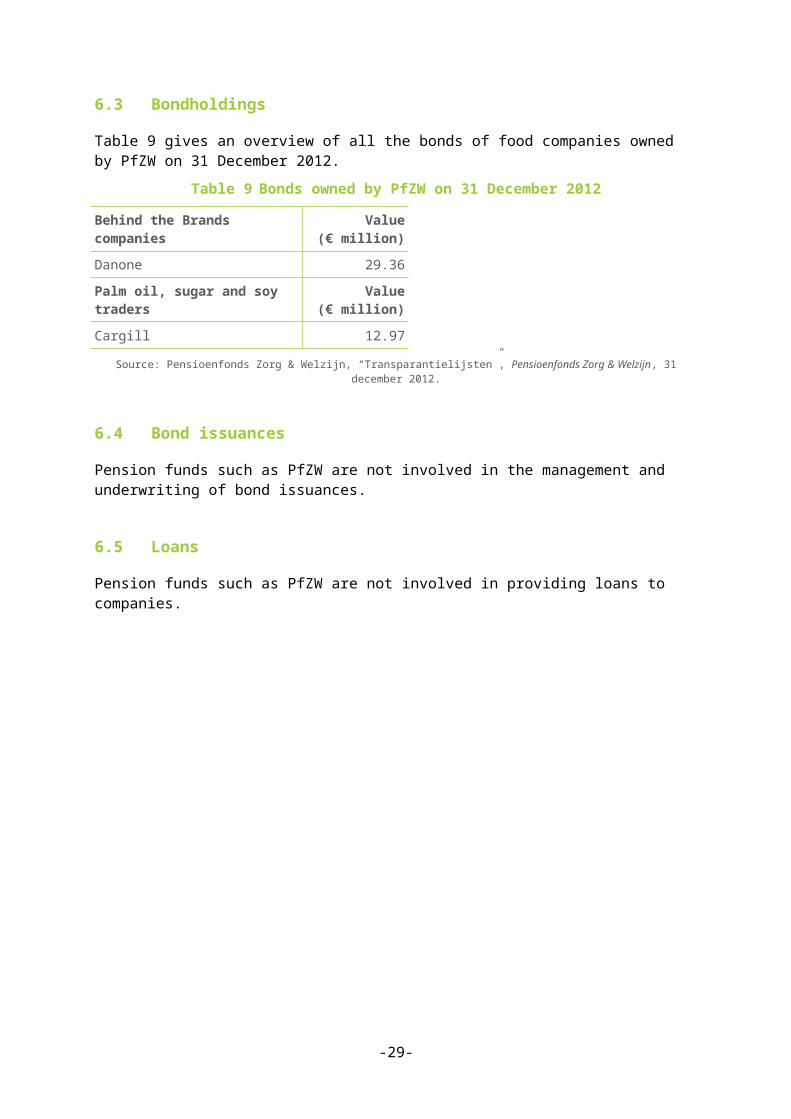
6.3 Bondholdings
Table 9 gives an overview of all the bonds of food companies owned by PfZW on 31 December 2012.
-21-
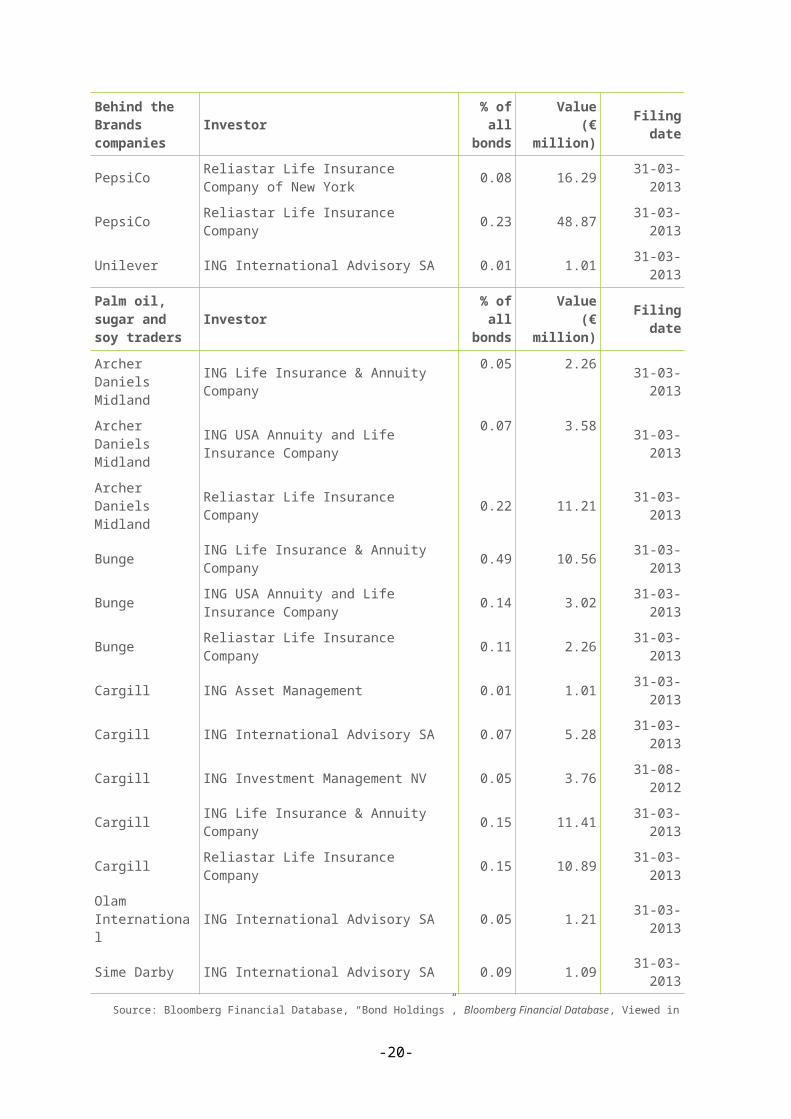
Table 9 Bonds owned by PfZW on 31 December 2012
Behind the Brands companies Value (€ million)
Danone 29.36
Palm oil, sugar and soy traders Value (€ million)
Cargill 12.97
Source: Pensioenfonds Zorg & Welzijn, “Transparantielijsten”, Pensioenfonds Zorg & Welzijn, 31 december 2012.
6.4 Bond issuances
Pension funds such as PfZW are not involved in the management and underwriting of bond issuances.
6.5 Loans
Pension funds such as PfZW are not involved in providing loans to companies.
-22-
Chapter 7 Rabobank
7.1 Shareholdings
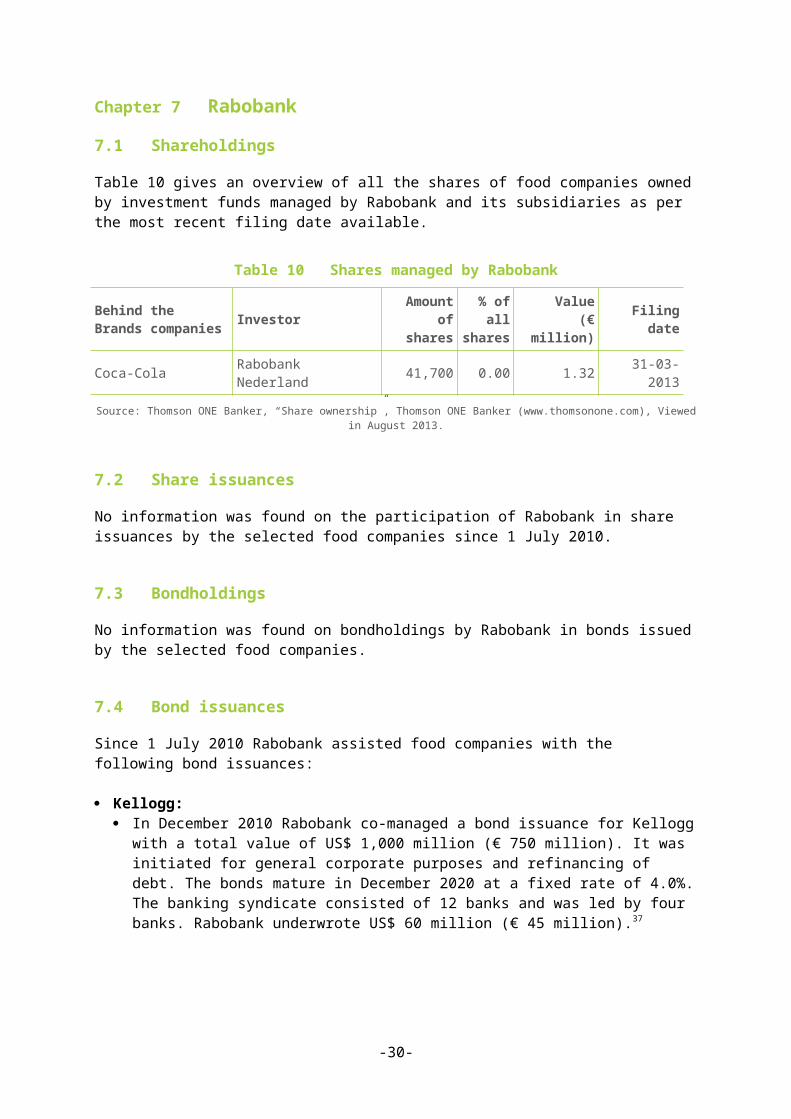
Table 10 gives an overview of all the shares of food companies owned by investment funds managed by Rabobank and its subsidiaries as per the most recent filing date available.
Table 10 Shares managed by Rabobank
Behind the Brands companies Investor Amount of
shares% of all shares
Value (€ million) Filing date
Coca-Cola Rabobank Nederland 41,700 0.00 1.32 31-03-2013
Source: Thomson ONE Banker, “Share ownership”, Thomson ONE Banker (www.thomsonone.com), Viewed in August 2013.
7.2 Share issuances
No information was found on the participation of Rabobank in share issuances by the selected food companies since 1 July 2010.
7.3 Bondholdings
No information was found on bondholdings by Rabobank in bonds issued by the selected food companies.
7.4 Bond issuances
Since 1 July 2010 Rabobank assisted food companies with the following bond issuances:
Kellogg: In December 2010 Rabobank co-managed a bond issuance for Kellogg with a total
value of US$ 1,000 million (€ 750 million). It was initiated for general corporate purposes and refinancing of debt. The bonds mature in December 2020 at a fixed rate of 4.0%. The banking syndicate consisted of 12 banks and was led by four banks. Rabobank underwrote US$ 60 million (€ 45 million).37
In May 2011 Rabobank co-managed a bond issuance for Kellogg with a total value of US$ 400 million (€ 283 million). It was initiated for general corporate purposes and refinancing of debt. The bonds mature in May 2018 at a fixed rate of 3.25%. The banking syndicate consisted of eight banks and was led by two banks. Rabobank underwrote US$ 24 million (€ 17 million).38
In November 2011 Rabobank co-managed a bond issuance for Kellogg with a total value of US$ 500 million (€ 364 million). It was initiated for general corporate purposes and refinancing of debt. The bonds mature in November 2016 at a fixed rate of 1.875%. The banking syndicate consisted of 12 banks and was led by four banks including Rabobank. Rabobank underwrote US$ 75 million (€ 55 million).39
-23-
In May 2012 Rabobank co-managed a bond issuance for Kellogg with a total value of US$ 1,450 million (€ 1,123 million). It was initiated for general corporate purposes and future acquisitions. The bond issuance was split into three tranches: a three-year 1.125% bond with a total value of US$ 350 million, a five-year 1.75% bond with a total value of US$ 400 million and a ten-year 3.125% bond with a total value of US$ 700 million. The banking syndicate consisted of 11 banks and was led by five banks. Rabobank underwrote US$ 145 million (€ 112 million).40
In February 2013 Rabobank co-managed a bond issuance for Kellogg with a total value of US$ 650 million (€ 486 million). It was initiated for general corporate purposes and to reduce indebtedness. The bond issuance was split into two tranches: a two-year floating rate bond with a total value of US$ 250 million and a ten-year 2.75% bond with a total value of US$ 400 million. The banking syndicate consisted of 18 banks and was led by three banks. Rabobank underwrote US$ 13 million (€ 10 million).41
Mars: In October 2012 Rabobank co-managed a bond issuance for Mars with a total value of
US$ 2,000 million (€ 1,554 million). It was initiated for general corporate purposes. The bond issuance was split into six tranches: a 15-year 3.74% bond with a total value of US$ 395 million; a 12-year 3.49% bond with a total value of US$ 450 million; a 10-year 3.34% bond with a total value of US$ 333 million; a 10-year 3.25% bond with a total value of US$ 155 million; a 7-year 2.72% bond with a total value of US$ 333 million; a 5-year 2.19% bond with a total value of US$ 334 million.The banking syndicate consisted of six banks. Rabobank’s share is estimated at US$ 333 million (€ 259 million).42
Nestlé: In January 2011 Rabobank co-managed a bond issuance for Nestlé with a total value
of A$ 275 million (€ 200 million), split into an A$ 175 million tranche and an A$ 100 milion tranche. The intended use of the proceeds is unknown. The bonds mature in January 2016 at a fixed rate of 5.5%. The banking syndicate consisted of ten banks. Rabobank underwrote A$ 2 million to the A$ 175 million tranche. Rabobank’s share of the A$ 100 million tranche is unknown. Rabobank’s total share is estimated at A$ 3 million (€ 2 million).43
In February 2011 Rabobank co-managed a bond issuance for Nestlé with a total value of NOK 1,000 million (€ 127 million). The intended use of the proceeds is unknown. The bonds mature in February 2016 at a fixed rate of 3.375%. The banking syndicate consisted of nine banks. Rabobank underwrote NOK 15 million (€ 2 million).44
In March 2012 Rabobank co-managed a bond issuance for Nestlé with a total value of A$ 125 million (€ 99 million). The intended use of the proceeds is unknown. The bonds mature in March 2017 at a fixed rate of 4.625%. The banking syndicate consisted of six banks. Rabobank underwrote A$ 2 million (€ 1.6 million).45
Bunge: In June 2012 Rabobank co-managed a bond issuance for Bunge with a total value of
US$ 600 million (€ 481 million). It was initiated for general corporate purposes and to reduce indebtedness. The bonds mature in June 2017 at a fixed rate of 3.2%. The banking syndicate consisted of 14 banks. Rabobank underwrote US$ 17 million (€ 13 million).46
Cargill:
-24-
In November 2011 Rabobank co-managed a bond issuance for Cargill with a total value of US$ 500 million (€ 364 million). It was initiated for general corporate purposes. The bonds mature in November 2021 at a fixed rate of 3.25%. The banking syndicate consisted of five banks and was led by two banks. Rabobank’s share is estimated at US$ 56 million (€ 40 million).47
7.5 Loans
Since 1 July 2010 Rabobank provided the following loans to the food companies researched:
Associated British Foods: In July 2010 Rabobank participated in a syndicated revolving credit facility for
Associated British Foods. The total value of the facility was £ 1,150 million (€ 1,387 million). The banking syndicate consisted of 11 banks and was led by six banks. The maturity date is in July 2015. The facility was initiated for general corporate purposes and refinancing of bank debt. Rabobank’s share is estimated at £ 58 million (€ 69 million).48
General Mills: In March 2012 Rabobank participated in a syndicated revolving credit facility for
General Mills. The total value of the facility was US$ 2,700 million (€ 2,065 million), consisting of a five-year US$ 1,700 facility and a three-year US$ 1,000 million facility. The banking syndicate consisted of 11 banks and was led by five banks. The facility was initiated for general corporate purposes and refinancing of bank debt. Rabobank‘s share is estimated at US$ 113 million (€ 86 million).49
Kellogg: In February 2011 Rabobank participated in a syndicated revolving credit facility for
Kellogg. The total value of the facility was US$ 2,000 million (€ 1,472 million). The banking syndicate consisted of 32 banks and was led by five banks including Rabobank. The maturity date is in March 2015. The facility was initiated for general corporate purposes and as a backup facility. Rabobank committed an amount of US$ 170 million (€ 125 million).50
In January 2012 Rabobank participated in a syndicated revolving credit facility for Kellogg. The total value of the facility was US$ 2,000 million (€ 1,565 million). The banking syndicate consisted of six banks and was led by four banks including Rabobank. The maturity date is in March 2015. The facility was initiated as an amendment of the previous credit facility to decrease pricing. Rabobank’s share is estimated at US$ 375 million (€ 293 million).51
In February 2012 Rabobank participated in a bridge loan for Kellogg. The total value of the loan was US$ 1,000 million (€ 764 million). The banking syndicate consisted of four banks. The maturity date was in March 2013. The facility was initiated to back Kellogg’s acquisition of Pringles. Rabobank’s share is estimated at US$ 250 million (€ 191 million).52
Mars: In March 2011 Rabobank participated in a syndicated revolving credit facility for Mars.
The total value of the facility was US$ 2,000 million (€ 1,430 million). The banking syndicate consisted of 14 banks and was led by four banks. The maturity date is in March 2016. The facility was initiated for general corporate purposes and refinancing of bank debt. Rabobank’s share is estimated at US$ 50 million (€ 36 million).53
-25-
Archer Daniels Midland: In October 2010 Rabobank participated in a syndicated revolving credit facility for
Archer Daniels Midland. The total value of the facility was US$ 2,000 million (€ 1,436 million). The banking syndicate consisted of 25 banks. The maturity date was in October 2011. The facility was initiated for general corporate purposes. Rabobank’s share is estimated at US$ 80 million (€ 57 million).54
Bunge: In March 2011 Rabobank participated in a syndicated revolving credit facility for Bunge.
The total value of the facility was US$ 1,750 million (€ 1,232 million). Rabobank was one of the 11 lead arrangers for the credit facility. The total banking syndicate consisted of 37 banks. The maturity date is in March 2014. The facility was initiated for general corporate purposes, working capital and refinancing of bank debt. Rabobank committed an amount of US$ 65 million (€ 46 million).55
In November 2011 Rabobank participated in a syndicated revolving credit facility for Bunge. The total value of the facility was US$ 1,600 million (€ 1,189 million). The facility was split into two tranches with 24 banks participating in the US$ 1,000 million tranche and 19 banks participating in the US$ 600 million tranche. The maturity date of both tranches is in November 2016. The facility was initiated for general corporate purposes and refinancing of bank debt. Rabobank committed an amount of US$ 70 million (€ 52 million).56
Cargill: In September 2010 Rabobank participated in a syndicated revolving credit facility for
Cargill. The total value of the facility was US$ 5,000 million (€ 3,589 million), consisting of a three-year US$ 2,500 million tranche and an one-year US$ 2,500 million tranche. The banking syndicate consisted of 34 banks. The facility was initiated for refinancing of bank debt and as a standby facility. Rabobank’s share is estimated at US$ 147 million (€ 105 million).57
In February 2011 Rabobank participated in a syndicated revolving credit facility for Cargill. The total value of the facility was US$ 1,250 million (€ 888 million). The banking syndicate consisted of 23 banks. The maturity date was in March 2012. The facility was initiated for general corporate and working capital purposes. Rabobank committed an amount of US$ 60 million (€ 43 million).58
In February 2012 Rabobank participated in a syndicated revolving credit facility for Cargill. The total value of the facility was US$ 1,250 million (€ 946 million). The banking syndicate consisted of 25 banks. The maturity date was in March 2013. The facility was initiated for general corporate purposes, working capital and refinancing of bank debt. Rabobank’s share is estimated at US$ 50 million (€ 38 million).59
In February 2013 Rabobank participated in a syndicated revolving credit facility for Cargill. The total value of the facility was US$ 1,250 million (€ 965 million). The banking syndicate consisted of 31 banks. The maturity date is in March 2014. The facility was initiated for general corporate purposes and refinancing of bank debt. Rabobank’s share is estimated at US$ 40 million (€ 31 million).60
Copersucar: As of 31 March 2012 Rabobank provided an export advance to Copersucar. The total
value of the facility was R$ 182 million (€ 75 million). The maturity date is in March 2014.61
-26-
As of 31 March 2013 Rabobank provided NCE financing to Copersucar. The total value of the facility was R$ 72 million (€ 28 million). The maturity date is in March 2014.62
As of 31 March 2013 Rabobank provided working capital financing to Copersucar. The total value of the facility was R$ 202 million (€ 78 million). The maturity date is in 2014.63
Louis Dreyfus: In October 2010 Rabobank participated in a syndicated revolving credit facility for Louis
Dreyfus Energy, a subsidiary of Louis Dreyfus. The total value of the facility was US$ 2,000 million (€ 1,443 million), consisting of a three-year revolving credit facility with a value of US$ 1,250 million and five-year revolving credit facility with a value of US$ 750 million. The banking syndicate consisted of 16 banks and was led by five banks. The facility was initiated for general corporate, working capital and refinancing purposes. Rabobank’s share is estimated at US$ 61 million (€ 44 million).64
In May 2011 Rabobank participated in a syndicated credit facility for Louis Dreyfus Commodities Asia, a subsidiary of Louis Dreyfus. The total value of the facility was US$ 400 million (€ 278 million), consisting of a three-year US$ 242 million term loan, a five-year US$ 55 million term loan and a three-year US$ 104 million revolving credit facility. The banking syndicate consisted of 22 banks. The facility was initiated for general corporate purposes. Rabobank committed an amount of US$ 20 million (€ 14 million).65
In October 2011 Rabobank participated in a syndicated credit facility for Louis Dreyfus. The total value of the facility was US$ 797 million (€ 605 million), consisting of US$ 227 million term loan and two revolving credit facilities totaling US$ 571 million. The banking syndicate consisted of 28 banks. The maturity date is in December 2014. The facility was initiated for general corporate purposes. Rabobank’s share is estimated at US$ 28 million (€ 21 million).66
In April 2012 Rabobank participated in a syndicated revolving credit facility for Louis Dreyfus. The total value of the facility was US$ 805 million (€ 619 million), consisting of an one-year revolving credit facility of US$ 537 million and a three-year revolving credit facility of US$ 268 million. The banking syndicate consisted of 24 banks and was led by seven banks including Rabobank. The facility was initiated for general corporate purposes. Rabobank’s share is estimated at US$ 86 million (€ 66 million).67
In May 2013 Rabobank participated in a syndicated revolving credit facility for Louis Dreyfus. The total value of the facility was US$ 710 million (€ 546 million). The banking syndicate consisted of 15 banks and was led by seven banks including Rabobank. The facility was initiated for general corporate purposes. Rabobank’s share is estimated at US$ 76 million (€ 59 million).68
Olam International: In April 2011 Rabobank participated in a syndicated loan facility for Olam International.
The total value of the facility was US$ 1,250 million (€ 877 million), consisting of an three-year loan of US$ 625 million and a five-year loan of US$ 625 million. The banking syndicate consisted of 32 banks. The facility was initiated for general corporate purposes, working capital and refinancing of bank debt. Rabobank committed an amount of US$ 61.4 million (€ 43 million).69
Sucres & Denrées:
-27-
In November 2010 Rabobank participated in a syndicated revolving credit facility for Sucres & Denrées. The total value of the facility was US$ 180 million (€ 129 million). The banking syndicate consisted of 11 banks and was led by five banks. The maturity date is in March 2012. The facility was initiated for general corporate purposes and refinancing of bank debt. Rabobank committed an amount of US$ 10 million (€ 7 million).70
In August 2011 Rabobank participated in a syndicated revolving credit facility for Sucden Americas, a subsidiary of Sucres & Denrées. The total value of the facility was US$ 200 million (€ 140 million). The banking syndicate consisted of nine banks and was led by two banks. The maturity date is in August 2014. The facility was initiated for general corporate purposes. Rabobank’s share is estimated at US$ 10 million (€ 7 million).71
In March 2012 Rabobank participated in a syndicated revolving credit facility for Sucres & Denrées. The total value of the facility was US$ 180 million (€ 137 million). The banking syndicate consisted of 11 banks. The maturity date is in March 2013. The facility was initiated for general corporate purposes. Rabobank’s share is estimated at US$ 16 million (€ 12 million).72
In February 2013 Rabobank participated in a syndicated revolving credit facility for Sucres & Denrées. The total value of the facility was US$ 210 million (€ 159 million). The banking syndicate consisted of 11 banks. The maturity date is in February 2014. The facility was initiated for general corporate purposes and refinancing of bank debt. Rabobank’s share is estimated at US$ 19 million (€ 14 million).73
Tate & Lyle: In July 2011 Rabobank participated in a syndicated revolving credit facility for Tate &
Lyle. The total value of the facility was US$ 800 million (€ 572 million). The banking syndicate consisted of nine banks. The maturity date is in July 2016. The facility was initiated for general corporate purposes and refinancing of bank debt. Rabobank’s share is estimated at US$ 89 million (€ 64 million).74
Wilmar International: In July 2010 Rabobank participated in a syndicated working capital facility for Wilmar
International. The total value of the facility was US$ 1,907 million (€ 1,359 million). The facility was split into six tranches: a one-year US$ 300 million term loan; a two-year US$ 400 million term loan; a three-year US$ 400 million term loan; a five-year US$ 200 million term loan; a one-year US$ 202 million working capital facility; a two-year US$ 202 million working capital facility; a three-year US$ 202 million working capital facility.
The banking syndicate consisted of 12 banks and was led by two banks. The facility was initiated to finance the US$ 1,500 million acquisition of Sucrogen (Australia). Rabobank’s share is estimated at US$ 115 million (€ 82 million).75
In October 2011 Rabobank participated in a syndicated revolving credit facility for Wilmar International. The total value of the facility was US$ 500 million (€ 353 million). The banking syndicate consisted of 12 banks and led by one bank. The maturity date was in November 2012. The facility was initiated as an amendment to the US$ 300 million facility of 2010. It was also used to refinance part of the loan to Sucrogen. Rabobank’s share is estimated at US$ 36 million (€ 26 million).76
-28-

In October 2012 Rabobank participated in a syndicated revolving credit facility for Wealth Anchor, a wholly-owned subsidiary of Wilmar International (called Wilmar Sugar Holdings Pte (WSH) as of January 2013). The total value of the facility was US$ 837 million (€ 650 million), consisting of a US$ 632 million term loan and an A$ 200 million revolving credit facility. The banking syndicate consisted of 11 banks for the term loan and eight banks for the revolving credit facility and was led by one bank. The maturity date is in October 2013. The facility was initiated as an extension of several tranches of the existing facility from November 2010 in connection with the acquisition of Sucrogen. Rabobank’s share is estimated at US$ 50 million (€ 39 million).77
-29-
Appendix 1 References
-30-
1 Bunge, “Form 8-K”, Bunge, 25 March 2011; Thomson One Database, “Tear sheet deal number 2693988115”, Thomson One Database, 10 February 2011.
2 Thomson One Database, “Tear sheet deal number 2826407115”, Thomson One Database, 13 February 2012.3 Thomson One Database, “Tear sheet deal number 2800941115”, Thomson One Database, 13 October 2011.4 Thomson One Database, “Tear sheet deal number 2840246115”, Thomson One Database, 3 April 2012.5 Thomson One Database, “Tear sheet deal number 2724301115”, Thomson One Database, 29 April 2011.6 Thomson One Database, “Tear sheet deal number 2771788115”, Thomson One Database, 19 August 2011.7 Thomson One Database, “Tear sheet deal number 2946646”, Thomson One Database, 28 February 2013.8 Danone, “Series No: 100. Tranche No: 1. Euro 500,000,000 2.50 per cent. Notes due September 2016”, Danone,
27 September 2011.9 Danone, “Series No: 104. Tranche No: 1. Euro 750,000,000 1.25 per cent. Notes due 6 June 2018”, Danone, 4
March 2013.10 Danone, “Series No: 106. Tranche No: 1. Euro 500,000,000 2.6 per cent. Notes due 28 June 2023”, Danone, 26
June 2013.11 Thomson One Database, “Tear sheet deal number 2702777”, Thomson One Database, 8 March 2011.12 Thomson One Database, “Tear sheet deal number 2859599”, Thomson One Database, 12 June 2012.13 Thomson One Database, “Tear sheet deal number 2883975”, Thomson One Database, 28 August 2012.14 Thomson One Database, “Tear sheet deal number 2998406”, Thomson One Database, 23 July 2013.15 Thomson One Database, “Tear sheet deal number 2759056115”, Thomson One Database, 1 July 2011.16 Thomson One Database, “Tear sheet deal number 2649507115”, Thomson One Database, 15 October 2010.17 Thomson One Database, “Tear sheet deal number 2780168115”, Thomson One Database, 21 September 2011.18 Thomson One Database, “Tear sheet deal number 2893369115”, Thomson One Database, 15 September 2012.19 Thomson One Database, “Tear sheet deal number 2658977115”, Thomson One Database, 29 October 2010.20 Thomson One Database, “Tear sheet deal number 2789894115”, Thomson One Database, 28 October 2011.21 Thomson One Database, “Tear sheet deal number 2923637115”, Thomson One Database, 14 December 2012.22 Bunge, “Form 8-K”, Bunge, 25 March 2011; Thomson One Database, “Tear sheet deal number 2693988115”,
Thomson One Database, 10 February 2011.23 Bunge, “Form 8-K”, Bunge, 17 November 2011; Thomson One Database, “Tear sheet deal number 2794169115”,
Thomson One Database, 17 November 2011.24 Thomson One Database, “Tear sheet deal number 2638204115”, Thomson One Database, 29 September 2010.25 Thomson One Database, “Tear sheet deal number 2700680115”, Thomson One Database, 26 February 2011;
Thomson One Database, “Tear sheet deal number 2709932115”, Thomson One Database, 26 February 2011.26 Thomson One Database, “Tear sheet deal number 2773409115”, Thomson One Database, 20 September 2011.27 Thomson One Database, “Tear sheet deal number 2826407115”, Thomson One Database, 13 February 2012.28 Thomson One Database, “Tear sheet deal number 2900578115”, Thomson One Database, 29 September 2012.29 Thomson One Database, “Tear sheet deal number 2939936115”, Thomson One Database, 7 February 2013.30 Thomson One Database, “Tear sheet deal number 2800941115”, Thomson One Database, 13 October 2011.31 Thomson One Database, “Tear sheet deal number 2926188115”, Thomson One Database, 9 November 2012.32 Thomson One Database, “Tear sheet deal number 2724301115”, Thomson One Database, 29 April 2011.33 Thomson One Database, “Tear sheet deal number 2705540115”, Thomson One Database, 12 November 2010.34 Thomson One Database, “Tear sheet deal number 2912157115”, Thomson One Database, 8 March 2012.35 Thomson One Database, “Tear sheet deal number 2946543115”, Thomson One Database, 25 February 2013.36 Thomson One Database, “Tear sheet deal number 2757425115”, Thomson One Database, 13 July 2011.37 Thomson One Database, “Tear sheet deal number 2669286”, Thomson One Database, 8 December 2010.38 Thomson One Database, “Tear sheet deal number 2729432”, Thomson One Database, 16 May 2011.39 Thomson One Database, “Tear sheet deal number 2791173”, Thomson One Database, 14 November 2011.40 Thomson One Database, “Tear sheet deal number 2850880”, Thomson One Database, 14 May 2012.
41 Thomson One Database, “Tear sheet deal number 2940183”, Thomson One Database, 11 February 2013.42 Thomson One Database, “Tear sheet deal number 2936066”, Thomson One Database, 11 October 2012.43 Nestlé, “Issue of AUD 175,000,000 5.50 per cent. Notes due 28 January 2016”, Nestlé, 25 January 2011.44 Nestlé, “Issue of NOK 1,000,000,000 3.375 per cent. Notes due 8 February 2016”, Nestlé, 3 February 2011.45 Nestlé, “Issue of A$ 125,000,000 4.625 per cent. Notes due 29 March 2017”, Nestlé, 22 March 2012.46 Thomson One Database, “Tear sheet deal number 2859599”, Thomson One Database, 12 June 2012.47 Thomson One Database, “Tear sheet deal number 2787844”, Thomson One Database, 3 November 2011.48 Thomson One Database, “Tear sheet deal number 2614176115”, Thomson One Database, 13 July 2010.49 Thomson One Database, “Tear sheet deal number 2838860115”, Thomson One Database, 24 March 2012.50 Thomson One Database, “Tear sheet deal number 2696718115”, Thomson One Database, 7 February 2011.51 Thomson One Database, “Tear sheet deal number 2810911115”, Thomson One Database, 6 January 2012.52 Thomson One Database, “Tear sheet deal number 2827355115”, Thomson One Database, 25 February 2012.53 Thomson One Database, “Tear sheet deal number 2707500115”, Thomson One Database, 7 March 2011.54 Thomson One Database, “Tear sheet deal number 2658977115”, Thomson One Database, 29 October 2010.55 Bunge, “Form 8-K”, Bunge, 25 March 2011; Thomson One Database, “Tear sheet deal number 2693988115”,
Thomson One Database, 10 February 2011.56 Bunge, “Form 8-K”, Bunge, 17 November 2011; Thomson One Database, “Tear sheet deal number 2794169115”,
Thomson One Database, 17 November 2011.57 Thomson One Database, “Tear sheet deal number 2638204115”, Thomson One Database, 29 September 2010.58 Thomson One Database, “Tear sheet deal number 2700680115”, Thomson One Database, 26 February 2011;
Thomson One Database, “Tear sheet deal number 2709932115”, Thomson One Database, 26 February 2011.59 Thomson One Database, “Tear sheet deal number 2826407115”, Thomson One Database, 13 February 2012.60 Thomson One Database, “Tear sheet deal number 2939936115”, Thomson One Database, 7 February 2013.61 Copersucar, “Financial Statements March 31, 2012 and 2011”, Copersucar, June 2012.62 Copersucar, “Financial Statements March 31, 2012 and 2011”, Copersucar, June 2012; Copersucar, “Financial
Statements March 31, 2013 and 2012”, Copersucar, July 2013.63 Copersucar, “Financial Statements March 31, 2013 and 2012”, Copersucar, July 2013.64 Thomson One Database, “Tear sheet deal number 2654282115”, Thomson One Database, 27 October 2010.65 Thomson One Database, “Tear sheet deal number 2733582115”, Thomson One Database, 23 May 2011.66 Thomson One Database, “Tear sheet deal number 2800941115”, Thomson One Database, 13 October 2011.67 Thomson One Database, “Tear sheet deal number 2840246115”, Thomson One Database, 3 April 2012.68 Thomson One Database, “Tear sheet deal number 2990467115”, Thomson One Database, 13 May 2013.69 Thomson One Database, “Tear sheet deal number 2724301115”, Thomson One Database, 29 April 2011.70 Thomson One Database, “Tear sheet deal number 2705540115”, Thomson One Database, 12 November 2010.71 Thomson One Database, “Tear sheet deal number 2771788115”, Thomson One Database, 19 August 2011.72 Thomson One Database, “Tear sheet deal number 2912157115”, Thomson One Database, 8 March 2012.73 Thomson One Database, “Tear sheet deal number 2946543115”, Thomson One Database, 25 February 2013.74 Thomson One Database, “Tear sheet deal number 2757425115”, Thomson One Database, 13 July 2011.75 Thomson One Database, “Tear sheet deal number 2620578115”, Thomson One Database, 31 July 2010.76 Thomson One Database, “Tear sheet deal number 2787717115”, Thomson One Database, 1 October 2011.77 Thomson ONE Database, “Tear sheet deal number 2901532115”, Thomson ONE Database, 2 October 2012;
Wilmar International, “Repayment, extension and upsizing of syndicated term loan facility and extension of syndicated revolving credit facility”, Wilmar International, 2 October 2012.


![q$}T7s8}j‡]Bt˝s{˝Ns˝‡—sj3B—{‡R$tqs}}$t˙stI]Bt˝s{˝ BI‡!}‡—s ...amfarid.scripts.mit.edu/resources/Theses/NAN-TB00.pdfb;˛ ˛ ^ b;˛ > ˛ < ) ( \ Q bp ~](https://img.pdfslide.us/doc/110x75/5ecc08476c348842c3653747/qt7s8jabtsnsaasj3baartqststibts-biaaas.jpg)