Embed Size (px)
Citation preview
1
MANAGEMENT OF INFORMATION AS PREDICTOR OF ACADEMIC
PLANNING EFFECTIVENESS IN NIGERIAN UNIVERSITIES
BY
Emmanuel Aileonokhuoya ISAH
40624
B.Ed Hons Educational Management and Economics (Ibadan)
M.Ed Educational Management Information Systems (Ibadan)
PGDCS Federal University of Agriculture, Abeokuta (FUNAAB)
A Thesis in the Department of Educational Management
Submitted to the Faculty of Education in partial fulfillment of the
requirement for the Degree of
DOCTOR OF PHILOSOPHY
of the
UNIVERSITY OF IBADAN
FEBRUARY, 2012
ii
ABSTRACT
The problem of unreliable information has crept into the Nigerian university system
adversely influencing academic planning effectiveness. Previous studies have
investigated the management of information acquisition, dissemination and administrative
effectiveness, but have not adequately addressed the management of information as a
predictor of Academic Planning Effectiveness (APE). This study, therefore, investigated
the management of information as a predictor of academic planning effectiveness in
Nigerian universities.
The study adopted the survey research design of the ex-post facto type using the multi
stage sampling procedure. The study population comprised 14 Directors of Academic
Planning Units (APU) and Information Technology Centres (ITC), 813 Lecturers, 3,269
new undergraduate students, 3,064 final year students purposively selected from Faculties
of Arts, Education, Social Sciences, Science and Agriculture from seven of Nigeria‟s
thirteen first and second generation universities. Four questionnaires: Nigerian
Universities Information and Academic Planning Effectiveness Questionnaire
(NUIAPEQ) 1- 4, and a checklist were used to elicit responses. NUIAPEQ 1 for Directors
of APU/ITC (r = 0.80), NUIAPEQ 2 (r=0.60) for lecturers, NUIAPEQ 3 (r=0.60) for new
students and NUIAPEQ 4 (r=0.76) for final year undergraduates. Seven research
questions were answered in addition to five hypotheses that were tested at 0.05 level of
significance. Data were analysed using descriptive statistics, Pearson Product Moment
Correlation (PPMC) and multiple regression.
Significant multiple relationship existed among Information Generation (IG), Information
Availability (IA), Information Utilisation (IU) and Academic Planning Effectiveness
(APE). Correlation between IG and APE for Directors of APU/ITC (r=0.73), lecturers IG
and APE (r=0.23), new undergraduates (r=0.27) and final year (r=0.32) at p<0.05.
Correlation between IA and APE for Directors (r= 0.84), lecturers (r=0.32), new
undergraduates(r=0.26) and final year (0.33) at p<0.05. Correlation between IU and APE
for Directors (r=0.64), lecturers (r=0.26), new students (r=0.33) final year students
(r=0.44) at p<0.05. Combined influence of IG,IA,IU on APE were observed: directors
(R=0.089, R2=0.78, F(3,11) =114.94), lecturers (R=0.56, R2=0.31, F(3,773) =117.92), final
year students (R=0.40, R2=0.16, F(3,2927)=187.66), new students (R=0.34, R2=0.115
F(3,3251)=140.65) at p<0.05. Relative contributions were made to APE by IG in the
following order: lecturers (β=0.91, t=1.75), directors (β=0.64, t=1.62), final year students
(β = 0.13, t=6.44), new students (β=0.15, t=9.90), IA to APE; Directors (β = 1.12,
t=1.95), lecturers (β = 0.45, t=8.96), new undergraduates (β=0.19, t=6.13) final year
students (β= 0.28, t=8.88), IU to APE; final year students (β= 0.38, t=11.27), lecturers
(β=0.34, t=8.12),Directors (β= 0.22, t=0.54), new undergraduates (β= 0.15, t=6.08) at
p<0.05.
Information generation, availability and utilisation significantly influenced APE.
Universities should be adequately funded to enable effective maintenance of equipment
needed to continuously impact positively on APE. Regular training and updating on ICT
usage for directors of APU/ITC, lecturers and students should be provided to improve
APE.
iii
Key word: Information Management, Academic planning effectiveness, Nigerian
universities
Word count: 444
iv
ACKNOWLEDGEMENTS
I hereby thank the supervisors who supervised this project from inception to
finishing. I wish to thank my initial supervisors, Dr. Martins Fabunmi and Dr. A.O.
Ayeni who painstakingly effected corrections to this work and encouraged me to
complete the project. My thanks also go to the present Acting Head of Department,
Dr. B.O.Emunemu whom the Good Lord graciously used to complete the process, for
his painstaking reading and final supervision of the thesis.
I also thank all members of staff of the Department of Educational
Management that assisted in no small measure to complete the work. I sincerely thank
all my lecturers in the Department. I acknowledge most sincerely, Professor Joel
Babalola who has been a mentor to me and has been instrumental to my sustained
interest to complete the programme. I acknowledge Professor, M. Ogunsanya, Dr
(Mrs) A.O. Jaiyeoba and Dr. S.O. Adedeji, my former Heads of Department (HOD).
My thanks are bountiful to Dr. Ben Emunemu former PG coordinator now HOD, that
has expended energy at each stage of the programme. I acknowledge Professor
Kayode Ajayi, Dr. Femi Akinwumi, Drs. D.O. Olaniyan, A.I. Atanda and I.A. Raji,
lecturers‟ in the Department.
I acknowledge and appreciate all the people whom God used to assist me
during my several field trips across the country especially the journey through the six
geopolitical zones of Nigeria. I wish to specifically appreciate the Deeper Life Bible
Church (DLBC) family in Kano, Zaria, Maiduguri, Nsukka and Portharcourt.
At Bayero University in Kano, I had the extra ordinary priviledge of
interacting with Prof. M.C. Duze the Director of Academic Planning and Professor of
Demography. I also met Mr. Abba Shittu, a planning officer with a pleasant
personality. My interaction with the Ag. Director of ICT/MIS in BUK Dr. A.A. Ali
was highly rewarding and enriching. I appreciate him and the Deans of the Faculties
of Science, Agriculture and Education in BUK who came to my rescue from an angry
mob that mistook my questionnaire for seditious materials.
I sincerely express my gratitude to the Director of ICT/MIS at ABU in Zaria.
The Vice Chancellor and the DVC in ABU are wonderful people. As could be
deduced from the appendices, my application for permission to carry out research was
granted within 12 hours in writing despite their busy schedules. I thank the Director of
Academic Planning at Unilorin and the Chief Planning Officer Mr. J. Adewara, it was
v
pleasant and pleasurable interacting with them. I appreciate the Vice Chancellor of the
University of Portharcourt, Professor Don Baridon for permission granted me to carry
out research in his institution in writing within 24 hours (see appendices). I appreciate
Mrs M.M. Orji, a staff of the Academic Planning Unit of the university, Director of
ICT in Uniport, Dr. E.T. Iyagba and his secretary Mr. S.T. Aweka. Other members of
the University of Portharcourt community to whom I remain eternally grateful
include; Drs. Godly Ottoh in the Department of Economics, HOD (Economics), HOD
of Educational Management, Dr. S.O. Nwafor, HOD, (Fisheries and wildlife), Dr.
Ayo Aaiyeloja and others at Uniport that include; Drs .Josephine Anaekwe of the
Faculty of Education, Dr. and Mrs. Nath-Abraham of the Department of Educational
Management and Mr. Samuel Makwe, a graduate of the Department of Economics,
Uniport that served as research assistants.
At the University of Nigeria, Nsukka, I appreciate the immediate past
Director of Academic planning Professor C.C. Agu, Mrs. D. Izukaine, Chief Planning
Officer of the university, the University Librarian, Dr. Charles Omeku and brethren of
the Deeperlife Campus Fellowship who served as my research assistants. I also thank
Mr. Ohis Orhewere, a 200L student of the Department of Library science at the
university of Nigeria who was my direct assistant. I thank the Director of ICT that
spent much time to attend to my questionnaire and also addressed the checklist.
The University of Maiduguri was a great challenge as the distance was
frightening from Ibadan. Considering the harshness of the weather and several other
challenges particularly language barrier, religious hostility, general insecurity and
threat to life. I give thanks to Mr. Ayodele Idris, a lecturer from Yobe State
Polytechnic, Damaturu that assisted me as research assistant to complete the
administration of the questionnaire.
I wish to thank several other people that need to be appreciated for their
contributions in criticizing aspects of the work and they include; Drs A. O.
Okwillagwe, present Ag HOD LARIS, and Dr. S.O. Popoola of the same department,
Dr (Mrs.) Rosemary Agbonlahor, Dr. A.B.C. Robert, Dr. Toyin Adeleke and Rev (Dr)
A. Onuka. I am grateful to all members of the Higher Education Research and Policy
Network (HERPNET), particularly those in the steering committee.
I appreciate Barrister Francis Olise, his wife Nkechi, Mr. Innocent Abu,
Patrick Okoh, Jire Adeleke, Peter Aikpokpodion, Julius Olukunle, Pastors S.O
vi
Aderibigbe, M.O. Adebanjo, Bade Ibrahim, N.O. Oladosu, S.A. Adeyemi, Tunde
Taiwo, and Lekan Ogunyebi.
Finally, I wish to appreciate my dear wife, Dr. (Mrs) Olubukola Isah and
children; Faithful, Happiness and my beloved Praise who stood patiently and gave full
support to the programme. Despite my absence, they were all an encouragement to me
in conduct, prayer and moral support. I acknowledge my late parents Pa. M.O. Isah
and Mrs. Beatrice Isah. This acknowledgment wont be complete except I mention and
thank most especially my parents in - law Pa A.A Oduroye and Mama C.O. Oduroye
for their understanding and encouragement. I express my due regards to my elder
sister, Helen Imoagene (Nee Isah).
vii
DEDICATION
This Thesis is dedicated to the Lord God Almighty and to my dear wife and Children
- Olubukola, Faithful, Happiness and Praise
viii
CERTIFICATION
I certify that this study was carried out by Mr. Emmanuel Aileonokhuoya Isah in the
Department of Educational Management, Faculty of Education, University of Ibadan,
Ibadan, Nigeria.
……………………………………….
SUPERVISOR
Dr. B.O. Emunemu
B.Ed., M.Ed., Ph.D (Ibadan)
ix
TABLE OF CONTENTS
Pages
Title Page i
Abstract ii
Acknowledgements iv
Dedication vii
Certification viii
Table of Contents ix
List of Tables xii
List of Figures xv
CHAPTER ONE: INTRODUCTION 1
1.1 Background to the Study 1
1.2 Statement of the Problem 12
1.3 Research Questions 13
1.4 Hypotheses 14
1.5 Purpose of the Study 14
1.6 Significance of the Study 15
1.7 Scope of the Study 16
1.8 Definition of Terms 16
CHAPTER TWO: LITERATURE REVIEW 18
2.1 Managing information through its Generation for
Academic Planning Effectiveness in Nigerian Universities 18
2.2 Managing information through its Availability for
Academic Planning Effectiveness in Nigerian Universities 27
2.3 Managing information through its utilisation for
Academic Planning Effectiveness in Nigerian Universities 29
2.3.1 Information Utilisation Capacities in Organisations 34
2.4 Overview of Academic Planning and its Effectiveness in
Nigerian Universities 37
x
2.5 Information Management Policy Evolution in Nigerian
and the influence of Information Communication Technology
(ICT) to Education/Academic Planning Effectiveness in Nigerian
Universities 41
2.6 Appraisal of Literature 48
2.7 Theoretical Framework 50
2.8 Conceptual Model 57
CHAPTER THREE: METHODOLOGY 60
3.1 Research Design 60
3.2 Study Population 60
3.3 Sampling Procedure and Sampling Technique 60
3.4 Research Instruments 66
3.5 Validity of Instruments 66
3.6 Reliability of Instruments 67
3.7 Instrument Administration 68
3.8 Method of Data Analysis 69
CHAPTER FOUR: RESULTS AND DISCUSSIONS 71
4.1 Research Question 1 71
4.2 Research Question 2 75
4.3 Research Question 3 78
4.4 Research Question 4 81
4.5 Research Question 5 83
4.6 Research Question 6 85
4.7 Research Question 7 90
4.8 Test of Hypotheses 91
4.9 Summary of Findings 103
4.10 Discussion 104
xi
CHAPTER FIVE: SUMMARY, CONCLUSION
AND RECOMMENDATIONS 131
5.1 Summary 131
5.2 Conclusion 133
5.3 Recommendations 134
5.4 Implications of the Study to Planning and Policy 136
5.5 Suggestions for Further Research 137
5.6 Contribution to Knowledge 138
5.7 Limitations of the Study 138
References 139
Appendices 151
xii
LIST OF TABLES
3.1 Sample of first generation Nigerian universities according
to Geopolitical Zones 62
3.2 Sample of second generation Nigerian universities according
to Geopolitical zones 62
3.3 Sample of academic staff and Directors of academic planning/ICT
in Nigeria‟s first and second generation universities 63
3.4 Selected sample of freshmen and women in sampled faculties
in Nigeria‟s first and second generation universities. 64
3.5 Selected sample of final year undergraduates in sampled
faculties in Nigeria‟s first and second generation universities. 65
3.6 Response rate by respondents and institutions 68
4.1 Perceived Management of information generation (IG) level in
first and second generation Nigerian universities for Directors
of APU/ICT 71
4.2 Perceived MIS generation (IG) level for freshmen and
women in Nigerian universities 72
4.3 Perceived MIS generation (IG) level for final year
students in Nigerian universities 72
4.4 Perceived MIS generation (IG) levels for academic staff in
Nigerian universities 73
4.5 Information utilisation capacity in Nigerian universities. 75
4.6 Information utilisation capacity for academic staff in
Nigerian universities 76
4.7 Information utilisation capacity for fresh undergraduates
in Nigerian universities 77
4.8 Information utilisation capacity for final year students
in Nigerian universities 77
4.9 Access to available data/information storage facilities in
Nigerian universities 79
4.10 Perceived integrity of information generated in Nigerian
universities by academic staff for academic planning
effectiveness. 82
xiii
4.11 Foundational levels of ICT preparedness in Nigerian
universities 84
4.12 Perception of university lecturers on academic planning
effectiveness (infrastructure) in Nigeria universities. 86
4.13 Perception of students on academic planning effectiveness
(infrastructure) in Nigerian universities 88
4.14 Perceived evidences of training by Nigerian universities in
ICT to influence contributions to academic planning
effectiveness among university lecturers and undergraduates. 90
4.15 Relationship between MIS generation (IG) and academic
planning effectiveness (APE) for Directors of academic
planning/ICT in Nigerian universities 91
4.16 Relationship between MIS generation (IG) and academic
planning effectiveness (APE) of freshmen in Nigerian universities. 92
4.17 Relationship between MIS generation (IG) and academic planning
effectiveness (APE) of final year Students in Nigerian universities. 92
4.18 Relationship between MIS generation (IG) and academic planning
effectiveness (APE) of academic staff in Nigerian universities. 93
4.19 Relationship between MIS availability (IA) and academic planning
effectiveness (APE) for Directors of academic planning/ICT
in Nigerian universities. 94
4.20 Relationship between MIS availability (IA) and academic planning
effectiveness (APE) of fresh students in Nigerian universities 94
4.21 Relationship between MIS availability (IA) and academic planning
effectiveness (APE) of final year students in Nigerian universities. 95
4.22 Relationship between MIS availability (IA) and academic planning
effectiveness (APE) of academic staff in Nigerian universities. 95
4.23 Relationship between MIS utilisation (IU) and academic planning
effectiveness (APE) for Directors of academic planning/ICT
in Nigerian universities 96
4.24 Relationship between MIS utilisation (IU) and
academic planning effectiveness (APE) of fresh
students in Nigerian universities. 96
xiv
4.25 Relationship between MIS utilisation (IU) and
academic planning effectiveness (APE) for final
year students in Nigerian universities 97
4.26 Relationship between MIS utilisation (IU) and
academic planning effectiveness (APE) of academic
staff in Nigerian universities. 97
4.27 ANOVA and Model summary of multiple regression analysis
(IG, IA, IU) and APE for Directors of academic planning/ICT
in Nigerian universities. 98
4.28 ANOVA and Model summary of multiple regression analysis
(IG, IA, IU) and APE for freshmen and women in Nigerian
Universities. 99
4.29 ANOVA and Model summary of multiple regression analysis
(IG, IA, IU) and APE for final year men and women in
Nigerian universities. 99
4.30 ANOVA and Model summary of multiple regression analysis
(IG, IA,IU) and APE for academic staff in Nigerian
Universities. 100
4.31 Relative contributions of influence of MIS (IG, IA, IU)
to APE for Directors of academic planning/ICT in
Nigerian universities 101
4.32 Relative contributions of influence of MIS (IG, IA, IU)
to APE for freshmen and women in Nigerian universities 101
4.33 Relative contributions of influence of MIS (IG, IA, IU) to
APE for final year students in Nigerian universities. 102
4.34 Relative contributions of influence of MIS (IG, IA, IU) to
APE for academic staff in Nigerian universities 102
xv
LIST OF FIGURES
Fig 1 Model for disciplines in early stages of formation 55
Fig 2 Conceptual model for academic planning
effectiveness in Nigerian universities 58
Fig 3 Categories of respondents aggregate contributions
to MIS generation in Nigerian universities 74
Fig 4 Aggregate contributions to MIS utilisation for academic
planning in Nigerian universities 78
Fig 5 Bar Chart showing disaggregated MIS-infrastructure
availability among final year students in Nigerian
universities. 80
Fig 6 MIS-infrastructure availability among lecturers in
Nigerian universities. 81
1
CHAPTER ONE
INTRODUCTION
1.1 Background to the Study
The planning of education is given utmost attention and priority universally
and Nigeria is not left out of this quest. Okoli and Umeh (2007), explain that the
Nigerian government pays much attention to the production of manpower through
its educational system hence, expends heavily on education. The Nigerian
National Policy on Education (Federal Republic of Nigeria, 2004:2) describes
education as „instrument par excellence‟ implying the priority the Federal
Government of Nigeria (FGN) attaches to education and by extension, educational
planning. Education and its planning are perceived by the FGN as pivotal to
Nigeria‟s growth, development and aspirations.
The beginning and development of modern university education is ascribed to
universities in Europe specially Bologna in Italy, Oxford and Cambridge in the
United Kingdom between the ninth and eleventh centuries (Adekanbi, 2008). It
was after these initial universities that other universities began to evolve in other
parts of the world but researchers recall that at the times under reference, Africa
was still in her primitive stages in the shackles of slave trade and later in the yokes
of colonial masters. Global trends at the time indicated that educational
development specially western education was non- existent in Sub Saharan Africa
and Nigeria. Freedom did not beckon to Africa until the 18th
century when
educational reforms began in the colonies and in the then protectorates of Britain.
Nigeria gained political independence from Britain in 1960.
Fafunwa (1974), explained that university education was introduced into
Nigeria before political independence. The University College, Ibadan was
established in 1948. At the time the full fledged university of Ibadan came into
being in 1962, other universities in othser parts of the world had reviewed their
vision and mission plans several times since they were several centuries older than
the first university college in Nigeria (Adekanbi, 2008). Added to this, Nigeria‟s
university education development began late like other Sub Saharan African
countries. One of the reasons for this late development was due to the advocacy
mounted by the early Human Capital Theorist (HCT) of the late nineteenth and
2
early twentieth centuries in favour of the development of primary and secondary
education to the detriment of university and tertiary education. Later, some HCT
scholars as Schultz (1971), and Psacharaopoulus (1973), modified the early
assertions of the HCT that was eventually amplified by modern HCT. A school of
thought among modern HCT advocated that governments must invest in the
production of high level technical manpower while another school of thought like
the International Bank for Reconstruction and Development (IBRD) and
International Monetary Fund (IMF) were, and are still, of the opinion that the
forces of demand and supply should be allowed to determine the price of
education in the Third World. Babalola (2011), reviewing the positions of these
global bodies on their policies for sub-Saharan African education explicitly
informed the world that developing nations will not meet the goals of education
without government intervention and funding. It must be noted that not all initial
HCT were united on the issue of government non interference in tertiary
education.
The classical HCT propounded theories that found testing grounds in newly
independent nations like Nigeria. It was argued then that returns on investments in
primary and secondary education far outweighed returns on investments to tertiary
education that was then perceived elitist and luxurious by Human Capital
Theorists. Several scholars punctured the postulations of the early HCT. For
example, Akangbou (1985) saw university education in Nigeria as a place for
training high level technical manpower that could transform the Nigerian
economy and hence strongly advocated that any government interested in
developing its economy must first take interest in higher education and then invest
heavily in it. Longe (2000), was able to point out that the earnings which an
individual received commonly referred to as life earnings profile is a function of
the level of education received by the individual. In essence, a person with low
level of education will of necessity receive lower income since skills acquired at
that level will also be low. Further to this, International Bank for Reconstruction
and Development (IBRD, 2007), Erwat, Isah and Fabunmi (2008) were able to
show that developing nations that paid attention to the development of tertiary
education excelled beyond others in recent years, for example, the countries of
East Asia commonly referred to as the Asian Tigers (Korea, Singapore, Taiwan,
Hong Kong, Malaysia etc) had, in the last quarter of the last century, recorded
3
tremendous growth in their economies that was ascribed to the role played by
changes in education and especially their renewed emphasis on higher education.
The laudable achievement of the Asian Tigers reflected on the vision of
developing world economies to review education and tertiary education policies.
Prior to Nigeria‟s independence, in 1960, the FGN saw the need to plan
education hence it inaugurated the Ashby commission (FRN, 1960) to look into
and plan education especially tertiary education (universities) for a period of
twenty years, from 1960 to 1980. The purpose of such planning was to ensure that
there were sufficient high level technical manpower to replace the colonial
expatriates and other high level technical manpower that will be vacating Nigeria
after political independence in 1960. Akangbou (1985) and Fabunmi (2004)
reported that the Ashby commission recommended an additional four universities
to the then existing University of College at Ibadan to make five. However, it was
observed that by 1970 just ten years after the adoption of the policy, there were
already six functioning universities in Nigeria with the sixth being the University
of Benin. This was perceived to mean failure of the plan.
Most scholars saw the cause of the failure of that plan as being the adoption of
the Harbinson rule of the thumb principle for decision making in connection with
estimates for those to benefit from the policy. Fabunmi, (2004) reported that the
method adopted was unempirical and such by 1978, Nigeria had thirteen
universities that heralded the founding of the Joint Admissions and Matriculation
Board (JAMB) with the mandate to manage admission into universities that have
in recent years transformed into the Universities and Tertiary Education
Matriculation Examination (UTME).
The establishment of JAMB to manage Nigeria‟s then thirteen universities was
a pointer to the failure of the projection of the 1960 Ashby commission report. In
1980, when a new plan was to commence, there were well over twenty four
universities in Nigeria comprising Federal and State universities in line with the
existing legislation on the provision of education at that time. The foregoing
explains the essence of planning education and underscores the importance of data
in national planning especially for planning education.
Scholars have insisted that data and information cannot be divorced from
planning and where data appear unreliable, suspect and inadequate, there will be
challenges in all planning done in that country including education as Nigeria and
4
other developing countries have been experiencing. Wonnacourt and Wonnacourt
(1977) explained that any plan that is not based on good information or is based
on suspect data is bound to fail. Aminu (1982) decried Nigeria‟s dependence on
heuristics citing non-availability of requisite data that has affected not only
education but other sectors of the Nigerian state as unacceptable.
The non-availability of requisite data apart from negatively affecting and
influencing the first post independence educational plan in Nigeria has also
affected some other laudable educational programmes negatively for example, the
1976 Federal Military Government (FMG) of Nigeria initiated Universal Primary
Education scheme was short lived due to poor educational planning data. The
programme adopted the use of prorated programmes to ameliorate obvious
shortages in manpower and infrastructure after the programme had taken off
which adversely affected the programme. In 1979, the Unity Party of Nigeria also
commenced a free education programme in five of the then nineteen states of the
Nigerian Federation. Dauda (1983) reported that improper planning on the part of
the politicians especially in the area of data caused the failure of the programme
although the military intervention into governance eventually destroyed every
plan but it was noted that non-availability of data was a major cause of failure.
Osokoya (2003) further explained that improper planning of education caused a
grave delay in the implementation of the national policy on education in 1981. In
Osokoya (2003) opinion, causes of delay in implementing educational
programmes included infrastructural inavailability and poor data availability. For
example; the exact number of teachers that were required to kickstart the
implementation of the programme state by state was ambiguous.
The data challenge has gradually been growing and as Popoola and Enwere
(2000) puts it; some factors are responsible for the non availability of data in
Nigeria. With data unavailable, it is clear that its manifestations will be great.
Scholars over the years have decried the poor management of information (data)
in Nigerian universities; (Ekwere, 1990; Nwankwo, 1981 and Adimorah, 1993).
Adeyemi and Uko - Aviomoh (2004), Akpochafo and Fellio (2006) were also
able to point out in their studies that the state of infrastructural decadence in
Nigeria‟s higher education was unacceptable. Adeyemi and Uko - Aviomoh
(2004) investigated the state of infrastructural lapses in Nigeria‟s Technological
institutions with a ten year projection exposing the gaps. Akpochafo and Fellio
5
(2006), on the other hand, examined infrastructural decay in tertiary institutions
and observed deficiencies. The deficiencies highlighted by Adeyemi and Uko
Aviomoh (2004); Akpochafo and Fellio (2006) pointed to lapses in some aspects
of Nigerian education system especially educational planning statistics at higher
education levels. To buttress their positions, the FGN/ASUU (2001 and 2009)
agreements pointed to the fact that all parties were aware that there are
infrastructural deficiencies in Nigerian universities and tertiary education system
that have not been addressed. These highlighted deficiencies point to some level
of lapses in academic planning in universities.
In most Nigerian universities, the academic planning unit or department is
often a part of the university central administration that is attached to the Vice
Chancellor‟s office due to its importance but is often not very visible in the
scheme of affairs. The functions of academic planning unit as stated by Ojedele
and Ilusanya (2006) are;
1. Planning university wide programmes in order to conform to minimum
academic standards as set out by the National Universities Commission (NUC).
2. Ensuring quality control internally for all academic programmes as set out by
the NUC.
3. Compiling and categorizing the teaching, research and equipment needs of
academic programmes in universities.
4. Assessing high level manpower requirement of the university.
5. Collecting, collating and analyzing data on staff, students and facilities as well
as recurrent expenditure in universities to ensure compliance with standards
and submitting same to the NUC with the aim of including such data in the
NUC data bank.
6. Preparing universities annual recurrent grant request to be included in the
University‟s annual budget preparation process for onward transmission to the
NUC to be incorporated into the NUC‟s budget preparation process.
7. Holding annual university system review meetings to enhance financial
projections and plans.
8. Evaluating the annual university target plans for each section of the university
and evaluating their performance for onward transmission to the university
authorities and the NUC.
6
9. Supplying information on departments, faculties and other important areas in
the university community with the intention of matching performance with
strategic plans.
From the foregoing which is not exhaustive, it is clear that the academic
planning unit serves as the hub upon which the university administrative and
managerial machinery rests. Interest for this study stems from item five and nine
(5,7,8 & 9) in the list of functions listed above to which this investigation is directly
targeted. While academic planning section serve as academic hub of universities,
most researchers have not seen the need for innovation in the university system which
could be the source of these perceived anomalies in the Nigerian university system
since it has the function of monitoring and control.
This investigation is of the assumption that a good plan would be monitored
until successfully executed. (Katz and Khan, 2006) described the department of
academic planning as the heart and soul of the university system. The Middle States
Commission in Higher Education in America (MSCHEA, 2005) explained that
information which will transform any university must include; definition of university
goals, implementation strategies of such goals, assessment and evaluation criteria of
the goals, paths to improvement after assessment. The document also explained that
the purpose of information is of extreme necessity to academic planning in that such
information gives an overview or a periodic self study of the institution, follow up on
academic activities, charts new road maps that outline assessment and documentation,
leads to general plans that come up with an understanding on the methods of
evaluation and assessment of information generation and its utilisation techniques.
Several possible options on the management of information usually arise in
organisations. These options are the components in management of information that
include; generation, availability and utilisation of information. As a higher education
institution, investigating academic planning effectiveness using information as a
background will need to answer mind boggling questions such as; what level of
information for planning is available in universities? Are these information classified?
From where does an academic planning unit generate its information? What is the
level of generated information in the process of managing information and what is the
level of utilisation of such information? How easy is it to eliciting information from
university administrators in the process of any endeavour or research project?
7
In the past, researches embarked upon by investigators were mostly concerned
with administrative performance of university personnel, instructional competences of
university teachers, infrastructural projections of universities etc (Soyibo, 1984) and
Ewart (2004). Again, most literature on academic planning have centred on university
self study programmes embarked upon by department of academic planning in
universities without a good synopsis on how that very department (Academic
planning) manages its information. An example of this can be deduced from Khaz and
Khan (2006). This investigation appears to be an independent pioneering investigation
into the effectiveness of academic planning in universities using information
management as its thrust.
Management of Information (MIS) has become a global issue. This is because
information has become an important resource for all organisations. It serves as
competitive edge for firms and organisations over another (Nwankwo, 1985). The
value of information and its management can further be captured from the works and
studies of Barnes (1966) who worked on the American Army and Military. As a
resource, information is indispensable. In university academic planning, it is difficult
to understand how information is managed without investigation. It is therefore
important to find out what happens to information generated in universities from
stakeholders. In this study, stakeholders include: Directors of Academic Planning
Units in Nigerian Universities and Directors of Centers of Information (Data
Processing Units/ Management Information Centres), lecturers and students (these
include new students and outgoing students) since it is possible to see what a student
is at inception and what he looks like on departure. The impact of these measurements
are far reaching as it is possible to see the level of information generated in the
process of management of information, levels of storage of generated information
(availability) and the utilisation of such information. In Nigeria, the issue involved in
management of information has become complex, cumbersome and expensive. In
most cases, it is perceived that the cost of acquiring equipment for information is a
cause of data inavailability (Babalola, 2010).
In some self studies embarked upon by some world class universities like that
of the University of Pennsylvania (2004), it was explained that the purpose of its self
study was to find out the effectiveness of instructional methodology in the university.
Its findings were geared towards enabling the university adopt changes based on both
what is rather than what ought to be. The programmes are designed to avoid blind
8
execution of unknown programmes. The study provided empirical foundation for
changes that the academic planning department proposed to the university council and
was adopted. The same applied to the University of Wisconsin in the United States of
America (USA), University of Australia and the University of Massachusetts.
These aforementioned universities conduct effectiveness of academic planning
regularly using tools administered to stakeholders on various indices considered
important especially on new and outgoing students. The instruments often involve
indices as the status of accommodation for both teaching staff and students, teaching
methodology, orientations services for staff and students, counseling services,
satisfactions with course a student is admitted to study, skill acquisition etc but in this
case, the same indices are used in the context of Management of Information
(generation, availability and utilisation). This study investigated the management of
information used in academic planning in Nigerian universities. The result that will be
generated from this study will provide an insight into the level of information
generated in Nigerian universities in the course of management of information. It will
show the level of information available and utilisable in the process of management of
information and finally show the levels of academic planning effectiveness using the
indicators mentioned above.
World class universities utilise information from academic planning
effectiveness to improve on their productivity. This may be the reason for their
perceived continuous monopoly of the top hierarchy of World Universities rankings
since 2005. Nigerian universities need to emulate these world class universities by
embarking on personal self studies to generate empirical information capable of
changing the present situation in Nigerian universities. It is observed that what appear
near a self study by some of the older Nigerian universities otherwise called first
generation universities especially the university of Ibadan resulted in the now
controversial „Post University Matriculation‟ (UME) examinations that is held after
the regular Universities Matriculation Examinations (UME) organised by the Joint
Admission and Matriculation Board (JAMB). Within the period of its implementation,
tremendous changes have been noticed in universities especially the well known
traditions of awarding limited first class degrees to students usually below twenty but
in recent years, with the adoption of the weighted cumulative pass mark in Post UME
examinations, the qualities of degrees have improved tremendously for example, a
9
perusal of the University of Ibadan 2010/2011 graduation brochure reveal the award
of not less than 50 first class degrees.
Again, it is muted that the introduction of improvements in quality of
education in universities through accreditation of courses and programmes is as a
result of some studies embarked upon by the National Universities Commission
(NUC). Though this investigation did not center on the effectiveness of accreditations
and the Post UME it only used it to show the benefits that will accrue to organisations
that embark on academic self study programmes but the study looked into the
effectiveness of academic planning especially in older universities described by the
NUC as first generation universities.
Unfolding events in university administration and comments from Nigerian
universities stakeholders point to lapses in the areas educational programmes planning
and implementation. The need to address such lapses inspired the need to investigate
the academic planning sections of our universities. Recent revelations, accusations
and buck passing between the National Universities Commission (NUC) and the
management of some Nigerian universities called for investigation. The NUC often
queries the rationale behind the admission figures of universities. For example, the
NUC threatened to shut down some of universities if their managements were
unwilling to abide by laid down regulations. In extreme cases, the NUC seized some
university licenses. Ojedele and Ilusanya (2006) citing the NUC observed that
flouting laid down procedures was an offence applicable to both Federal, States and
private universities. A case in point was observed when Olabisi Onabanjo University
(OOU), Ago Iwoye that belongs to Ogun state government was alleged of enrolling
students twice the population of the universities of Ibadan, Lagos and Obafemi
Awolowo University (OAU) Ile Ife put together without any infrastructure to back it.
Though the university may be accused of that, how did it continue with such practices
for such a long time without being detected, and it is well known that OAU,
university of Lagos and university of Ibadan are first generation universities while
OOU is a third generation university by the NUC classification. Are there information
facilities put in place to monitor such developments? The development was
embarrassing to the owner state government, the university management and students
but may not have been an embarrassment to the university administrators.
Another case that was identified by the Executive Secretary to the NUC was
that of the Lagos State University (LASU) accused of enrolling students using
10
unrecognized multi campus system alien to NUC regulations. This study wonders
what could have resulted in the adoption of such an abnormal education policy by
public institutions. The whole issues appear associated with inadequate academic
planning mechanisms especially the utilisation of information. This cannot be said to
be the case unless investigated.
In Nigeria, Federal universities run under one proprietorship that is the Federal
Government of Nigeria (FGN) through her principal agencies; Federal Ministry of
Education (FME) and the NUC but it is not the case with state owned universities.
Each state has its own policy which it expects its universities to conform to despite
conformity to the policies of the regulator. With the unfolding events this study dares
to ask; are these institutions in possession of requisite information or are they aware
of the levels of expectation from them? It is the foregoing that calls to question
academic planning modalities in Nigerian universities. While some universities may
not have challenge of information it appears that it is more pronounced with old state
universities as Ambrose Alli University, (AAU) Ekpoma in Edo State, Olabisi
Onabanjo University (OOU) owned by Ogun State Government and LASU owned by
Lagos State Government although from the works of Ojedele and Ilusanya (2006)
Federal universities also have their deficiencies. The cost of such a venture will
constrain this study to Federal universities of the older stock, that is First and Second
generation universities
Issues which bother researchers particularly planners is what (Aiyepeku, 1987)
described as planning under uncertainty. (Wolfgang, 1966) also saw the same issue as
planning without facts. It is suspected that perhaps many of our universities lack
adequate planning tools especially information.
Aiyekpeku (1978), described information as that aspect of study that douses
uncertainty while Nwankwo (1985), described it as that element in any endeavour that
gives its possessor an advantage over others. Information from the foregoing increases
awareness, enhances creativity, provides focus and direction for its users. In
generating information, some level of awareness may be necessary for the generator.
Information at other times may not necessarily be paper creation because as
Nwankwo (1985) explained, it could be in the form of sound or micro film etc hence
there are several methods of generating information but the most important aspect is
the keeping of records concerning generated information while managing information.
In essence, the present situation on information in universities require creatively
11
planning its availability that brings to the fore issue of its planning as being an
integral part of educational planning.
In the process of managing information, generated information can be kept in
formats that are either manual or electronic (Fabunmi, 2003). Generated information
can be kept in formats that make them accessible to users for retrieval regularly. What
do such users do with these information, the issue brings to mind, utilisation of
information that eventually gets to the academic planning office in university setting.
Haiman, Scott and O‟connor (1976) explained that the value of information is such
that its availability is of essence. Information can be preserved manually or
electronically. Information stored and is available can easily be kept in databases from
where it can be retrieved and transformed into other uses. It is also said that
information is flexible (Fabunmi, 2000). The statement by Haiman, Scott and
O‟connor (1976) can always be tested by asking if universities have databases from
where information can be retrieved and utilised when necessary and specifically,
Nigerian universities.
Apart from the academic planning office in universities, several other
stakeholders use and require information in universities for example, students require
information and lecturers do same. Today, lecturers and students require training and
skills to be able to access available information in order to utilise it effectively but
how many of these stakeholders have requisite training to meet such challenges? what
are the levels of support infrastructure available to universities to carry out intensive
academic planning in universities? It is noted that in recent years our universities
system has been growing. Such growth require a commensurate growth in
infrastructure which is not forth coming (Adeyemi & Uko-Aviomoh, 2004;
Akpochafo & Fellio, 2006; Emunemu & Onuka, 2009) Nigeria presently has one
hundred and seventeen operating universities that produce over one hundred thousand
graduates annually. The present perception of most graduates by stakeholders
includes their inability to compete in the global labour market (Afe - Babalola, 2010;
Awopegba, 1995 & JAMB, 2009). Reasons are that skills acquired by graduates in
schools before graduation are becoming obsolete. This is because the world is
globalising and we are retrogressing due to lack of foresight as to what the world will
look like in another few years.
Though this controversy has been on, it calls for an indept study to investigate
causes on perceived failing quality these areas inspite of rising quantity and further to
12
this, the university regulating body NUC require an automated information data
capture system within and outside the institutions under its purview to monitor
activities in the schools. Management of information and educational planning are
closely related. This study investigated causes of poor planning, training and
infrastructural obosolence in universities in Nigeria.
Evidences of ineffective academic planning in universities were discernible
from the study of Ojedele and Ilusanya (2006) when it unveiled the level of non
compliance of universities to agreed quotas on admission by both the universities and
the NUC. The admission quota is usually arrived at by consideration of the carrying
capacities of universities that involves a close examination of the available human and
material resources available to these universities irrespective of demand by university
education applicants. (Ojedele & Ilusanya, 2006) were able to show in their study that
there were several Federal, States and Private universities that flouted their carrying
capacities either by over admission or under admission, for example, Niger Delta
University (NDU) had an unutilised enrolment capacity of -3,629, Enugu State
University of Science and Technology (ESUT) had an unutilised enrolment capacity
of -3,059, Nassarawa State university had excess capacity unutilised to the tune of -
1,406, Adamawa State University had -1,249, Kano State University had - 1, 201 and
Adekunle Ajasin University, Akungba had unutilised enrolment capacity of -407.
Several private universities also had unutilised excess capacities with the highest
coming from Madonna University, Okigwe with unutilised enrolment capacity of 5,
029, Igbinedion university, Okada, Edo state had unutilised capacity of 2,259. Under
enrolled Federal universities cited in the document were; Universities of Maiduguri,
Uyo, Jos, NDA - Kaduna, Ibadan, FUT - Akure, and Markurdi. The above revelations
create an impression that these institutions were not aware of what was required of
them.
1.2 Statement of the Problem
Academic planning has, at various times, been described as the hub of
university academic work since it is responsible for charting the academic direction of
every university. In essence, it determines quality while in some other cases, quantity
of graduates produced in institutions. Academic planning has the responsibility of
monitoring, budgeting and controlling university plans hence its effectiveness is of
13
essence to any nation, people or society. Effectiveness of academic planning is often
perceived in terms of quality of academic programmes, adequacy of infrastructure in
schools, satisfaction with its programmes by recipients such as students, lecturers,
employers and administrators.
In recent years, there have been complaints by stakeholders in university
education of perceived falling standards in skills and abilities possessed by products
of Nigerian universities. Some of these complaints emanated from employers of
labour and agreed to by university lecturers that train these students including students
themselves who fail to gain employment after several years of graduation.
Stakeholders appear to call to question the integrity and the effectiveness of academic
planning in universities.
An additional challenge perceived with academic planning in Nigerian
universities that calls to question its effectiveness is the management of information.
A positive relationship exists between all forms of planning and information.
Management of information viewed from the perspective of information generation,
its availability and utilisation calls for an investigation to know how information is
managed through processing and utilisation for academic planning effectiveness. It is
noted that studies on academic planning effectiveness are few, and fewer studies have
investigated academic planning effectiveness and the management of information
especially (generation, availability and utlisation). Previous studies emphasised
administrative competencies of staff, personnel development and economics of
management in academic planning hence this study investigated the effectiveness of
academic planning in Nigerian universities specifically finding out the relationships
that exists between academic planning and management of information in terms of
(generation, availability and utilisation).
1.3 Research Questions
The following research questions were formulated to guide the study:
1.) What is the level of management of information in terms of information
generation (IG) for academic planning effectiveness in Nigerian universities?
2.) What is the level of management of information in terms of its utilisation (IU)
for academic planning purposes in Nigerian universities?
14
3.) Are the resources for accessing information available in Nigerian universities for
effective academic planning?
4.) Do information generated for academic planning effectiveness in Nigerian
universities by academic staff posses the quality of integrity, reliability,
flexibility and adaptability?
5.) Is information reception and dissemination infrastructure uniform in Nigerian
universities to positively influence academic planning effectiveness?
6.) What are the perceived evidences of successful academic planning effectiveness
in infrastructure development among Nigerian universities in the management of
information?
7.) What administrative plans are discernible to update students, lecturers and non -
academic staff computer skills capacity for proper positioning for effective use
of information in academic planning effectiveness in Nigerian universities?
1.4 Hypotheses
Ho1: There is no significant relationship between management of information
(generation) and academic planning effectiveness in Nigerian universities.
Ho2 There is no significant relationship between management of information
(availability) and academic planning effectiveness in Nigerian universities.
Ho3 There is no significant relationship between management of information
(utilisation) and academic planning effectiveness in Nigerian universities.
Ho4 Management of information (generation, information availability and utilisation)
capacities have no significant composite influence on academic planning
effectiveness in Nigerian universities.
Ho5 Management of information (generation, availability and information utilisation)
capacities have no significant relative influence on academic planning
effectiveness in Nigerian universities.
1.5 Purpose of the Study
The major purpose of this study is to investigate the extent to which
Nigerian universities manage information through their generation, availability
and utilisation for academic planning effectiveness. Specifically, the study
determined;
15
i) The capacity of Nigerian universities to generate information and whether the
methods used are manual or electronic.
ii) The extent to which resources for information generation and utilisation are
available for academic planning among stakeholders in Nigerian universities.
iii) The perceived level of academic planning effectiveness in Nigerian
universities using information from the perspective of students and academic
staff.
iv) The similarities and differences in information generation, availability,
utilisation and academic planning effectiveness in Nigerian universities
specially between first and second generation universities.
1.6 Significance of the Study
The study is of significance to Nigerian universities and university
administrators. Its findings exposed some of the areas in academic planning that
require replanning and in some cases remodifications of plans in academic planning.
The study revealed lapses in the area of academic planning indicators which are
usually taken as unimportant for example, students counseling services, orientation
programmes for new staff and students satisfaction with studies. Other area of lapse
was lecture delivery that is considered important to all stake holders in the university
system. It is clear from the foregoing that administrators in universities are able to
fathom areas where reforms are necessary.
Secondly, the study‟s relevance to university stakeholders does not end at
the level of academic planning, but in the area of management of information. The
study explored the generation, availability and utilisation of information in Nigerian
universities further revealing where and how university administrators and policy
planning managers need to go when sourcing useful information that keeps the system
in equilibrium in line with standard practices globally. While most administrators have
not got a clear goal, this study exposed the fact that academic planning information can
be elicited from the academic planning office, lecturers and students especially
incoming and outgoing students.
The study is of significance to undergraduates in Nigerian universities because
it enlightened them on some of the dictates in the labour market thereby preparing
16
them to acquire some important skills that may not be embedded in their regular and
conventional academic programmes.
The study assisted policy makers to understand, taking a cue from academic
planning how to determine capacities for information generation, availability,
utilisation, management of information in their institutions and where necessary
conduct a self study to find out the status of these indices generated to enable
transformation of their own (policy makers) universities as such indices could improve
their own transformation.
Finally, the study showcases the relevance of the fact that a system requires
inputs, processes these inputs and turns them into output within the fame work a
relevant capacity as observed in university systems.
1.7 Scope of the Study
The study investigated information generation capacity, its availability and
utilisation in Nigerian universities specifically focusing on first and second generation
universities that are thirteen (13) in number. The reason being that there are
specialized universities in the other generations of universities but first and second
generation universities are consist of conventional universities with similar faculties
and facilities that enable comparisons. The study covered the entire Nigeria -
Nigeria‟s six geopolitical zones.
1.8 Definition of Terms
The following terms are defined as used in this study:
Information Generation Capacity: The Encarta encyclopedia (2009) describes
information generation as developing messages or items related to an endeavour to be
communicated while capacity is the ability to quantify what has been generated. The
encyclopedia further gives insight into the generation of power, tables from a pool of
data etc. This study used the term information generation capacity as the quantity of
data items that can be generated by the system for its own use in the academic
planning section of the universities by lecturers, students, academic planning officers
with information and communication officers.
17
Information Availability: This is the ability to store information after use for
subsequent uses. It involves the use of storage items, processing equipment, databases
and networks for university information uses especially as used by the academic
planning section of universities.
Information Utilisation Capacity: This is the intensity with which available
information is utilised. It includes ability to use or manipulate machines, objects,
robots and computers. It also includes skills, techniques to capture and use
information.
Academic Planning: Academic planning refers to the section, unit or department in
universities or tertiary institutions that stream lines all academic work in line with
university goals and objectives. It serves as a bridge between the university
administration, the faculties and departments. It oversees planning and channeling of
academic programmes.
Academic Planning Effectiveness: Academic planning effectiveness is the level at
which decisions from academic planning unit meet set targets especially as perceived
through the sufficiency of student infrastructure as classroom adequacy, office
accommodation comfort, suitability of lectures and lecturers, counseling services and
satisfaction with academic programmes by recipients and stakeholders. The study
used students, lecturers and staff perceptions to measure effectiveness of academic
planning in universities.
18
CHAPTER TWO
LITERATURE REVIEW
The review of related literature in this study is guided and discussed under the
sub headings outlined below:
(1) Managing Information Through its Generation for Academic Planning
Effectiveness in Nigerian Universities.
(2) Managing Information Through its Availability for Academic Planning
Effectiveness in Nigerian Universities
(3) Managing Information Through its Utilisation for Academic Planning
Effectiveness in Nigerian Universities.
(4) Overview of Academic Planning and its Effectiveness in Nigerian
Universities.
(5) Information Management Policy Evolution and the Influence of Modern
Information Communication Technology (ICT) Utilisation for
Education/Academic Planning Effectiveness in Nigerian Universities.
(6) Appraisal of Reviewed Literature.
(7) Theoretical Framework/Model
(8) Conceptual Model
2.1 Managing Information Through its Generation for Academic Planning
Effectiveness in Nigerian Universities
Information means different things to different people depending on their
goals for information. The definition of information as reviewed in literature shows
that scholars have a common consensus on the concept of information though no
uniform definition. They agree that information is an organisational resource capable
of transforming any endeavour through the creation of knowledge and awareness
(Aiyekpeku, 1978, Nwankwo, 1985, Anderson, 1972 & Okonjo, 2000). Information
strengthens its possessor to an advantage over contending competitors in all
endeavours. Information serves as a good resource for efficient organisational
management since it assist managers in all organisation to adopt efficient
management styles that impacts positively on organisational decisions (Opeke, 1984
and 1996). Similarly, Norton (1990) explained that information is the basis for
19
everything a person does. Information that is often described as a power source
according to UNESO (1979) cited in Nwankwo, (1985:11) is described as;
…information gives the possessor power and influence over
and above the authority he may be legally vested with in any
organisation; power that gives the ability to get things done-
flows into the hands of those who have the most (as well as the
most up-to-date) information. People are more likely to be
guided by those who know more and better. Thus a first
principle in achieving managerial effectiveness is to have
access to the most reliable and up to date information... (Nwankwo, 1985:11)
Other scholars in information management as Hogarth, Markridakis (1981)
and Bowman (1963) are of the view that consistency in managerial decision making
and success in organisational practices is a function of the level of information
available to managers. The assertion of Hogarth et al (1981) and Bowman (1963) was
further corroborated by Nwankwo (1985). Their positions implied that there is need
for organisational efficiency in management of information. Also, the value of
information is well captured in the works of Grimshaw (1995) and Owens (1997).
Gimshaw (1995) and Owens (1997) explained that the value of information is a major
determinant of organisational performance since it has suddenly been realised that
profit and loss have suddenly become a function of much of information or lack of
information. The aforesaid is an indication that one of the determinants of the levels
of information required by an organisation is the level of uncertainty experienced in
that organisation (Aiyekpeku, 1978).
Information is often obtained from various sources (Igbeka, 2000). Sources of
information are primary, secondary or tertiary. Primary information considered most
reliable is often generated by the organizational while secondary information is
generated from places outside the organisation though useful or is adopted to suit the
need of a user. Tertiary information has passed through several stages before being
adopted or adapted by users. The case of secondary and tertiary information results in
estimations, projections false and unreliable data where there integrity (reliability and
accuracy) are not ascertained.
There are various types of information generated in organisations; some of
those generated information are relevant while others are considered irrelevant
depending on the level of managerial operations being embarked upon by the user.
The bulk of information impacting on a manager or organisation could be so heavy
20
that such organisation needs to manage its information resource to determine what is
relevant or irrelevant information (Nwankwo, 1985). The foregoing factors make
educational managers advocate for good and efficient management information
systems.
In the last few years, Nigerian universities have being growing and becoming
complex in administration. The Nigerian university system requires good and efficient
Management Information Systems (MIS). The number of universities has grown from
forty four (44) public universities in 1999 to one hundred and seventeen (117)
licensed universities (public and private) in 2011 (Mbat, 1992 and UTME, 2011). The
implication of the above statement is that efficient management of information should
be embarked upon at the micro and macro levels in university management and
governance to close gaps created by poor information between goals, expectations and
achievements of such goals by universities administrators and expectations of
stakeholders.
Useful information must posses certain qualities as agreed by Mondy (1990),
Plunkett and Attner (1994), Hodge (1996) and Griffin (1993). Useful information
must be in understandable formats, reliable, accurate, relevant, complete, timely and
accessible. Nigerian universities as large complex organisations must learn to value
information since decisions involve taking a choice among several alternatives and it
is clear that management, planning and administration are all about decisions
(Nwankwo, 1981). In recent years, stakeholders have expressed dissatisfaction with
university education (Akerele, 2008) and Jaiyeoba and Atanda (2010). This study
investigated management of information generation looking at its capacities from the
perspectives of Directors of Academic Planning, Directors of ICTs and students in
Nigerian universities.
Information generation capacities constitute methods used in creating
information. It is observed that most times the generator of information may not be
the user, in essence, information may be generated by any person in the universities
but what capacity does the system hold for such generators?
For any information to be available, understandable, relevant, accurate, timely
and accessible, such information must have been generated. In a study on information,
Obayi (2006) citing United Nations Educational Scientific and Cultural Organisation
(UNESCO, 1990) observed that information is generated through structured
processing and refinement of data. In essence, it is not the quantity of information but
21
the quality of information since it must have been presented in useable perspectives
capable of being reused if the need arises - flexibility. Onocha & Okpala (1995)
observed in another study that sought to find out ways to generate items in
educational research that items generated must include components of the total item
from which items are to be generated indicating that, to generate information, the
seeker or generator must be able to identify the item of information required by the
organisation and the usefulness of such items. The generator must be equipped with
the capacity to carry out the task and in this case the value of information is priceless
due to its importance. Gordon and Lindsay (1988), Flores and Salaun (2001) argued
that organisations must go the extra mile to purchase useful information hence
Durotoye (2003), explained that the usefulness of information requires that
organisations combine their management information systems, corporate goals and
strategies to arrive at pre-determined objectives.
In the process of generating information in universities, university
functionaries must be equipped in the generation and production of either information
or the structures for gathering such information by the various stakeholders in the
system. Information generated or gathered could be in the form of (admission forms,
registration forms, accounting data, administrative processes, teaching materials,
students hostel accommodation, students academic counseling etc) presented and
preserved in formats for users over time.
Some infrastructures are required to generate information as generated
information must be processed for easy storage and retrieval. To process and retrieve
information, an organisation like the universities must posses good and viable
Management Information System (MIS) either manual or electronic but preferably in
this digital era, electronic system (Isah and Ayeni, 2010). Most Nigerian universities
lack the capacity especially funds and personnel to acquire the electronic MIS hence
decisions may not be as perfect as expected including the generation capacity to get to
such information (Ali, 2009).
Ewart (2004) described „capacity‟ whether in information or any other
endeavour to involve equipment for acquiring, capturing and processing information
hence it could safely be said that information generation capacity involves all
methods, equipment and paper work that will assist the organisation to capture and
process information. In the universities academic planning system, information
generation capacity refers to the several abilities of stakeholders - Directors, lecturers
22
and students to bring up relevant materials that can assist the planners in the system
with sufficient data that can be processed to impact positively on academic planning
process.
Information generation involves the ability of Nigerian universities to acquire
state of the art equipment in information communication technology to enable storage,
dissemination and utilization of information. Scholars in the field of information
studies as Fickle (1997), Hicks (2007) Steener (1969) Muscon (1988), Rogers (1995)
and Neeway (1982), all agreed in their studies that information assists managers to
plan, direct the affairs of organisations through generating, processing, storing and
retrievals. The above mentioned scholars advocated need for trained personnel in
information studies to serve as administrators in charge of information. To achieve
this, there is need to train staff on the use of information generation, gathering and
processing. This study unveiled present situation concerning training on information
generation for Directors, academic staff and students to impact on academic planning
effectiveness in Nigerian universities.
In the present global information/digital dispensation, competition has become
the keyword and methods of educational planning have been advancing, getting more
complex hence the previous method for information generation and processing,
storage and retrieval that were manual several years ago and did not yield required
results are now to give way to better methods in the 21st century (Marttey, 2005) and
Kock (2001). The benefits of information generation are many, Hubbard (2003),
Maiguigan, Mayer, & Harris (2005) and Nwankwo (1985) explained that good
information generation capacity reduces cost of programmes, increases productivity
and provides solutions in complex organisations due to the often availability of
sufficient and reliable information. It can be safe to infer here that well generated
information reduces the stress managers go through to get solutions particularly in
decision making which is the soul of management (Khatz and Khan, 2006). Nigerian
universities stand the option of being strategically repositioned with academic
planning becoming effective through generating reliable information.
While the process of information generation has been discussed, ascertaining
the integrity of the generated information is another concept. The integrity of
information includes its reliability, accuracy etc. The field of educational planning is
replete with several definitions of the concept of planning. Planning whether micro or
macro is only separated in application as its principles are transorganisational. Blaug
23
(1970), Nwankwo, (1981), Akangbou (1985) and Longe (2003) all agreed that
educational planning has to do with present actions in education that have future
consequences on education. The above description also applies to academic planning.
Academic planning involves actions in the academic planning process in universities
today that have future consequences.
The sustainability of any planning venture whether educational or academic in
universities is directly related to the vision and mission of its planners and managers.
While educational planning is a broad sectoral concept, academic planning is a subset
of the general educational planning concept. However, educational planning cannot
succeed in any country without the provision of adequate resources for programme
execution.
The concept of information comes in when facts are needed in educational or
academic planning as it is agreed that any form of planning must be based on facts,
information or data (Wonnacourt and Wonnacourt, 1977). To get resources for
academic and educational planning, the resources must be planned.
Among steps to be adopted in planning for education is to assess the capacity
of information and the quantity of information that can be obtained for a particular
endeavour. The quality and quantity of such information must always be ascertained
hence this study concentrates on information generation and its capacity in
educational planning and academic planning. It has been observed that planners
hardly have the capacity to generate information (Nwankwo, 1985), Adimorah (1993)
and FRN (1960). It appears that the capacity for good information is lacking in
Nigeria and one area identified for the failure of education planning in Nigeria is poor
information infrastructure.
The perennial problem associated with information and data problems in
Nigeria over the years can best be captured from failed educational policies of the past
for example, the free education programme embarked upon for five states in Nigeria
by the Unity Party of Nigeria (UPN) between 1979 and 1983 and the Federal Military
Government‟s (FMG) sponsored Universal Primary Education (UPE) programme of
1976 - 1979. Akangbou (1985), reported that the inadequacy and paucity of
information (statistical data) was responsible for the collapse of those programmes.
The same report indicated that all projections concerning those programmes were
wrong and in some cases, projections were manipulated to the available resources
giving the notion that adequate educational planning had been carried out but such
24
self deceit only retarded progress in the programmes for a few years and collapsed
when resources were no longer commensurate with demand.
Another case in point was the failure of the first post independence
educational planning programme in Nigeria popularly referred to as the Ashby
commission. It is a well know fact in educational planning in Nigeria that the cause of
failure of the programme was due to the adoption of the Harbinson rule of the thumb
principle (Akangbou, 1985) and Fabunmi (2004).
To ascertain the adequacy of generated information, a question must be asked
and that is, how do we ascertain and measure the volume of generated information in
universities or elsewhere? Hubbard (2003), explained that in the field of engineering,
engineers measure electricity generation capacity in Kilowatts; in the field of
agriculture, animal energy requirements are measured in calories; other weights and
volumes have specific units of measurement and it is evident that almost all
phenomenon can be measured. Such measures enable quantitative planning to take
place hence in this study; the level of information generation that can facilitate
academic planning could be established with a view to stabilising educational plans at
university levels in Nigeria.
Previous studies on information management did not investigate the method or
mode of methods of information. They investigated information capacity acquisitions.
This study for the first time has adopted the use of simple descriptive statistics as
percentages to measure the level of information generated in the universities specially
from the perspective of stakeholders; students, lecturers and directors of academic
planning and Information Communication Technology Centres (ICTC) that deal
directly with raw data, its processing and in most cases, its utilsation.
2.1.1 Generation of Information in Nigerian Universities
The growing complexities in education require provision of regular
information. Universities in Nigeria have grown complex in structure and
programmes for example, Nigeria currently has one hundred and seventeen (117)
licenced functioning universities with thirty owned by the Federal Government and
thirty six by state governments. Others are owned by the private sector (Unified
Tertiary Matriculation Examination UTME, 2011).
25
The sudden growth in the number of universities in recent years require that
information for academic planning purposes are not only properly generated but
adequate. Information that is not generated cannot be utilised. Reasons why good
information generation is necessary in universities include: Educational institutions
specially universities generate heavy information through the huge amounts of data
and information they possess via correspondences, accounting documents, personnel
files, students examination records, time tables, accommodation, admission and
graduation records etc. Most of such records are yet to be properly organised into
formats that are usable and reusable (McLeod Jr. 1995) Clare & Stanley (1995) and
Ewart (2004).
Again, education and academic planning require data for the purpose of
generating time series data as obtains in advanced countries of the world. Such data
enhances the integrity of statistical forecasts and prevents educational plans from
collapsing mid-way into any programme as often experienced in Nigeria in the past.
Generating and accessibility to information is of necessity as such data will
assist planners to evaluate the adequacy of input and output into the university system.
It will enable academic planners assess statements by stakeholders for example to just
say „ the standard of education is falling‟ will not be as controversial as it is today but
will be put to test (Olopoenia, 2006) and Falola (2009).
Information could be described as adequate when it meets the goals and
objectives of what it is expected to do. Information availability in universities enables
educational planners/academic planning units in universities retrospect to challenges
and prepare adequate budgetary controls with internal policies to complement national
educational policies by ensuring compliance to international standards. It must be
made known that the controversial perception of fall in quality of education could be
attributed to poor information or unwillingness of university administrators to comply
with laid down polices, for example, Okojie (2007) decried the violation, abuse and
over stretching of university carrying capacities policy in admissions in strong
defiance to the directives of the National Universities Commission (NUC).
The NUC Executive secretary wondered if such administrators were ignorant
of the quota allocations to their universities or what could have happened? In
instances cited by the NUC executive secretary, the NUC bluntly accused university
administrators of with holding timely internal information from the universities which
could be due to the fact that such information could not be readily retrieved, not
26
available or were not processed and so were not available at the time of admissions.
The implication could be that the capacity was not acquired. It could also be that most
of those institutions were still operating the manual MIS or occasionally
interchanging both the Manual and the electronic MIS. In a situation where a
university does not stick to one method, documents will be missing in transit. Also,
improper records management will occur and the incidence under reference here
occurred when the NUC was working on collecting data for long term planning in
Nigerian universities.
To the above scenario some Nigerian scholars like Okhiria (2007) decried the
gap in educational quality between graduates from Nigerian universities and their
counter parts from other parts of the world. Okhiria (2007) attributed the difference in
the solid information structures and infrastructure that existed in places outside
Nigeria as Harvard, Yale, Cambridge and Oxford universities among others too many
to mention.
Nigeria as a nation had realised the importance of information and taken steps
in that direction several years ago especially making information available to seekers
and users but unfortunately, such steps yielded little results. The need for information
management made the Federal Government of Nigeria (FGN) set up the Federal
Office of Statistics (FOS) by an Act of parliament in 1962, the Nigeria Institute for
Social and Economic Research by Decree 1 No 1 of 1994 and the Nigerian manpower
planning Board. Though these organisations are there, the challenges remain because
resources voted by government for the purpose of information are either unutilised or
not just enough.
Poor (1990), lends advocacy to the need for organisations to keep adequate
and updated information regularly as it forms the basis for resources allocation which
also applies to Nigerian universities. Planning without information is directly related
to planning for failure particularly in an aspect as educational/academic planning and
administration. Planning can automatically translate to success in other areas because
of ability to forecast (Nabe, 1974). The foregoing are reasons why schools and
university administrations need to update their information generation and capacity to
continue to remain relevant, updated and useful.
27
2.2 Managing Information Through its Availability for Academic Planning
Effectiveness in Nigerian Universities
The preceding discourse infered that information is a core ingredient to
academic planning effectiveness especially at the university level. Katz and Khan
(2006), described academic planning as the soul of any university since removing it is
like removing the life wire of that institution. Availability of information contributes
to a large extent to effective university governance in the 21st century as observed
from the ranking of universities globally by Isah and Ayeni (2010). Akerele (2008)
also observed that some factors account for good quality products from universities
and one of such factors is the availability of information. Quality is a core ingredient
in university education as deposed to by Jaiyeoba and Atanda (2010). To arrive at
good quality in academic planning, information must not only be perceived to be
available but must actually be available.
Several scholars have emphasised the need for information availability to
assist effectiveness in any endeavour for example, Sivert (1996) emphasised the need
for corporate information and availability of information to meet the challenges of
managing in this information age. Sivert (1996) identified strategy, internet,
technology potentials as core ingredients that assist information availability. Further
to this, Igbeka (2001) identified sources of information to include secondary, primary
and tertiary sources but other scholars as Neeway (1982) identified sources to include;
books in libraries, law and policy, microfilm and microform, bibliographies etc. Other
sources identified include indexing and abstracting sources, databases, dictionaries,
encyclopedias, directories, reference materials, web based reference sources while
Alabi (2006) identified the use of search engines, journal resources, handbooks,
manuals, digital collections and monographs. This research agrees that a good aspect
to information availability is to have information capacity and the wherewithal to
generate information but what then is information capacity? It involves the equipment
and mechanisms to ensure that information gets to those who need and use them
especially at the right time.
Availability of information is subject to information generated. A generated
information that is not stored or properly kept is as if such information was never
generated and hence not available. Not all generated information can be said to be
available. Availability is subject to storage and retrieval when needed. Availability is
28
subject to capacity acquisitions. From the works of scholars reviewed, information
availability can be said to be .in place when necessary capacity to access such
information has been acquired, is available, maintained and regularly functional. In
the works of Alabi (2006), facilities that can aid information availability include
search engines, web based information that is capable of reaching a wide array of
population (students) in no distant time. The information age in which Nigerian
universities operate has limited opportunities for manual information management
systems as time taken to search out documents will negate the value of the
information being sought (Nwankwo, 1985).
Availability of information is such that after the use of information, it is
possible to reuse it since it will be possible to retrieve it hence the use of the term
„capacity‟. There must be in built mechanisms that enable the use and reuse of
information in such a way that the information does not loose meaning or impact.
Information is said to be available when it is used in several formats. The study of
Barnes (1966), showed why the Americans decided to adopt the electronic MIS.
Among the issues considered was the cost effectiveness of electronic MIS relative to
its manual counterpart. In Nigeria and in most Nigerian universities, buck passing and
blames are often the case when failures are recorded during trial sessions to new
innovations especially when it involves new technologies.
Information availability in Nigeria is not said to be without its challenges for
example, Adimorrah (1993), argued that information structures in Nigeria are lacking
and inadequate. Babalola (2010), laid credence to this as he observed that due to high
cost and poor technology, access and utilization, improved ICT facilities are lacking
among Africans and African universities.
The foregoing indicates that where generation of information capacity is high
and capacity to make such information available is low, there will of necessity be
inefficiency in the system. Babu, Singh and Sachdeva (1997), agreed that information
availability and accuracy will go a long way in improving efficiency in organisations
and by extension include universities.
In Nigeria today, most universities have began to advance processes of
improving on information availability especially in the last decade. A comparison of
information systems today with what obtained in the past shows that there are some
improvements in some areas but how these impact on academic planning is yet to be
seen. Most universities have phased out the use of manual typewriters and
29
cyclostyling machines are no longer seen anywhere. Again, most information are now
gotten online indicating that many of the universities have websites but the
effectiveness of these websites and information availability can only be ascertained
after this study has been completed.
2.3 Managing Information Through its Utilisation for Academic Planning
Effectiveness in Nigerian Universities
Organisations to day require different types of information for different
purposes towards achieving their goals and objectives. In the information age
organisations anticipate increased productivity, increased earnings and shares of
market indices. Organisations are able to predict growth, projections and enhancement
of corporate best practices (Nwankwo, 1985) and Onuma (2007). Information needs
of organisations vary hence high levels of operations are required in modern
educational/academic planning settings due to competition within educational systems
and levels in educational quality and production (Jimminez, 1988), Babalola, Tayo,
Okediran, Arikewuyo, Ayeni and Adedeji (2006).
Organisations that are not properly informed will find themselves in the refuse
bin of obosolence soon either locally or internationally. Provision of quality education
is becoming an issue of global concern due to recent researches in the field of
information, communications and technology etc. Governments and proprietors of
schools therefore, need to be well informed. Education in developing countries is no
more the exclusive preserve of governments to supply. Privatization,
commercialization and globalization of organisations has ushered in competitive
supply of goods and services including education (Ewart, Isah & Fabunmi, 2008). It
can easily be perceived by interested parties that providers of public education need to
be more informed as we progress into the 21st century. This study is of the opinion
that conscious effort must be put in place to improve on the generation, availability,
utilisation and academic effectiveness of universities in Nigeria.
Organisations take decisions regularly that are bound by the level of
information available to them. Babu, Singh & Sachdeva (1997) opine that information
availability, accuracy and dependability will go a long way to improve on the
utilisation of available information by organisations and consequently influence their
efficiency positively. Babu et al (1997) observed that the discovery of the internet
30
coupled with the fact that it performs the duty of a super highway for information
both in storage, retrieval and dissemination goes a long way in making information
available, accessible and effectively utilised by those in need of information.
Universities as modern complex organisations take decisions from time to time
(Nwankwo, 1985). The level of information needed in any organisation like a
university cannot be pinned down to one specific purpose as managers of information
requirements vary in scope and depth. The level of information needed by the Vice
Chancellor of a university will vary from the information needed by a lecturer,
director or senior non academic staff. While the Vice Chancellor (VC) talks and
works on policy, the average lecturer is more operational in scope and content
(administrative). Information must be presented in a way that preserves it for easy
retrieval, adaptability, flexibility and maintains its accuracy. It must be presented in
understandable formats.
The growing complexities mentioned above in institutional management give
reasons why scholars over the years advocated for effective management information
systems (MIS) in higher institutions (Nwankwo, 1985) Ekwere (1990), Lundu and
Mbewe (1993) Johnson (2007) and Adekanbi (2008). Effective Management
Information Systems (MIS) examines the method of information gathering, storage,
display, retrieval and utilization. It also looks at accessibility of information and ways
in which information can be managed.
Universities management and governance in Nigeria at micro level has been
increasing. From less than forty six (46) in 1999 to one hundred and seventeen (117)
in 2011 (UTME, 2011). Universities vary in mission and scope hence each university
does not have exactly the same characteristics as another university and even when
every other thing look similar, the type, nature and character as social outlook of the
individuals in the system vary. In the case of others despite being under same
regulatory body, there is need to study levels of differences and similarities to be able
to draw valid inferences and reposition them.
The complexities associated with university management and governance can
be appreciated at the micro levels when we take individual universities and at the
macro level, when we take the totality of universities, and in that sense we refer to the
system. It is difficult for an administrator to effectively oversee all institutions in any
system at micro or micro levels using manual information systems or unreliable
electronic information systems. For information to be available for utilisation certain
31
qualities must be involved and these include; networking, retrieval and storage
(databases).
Arising from the foregoing literature review, proponents of MIS in tertiary
education explain that varied, complex and diverse documents impact the university
system in the form of information in papers, memos, films and some other forms of
subscripts that need to be kept, used and reused later in the process of management
and administration that have proved very difficult to see and use over and over again.
Moreover, the manual MIS exposes such documents to vagaries of weather and other
hazards. Barnes (1966), while working on the factors that require the use of electronic
management of information in America, observed that; the size of the mass of
documentation as well as the increasing nature of such document sizes makes it
necessary to find ways to reduce documentation costs, increase the speed of
transformation of information as well as reduce the amount of clerical and manual
effects involved. According to Barnes (1966) study, he explained that the volume of
information generated in organisations and higher institutions are very heavy and so
need some reason able level of management. In Barnes (1966) work it was observed
that the American government alone produced twenty five billion (25b) pieces of
paper information annually and went further to observe that the USA military
engineering section alone in the production of research reports, manuals and
drawings, expended as much as two billion dollars ($2b) in a year. Barnes (1966),
observed that approximately 30,000 technical journals are published in more than
2,000,000 articles in a year in over fifty (50) languages. This frightening volume of
information in the US made all stakeholders inclusive of the government of the US to
think of more efficient ways of managing information. The problem of Barnes and the
US in 1966 is probably facing all sections of the universities in Nigeria today and
requires that information be managed for effective policy implementation.
Managing information in organisations requires that certain factors be put in
place specifically in organisation as complex, diverse and dynamic as universities.
Klara (2001) and Kock (2000), opine that it is not too much the volume of
information needed but the availability of such information when needed. Barnes
(1966), Kock (2000) and Klara (2001) explained that to manage information
efficiently, information must be sifted to show content of subject whether electronic
modeling (computer), role of visuality and the possibility of rewiring quick and
authentic information. Several authors agree that information is a necessity. Abels,
32
Liebescher and Denman (1996), further explains that several other components must
accompany a good MIS in universities. Components recommended include; addition
of a good institutional electronic network system and an electronic database system.
To fully understand the educational implication of the foregoing twin concepts, it will
be necessary to understand the technical and logical functions/compositions of
electronic networks and database system in modern complex organisations as
universities that can influence data storage, retrieval, management and utilisation.
Electronic network
The Encarta Premium (2009) identifies over sixty nine different networks
associated with computing and information management. It describes a network as a
series of connections and interconnectivity. An electronic network involves the
connections of computers in such a way that they can communicate with one another
and share resources as printers and storage space in similar environments or in
different environments that have been conditioned to perform in a sequential manner
(Oni, 2004). The greatest electronic network available to humanity today is the
internet with its sophistication and complexity of resource sharing and usages.
Networking ensures cost effectiveness and enhances team work, research
enhancement and communication. In the twenty first century, universities cannot
afford to overlook the global electronic network through the construction and
utilisation of electronic web portals and websites (Isah, 2007).
Electronic database
There are manual as well as electronic databases. O‟brien (1998) described a
database as an integrated collection of logically related records or files. The study
explained that a data base consolidates records previously stored in separate files into
a common pool of data records that provides data for many applications. A database is
a storage system that permits retrieval of information on request (Sivert, 1996). Many
types of database abound as identified by O‟brien (1998), and include: operational
database, analytical database, data warehouse, distributed database, end user database
and external relations database etc.
Databases are important to educational institutions whose activities need
constant review and repetitions. In the case of university academic planning sections,
33
several aspects of the universities planning mechanisms emanating from the academic
planning section are often repeated either as finished or repeated tasks requiring
constant revisiting, referencing and updating of previous materials for new
assignments in similar tasks or circumstances and in such cases retrieval and
utilisation of previous material is necessary.
Adensanya, Onilude and Sodipe (2004), explained the importance of database
and databanks as modern ways of storing and retrieving information with the aid of
electronic devices. Adesanya et al (2004), said that the purpose of creating
database/databanks is to make available through one source, a comprehensive and
almost inexhaustive assemblage of information on any given subject area. To fully
operate a database/databank Adesanya et al (2004) explained that such project must
have an objective, a design, a plan and stages of implementation. It is important to
ascertain if organisations as large and complex as Nigerian universities have
databases or electronic databanks individually or collectively from which information
could be retrieved as it will greatly assist the utilisation of such information and
consequently impact positively on academic planning effectiveness to reposition them
among similar institutions globally.
Databases and Networks
In the growing literature on database, the web definition goes thus;
…A data base is a large amount of data
stored in a well organized manner” while a
database management system (DBMS) is a
programme that allows access to the
information stored … a large electronic
record of a set of data, consisting of at least
one file or a group of integrated files usually
stored in one location and made available to
several uses and users at the same time for
some or different applications… (http://www.efa.gov.records/glass.glass
03.htm).
Dimers (1999) and Bernhardsen (2000) described database as a collection of
data fields and files to a single storage system from where information can be
retrieved when required. Kerschberg (1999) Ram, Stephen et al (1989), Aranhan,
Ganti, Narayanan, Muthukrisna, Prasad and Ramamrithan (1996) explained that data
34
is a corporate resource which must be managed through the production of good
database system. To establish a good database, it must be subject to planning.
Advantages of a database according to Aver, Hall and Leilict (1981), is that it reduces
real time search for information especially for complex organisations. Ram, Stephen
& Curran (1989), further explained that database planning is a process of identifying
current and future information requirement of an organisation in order to transform
them into a homogeneous description of the application. To effectively do this, there
must first be a model and then a design. The model may be a hierarchical model,
network or a relational Model. The design should of necessity involve; storage and
physical structures, indexing, transactions and concurrency, replication, architecture,
security and locking devices.
It is to be understood that databases often move across networks. Networks
can simply be classed into 2 and both are of extreme importance not only for
academic planning effectiveness but for the general and effective functioning of an
organisation such as a university system in this globalised 21st century. One of the
commonest networks is the Local Area Network (LAN) and the second is the Wide
Area Network (WAN). In both networks, resources can be shared in different
capacities. LAN operates within an organisation while WAN involves external
influences (internet operations). Both are electronic networks that have resources as
the chat, email, teleconferencing, sharing printers, storage spaces and maintenance of
spaces etc
2.3.1 Information Utilisation Capacities in Organisations
The purpose of generating information is to utilise such information (Dillon &
Backhouse, 2000). To effectively utilise information in organisational management
and administration, it must be available, flexible, accessible and adequate for the
purpose for which it is intended (Aiyepeku, 1993), Nwankwo (1985) and Madu
(2001). It is only when information conveys the above qualities that it is usable and
leads to right choices and decisions in organisational management (Love, 1985)
Ekwere (1990) and Ajayi (1986).
The first step in determining the level of utilisation needs in any organisation
is to identify the source of such needs, then identify the best technology that will
assist the end user to access needs (Kirang, 1981). Christiano (1981) explained that
35
capacity utilisation measures the intensity with which firms or organisations make use
of their resources that includes information that aids academic planning to achieve its
objectives.
It can be safely inferred from the works of Christiano (1981) that information
utilisation capacity refers to the intensity with which firms and organisations make
use of information. In essence, it involves such capabilities as tools, instruments,
equipment, knowledge etc that could aid university academic planning units make use
of the information available to them for effectiveness. In previous studies on
information management, such tools, equipment, resources for capacity build up were
referred to as „Acquisitions‟. Important aspects of this research finding will involve
the use of electronic information processing equipment acquisitions that universities
in Nigeria currently have or do not have. This study will is set to unveil the
level/status of such equipment available to Nigerian universities at the levels of
directors of academic planning, university information technology centres, lecturers
and students and their ability to access these equipments where available.
Measurement of information utilisation capacities is subject to several
measurements of capacities in the literature but this research intends to measure
information capacity utilisation using measures of distributions and measures of
central tendency due to some weaknesses identified in earlier measures of capacity
utilisation. (Christiano, 1981) was able to identify the Wharton Econometric
Forecasting Associates (WEFA) model which uses trends through peaks to measure
the intensity of capacity utilisation in industries That method could be used in
information capacity utilisation or other organisations but the method had its own
short comings as it deals specifically with tangible objects unlike in education that
deals with services and other items considered intangible (Akangbou, 1985).
Secondly, data based method was also identified using the Cobb Douglas production
function but the following short comings were observed in them; the extreme
dependence on data which when used in survey research designs are difficult to
establish their levels of reliability since it is applicable to long run relationships
between input and output and in a situation where time series data is not available,
leads to error of judgment.
Information is an important resource in education whose utility cannot be over
emphasized hence as the generation rate is being discussed, its utilisation needs and
36
rates must be established to aid educational and academic planning. Siber (1974)
listed ten reasons why educators utilise information and they include:
(i) ascribing legitimacy to on going activities,
(ii) wining any counter argument with empirical evidence,
(iii) satisfying intellectual curiosity
(iv) avoid unethical practices through trial and error and manipulation
(v) increasing awareness of barriers, pitfalls and challenges to any particular
course of action
(vi) keeping current with trends in education,
(vii) learning about college courses,
(viii) learning about activities in research and development,
(ix) achieving conceptual clarity regarding one‟s activities and
(x) being inspired to higher levels of synergy and commitment.
Other scholars are of the opinion that certain factors influence the utilisation of
any resource and in essence information. David (1959) and Nwankwo (1985), listed
the factors and they include;
(i) demand for the resource
(ii) supply of the resource
(iii) Technology and
(iv) Quality of personnel
To adequately examine organisational requirements of information needs in
Nigerian universities, this study examined the rate of information demand and supply
and channels through which information gets to the ultimate user. The study further
examined the available technology and the quality of personnel at each level of
information and planning. Information needs in Nigerian universities could be more
appreciated when the level of information deficiency is understood. Scholars in the
literature have not been able to define accurately the level of information needs in the
university system but it is clear that there is information deficiency. The works of
Nwankwo (1982), Adimorah (1993), Okojie (2007), Ekwere (1990) and Erwat (2004)
pointed out levels and causes of information deficiency to include; inadequate
infrastructure for gathering, collating and processing information capable of causing
exceeding approved limits of university carrying capacities and policy quotas
(Ojedele and Ilusanya, 2006). It is noted that when such limits are exceeded and
communications made with those it concerns, there is absence of technology and will
37
power to correct the anomalies since the information communication technologies
being used are outdated and inappropriate (Babalola,2009 and Babalola, 2010).
Abels, Leibescher and Denman (1997) attest to the fact that the greatest asset
to information availability is personnel. Rogers (1995) is of the opinion that the
society in which a person or organisation interacts influences to a great extent his
behaviour towards any object hence the submission by Okhiria (2007), that Nigerian
undergraduates need major exposure to IT training and consciousness to be able to
compete favourably with their counterparts from other developed countries of the
world.
To overcome the challenge identified by Okhiria (2007), the extent of IT
training to undergraduates in Nigerian universities will be under taken in this study
while the capacity of Nigerian university lecturers will also be measured. This study
investigated facilities that have been put in place to train these army of personnel
resources that will man industries and organisations in the very near future. This will
to a large extent unveil the levels of utilisation of available management of
information infrastructure as generated by stakeholders of the academic community
and the preparedness of Nigerian university graduates for the challenges in the new
millennium.
2.4 Overview of Academic Planning Effectiveness in Nigerian Universities
Soyibo (1985), writing on academic planning in universities, described it as
the coordination of a university‟s manpower planning system and planning for its
physical development. The process of academic planning according to Soyibo (1985)
involves meeting requests made to the academic planning unit for either personnel or
physical development. The academic planning department evaluates requests from the
various departments, faculties and units in the university on the basis of the following
factors; ensuring that university policy decisions do not conflict with national
objectives through the National Universities Commission or the university‟s
Governing Council on same subject, aligning requests in line with national
development and planning goals of the university for the period being considered,
performance of the units making request to enable academic planning assess if the
requesting department /faculty qualifies for the request it is making, ensuring if funds
have been earmarked for the project and whether such funds are ready.
38
It is clear that the mandate of the academic planning unit of any university is
enormous. The academic planning unit has the responsibility of first getting
information on a subject from within and outside the university to fully prepare for the
extension of such policy. Again, the academic planning office of any university must
be conversant with faculties and departments through the collection, collation and
evaluating data needs from time to time. In the present dispensation under
globalization, the academic planning office must be conversant with global trends in
educational planning (Brodjonegoro, 2000) and Marttey ( 2005). The implication is
that the academic planning unit of any university must be very proficient in
information gathering, collation and information dissemination.
With academic planning office ensuring strict compliance with policy through
monitoring and recommendations in the universities, it stands in a vantage position to
guide, influence and carry the university senate along with its administration in
enforcing university best practices by ensuring that the recommended student/teacher
ratio is maintained, ensuring compliance to recommended admission quota and
carrying capacity by the National Universities Commission. The enormity of the
functions of the academic planning unit becomes more visible when viewed in the
light of the annual and growing national demand for education which has never been
satisfied. In Nigeria, only 12% of annual admission seekers gain admission into
licensed and operating universities (both public and private). It is suspected that the
low admission rate in the midst of a vast array of qualified candidates places tough
pressures on university administrators in times of undergraduate admissions (Ewart,
Isah & Fabunmi, 2008). The foregoing spelt out the functions of academic planning
units/departments in universities but what is the importance of planning academics in
the present dispensation? The importance of planning academic among other things in
the new dispensation include;
(i) To meet the rising global changes associated with educational planning and
societal expectations from universities, closing the widening gap between
developed, emerging and developing nations that require consistent updating of
the academic planning section of every university to bridge such gaps as
measures which hitherto had proved unsuccessful are being globally reviewed to
pave way for new and better methods of doing things (CODESRIA, 2004)
therefore academic planning must not be static.
39
(ii) The constant challenges that face academic development in the third world
makes it imperative for academic planning to be dynamic and effective, for
example the rise in information utilisation mechanisms (the digital age,
globalization etc) (Babalola and Jaiyeoba, 2008). Furthermore, the constant
problems arising from poor funding of the universities require planning ,
replanning especially when university request for funds fall short of both
approved and released funds (Ewart, Isah and Fabunmi; 2008).
(iii) The complex nature of the academic environment require regular and pro-active
planning for example, the financial requirement by different sections of the
university, community varies. The financial requirements in the fields of
Science, Engineering, Medicine, Agriculture that are technological, Human
Medicine and the natural sciences have needs to build, equip, maintain and
sustain laboratories to which the academic planning section must ensure a
balance according to need and in line with national policy. Therefore, the
section obviously needs updated information regularly.
Though accepted that academic planning section needs information, Igbeka
(2001) looked at the various sources from which an organisation could source
information. The study categorized information sources into 2 namely; internal and
external sources. Internal sources involve sources within the university at large while
external sources include those outside the confines of the universities as well as those
associated with allied institutions capable of being sourced via the internet. A
question then is are academic planning sections of Nigerian universities equipped
enough to meet with the exigencies of modern governance and planning for a
productive human resource base for our economies in this century? How effective is
academic planning in the universities?
Anderson (2004) described the term effectiveness as the extent of goal
attainment in any endeavour. He further explained that to evidence effectiveness, the
operator must manifest; information seeking initiative, flexibility, accountability and
access to information. The middle states commission review report in the USA (2004)
while looking at the issue of educational effectiveness in the USA, explained that the
concept of educational effectiveness can only be assessed when certain questions are
answered for example, is the institution fulfilling its mission statement and achieving
its goals, how coordinated are the programmes and resources of the organisation? The
university of Toronto also described effectiveness to mean an assessment of strength,
40
weaknesses and opportunities in any environment to enable that organisation
reposition. This research observes from the literature that effectiveness could infer
and imply, the intensity or extent to which goals and targets are fulfilled through
continuous usage and in this particular instance, academic planning using information
generation, availability and its utilisation capacities.
In the process of ascertaining the effectiveness of academic planning in their
universities, some world grade universities as Massachusetts, Wisconsin, Murdock
and Toronto in the United States of America developed tools for assessing academic
planning in their institutions. These instruments are questionnaires developed by the
university academic planning sections for undergraduate programmes at 100 and 400
levels respectively measuring certain variables in students at point of entry and points
of exit. These tools enable the university measure its level of impact and its academic
planning effectiveness. Areas where the universities were emphatic on academic
planning effectiveness included; Teacher/pupil ratios and class sizes, accommodation
and lecture equipment both for lecturers and students including hostel and office
accommodation, access to internet facilities, transportation and student counseling
services. This study though adopted these indices, it further added and measurement
variables in Nigerian universities adapting the instruments used by these universities
to information generation, availability and utilisation capacities.
The study of academic planning effectiveness is usually devised where there
appear to be growing dissatisfaction among university stakeholders on achievement of
its mission statement. Its plans are reviewed taking the usual information apparatus
into position such as; inviting faculties and department for curriculum reviews,
infrastructural reviews in line with university policy and national objectives in
education after obtaining the perception of university planning effectiveness from
staff and students organised by academic planning section periodically.
How effective is academic planning in our universities? This question can
only be answered in chapter four (4) of this work after analysis. Scholars who worked
in this area include (Katz and Khan, 2006). Katz and Khan (2006) described
academic planning as a well laid out procedure capable of improving the intricate
protection of an individual, a college or university. The University of Toronto (2004)
and the University of Wisconsin (2007) agree that academic planning is a chart of
direction that takes a person/unit or programme from one level to another in a
university environment. Academic planning involves present and future actions of the
41
university; it makes choices and sets priorities. Other descriptions and functions of
academic planning according to the document is that it sets institutional goals through
a study of national and institutional objectives. The document further suggested steps
to be adopted in academic planning to include; undertaking a self study/appraisal and
carrying out extensive reviews of its own functions in relations to goals, strategies,
achievement measurement and correlational contingency plans. The suggested self
study programme is designed to enable the department know where it stands that is,
its present capabilities in line with its anticipated capabilities. It must be able to
produce a description of its academic structure such as its number of faculties,
department, present and anticipated staff strength, anticipated budgetary „cost vis-à-
vis internally generated revenue and cost. However, this study is not connected with
cost determination, budgetary incidentals though they fall within the purview of
academic planning but concentrates on information for academic planning
effectiveness.
2.5 Information Management Policy Evolution in Nigeria and the Influence
of Information Communication Technology (ICT) to Education/Academic
Planning Effectiveness in Universities
Over the years, students and scholars in the field of information studies have
known the value of information and thus craved for national policies on information
studies and its adoption in Africa together with the adoption of modern information
communication technology policy in respective African countries. For example, in
Zambia, the formulation and implementation of national information policy was well
agitated (Lundu and Mbewe, 1993) but till today, it is doubtful if there is still an
information policy in Zambia. Adekanbi, (2008) decried the absence of information
communication technology policy among African countries and specifically stated
that only five African nations had an ICT policy in place.
Lundu and Mbewe, (1993) described an information policy as „a guide to the
manner in which a nation expects matters on information to be handled. Lundu and
Mbewe (1993:24) derived inspiration for the call to formulate national information
policy for Zambia from the 1985 UNESCO call to nations through its organ UNSIST
which is the region‟s economic grouping.
The inspiration to cry for a Zambian information policy according to Lundu
and Mbewe (1993:25), Igani (1990) came not only from UNESCO/UNISIST but also
42
at the regional level where the organisation of African Unity (OAU) now African
Union (AU) under the United Nations Economic Commission for Africa (UNECA)
created the Pan African Development Information System (PADIS) in the 1980‟s.
PADIS hinged its background Position as follows:
…the Pan African Development Information System
(PADIS) was created in 1980 at the expressed wishes
of the African member states, to assist in the
development/strengthening of the information and
documentation infrastructures of the African member
states. The overall objective of PADIS is to establish
regional information systems in African which will
serve as a conduit for information and data
development, centred around national, regional and
sub regional networks to which all members will
contribute information and share their information
management techniques. PADIS is both a system and a
network. PADIS network consist of rational, sub
regional and… (Lundu and Mbewe, 1993:24)
In the Nigerian context, the need for information has been recognized since
independence. The Federal Government of Nigeria (FGN) took the initiative many
years ago, for example, the FGN took bold steps in ensuring availability of
information through an Act of Parliament in 1962 to establish the Federal Office of
Statistics now Federal Bureau of Information; Nigerian Institute for Social and
Economic Research (NISER). Arising from the submissions of „scholars and
(PADIS), the Nigerian Universities Commission (NUC) advocated the need for the
Computerised Management Information Systems in all Nigerian universities in 1990.
The objective of that policy was to usher and introduce Nigerian universities system
into the emerging world of computers at that time. With the advent of the internet, the
policy had become enlarged with a more national outlook for wider application than
the original idea mooted in 1990 by the NUC. In the New National Policy on
Information technology, section two as documented by (Nnebe, 2008:47), is presented
follows:
43
….Information Technology (IT) is the
bedrock of national survival and
development in rapidly changing global
environment, and challenges us to device
bold and courageous initiatives to address
a host of vital social-economic issues
such as reliable infrastructure, skilled
human resources, open government and
other essential issues of capacity
building. In addition, an information
technology policy built on reliable human
resources and infrastructure constitutes
the fundamental tool and means of
assessing planning, managing
development change for achieving
sustainable growth”.
The vision statement of the IT policy reads; to make Nigeria an IT capable country in
Africa and a very key player in the information society by the year 2005, using IT as
the engine for sustainable development and global competitiveness. The mission
statement of the policy included:
(i) Education
(ii) Creation of wealth
(iii) Poverty Eradication
(iv) Job creation
(v) Global competitiveness
The foregoing showed the position which the policy ascribed to education and
by extension higher education (universities) in Nigeria. The document shows in
explicit terms that Nigerian does not have an ICT policy but an IT policy which
applies to several other African nations. The general objectives of Nigeria‟s
information Technology Policy (NITP) included to:
Ensure the availability of IT resources to promote efficient and national
development.
To guarantee that the country benefits maximally and contributes
meaningfully by providing global solutions to the challenges of the
information age.
To establish and develop IT infrastructure and maximize its use
nationwide
To enhance planning mechanisms and forecasting for the development of
local infrastructure.
44
To create IT awareness and ensure universal access in order to promote IT
diffusion in all sectors of our national life.
To create an enabling environment and facilitate private sector (national
and multinational) investment in the IT sector.
To build a mass pool of IT literate manpower using the NYSC, NDE and
other platforms as “train the trainer” scheme (TTI) for capacity building.
To set up advisory standards for education, working practices and industry.
In chapter two, and specifically in page 55, the National Policy on
Information Technology (NPIT) intends to:
Make the use of IT mandatory at all levels of educational institutions
through adequate financial provisions for tools and resources.
Develop relevant IT curricula for primary, secondary and tertiary
institutions.
Establish facilities for electronic distance learning networks and ensure
effective internet connectivity which will provide opportunities for
educationally disadvantaged areas.
Encouraging IT companies with appropriate incentives to compel them to
invest in education and training through certification for tax rebates
through existing government bodies experienced in such matters as the
industrial training fund. (ITF) and Centre for Management Development
(CMD).
The foregoing are pointers to the fact that the government of Nigeria has over
time, understood the need for information and is interested in adopting current trends
in ICT though without a policy backing and many today mistake IT for ICT without
knowing the difference including some professionals. With this back ground, one may
then ask, does ICT have any relevance to educational planning? An obvious answer is
yes! and if so how, and why?
In the first instance, educational planning involves a series of actions and
procedures today in education that have future consequences (Longe, 2003),
Nwankwo, (1981), Nwankwo (1985), Babalola (2003) and Fabunmi (2004). The crux
of educational planning involves educational projections and forecasting which are
not possible without adequate information, data or statistics. They are not only to be
available but must be accurate, flexible, adequate, capable of enabling accurate
45
predictions to enhance decision making in organisations and nations (Park, Yeon and
Kin, 2006). The foregoing points to the fact that information necessary for academic
planning effectiveness should be properly stored in networks and databases for early
retrieval.
Furthermore, the educational objectives of nations keep changing in the 21st
century. Such changes are not unconnected with social, political and cultural
challenges currently facing the world for which solutions are being expected from the
university system through competent, research, innovations, creativity and inventions.
In the light of the foregoing, universities are under intense challenges to produce
results Nwangwu (2009) and Ayeni, Isah, Erwat and Ileuma (2009).
The desire for solutions to conquer the challenges arising from
environment/hazards particularly globalization, climate change, food crises etc is in
genuine academic planning as these issues form the challenges facing the world in
this century. The introduction of dynamism into the planning and making of
educational management is designed to keep universities abreast with information
needs that cannot be manual but electronic (moving at the speed of light). Should this
be so, there must be a pool of both human and material resources from which
universities can draw or fetch information hence the urgent need to create information
networks and databases.
After a self study assessment by academic planning sections of universities,
the next aspect is to look into the goals of academic planning. Goals of academic
planning include future expectations that are better accomplished through asking
questions and providing solutions to such questions. In their work, several challenges
were highlighted which include absence of national information policies, information
processing infrastructure, professional personnel to handle information and
information awareness institutions.
This study hereby explores the types of information management system that
operates in Nigerian universities and their current status? In section 2.2 of this study,
the nature of information systems that could be adopted by universities was visited. It
was observed that the era of the manual management information systems is fast
giving way to the Computerised Management Information Systems (CMIS). It is
computerisation than enables ICT. The evolution of the micro computer went a long
way to simplify organisational tasks. In modern management and organisations, the
manager has no choice as the 21st century known in literary circles as the „jet age‟
46
cannot be manual. The computer has become office equipment (McLeod, Jr, 1985)
and Obanya (1999). Previously, the computer was regarded as a product reserved
exclusively for a particular class of people but in recent times, such notion has begun
to give way even in Nigeria. Most probable reasons why people idolised the computer
is not unconnected with the class, models and costs associated with buying and
maintaining computers then. Folorunsho (2003) gave the following analysis on the
evolution of the computer which we use today and his analysis can explain why the
computer and its accessories are always changing and cost rising relative to need use
and demand;
The first phase of computers operated between 1550 and 1716. Prominent
scientists associated with this phase were; John Napier (1550 - 1617). Napier was a
Scottish Mathematician, then Blaise Pascal and Gottfried Von Liebnitz (1646-1716).
The main capability of the first phase computers were addition, subtraction, division
and multiplication. Second phase computers operated between 1752 - 1954 with
popular scientists researching and modernizing its capabilities. Computing moved
away from only pure calculation to information processing. Joseph Jacquard (1752-
1834) used the punch card and mechanical storage and reading of punch cards.
Charles Babbage (1792-1871) introduced the idea of stored programmes, input and
output and still used punch cards. Charles Babbage‟s input, output processing unit that
formed the basis of modern computeing was called a MILL. It was not completed in
his life time as it took close to a hundred years to perfect. Then came George Boole
(1819-1864) know in the computer world as the originator of Boolean algebra that
was used to describe and manipulate logical expressions, then came Herman Hollerith
(1860-1929). He introduced several aspects to the work of George Boole. His research
enabled the computer to be used for the American census of 1890 and later adopted
for the use of commercial banks. Finally in the second phase was Allan Turning
(1912-1954), he worked assiduously on logical conclusions for the computer.
The third phase of computers proved interesting as it saw the very rapid
improvements, developments and transformation of the computer especially in the
20th
century. Major break through s recorded at this time were:
Storage of information in binary codes (not punched cards)
Logicality and combining binary codes evolved
Programming languages began to evolve
47
Electrical transistors and devices, cathode ray tubes were discovered.
In 1944, Harvard University in the USA discovered the ASCC (Automatic
Sequence Control Calculator). In 1946, the University of Pennsylvania discovered the
ENIACC (Electronic Numerator Integrator and Calculator). This machine continued
to be modified and in 1949 VON NEUMANN postulated the general requirements for
a computer. In 1948, arising from VON NEUMANNS works, F.C. Williams and G.C.
Torthill came up with the MARK I. This time, it was a small general purpose machine
with input medium as a keyboard and output medium as a Video Display Unit (VDU).
In the later part of the 20th
century, Mini, Macro and Maxi computers have come in.
These computers have the capacity to do great works at the speed of light. In the light
of (Folorusho, 2003) analysis of the evolution of the modern computer that includes,
desktops, notebooks, laptop etc, there is no feasible reason why computerisation
should not be part of the priorities of a modern 21st century university.
Any organisation which has not embraced computerization can best be
described as an organisation operating in the 21st century under principles applicable
to the dark ages. It cannot be expected that a modern 21st century university is not
fully computerised. Under such situations, academic planning is not effectively
operational.
Though this study reviewed literature extensively on Management of
information systems, computerisation taking particular interest in information
generation, availability, utilization and the effectiveness of academic planning. It must
be explained that information and computerisation in Nigeria, Africa at all levels of
education and institutions is facing unprecedented challenges. Babalola (2010) and
Ali (2009) pointed out that computer and information equipment in Africa was a far
cry away in cost from what they are in the USA. This was corroborated by several
other scholars. It is stated that cost of equipment in Africa is several times the cost of
the same equipment in the USA while funds are relatively easier to obtain in the
western world than in Sub Saharan Africa.
48
2.6 Appraisal of Literature
This study reviewed significant literature on previous works on the subject of
information generation, availability, utilisation and Academic planning effectiveness
in Nigerian universities. The study looked at the concept of information as explained
by earlier researchers that included; Neil and Anderson (1972), Barch (1986),
Moriano and Rodden (1996), Aiyepeku (1978), Aiyepeku (1982), Aiyepeku (1983)
and Nwankwo (1985). These scholars saw information as removal of uncertainly,
dispelling doubts from any endeavour and empowering the possessor. Such
empowerment avails the decision maker of enough facts to make timely decisions.
Other scholars agree that information facilitates decisions and ensures consistency in
managerial decisions (Grimshaw, 1995), Okpeke (1996), Owens, Wilson and Abel
(1997). The dearth of reliable information has been discovered to be an important
organisational resource that must be well managed (Nwankwo, 1985), Longe and
Agabi (1990). Some authorities see information as the cumulative summary of all that
obtains in organisations nations and individuals as it is the available information that
deepens the level of any preparation and planning that will be undertaken (UNESCO
1979 cited in Nwankwo 1985:11). Relevant information must be reliable, accurate,
relevant, timely, robust and accessible (Mondy, 1990), Plunkett and Attner (1994),
Hodge et al (1996) and Griffin (1993).
Information does not come from the air, it must be generated and it is only
generated information that can be utilised (Gibbs and Buchanan, 2007), Onocha and
Okpala (1995). Generated information is information that comes to an organisation in
several forms as memos, circulars, forms, correspondences etc. Where such
information is not adequately stored for re-use when required again, it cannot be said
to be generated information (Igbeka, 2001), Ewart (2004), Flores and Salaun (2001).
In the review of literature, it is agreed that information assists in planning, directing
the organisation through capturing processing, storage and retrieval of information. It
is also agreed that information cannot be appreciated without adequate personnel to
extract the qualities of such information (Fickle, 1997), Hickle (2007), Skineer
(1969), Muscon et al (1988) Rogers (2003) and Neeway (1982).
The priceless value of information makes its management imperative and
mandatory (Gordon and Lindsay, 1988) Flores and Salaun (2001). There are two
types of Management Information Systems (MIS). There is the manual and
49
computerized MIS, each with its attendant advantages and disadvantage. Scholars in
the information literature as Hubbard (2003), Muiguigan et al (2005) explained that a
good information generation capacity reduces cost of programmes and increases
productivity which in essence increases the profit margins of firms. Further to this,
good information reduces the stress managers pass through. Information capacity can
be measured in percentages although (Christiano, 1981), Woodhall (1966) and Becker
(1964) showed some other methods of capacity utilisation measurements but such
measurements were faulted for education products by Woodhall (1966) and
Akangbou (1985), as they could apply to the pure sciences and difficult to establish in
a survey research as commonly used in the behavioural sciences and education.
The need for computerisation was well stressed by Barnes (1966). The
literature dealt with the components of both information management and
management information systems specially the information network and database
system, information utilisation capacity in academic setting particularly the sources of
information. The reasons why educators utilise information was analysed by Siber
(1974). However the area of academic planning effectiveness was also explored.
Literature was reviewed in the area of academic planning effectiveness. It was
observed that several universities regarded as world class universities like Toronto,
Massachusetts, Wisconsin and Michigan etc have developed tools for measuring the
effectiveness of academic planning in universities. Katz and Khan (2006) and Soyibo
(1985) described academic planning as involving processes that include the faculties
and departments. Academic planning in universities deals with personnel costs,
administrative efficiency, meeting organisational objectives and laid down goals,
policies. Manifestations in academic planning from which its effectiveness can be
ascertained include; teaching methodologies, improved service deliveries as
accommodation for staff and students, satisfaction with admission, availability and
utilisation of counseling services and ensuring compliance with best practices
available but this study emphasised the role of information management stressing on
(generation, availability and utilisation) in ensuring academic planning effectiveness.
This study reviewed literature on the evolution of Modern Information
Communication Technology (ICT), its relevance and global influence on educational
planning. Educational policy planning and the meeting point of ICT policy in
developing countries was also reviewed using the works of Lundu & Mbewe (1993)
for Zambia and the works of Nnebe (2008) for Nigeria. The work of Lundu and
50
Mbewe (1993) was an advocacy for the adoption of the use of ICT through the
formulation of an IT policy in Zambia. Nnebe (2008) showed the Nigerian IT policy,
its strategies, vision, mission and some achievements.
The Nigerian IT policy has fallen short of its target as it was expected that all
civil servants (Federal) were to be IT literate and compliant by the year 2002. This is
yet to materialise hence a deliberate attempt in this work included the measurement of
the state of preparedness in universities for the adoption of IT. Adopting the systems
theory, universities are part of the larger Nigerian supra-society hence the universities
cannot be far removed from social events in the nation. ICT and educational planning
are facing great challenges. These challenges have been summarised as; low level of
computer literary, absence of basic infrastructure, dearth of technical support staff,
low level of funding, increasing and expanding unit cost in education and absence of
ICT policies (Akubilo, 2007). It is further argued that only five (5) African countries
namely; Kenya, Nigeria, Scychelles, South Africa and Zambia have IT policies
(Adekanbi, 2008), but it is yet to be established if any has ICT policy. It is mooted
that Bostwana has recently adopted one. African universities are encapsulated into the
general problem of African nations which is mostly financial. Other fundamental
crisis in African universities is the problem of brain drain which is closely related to
the foregoing challenges mentioned above.
2.7 Theoretical framework
Relevant and existing theories to this study are hereby adopted. They are:
(i) The Human Capital Theory
(ii) Information Capacity Theory
(iii) Planning Theory
(iv) Input/Output Theory
The Human Capital Theory
Human capital evolved from the works of the classical economists of the
sixteenth century as Adam Smith in 1756 in his book the „wealth of nations‟. He
observed the inherent qualities in human capital that were incomparable to any other
investments known. He was closely followed by the Neo classical economists as
Alfred Marshall, and modern day economists that include Milton Friedman etc all of
51
who have their perceptions of the same subject but in different and diverse
perspectives.
The theory on human capital (HCT) finds applicability in almost all facets and
endeavours of learning. Various economists beginning from the classical and later the
neo classical acknowledged the role human capital plays in production. It was this
foundation that made later say economist emphasize its adoption by government. It
was observed that no other investment in physical goods is comparable to that of
human beings hence regarded as the most comprehensive returns with greater returns
to scale (Schultz, 1971) and Schultz (1964). Also, Psacharaopolous and Patrinos
(2002) observed that investment in human capital cannot be compared to any other
investment hence they all advocated that government must continue to devote a high
percentage of its income to education. They observed that the characteristics of capital
whether human or physical include; increase in capacity, and capacity expectation,
time as a factor of investment and profit, capital build up (capital stock) and
depreciation (Babalola, 2000). Most economist especially in the evolution of human
capital theory identified land and labour which was referred to as the growth model,
but with time, the error factor was discovered and factored into its calculation of
returns to scale that was eventually attributed to an earlier undiscovered factor
“technology”.
Several scholars have given their weight to the human capital concept which
involves acquisition of skills, knowledge reasoning and decision making abilities in
the workforce of any organisation or nation (Ogbodo & Nwaoku, 2008) Gomez-Mejia
& Bulkain (2002). They explained that the qualities mentioned above supported
innovation and productivity through the provision of core competencies thus;
Knowledge resides in peoples minds and such knowledge is unique and
relative
Ability to harness human resources depends on the integrated achievement of
an interdependent individual employee and their willingness to collaboratively
use their talent to support organisational goals and missions.
Take long time to develop core competences
The culture of the organisation (goal and objective) play key roles in what
people do
52
The literature on human capital distinguishes among several types of
education and their contribution to education. Psacharopolous & Patrinos (2002),
observed that national returns to primary education is 7.9% while that of secondary
education was 8.5% and tertiary education 7.2% but private returns to primary
education was estimated at 15.4%, secondary and tertiary education at 11.5%
respectively and it is expected that it will be higher for developing countries like
Nigeria. Psacharopolous & Woodhall (1985), in another study used data from 85
countries to buttress the fact that schooling has increased based on enrolment ratios,
return on human capital investment that ranges between (3.4 and 7.4)% compared to
(0.4 to 1.0)% on other forms of investment and therefore argued that investment in
human capital is most preferred.
Another scholar, Blaug (1970), in the process of establishing a relationship
between investment in human capital and economic growth observed a direct positive
relationship with increasing level of literacy using data from 88 countries. The study
showed that a (20-30)% rise in average literacy rates resulted in GDP increases of
between (8-16)% with the strongest relationships existing in Sub-Saharan African
countries. Several benefits accrue to investment in human resources (Human capital),
these include economic growth increases improvement in health care through
population control and fertility rate improvement (Schultz, 1981).
Universities create human capital especially at the tertiary level of education.
Africa is technologically deficient (Adekanbi, 2008) and must be encouraged through
investment in education to improve. The theory is very much related to government
investment in public education as a social service with the poverty rate in Africa and
in Nigeria that is alarming.
Emphasizing ICT and information studies will enhance academic planning
effectiveness. A major point of intersection and relevance between the Human Capital
theory and this study lies in the fact that both emphasise investment in persons. While
Academic planning effectiveness in universities seeks to enhance the productive
capacity of Nigerian graduates through effective planning of curriculum and other
needs to ensure satisfaction and empowerment after education, the HCT emphasised
the reasons why the core competencies of man must be discovered and harnessed with
modern productive weapons and in this study the ICT. Both study and theory agree
that government has a major role to play in enhancing a balance between academic
planning effectiveness and information management since public universities are not
53
allowed to charge equilibrium school fees. Therefore, government shall continue to be
the source of finance for public universities providing basic needs especially
infrastructure for Management of Information (generation, availability and
utilisation).
Information Capacity Theory
The information capacity theory in organisations emphasises the abilities of
organisational staff to put themselves in vantage positions to acquire relevant
information that are related to their goals and objectives. The theory is ascribed to the
works of Shannon that gained prominence in 1948 and originated from
communication theories (Cover &Thomas, 2006). The theory emphasizes that the
movement of information from one point to another as A - B involves a process
transfer that is subject to uncontrollable ambient noise and imperfections in the
physical settings signaling the process itself. Shannon used the theory to prove that
information can be sent reliably over a channel at all rates up to the channel capacity
through the attainment of an arbitrarily small but non zero probability of error using
the channel many times in succession. To attain the ability to transfer information
over a reliable capacity channel, the theory emphasized the fact that its users must
possess certain innate variables for example; interest, creativity, aspiration, insight
and how they affect the attitudes of organisations to information sources and the
utilisation of such information (Okpeke, 1984) and Okwillagwe (1985).
The personality, emotion and mental variables identified by Okwllagwe
(1985), Tennenbaum & Schmidt (1958), include organisational norms, workshop
pressures and time. It is stated that these factors affect manager‟s behavior in
organisational setting like universities and its environment. The theory further
emphasises and work toward balancing information on the same subject with a
divergent view and therefore goes to the sources of such information to get the right
information that will lead to the right decisions. The information capacity theory is
much more about the ability to get the right information to avoid wrong decision. This
study is of the opinion that in the university setting, to attain academic planning
effectiveness sources of information must be ascertained, established and put in
proper perspective for good work thereafter.
Major issues in university governance have to do with taking choices out of
several competing alternatives in the face of scarce resources that is the essence of
54
management and so adequate information must be available to the planning managers
at all times in the right quantity and quality. The managers in the universities planning
unit must cross check information over and over again from the faculties and
departments. The mainstream of the university administration is the academic
planning section that verifies university‟s university internal policies with external
policy formulators as the NUC and the Federal ministry of education within a limited
frame hence the capacity to get such information must be associated with speed
leading to the acquisition and utilisation of modern ICT equipment as computers,
internet, networks, databases etc. earlier scholars had decried the availability of the
electronic communication system in Nigeria (Ayepeku, 1982), Tushman & Scalan
(1981).
Information capacity theory and the study on Management of Information and
Academic planning effectiveness in universities have common areas of interest as the
study seeks to establish the capacity of academic planning to generate and contain
relevant information, make it available for planning and enhance productivity and
satisfaction of stakeholders. While scholars studied found the sources of information
and capacity for information, this study also overviewed the information generation
process in Nigerian universities actually zeroing on its availability and utilization.
While the information capacity studies the movement of information, this study
observed the constituent elements in university administrations and planning that
actually generate information and their capacity for such activity.
Information Planning Theory
The information planning theory evolved after the world wars towards the
middle of the 20th
century though it became very popular towards the last three
decades of the 20th
century. The theory evolved from other disciplines as economics,
politics, feminism, rationality and communications. The theory has been researched
into by scholars as Faludi (1973, 1982 and 2000), Feriera, Sykes and Batey (2000),
Campbell and Fainstein (2003).
Though the theory had its origin from spatial planning before being applied to
other disciplines. Faludi (1982) related the theory to spatial planning while Ferriera et
al (2000) related it to the planning of education and the general planning theory since
planning is an endeavour that cannot be successfully executed without information
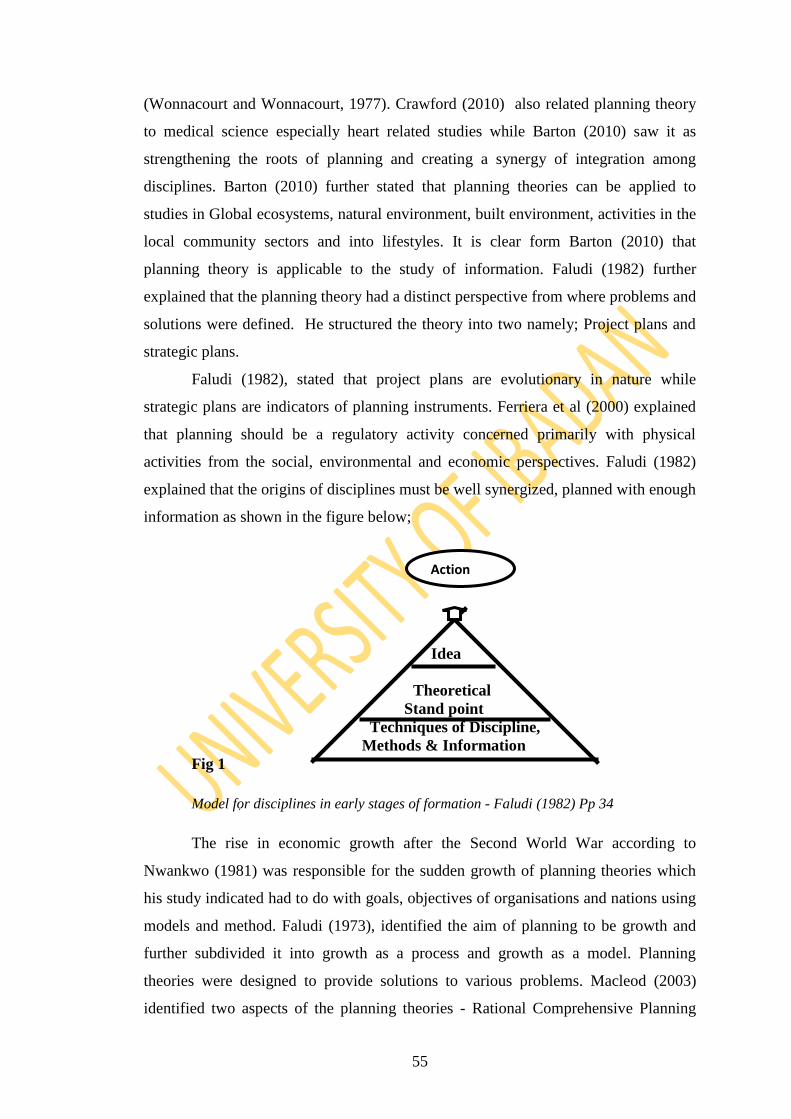
55
(Wonnacourt and Wonnacourt, 1977). Crawford (2010) also related planning theory
to medical science especially heart related studies while Barton (2010) saw it as
strengthening the roots of planning and creating a synergy of integration among
disciplines. Barton (2010) further stated that planning theories can be applied to
studies in Global ecosystems, natural environment, built environment, activities in the
local community sectors and into lifestyles. It is clear form Barton (2010) that
planning theory is applicable to the study of information. Faludi (1982) further
explained that the planning theory had a distinct perspective from where problems and
solutions were defined. He structured the theory into two namely; Project plans and
strategic plans.
Faludi (1982), stated that project plans are evolutionary in nature while
strategic plans are indicators of planning instruments. Ferriera et al (2000) explained
that planning should be a regulatory activity concerned primarily with physical
activities from the social, environmental and economic perspectives. Faludi (1982)
explained that the origins of disciplines must be well synergized, planned with enough
information as shown in the figure below;
Idea
Theoretical
Stand point
Techniques of Discipline,
Methods & Information
Fig 1
Model for disciplines in early stages of formation - Faludi (1982) Pp 34
The rise in economic growth after the Second World War according to
Nwankwo (1981) was responsible for the sudden growth of planning theories which
his study indicated had to do with goals, objectives of organisations and nations using
models and method. Faludi (1973), identified the aim of planning to be growth and
further subdivided it into growth as a process and growth as a model. Planning
theories were designed to provide solutions to various problems. Macleod (2003)
identified two aspects of the planning theories - Rational Comprehensive Planning
Action
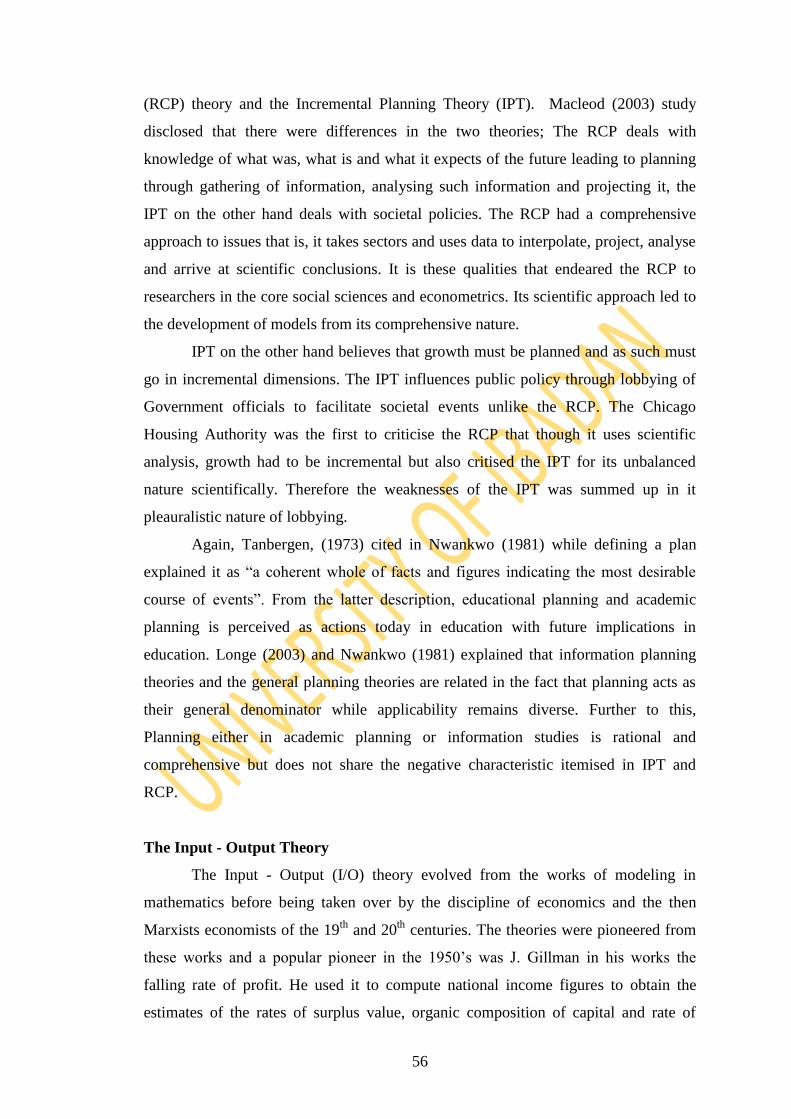
56
(RCP) theory and the Incremental Planning Theory (IPT). Macleod (2003) study
disclosed that there were differences in the two theories; The RCP deals with
knowledge of what was, what is and what it expects of the future leading to planning
through gathering of information, analysing such information and projecting it, the
IPT on the other hand deals with societal policies. The RCP had a comprehensive
approach to issues that is, it takes sectors and uses data to interpolate, project, analyse
and arrive at scientific conclusions. It is these qualities that endeared the RCP to
researchers in the core social sciences and econometrics. Its scientific approach led to
the development of models from its comprehensive nature.
IPT on the other hand believes that growth must be planned and as such must
go in incremental dimensions. The IPT influences public policy through lobbying of
Government officials to facilitate societal events unlike the RCP. The Chicago
Housing Authority was the first to criticise the RCP that though it uses scientific
analysis, growth had to be incremental but also critised the IPT for its unbalanced
nature scientifically. Therefore the weaknesses of the IPT was summed up in it
pleauralistic nature of lobbying.
Again, Tanbergen, (1973) cited in Nwankwo (1981) while defining a plan
explained it as “a coherent whole of facts and figures indicating the most desirable
course of events”. From the latter description, educational planning and academic
planning is perceived as actions today in education with future implications in
education. Longe (2003) and Nwankwo (1981) explained that information planning
theories and the general planning theories are related in the fact that planning acts as
their general denominator while applicability remains diverse. Further to this,
Planning either in academic planning or information studies is rational and
comprehensive but does not share the negative characteristic itemised in IPT and
RCP.
The Input - Output Theory
The Input - Output (I/O) theory evolved from the works of modeling in
mathematics before being taken over by the discipline of economics and the then
Marxists economists of the 19th
and 20th
centuries. The theories were pioneered from
these works and a popular pioneer in the 1950‟s was J. Gillman in his works the
falling rate of profit. He used it to compute national income figures to obtain the
estimates of the rates of surplus value, organic composition of capital and rate of
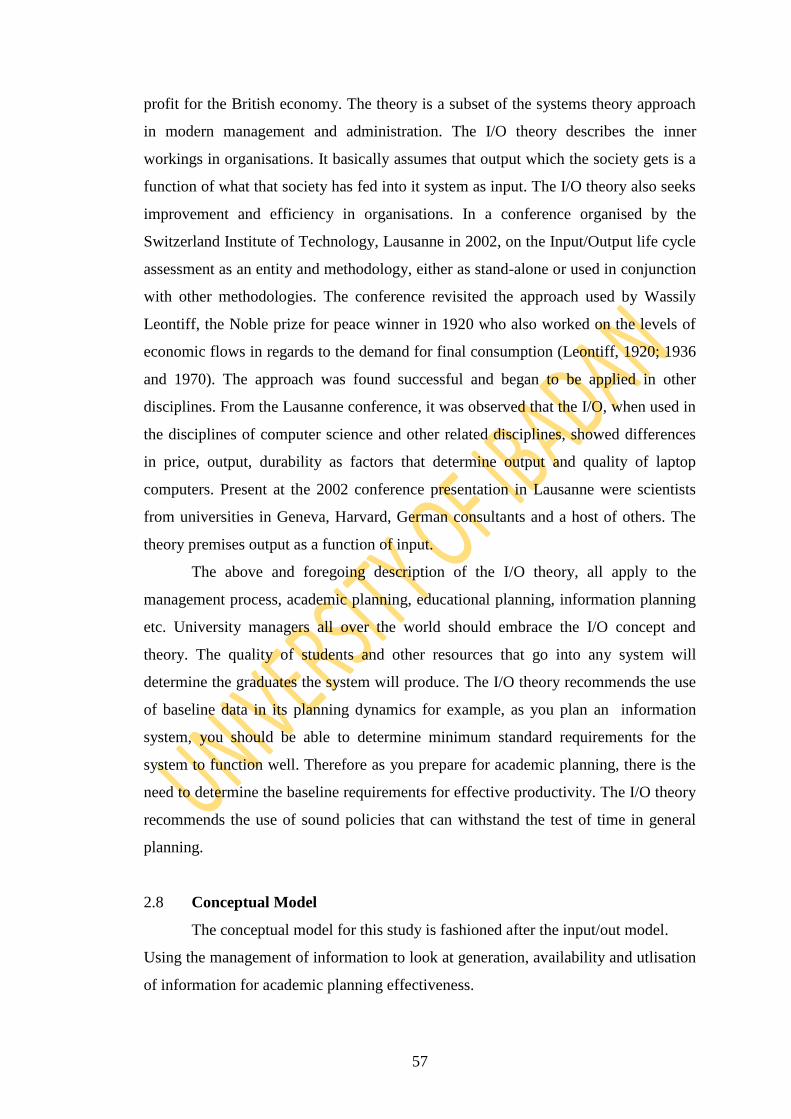
57
profit for the British economy. The theory is a subset of the systems theory approach
in modern management and administration. The I/O theory describes the inner
workings in organisations. It basically assumes that output which the society gets is a
function of what that society has fed into it system as input. The I/O theory also seeks
improvement and efficiency in organisations. In a conference organised by the
Switzerland Institute of Technology, Lausanne in 2002, on the Input/Output life cycle
assessment as an entity and methodology, either as stand-alone or used in conjunction
with other methodologies. The conference revisited the approach used by Wassily
Leontiff, the Noble prize for peace winner in 1920 who also worked on the levels of
economic flows in regards to the demand for final consumption (Leontiff, 1920; 1936
and 1970). The approach was found successful and began to be applied in other
disciplines. From the Lausanne conference, it was observed that the I/O, when used in
the disciplines of computer science and other related disciplines, showed differences
in price, output, durability as factors that determine output and quality of laptop
computers. Present at the 2002 conference presentation in Lausanne were scientists
from universities in Geneva, Harvard, German consultants and a host of others. The
theory premises output as a function of input.
The above and foregoing description of the I/O theory, all apply to the
management process, academic planning, educational planning, information planning
etc. University managers all over the world should embrace the I/O concept and
theory. The quality of students and other resources that go into any system will
determine the graduates the system will produce. The I/O theory recommends the use
of baseline data in its planning dynamics for example, as you plan an information
system, you should be able to determine minimum standard requirements for the
system to function well. Therefore as you prepare for academic planning, there is the
need to determine the baseline requirements for effective productivity. The I/O theory
recommends the use of sound policies that can withstand the test of time in general
planning.
2.8 Conceptual Model
The conceptual model for this study is fashioned after the input/out model.
Using the management of information to look at generation, availability and utlisation
of information for academic planning effectiveness.
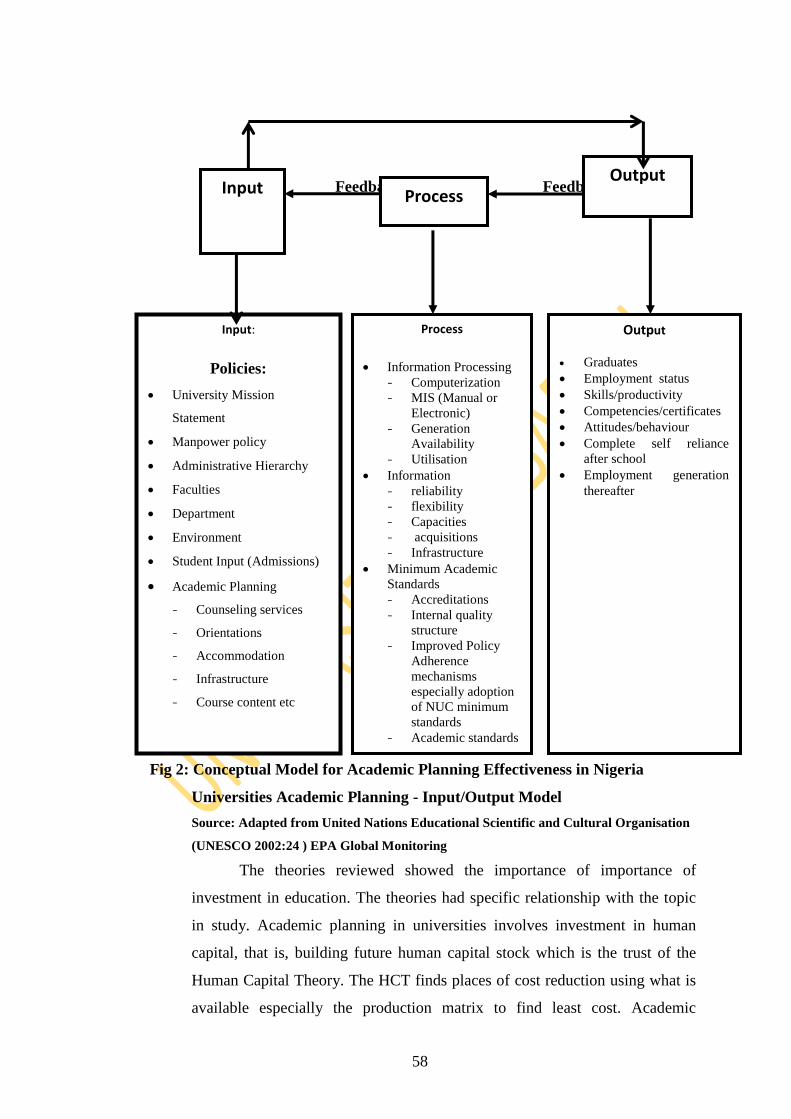
58
Feedback Feedback
Fig 2: Conceptual Model for Academic Planning Effectiveness in Nigeria
Universities Academic Planning - Input/Output Model
Source: Adapted from United Nations Educational Scientific and Cultural Organisation
(UNESCO 2002:24 ) EPA Global Monitoring
The theories reviewed showed the importance of importance of
investment in education. The theories had specific relationship with the topic
in study. Academic planning in universities involves investment in human
capital, that is, building future human capital stock which is the trust of the
Human Capital Theory. The HCT finds places of cost reduction using what is
available especially the production matrix to find least cost. Academic
Input
Process Output
Input:
Policies:
University Mission
Statement
Manpower policy
Administrative Hierarchy
Faculties
Department
Environment
Student Input (Admissions)
Academic Planning
- Counseling services
- Orientations
- Accommodation
- Infrastructure
- Course content etc
Process
Information Processing
- Computerization
- MIS (Manual or
Electronic)
- Generation
Availability
- Utilisation
Information
- reliability
- flexibility
- Capacities
- acquisitions
- Infrastructure Minimum Academic
Standards
- Accreditations
- Internal quality
structure
- Improved Policy
Adherence
mechanisms
especially adoption
of NUC minimum
standards
- Academic standards
Output
Graduates
Employment status
Skills/productivity
Competencies/certificates
Attitudes/behaviour
Complete self reliance
after school
Employment generation
thereafter
59
planning while carrying out its functions that include investing in the future of
Nigerian undergraduates also has the duty to maintain policy.
Further to this, the Information capacity theory that was used has the
same thrust as the management of information as it looked at the capacity to
generate, utilise and make information available for academic planning. The
theory was quite relevant to the topic in the sense that the theory is much
involved in the discovery of the capacity to get information, acquire
information and store information which is the trust of the independent
variables in this study. The Input output theory is quite relevant and related as
we have to find out the levels and quantity of mix that will bring the best out
of our undergraduates. Input into the system are shown in the conceptual
framework and methods of processing the input into the output of our desire
are also shown. This invariably is the function of the department of Academic
planning in universities.
The generation of information will assist the educational administrator
and planner to understand the level of input resources required to keep the
process moving. Availability and utilisation of input (processing) ensures
optimality to the best advantage in the system. All four theories move in the
direction of quality, productivity and utilisation of input for optimal output.
60
CHAPTER THREE
METHODOLOGY
3.1 Research Design
The study adopted the survey research design of the „ex post facto‟ type that is
correlational in nature. The survey research was adopted as it was found to be suitable
for studying large populations. The study investigated the Management of
Information as Predictor of Academic Planning Effectiveness in Nigerian
Universities. The study had generation (IG), availability (IA), utilisation (IU) of
information as its independent variables while academic planning effectiveness (APE)
was the dependent variable. The study adopted the survey research in line with
Christiano (1981) and Hubbard (2003).
3.2 Study Population
The total study population comprised Directors of Academic Planning,
Directors of Management Information Systems (MIS) and Directors of Information
Communication Technology (ICT) Centers with teaching staff, students in 100 and
400 levels respectively in Nigeria‟s first and second generation universities. They
were altogether 64,742. The universities used for the study were all Federal
Government (FG) owned public universities. A total of 7,160 respondents spread
across the six geopolitical zones of Nigeria formed the study sample.
3.3 Sampling Procedure and Sampling Technique
The multi stage sampling procedure was adopted in selecting samples for the
study. At the university level, it was purposively determined that only first and second
generation universities should be used for the study to keep data under manageable
proportion and more so within the limits of fund. A 50% sample was also purposively
adopted among the two categories of universities, that is, 50% of first generation
universities and another 50% of second generation universities.
The above procedure gave rise to the adoption of seven out of Nigeria‟s
thirteen first and second generation universities. The 6 first generation universities
were: universities of Ibadan, Lagos, Nsukka, Benin, Obafemi Awolowo and Ahmadu
Bello universities. Fifty percent of these 6 universities was 3. To enhance a fair
61
representation, the study ensured a geographical spread of the three universities to be
sampled among first generation universities. Hence, the universities of Ibadan in the
Southwest, University of Nigeria Nsukka in the South East and Ahmadu Bello
University in the Northwest were selected. Furthermore, to ensure fairness in
selection and avoid bias, the study selected the oldest of the universities as it was
believed that funds among Nigerian universities were rationed most times according
to age which is a strong determinant of other factors and outcomes especially
infrastructural development.
Another fifty percent of second generation universities were selected across
the remaining geopolitical zones that were not represented in the first selection.
Second generation universities were seven: The universities of Calabar, Ilorin, Jos,
Maduguri, Bayero in Kano, Port Harcourt and Sokoto. A fifty percent sample was 3.5
that was approximated to 4. The following universities were selected: Bayero in
Kano, Ilorin, Maiduguri and Port Harcourt spread across the Northwest, Northcentral,
North East and the South, South of Nigeria respectively. This procedure is clearly
reflected in Tables3.1 and 3.2
The next stage of the sampling procedure involved the choice of faculties to be
studied in the selected universities. They were purposively selected especially
faculties found to be common to all universities running the same programmes. A
fifty percent sample was adopted that gave rise to five regular faculties that run 4-
5year programmes namely; Arts, Education, Social Sciences, Education and
Agriculture. Not all first generation and second generation universities run Faculty of
Management Sciences. Centres and Institutes were not used as they were not regular
Faculties. Twenty five percent respondents sample was adopted. The respondents
among the various categories were selected using the simple random sampling
technique. Finally, since the directors were only 14 in the 7 universities selected for
the study, a census of all directors was adopted. These are well explained in Tables
3.3, 3.4 and 3.5
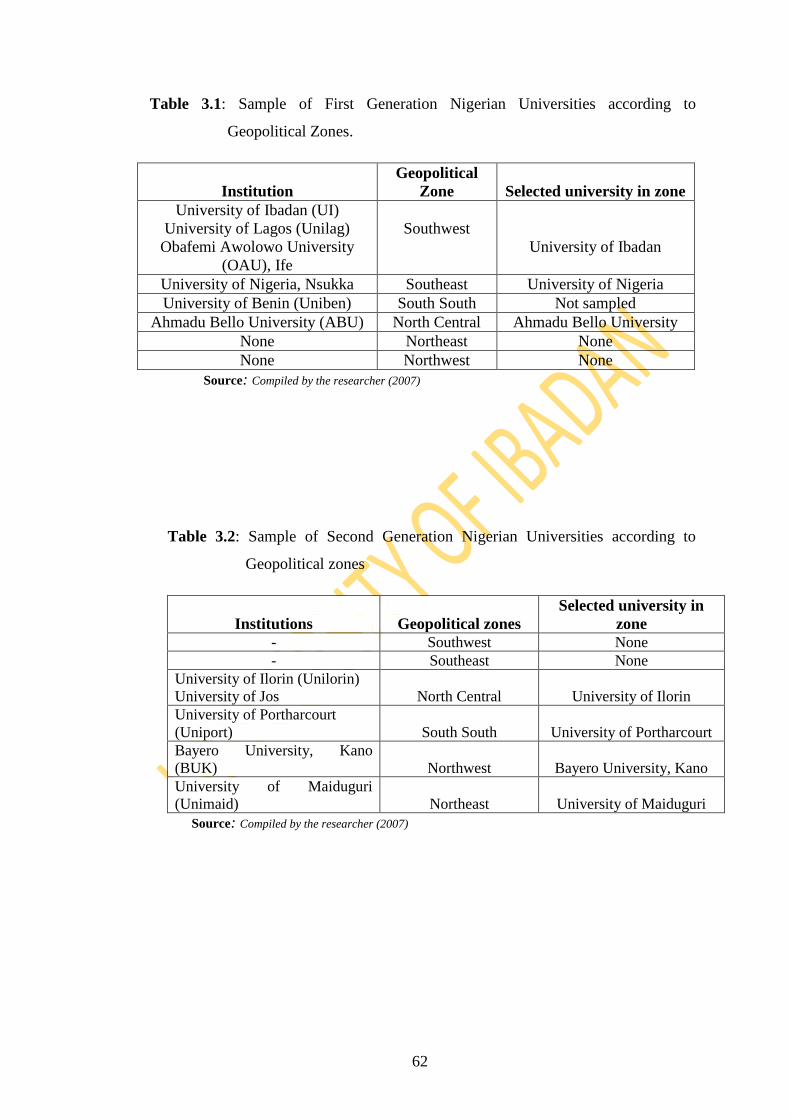
62
Table 3.1: Sample of First Generation Nigerian Universities according to
Geopolitical Zones.
Institution
Geopolitical
Zone
Selected university in zone
University of Ibadan (UI)
University of Lagos (Unilag)
Obafemi Awolowo University
(OAU), Ife
Southwest
University of Ibadan
University of Nigeria, Nsukka Southeast University of Nigeria
University of Benin (Uniben) South South Not sampled
Ahmadu Bello University (ABU) North Central Ahmadu Bello University
None Northeast None
None Northwest None
Source: Compiled by the researcher (2007)
Table 3.2: Sample of Second Generation Nigerian Universities according to
Geopolitical zones
Institutions
Geopolitical zones
Selected university in
zone
- Southwest None
- Southeast None
University of Ilorin (Unilorin)
University of Jos
North Central
University of Ilorin
University of Portharcourt
(Uniport)
South South
University of Portharcourt
Bayero University, Kano
(BUK)
Northwest
Bayero University, Kano
University of Maiduguri
(Unimaid)
Northeast
University of Maiduguri
Source: Compiled by the researcher (2007)
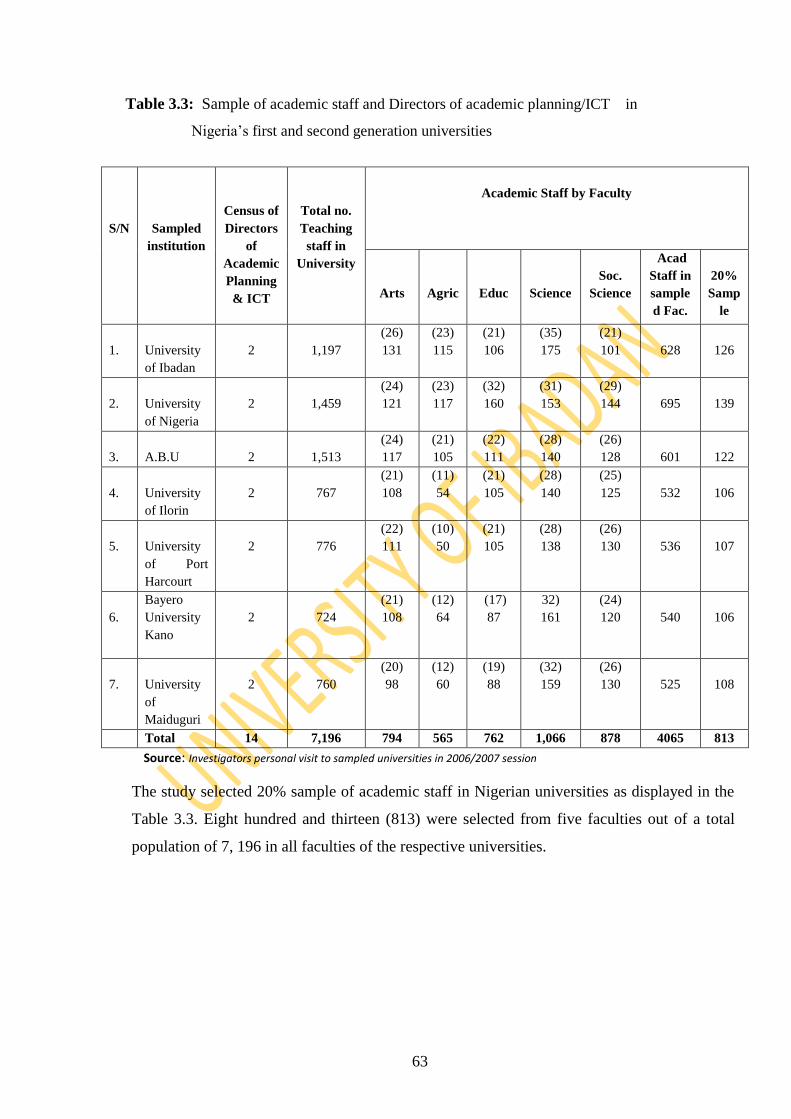
63
Table 3.3: Sample of academic staff and Directors of academic planning/ICT in
Nigeria‟s first and second generation universities
S/N
Sampled
institution
Census of
Directors
of
Academic
Planning
& ICT
Total no.
Teaching
staff in
University
Academic Staff by Faculty
Arts
Agric
Educ
Science
Soc.
Science
Acad
Staff in
sample
d Fac.
20%
Samp
le
1.
University
of Ibadan
2
1,197
(26)
131
(23)
115
(21)
106
(35)
175
(21)
101
628
126
2.
University
of Nigeria
2
1,459
(24)
121
(23)
117
(32)
160
(31)
153
(29)
144
695
139
3.
A.B.U
2
1,513
(24)
117
(21)
105
(22)
111
(28)
140
(26)
128
601
122
4.
University
of Ilorin
2
767
(21)
108
(11)
54
(21)
105
(28)
140
(25)
125
532
106
5.
University
of Port
Harcourt
2
776
(22)
111
(10)
50
(21)
105
(28)
138
(26)
130
536
107
6.
Bayero
University
Kano
2
724
(21)
108
(12)
64
(17)
87
32)
161
(24)
120
540
106
7.
University
of
Maiduguri
2
760
(20)
98
(12)
60
(19)
88
(32)
159
(26)
130
525
108
Total 14 7,196 794 565 762 1,066 878 4065 813
Source: Investigators personal visit to sampled universities in 2006/2007 session
The study selected 20% sample of academic staff in Nigerian universities as displayed in the
Table 3.3. Eight hundred and thirteen (813) were selected from five faculties out of a total
population of 7, 196 in all faculties of the respective universities.
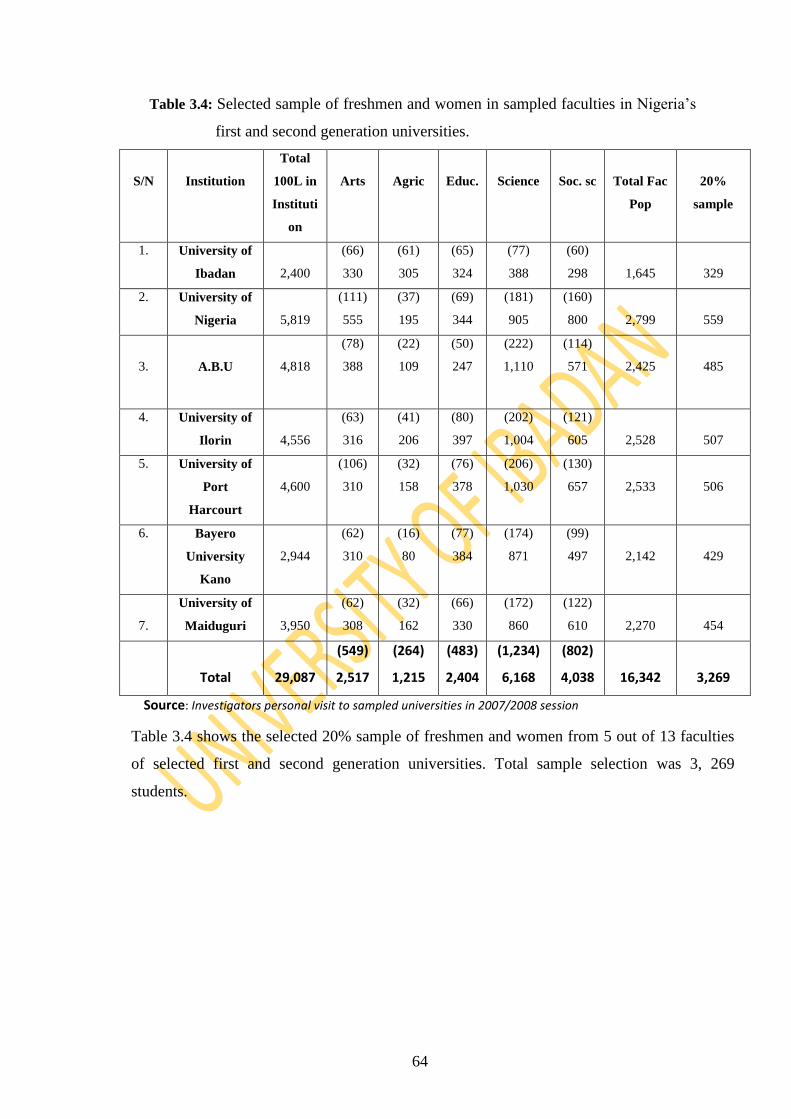
64
Table 3.4: Selected sample of freshmen and women in sampled faculties in Nigeria‟s
first and second generation universities.
S/N
Institution
Total
100L in
Instituti
on
Arts
Agric
Educ.
Science
Soc. sc
Total Fac
Pop
20%
sample
1. University of
Ibadan
2,400
(66)
330
(61)
305
(65)
324
(77)
388
(60)
298
1,645
329
2. University of
Nigeria
5,819
(111)
555
(37)
195
(69)
344
(181)
905
(160)
800
2,799
559
3.
A.B.U
4,818
(78)
388
(22)
109
(50)
247
(222)
1,110
(114)
571
2,425
485
4. University of
Ilorin
4,556
(63)
316
(41)
206
(80)
397
(202)
1,004
(121)
605
2,528
507
5. University of
Port
Harcourt
4,600
(106)
310
(32)
158
(76)
378
(206)
1,030
(130)
657
2,533
506
6. Bayero
University
Kano
2,944
(62)
310
(16)
80
(77)
384
(174)
871
(99)
497
2,142
429
7.
University of
Maiduguri
3,950
(62)
308
(32)
162
(66)
330
(172)
860
(122)
610
2,270
454
Total
29,087
(549)
2,517
(264)
1,215
(483)
2,404
(1,234)
6,168
(802)
4,038
16,342
3,269
Source: Investigators personal visit to sampled universities in 2007/2008 session
Table 3.4 shows the selected 20% sample of freshmen and women from 5 out of 13 faculties
of selected first and second generation universities. Total sample selection was 3, 269
students.
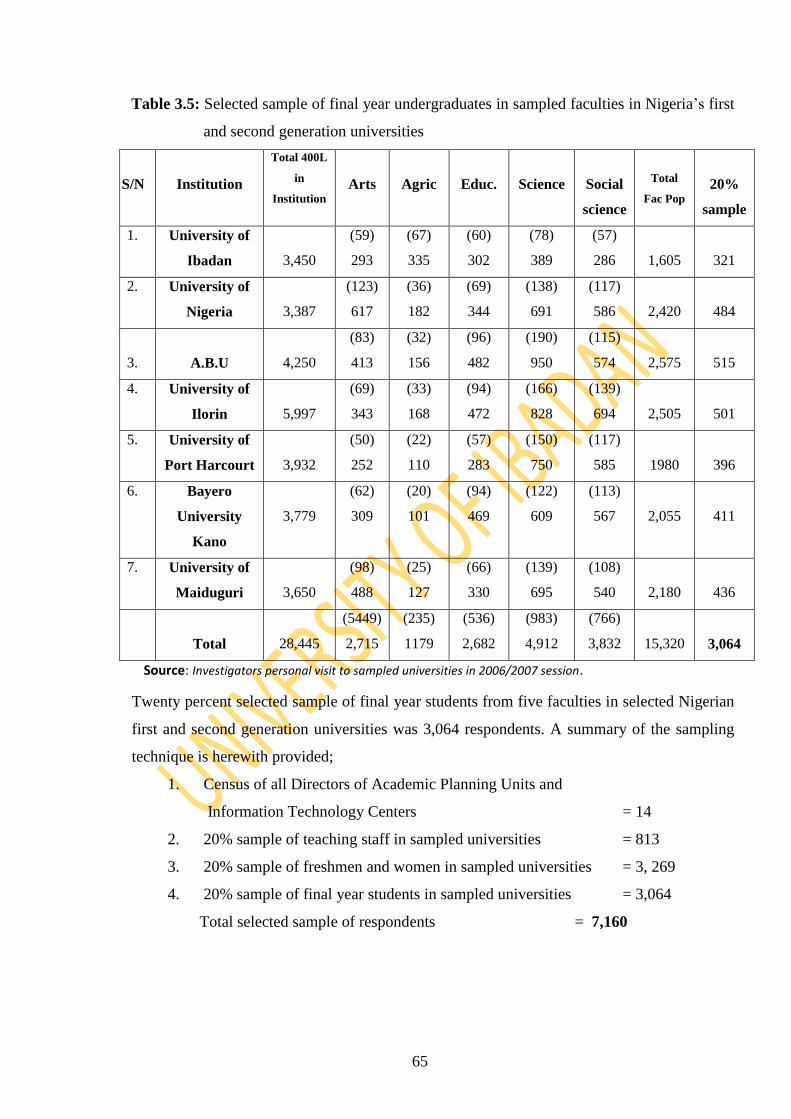
65
Table 3.5: Selected sample of final year undergraduates in sampled faculties in Nigeria‟s first
and second generation universities
S/NS
S S/N
Institution
Total 400L
in
Institution
Arts
Agric
Educ.
Science
Social
science
Total
Fac Pop
20%
sample
1. University of
Ibadan
3,450
(59)
293
(67)
335
(60)
302
(78)
389
(57)
286
1,605
321
2. University of
Nigeria
3,387
(123)
617
(36)
182
(69)
344
(138)
691
(117)
586
2,420
484
3.
A.B.U
4,250
(83)
413
(32)
156
(96)
482
(190)
950
(115)
574
2,575
515
4. University of
Ilorin
5,997
(69)
343
(33)
168
(94)
472
(166)
828
(139)
694
2,505
501
5. University of
Port Harcourt
3,932
(50)
252
(22)
110
(57)
283
(150)
750
(117)
585
1980
396
6. Bayero
University
Kano
3,779
(62)
309
(20)
101
(94)
469
(122)
609
(113)
567
2,055
411
7. University of
Maiduguri
3,650
(98)
488
(25)
127
(66)
330
(139)
695
(108)
540
2,180
436
Total
28,445
(5449)
2,715
(235)
1179
(536)
2,682
(983)
4,912
(766)
3,832
15,320
3,064
Source: Investigators personal visit to sampled universities in 2006/2007 session.
Twenty percent selected sample of final year students from five faculties in selected Nigerian
first and second generation universities was 3,064 respondents. A summary of the sampling
technique is herewith provided;
1. Census of all Directors of Academic Planning Units and
Information Technology Centers = 14
2. 20% sample of teaching staff in sampled universities = 813
3. 20% sample of freshmen and women in sampled universities = 3, 269
4. 20% sample of final year students in sampled universities = 3,064
Total selected sample of respondents = 7,160
66
3.4 Research Instruments
Four research instrument and a checklist was used for data collection. These
were the Nigerian Universities Information and Academic Planning Effectiveness
Questionnaire 1 - 4 (NUIAPEQ). NUIAPEQ 1 was designed to elicit responses from
Directors of Academic Planning and Information Communication Technology
Centres (ICT). NUIAIPEQ 2 was designed to elicit responses from university
teaching staff - Lecturers. NUIAPEQ 3 was designed to elicit responses from
freshmen and women in one hundred level (100L) NUIAPEQ 4 was designed to elicit
responses from final year undergraduates in the selected universities. The
questionnaires were structured into five sections, each of A, B, C D and E. Section A
elicited responses on respondent‟s personal data. Section B elicited responses on
managing of information (information generation). Section C elicited responses on
managing information (availability). Section D elicited responses on managing
information (utilisation of information) and section E elicited general information on
universities academic planning effectiveness.
Another instrument was designed to ascertain the information generation and
utilisation, availability and utilisation capacity of Nigerian universities - a checklist.
The purpose of the checklist was to ascertain the information acquisition and
preparedness of Nigerian universities for the digital age. The research instrument
NUIAPEQ 1 - 4 was structured and adapted to a scale that could measure
relationships „expost facto; The Likert scale method was adapted using the points SA
- Strongly Agree that weighed 4 points, A - Agree weighing 3points, D - Disagree,
weighing 2 points and SD - Strongly Disagree that weighed 1point.
3.5 Validity of Instrument
The research instrument was prepared to provide useful answers to the
research questions and hypotheses and to confirm their usefulness and suitability for
the purpose for which they were. Face and content validity methods were adopted.
The instruments were subjected to scrutiny by lecturers with expertise in
management information systems in the Faculty of Education and the Department of
Educational Management and the thesis supervisor. The instruments were further
subjected to face and content validity by lecturers in the Faculty of Education of the
67
University of Ado-Ekiti in Ekiti State. Suggestions and comments were used to
improve on the instrument before the final version was arrived at. The instrument
thereafter was subjected to factor analysis, to determine both quality and suitability.
NUEAPEQ 1 was reduced from 26 items to 15 while NUEAPEQ 2 was reduced from
76 items to 70. NUEAPEQ 3 was reduced from 16 items to 9 and NUEAPEQ 4 was
reduced from 22 items to 20. All test items that were discovered to be conflicting
with the aim of the study were deleted specifically those whose cumulative item total
correlation fell below 0.0
3.6 Reliability of Instrument:
The reliability of an instrument measures the degree of consistency to which it
meets its objective in construction and scope. To prove this, a trial test was conducted
in similar institutions that were not part of the main study. The universities used for
the trial test were Obafemi Awolowo University (OAU), Ile-Ife and the Federal
University of Agriculture (FUNAAB) at Abeokuta. The trial test targeted the
Directors of Academic Planning Units in both institutions. The study selected fifty
lecturers each from each of the universities, then one hundred students from one
hundred level and final year students respectively from each university used for the
trial test giving a total of three hundred and four respondents.
The method adopted for instrument construction was related to literature but
not the only consideration hence, it needed to be tested for consistency on its main
variables – Management of information (information generation, information
utilisation) as independent variables while academic planning effectiveness in
universities served as the dependent variable. The trial test adopted the method of split
half for reliability analysis.
The Crombach alpha coefficient arrived at was NUAAPEQ 1 for Directors of
Academic Planning and Directors of ICT/MIS in sampled universities r - 0.803,
NUIAPEQ 2 for university lecturers, had an alpha coefficient of r - 0.602 and
NUIAPEQ 4 for final year men and women had an alpha coefficient of r - 0.76 and
NUEAPEQ 3 for new undergraduates, r - 0.83. The results indicated high reliability
that the instruments were appropriate to measure what this study designed them to
measure.
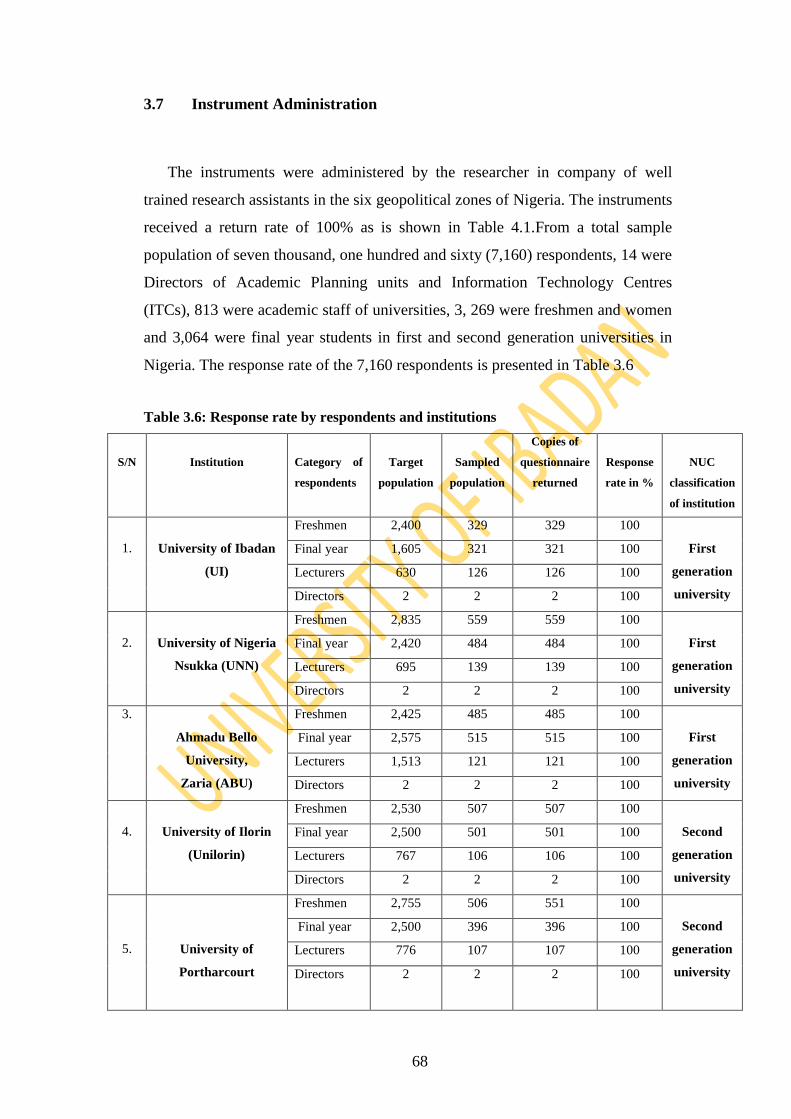
68
3.7 Instrument Administration
The instruments were administered by the researcher in company of well
trained research assistants in the six geopolitical zones of Nigeria. The instruments
received a return rate of 100% as is shown in Table 4.1.From a total sample
population of seven thousand, one hundred and sixty (7,160) respondents, 14 were
Directors of Academic Planning units and Information Technology Centres
(ITCs), 813 were academic staff of universities, 3, 269 were freshmen and women
and 3,064 were final year students in first and second generation universities in
Nigeria. The response rate of the 7,160 respondents is presented in Table 3.6
Table 3.6: Response rate by respondents and institutions
S/N
Institution
Category of
respondents
Target
population
Sampled
population
Copies of
questionnaire
returned
Response
rate in %
NUC
classification
of institution
1.
University of Ibadan
(UI)
Freshmen 2,400 329 329 100
First
generation
university
Final year 1,605 321 321 100
Lecturers 630 126 126 100
Directors 2 2 2 100
2.
University of Nigeria
Nsukka (UNN)
Freshmen 2,835 559 559 100
First
generation
university
Final year 2,420 484 484 100
Lecturers 695 139 139 100
Directors 2 2 2 100
3.
Ahmadu Bello
University,
Zaria (ABU)
Freshmen 2,425 485 485 100
First
generation
university
Final year 2,575 515 515 100
Lecturers 1,513 121 121 100
Directors 2 2 2 100
4.
University of Ilorin
(Unilorin)
Freshmen 2,530 507 507 100
Second
generation
university
Final year 2,500 501 501 100
Lecturers 767 106 106 100
Directors 2 2 2 100
5.
University of
Portharcourt
Freshmen 2,755 506 551 100
Second
generation
university
Final year 2,500 396 396 100
Lecturers 776 107 107 100
Directors 2 2 2 100
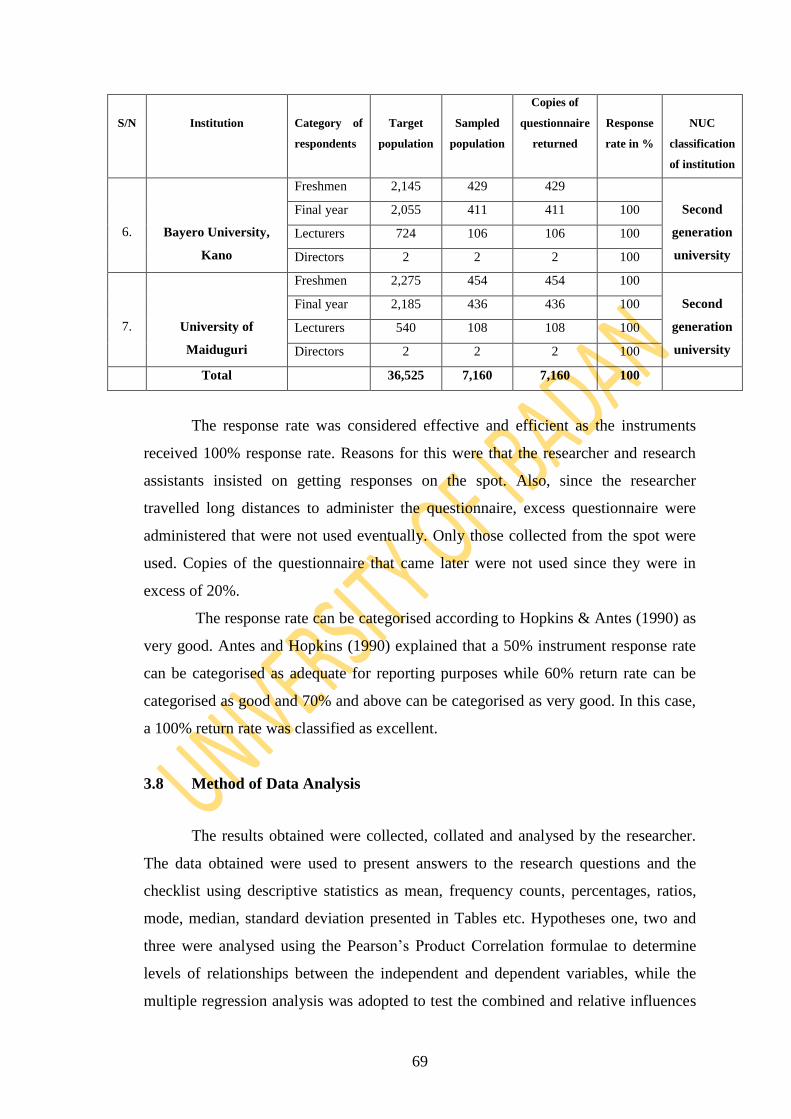
69
S/N
Institution
Category of
respondents
Target
population
Sampled
population
Copies of
questionnaire
returned
Response
rate in %
NUC
classification
of institution
6.
Bayero University,
Kano
Freshmen 2,145 429 429
Second
generation
university
Final year 2,055 411 411 100
Lecturers 724 106 106 100
Directors 2 2 2 100
7.
University of
Maiduguri
Freshmen 2,275 454 454 100
Second
generation
university
Final year 2,185 436 436 100
Lecturers 540 108 108 100
Directors 2 2 2 100
Total 36,525 7,160 7,160 100
The response rate was considered effective and efficient as the instruments
received 100% response rate. Reasons for this were that the researcher and research
assistants insisted on getting responses on the spot. Also, since the researcher
travelled long distances to administer the questionnaire, excess questionnaire were
administered that were not used eventually. Only those collected from the spot were
used. Copies of the questionnaire that came later were not used since they were in
excess of 20%.
The response rate can be categorised according to Hopkins & Antes (1990) as
very good. Antes and Hopkins (1990) explained that a 50% instrument response rate
can be categorised as adequate for reporting purposes while 60% return rate can be
categorised as good and 70% and above can be categorised as very good. In this case,
a 100% return rate was classified as excellent.
3.8 Method of Data Analysis
The results obtained were collected, collated and analysed by the researcher.
The data obtained were used to present answers to the research questions and the
checklist using descriptive statistics as mean, frequency counts, percentages, ratios,
mode, median, standard deviation presented in Tables etc. Hypotheses one, two and
three were analysed using the Pearson‟s Product Correlation formulae to determine
levels of relationships between the independent and dependent variables, while the
multiple regression analysis was adopted to test the combined and relative influences
70
of the independent variables on the dependent variables in hypothesis four and five.
All hypotheses were tested at p< 0.05 level of significance.
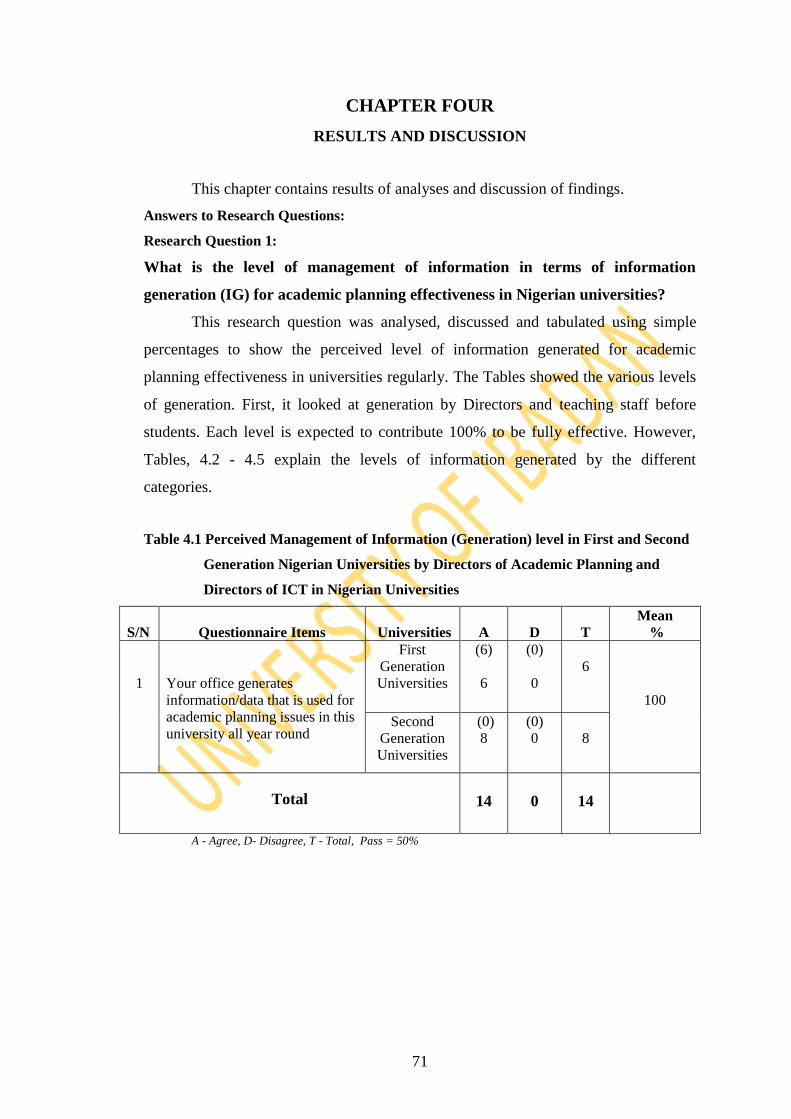
71
CHAPTER FOUR
RESULTS AND DISCUSSION
This chapter contains results of analyses and discussion of findings.
Answers to Research Questions:
Research Question 1:
What is the level of management of information in terms of information
generation (IG) for academic planning effectiveness in Nigerian universities?
This research question was analysed, discussed and tabulated using simple
percentages to show the perceived level of information generated for academic
planning effectiveness in universities regularly. The Tables showed the various levels
of generation. First, it looked at generation by Directors and teaching staff before
students. Each level is expected to contribute 100% to be fully effective. However,
Tables, 4.2 - 4.5 explain the levels of information generated by the different
categories.
Table 4.1 Perceived Management of Information (Generation) level in First and Second
Generation Nigerian Universities by Directors of Academic Planning and
Directors of ICT in Nigerian Universities
S/N
Questionnaire Items
Universities
A
D
T
Mean
%
1
Your office generates
information/data that is used for
academic planning issues in this
university all year round
First
Generation
Universities
(6)
6
(0)
0
6
100
Second
Generation
Universities
(0)
8
(0)
0
8
Total
14
0
14
A - Agree, D- Disagree, T - Total, Pass = 50%
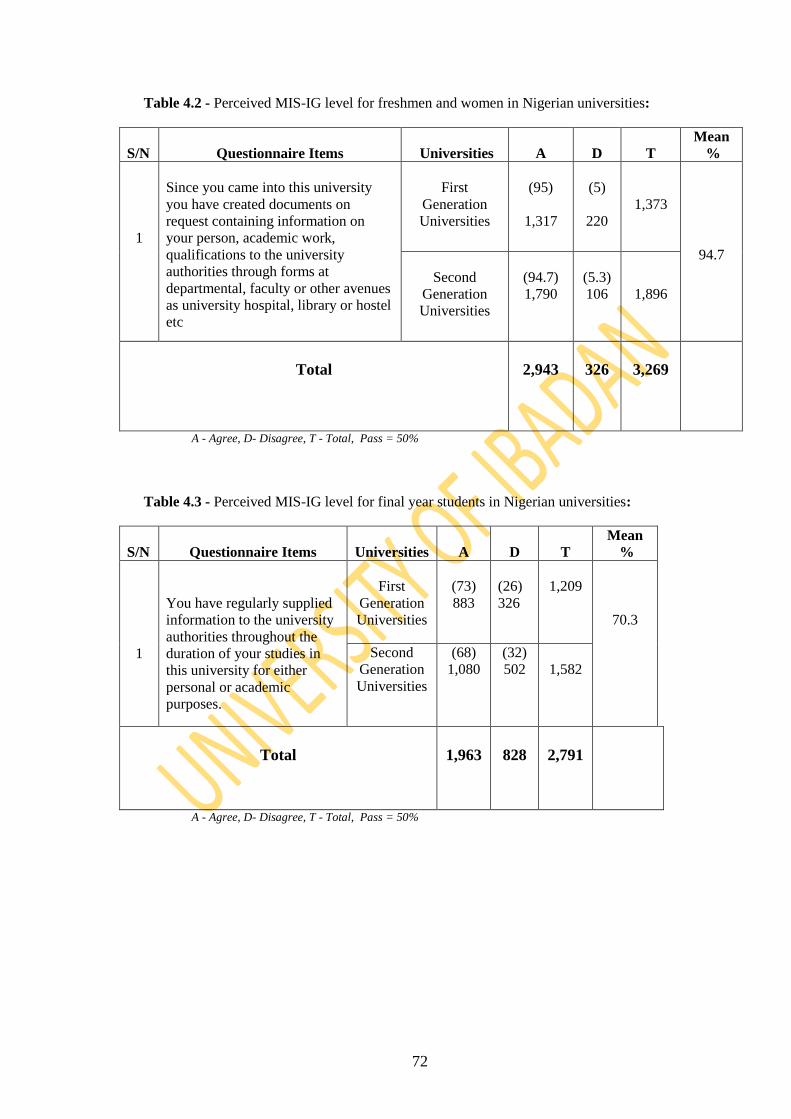
72
Table 4.2 - Perceived MIS-IG level for freshmen and women in Nigerian universities:
S/N
Questionnaire Items
Universities
A
D
T
Mean
%
1
Since you came into this university
you have created documents on
request containing information on
your person, academic work,
qualifications to the university
authorities through forms at
departmental, faculty or other avenues
as university hospital, library or hostel
etc
First
Generation
Universities
(95)
1,317
(5)
220
1,373
94.7
Second
Generation
Universities
(94.7)
1,790
(5.3)
106
1,896
Total
2,943
326
3,269
A - Agree, D- Disagree, T - Total, Pass = 50%
Table 4.3 - Perceived MIS-IG level for final year students in Nigerian universities:
S/N
Questionnaire Items
Universities
A
D
T
Mean
%
1
You have regularly supplied
information to the university
authorities throughout the
duration of your studies in
this university for either
personal or academic
purposes.
First
Generation
Universities
(73)
883
(26)
326
1,209
70.3
Second
Generation
Universities
(68)
1,080
(32)
502
1,582
Total
1,963
828
2,791
A - Agree, D- Disagree, T - Total, Pass = 50%
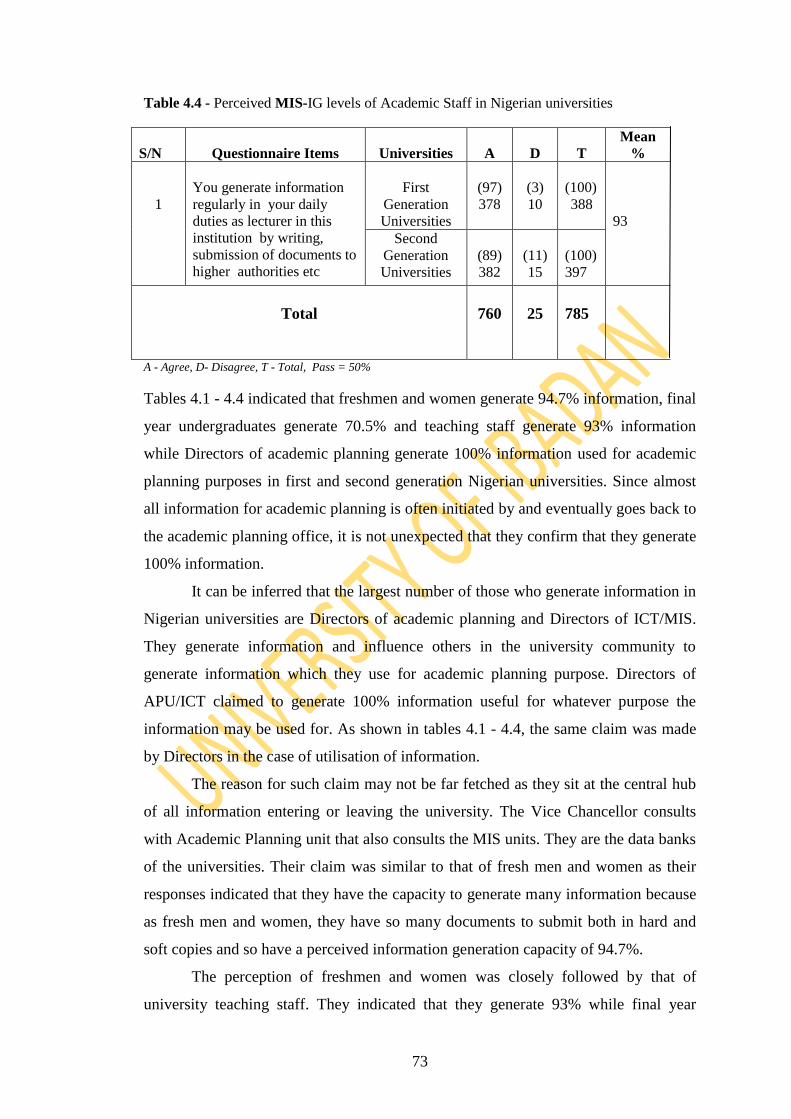
73
Table 4.4 - Perceived MIS-IG levels of Academic Staff in Nigerian universities
S/N
Questionnaire Items
Universities
A
D
T
Mean
%
1
You generate information
regularly in your daily
duties as lecturer in this
institution by writing,
submission of documents to
higher authorities etc
First
Generation
Universities
(97)
378
(3)
10
(100)
388
93
Second
Generation
Universities
(89)
382
(11)
15
(100)
397
Total
760
25
785
A - Agree, D- Disagree, T - Total, Pass = 50%
Tables 4.1 - 4.4 indicated that freshmen and women generate 94.7% information, final
year undergraduates generate 70.5% and teaching staff generate 93% information
while Directors of academic planning generate 100% information used for academic
planning purposes in first and second generation Nigerian universities. Since almost
all information for academic planning is often initiated by and eventually goes back to
the academic planning office, it is not unexpected that they confirm that they generate
100% information.
It can be inferred that the largest number of those who generate information in
Nigerian universities are Directors of academic planning and Directors of ICT/MIS.
They generate information and influence others in the university community to
generate information which they use for academic planning purpose. Directors of
APU/ICT claimed to generate 100% information useful for whatever purpose the
information may be used for. As shown in tables 4.1 - 4.4, the same claim was made
by Directors in the case of utilisation of information.
The reason for such claim may not be far fetched as they sit at the central hub
of all information entering or leaving the university. The Vice Chancellor consults
with Academic Planning unit that also consults the MIS units. They are the data banks
of the universities. Their claim was similar to that of fresh men and women as their
responses indicated that they have the capacity to generate many information because
as fresh men and women, they have so many documents to submit both in hard and
soft copies and so have a perceived information generation capacity of 94.7%.
The perception of freshmen and women was closely followed by that of
university teaching staff. They indicated that they generate 93% while final year
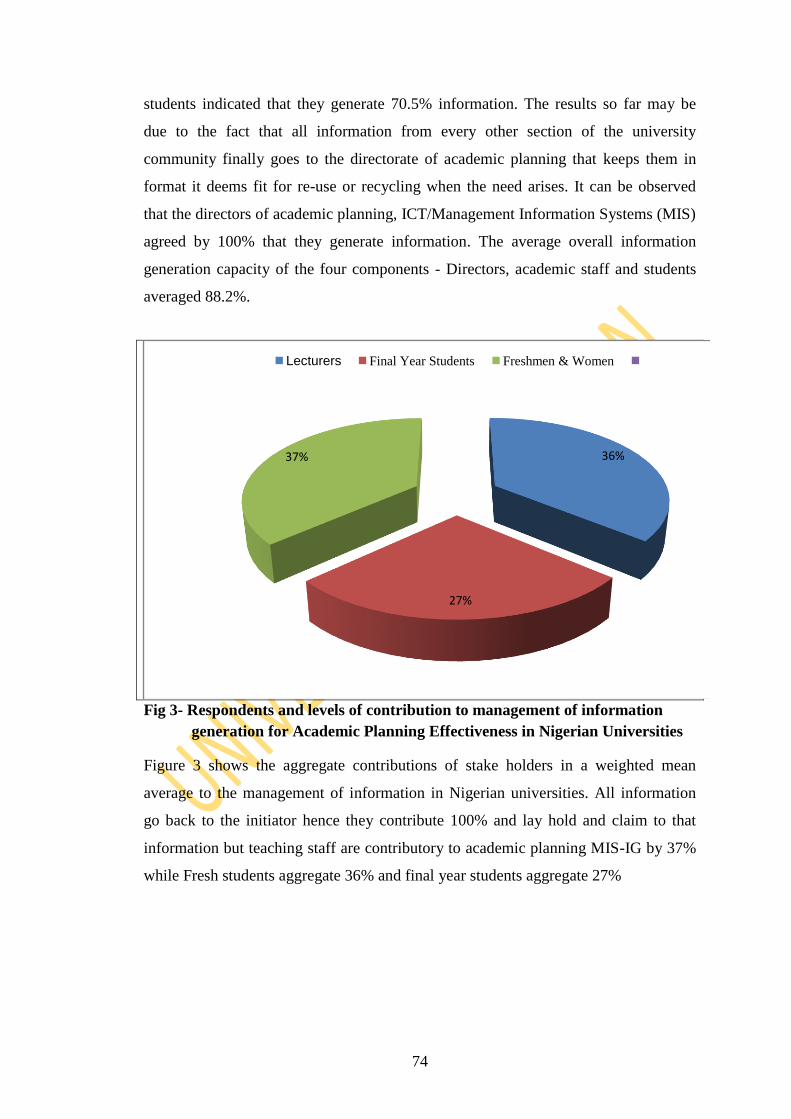
74
students indicated that they generate 70.5% information. The results so far may be
due to the fact that all information from every other section of the university
community finally goes to the directorate of academic planning that keeps them in
format it deems fit for re-use or recycling when the need arises. It can be observed
that the directors of academic planning, ICT/Management Information Systems (MIS)
agreed by 100% that they generate information. The average overall information
generation capacity of the four components - Directors, academic staff and students
averaged 88.2%.
Fig 3- Respondents and levels of contribution to management of information
generation for Academic Planning Effectiveness in Nigerian Universities
Figure 3 shows the aggregate contributions of stake holders in a weighted mean
average to the management of information in Nigerian universities. All information
go back to the initiator hence they contribute 100% and lay hold and claim to that
information but teaching staff are contributory to academic planning MIS-IG by 37%
while Fresh students aggregate 36% and final year students aggregate 27%
36%
27%
37%
Lecturers Final Year Students Freshmen & Women
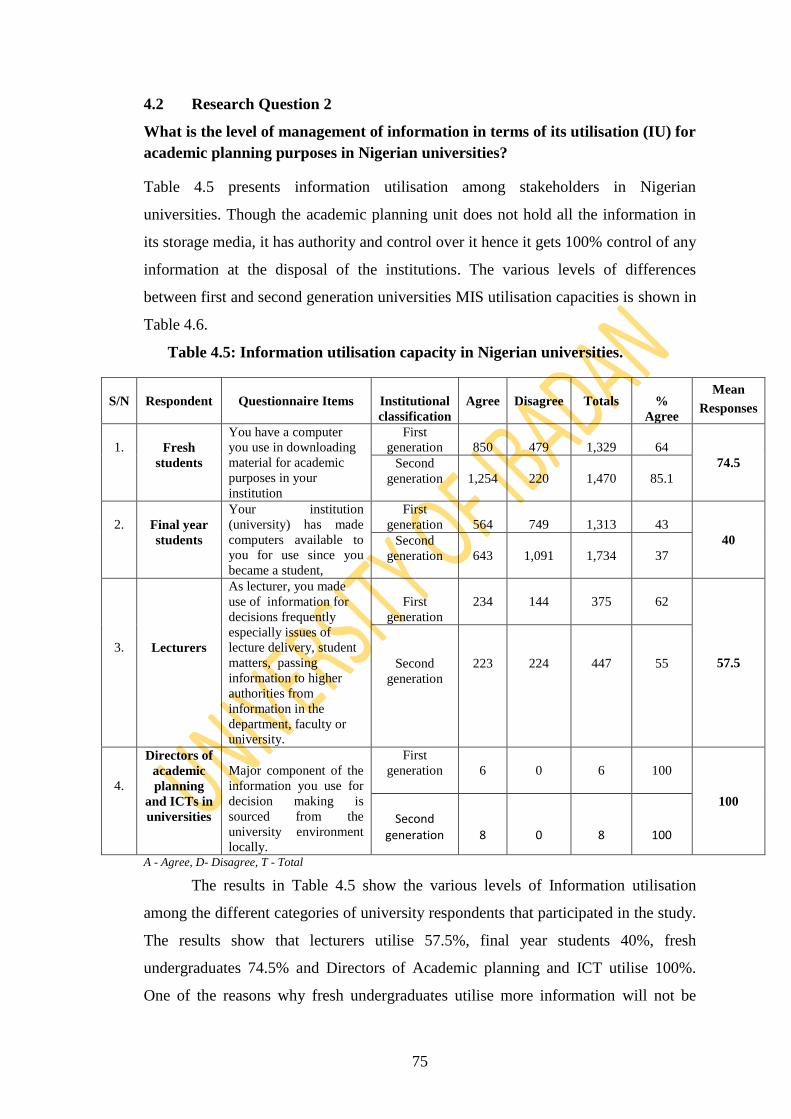
75
4.2 Research Question 2
What is the level of management of information in terms of its utilisation (IU) for
academic planning purposes in Nigerian universities?
Table 4.5 presents information utilisation among stakeholders in Nigerian
universities. Though the academic planning unit does not hold all the information in
its storage media, it has authority and control over it hence it gets 100% control of any
information at the disposal of the institutions. The various levels of differences
between first and second generation universities MIS utilisation capacities is shown in
Table 4.6.
Table 4.5: Information utilisation capacity in Nigerian universities.
S/N
Respondent
Questionnaire Items
Institutional
classification
Agree
Disagree
Totals
%
Agree
Mean
Responses
1.
Fresh
students
You have a computer
you use in downloading
material for academic
purposes in your
institution
First
generation
850
479
1,329
64
74.5 Second
generation
1,254
220
1,470
85.1
2.
Final year
students
Your institution
(university) has made
computers available to
you for use since you
became a student,
First
generation
564
749
1,313
43
40 Second
generation
643
1,091
1,734
37
3.
Lecturers
As lecturer, you made
use of information for
decisions frequently
especially issues of
lecture delivery, student
matters, passing
information to higher
authorities from
information in the
department, faculty or
university.
First
generation
234
144
375
62
57.5
Second
generation
223
224
447
55
4.
Directors of
academic
planning
and ICTs in
universities
Major component of the
information you use for
decision making is
sourced from the
university environment
locally.
First
generation
6
0
6
100
100 Second
generation
8
0
8
100
A - Agree, D- Disagree, T - Total
The results in Table 4.5 show the various levels of Information utilisation
among the different categories of university respondents that participated in the study.
The results show that lecturers utilise 57.5%, final year students 40%, fresh
undergraduates 74.5% and Directors of Academic planning and ICT utilise 100%.
One of the reasons why fresh undergraduates utilise more information will not be
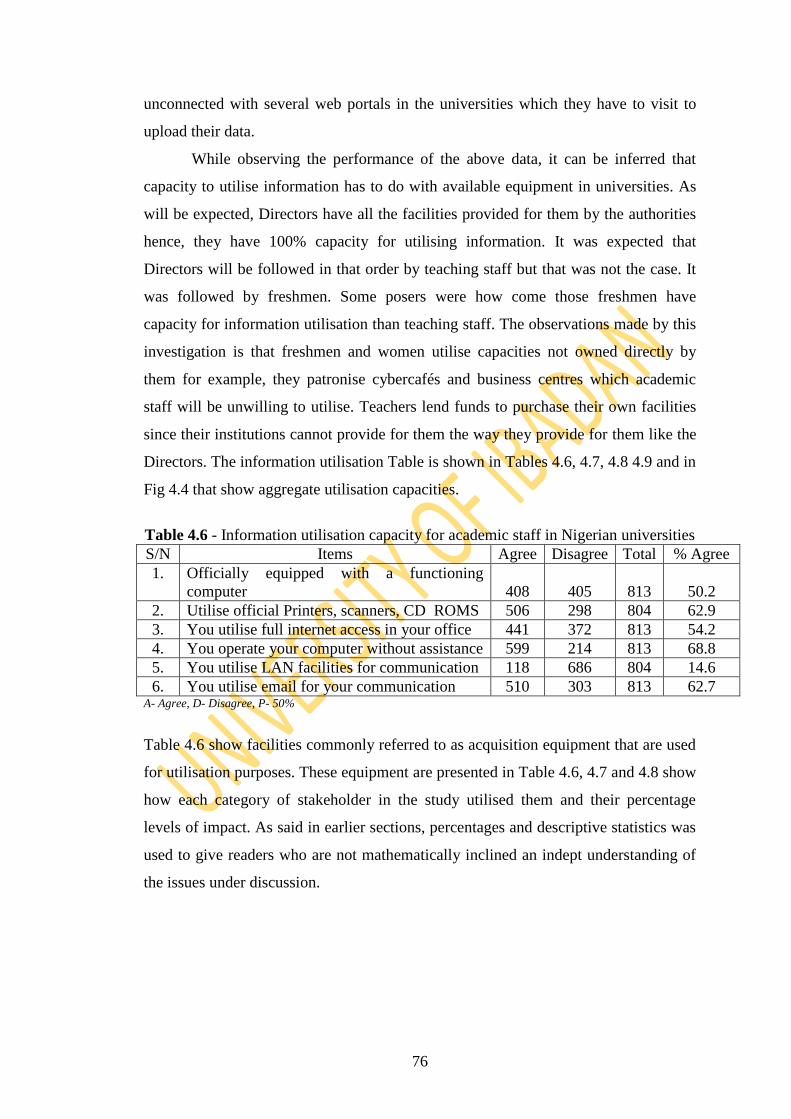
76
unconnected with several web portals in the universities which they have to visit to
upload their data.
While observing the performance of the above data, it can be inferred that
capacity to utilise information has to do with available equipment in universities. As
will be expected, Directors have all the facilities provided for them by the authorities
hence, they have 100% capacity for utilising information. It was expected that
Directors will be followed in that order by teaching staff but that was not the case. It
was followed by freshmen. Some posers were how come those freshmen have
capacity for information utilisation than teaching staff. The observations made by this
investigation is that freshmen and women utilise capacities not owned directly by
them for example, they patronise cybercafés and business centres which academic
staff will be unwilling to utilise. Teachers lend funds to purchase their own facilities
since their institutions cannot provide for them the way they provide for them like the
Directors. The information utilisation Table is shown in Tables 4.6, 4.7, 4.8 4.9 and in
Fig 4.4 that show aggregate utilisation capacities.
Table 4.6 - Information utilisation capacity for academic staff in Nigerian universities
S/N Items Agree Disagree Total % Agree
1. Officially equipped with a functioning
computer
408
405
813
50.2
2. Utilise official Printers, scanners, CD ROMS 506 298 804 62.9
3. You utilise full internet access in your office 441 372 813 54.2
4. You operate your computer without assistance 599 214 813 68.8
5. You utilise LAN facilities for communication 118 686 804 14.6
6. You utilise email for your communication 510 303 813 62.7 A- Agree, D- Disagree, P- 50%
Table 4.6 show facilities commonly referred to as acquisition equipment that are used
for utilisation purposes. These equipment are presented in Table 4.6, 4.7 and 4.8 show
how each category of stakeholder in the study utilised them and their percentage
levels of impact. As said in earlier sections, percentages and descriptive statistics was
used to give readers who are not mathematically inclined an indept understanding of
the issues under discussion.
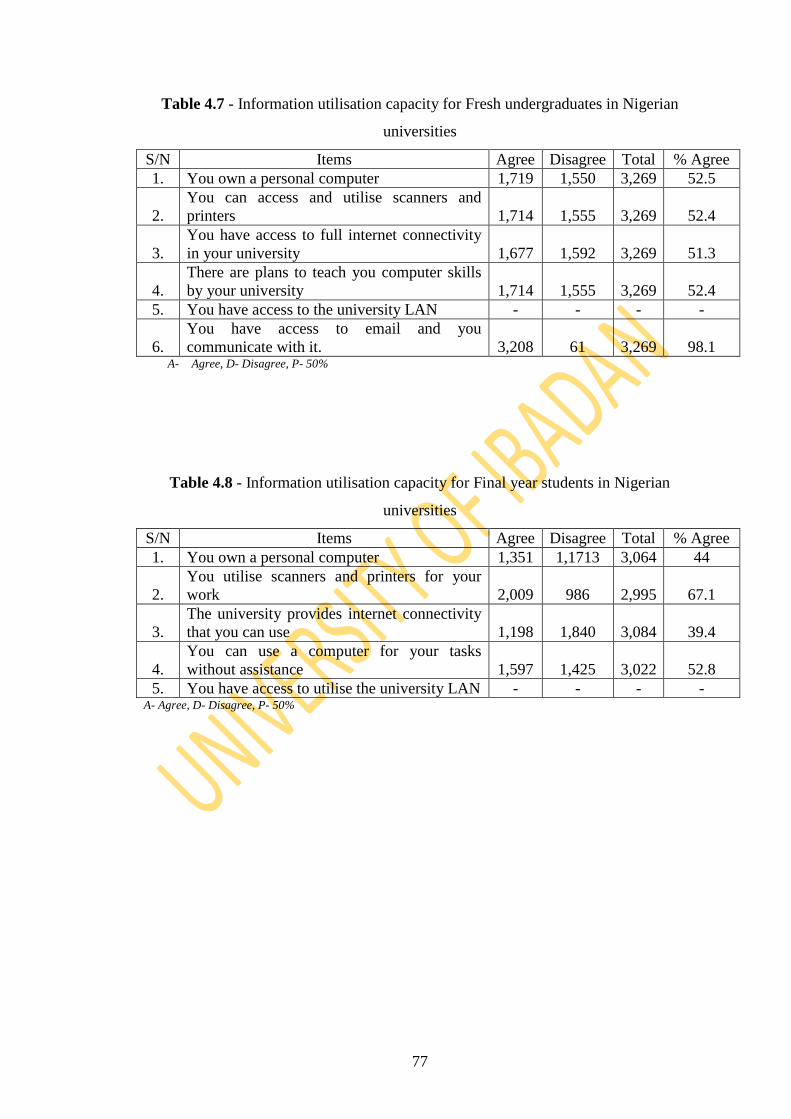
77
Table 4.7 - Information utilisation capacity for Fresh undergraduates in Nigerian
universities
S/N Items Agree Disagree Total % Agree
1. You own a personal computer 1,719 1,550 3,269 52.5
2.
You can access and utilise scanners and
printers
1,714
1,555
3,269
52.4
3.
You have access to full internet connectivity
in your university
1,677
1,592
3,269
51.3
4.
There are plans to teach you computer skills
by your university
1,714
1,555
3,269
52.4
5. You have access to the university LAN - - - -
6.
You have access to email and you
communicate with it.
3,208
61
3,269
98.1 A- Agree, D- Disagree, P- 50%
Table 4.8 - Information utilisation capacity for Final year students in Nigerian
universities
S/N Items Agree Disagree Total % Agree
1. You own a personal computer 1,351 1,1713 3,064 44
2.
You utilise scanners and printers for your
work
2,009
986
2,995
67.1
3.
The university provides internet connectivity
that you can use
1,198
1,840
3,084
39.4
4.
You can use a computer for your tasks
without assistance
1,597
1,425
3,022
52.8
5. You have access to utilise the university LAN - - - - A- Agree, D- Disagree, P- 50%
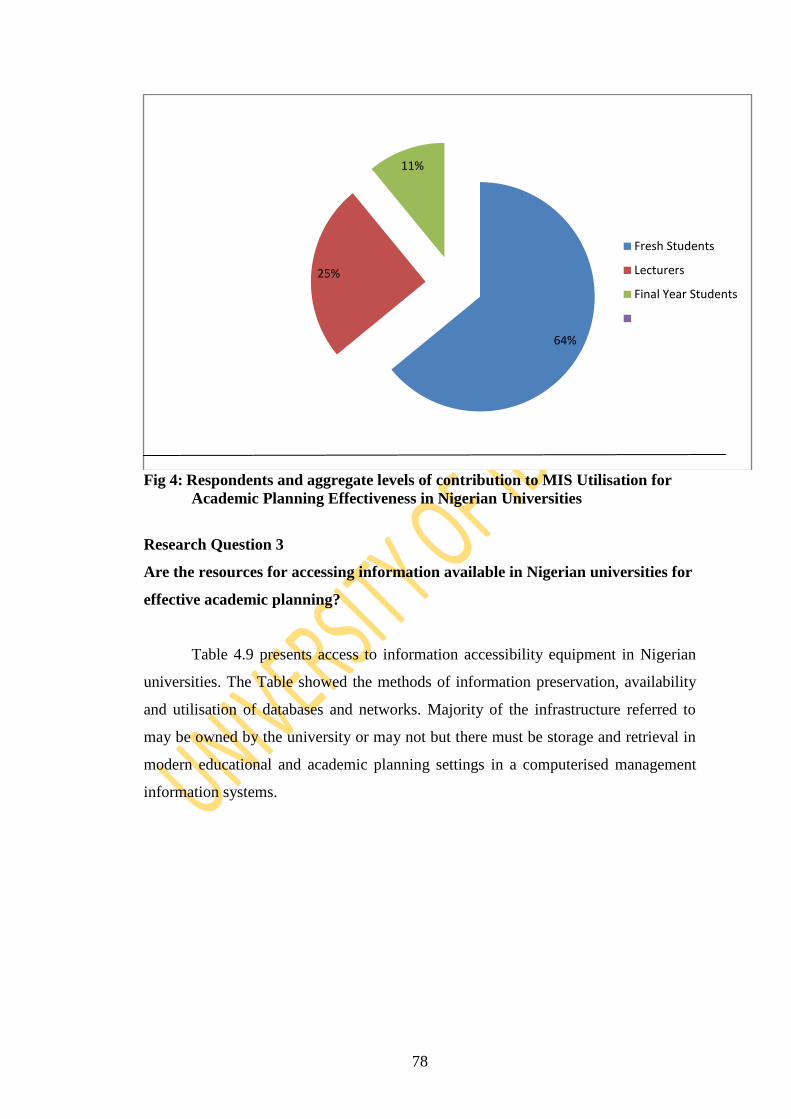
78
Fig 4: Respondents and aggregate levels of contribution to MIS Utilisation for
Academic Planning Effectiveness in Nigerian Universities
Research Question 3
Are the resources for accessing information available in Nigerian universities for
effective academic planning?
Table 4.9 presents access to information accessibility equipment in Nigerian
universities. The Table showed the methods of information preservation, availability
and utilisation of databases and networks. Majority of the infrastructure referred to
may be owned by the university or may not but there must be storage and retrieval in
modern educational and academic planning settings in a computerised management
information systems.
64%
25%
11%
Fresh Students
Lecturers
Final Year Students
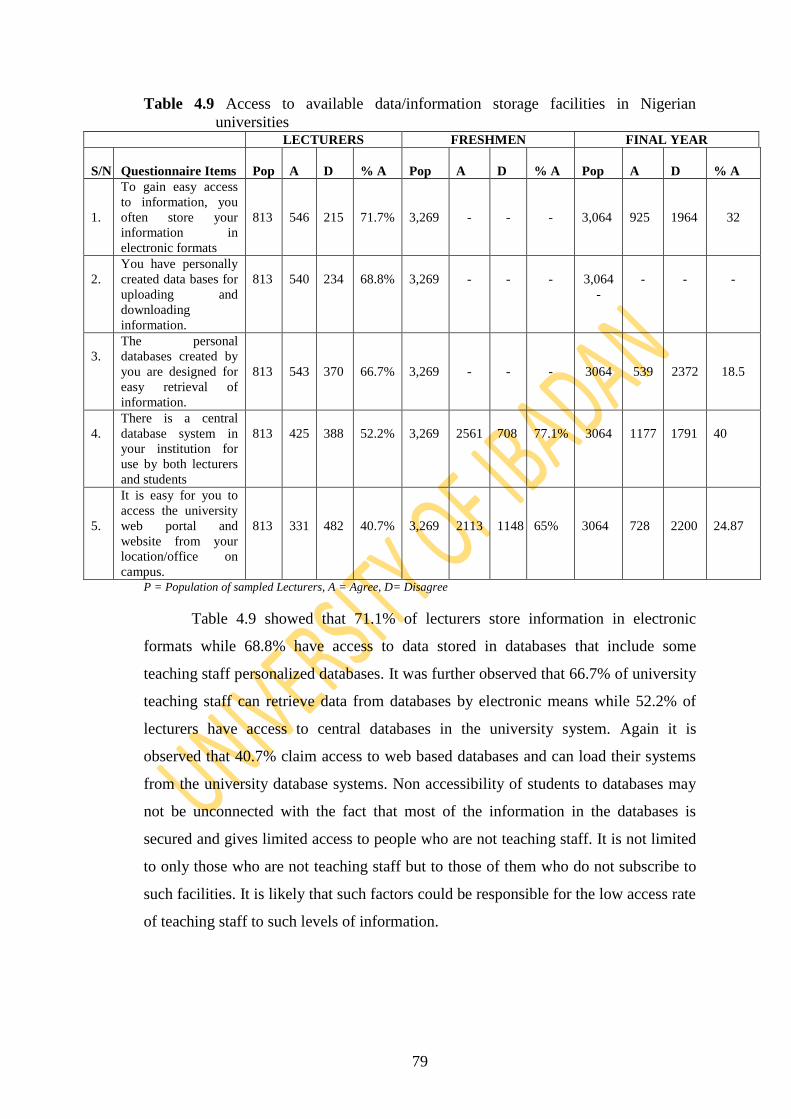
79
Table 4.9 Access to available data/information storage facilities in Nigerian
universities LECTURERS FRESHMEN FINAL YEAR
S/N
Questionnaire Items
Pop
A
D
% A
Pop
A
D
% A
Pop
A
D
% A
1.
To gain easy access
to information, you
often store your
information in
electronic formats
813
546
215
71.7%
3,269
-
-
-
3,064
925
1964
32
2.
You have personally
created data bases for
uploading and
downloading
information.
813
540
234
68.8%
3,269
-
-
-
3,064
-
-
-
-
3.
The personal
databases created by
you are designed for
easy retrieval of
information.
813
543
370
66.7%
3,269
-
-
-
3064
539
2372
18.5
4.
There is a central
database system in
your institution for
use by both lecturers
and students
813
425
388
52.2%
3,269
2561
708
77.1%
3064
1177
1791
40
5.
It is easy for you to
access the university
web portal and
website from your
location/office on
campus.
813
331
482
40.7%
3,269
2113
1148
65%
3064
728
2200
24.87
P = Population of sampled Lecturers, A = Agree, D= Disagree
Table 4.9 showed that 71.1% of lecturers store information in electronic
formats while 68.8% have access to data stored in databases that include some
teaching staff personalized databases. It was further observed that 66.7% of university
teaching staff can retrieve data from databases by electronic means while 52.2% of
lecturers have access to central databases in the university system. Again it is
observed that 40.7% claim access to web based databases and can load their systems
from the university database systems. Non accessibility of students to databases may
not be unconnected with the fact that most of the information in the databases is
secured and gives limited access to people who are not teaching staff. It is not limited
to only those who are not teaching staff but to those of them who do not subscribe to
such facilities. It is likely that such factors could be responsible for the low access rate
of teaching staff to such levels of information.
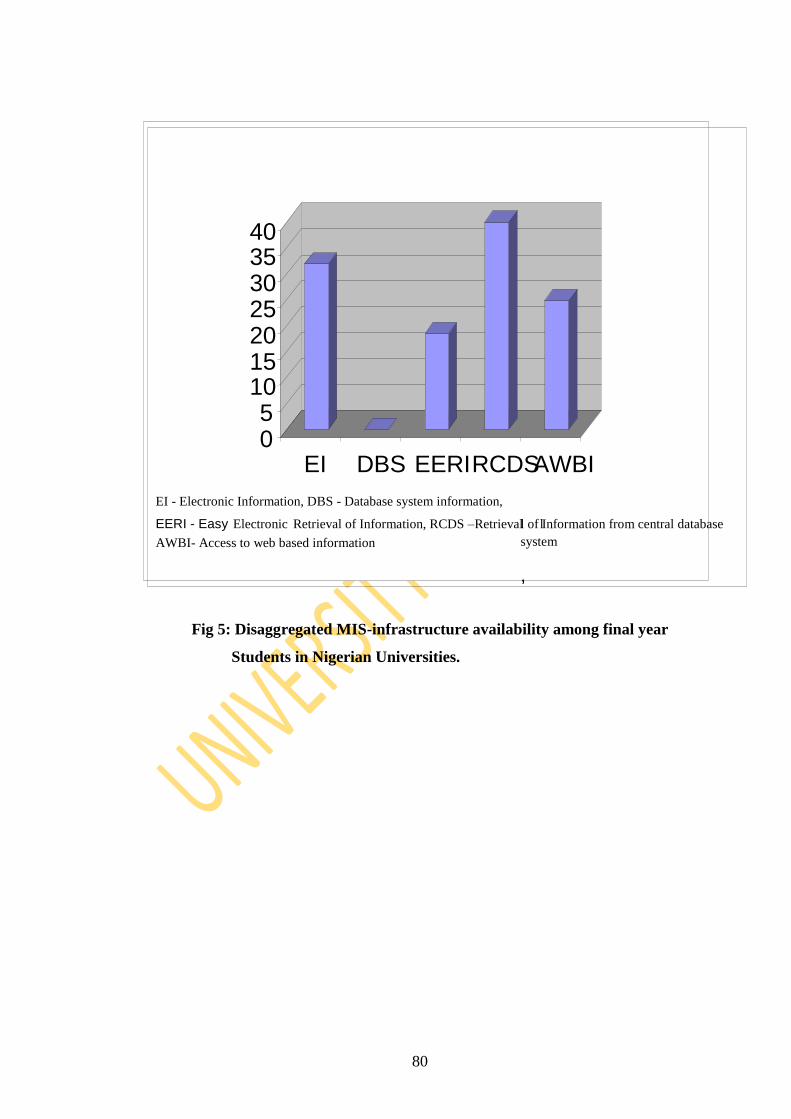
80
Fig 5: Disaggregated MIS-infrastructure availability among final year
Students in Nigerian Universities.
0
5
10
15
20
25
30
35
40
EI DBS EERI RCDS AWBI
EI - Electronic Information, DBS - Database system information,
EERI - Easy Electronic Retrieval of Information, RCDS –Retrieval l l of Information from central database
system
,
AWBI - Access to
AWBI- Access to web based information
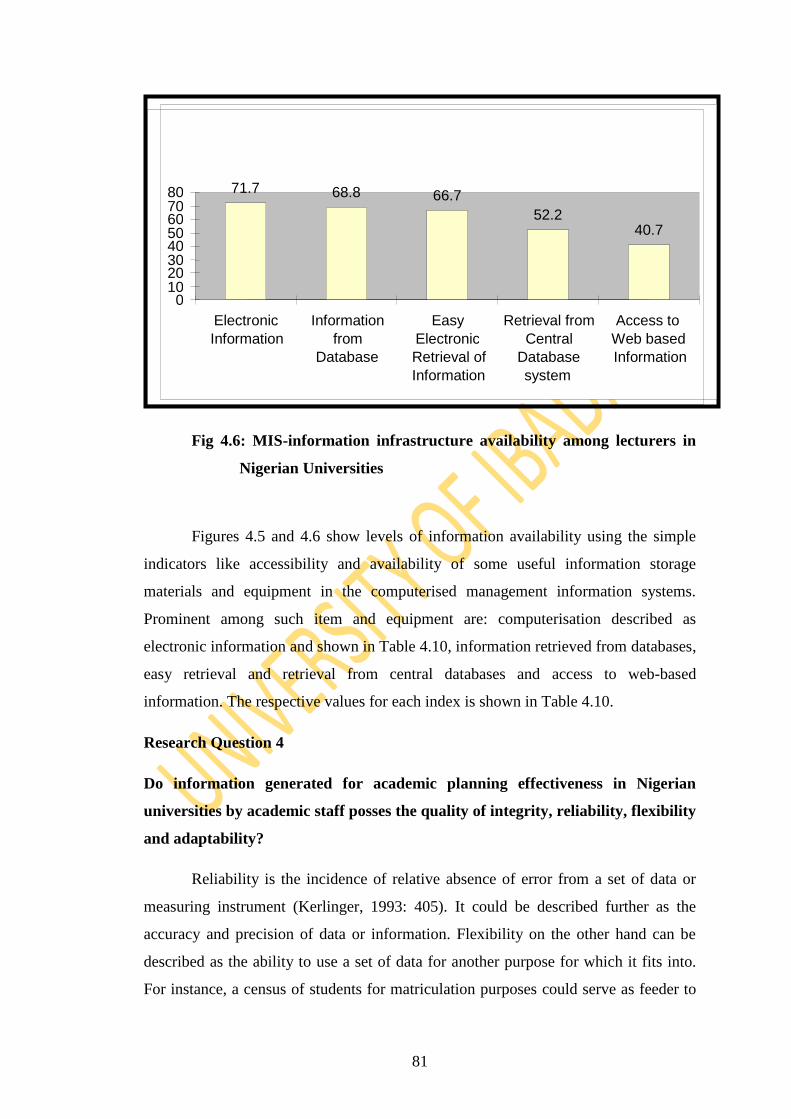
81
Fig 4.6: MIS-information infrastructure availability among lecturers in
Nigerian Universities
Figures 4.5 and 4.6 show levels of information availability using the simple
indicators like accessibility and availability of some useful information storage
materials and equipment in the computerised management information systems.
Prominent among such item and equipment are: computerisation described as
electronic information and shown in Table 4.10, information retrieved from databases,
easy retrieval and retrieval from central databases and access to web-based
information. The respective values for each index is shown in Table 4.10.
Research Question 4
Do information generated for academic planning effectiveness in Nigerian
universities by academic staff posses the quality of integrity, reliability, flexibility
and adaptability?
Reliability is the incidence of relative absence of error from a set of data or
measuring instrument (Kerlinger, 1993: 405). It could be described further as the
accuracy and precision of data or information. Flexibility on the other hand can be
described as the ability to use a set of data for another purpose for which it fits into.
For instance, a census of students for matriculation purposes could serve as feeder to
71.7 68.8 66.7
52.2 40.7
0 10 20 30 40 50 60 70 80
Electronic
Information
Information
from Database
Easy
Electronic Retrieval of
Information
Retrieval from
Central Database
system
Access to
Web based Information
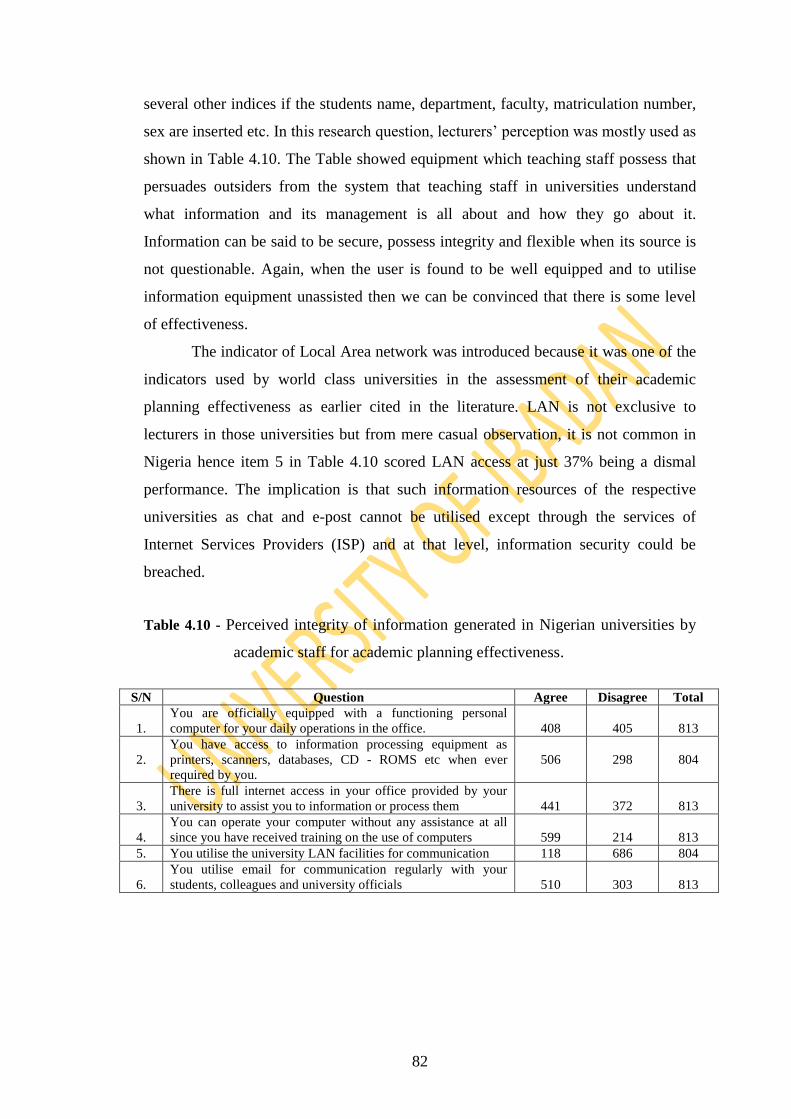
82
several other indices if the students name, department, faculty, matriculation number,
sex are inserted etc. In this research question, lecturers‟ perception was mostly used as
shown in Table 4.10. The Table showed equipment which teaching staff possess that
persuades outsiders from the system that teaching staff in universities understand
what information and its management is all about and how they go about it.
Information can be said to be secure, possess integrity and flexible when its source is
not questionable. Again, when the user is found to be well equipped and to utilise
information equipment unassisted then we can be convinced that there is some level
of effectiveness.
The indicator of Local Area network was introduced because it was one of the
indicators used by world class universities in the assessment of their academic
planning effectiveness as earlier cited in the literature. LAN is not exclusive to
lecturers in those universities but from mere casual observation, it is not common in
Nigeria hence item 5 in Table 4.10 scored LAN access at just 37% being a dismal
performance. The implication is that such information resources of the respective
universities as chat and e-post cannot be utilised except through the services of
Internet Services Providers (ISP) and at that level, information security could be
breached.
Table 4.10 - Perceived integrity of information generated in Nigerian universities by
academic staff for academic planning effectiveness.
S/N Question Agree Disagree Total
1.
You are officially equipped with a functioning personal
computer for your daily operations in the office.
408
405
813
2.
You have access to information processing equipment as
printers, scanners, databases, CD - ROMS etc when ever
required by you.
506
298
804
3.
There is full internet access in your office provided by your
university to assist you to information or process them
441
372
813
4.
You can operate your computer without any assistance at all
since you have received training on the use of computers
599
214
813
5. You utilise the university LAN facilities for communication 118 686 804
6.
You utilise email for communication regularly with your
students, colleagues and university officials
510
303
813
83
Research Question 5
Is information reception and dissemination infrastructure uniform in Nigerian
universities to positively influence academic planning effectiveness?
This research question was designed to find out the level of information
equipment that conforms to modern educational and academic planning that are
available in Nigerian universities. It is clear that all universities are not at the same
level of infrastructural developmental though the NUC is moving toward that with the
implementation of accreditations but it is obvious that it will be difficult for a third
generation university to possess the infrastructure of a first generation university.
While the possibility cannot be ruled out, the study made attempts to find out the level
of differences in qualitative terms. Results in Table 4.12 were derived from the
information extracted from the checklist, designed for Directors of Academic
Planning units and Management Information Centres in the respective universities.
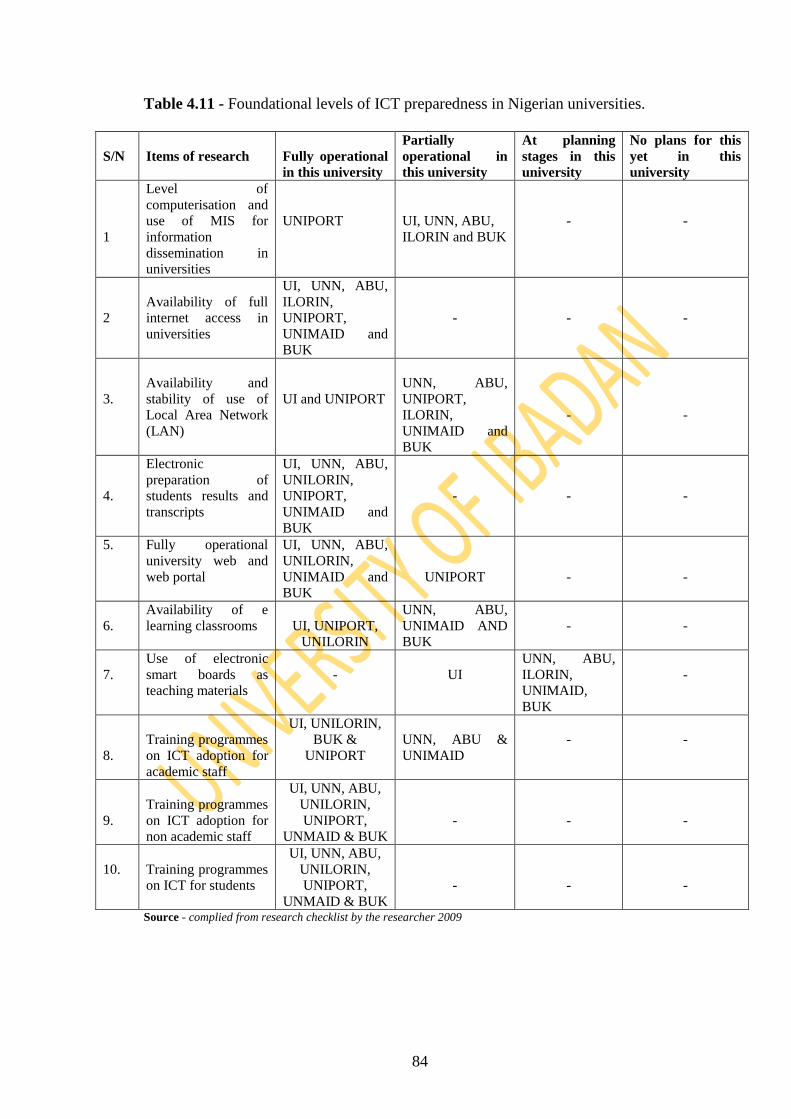
84
Table 4.11 - Foundational levels of ICT preparedness in Nigerian universities.
S/N
Items of research
Fully operational
in this university
Partially
operational in
this university
At planning
stages in this
university
No plans for this
yet in this
university
1
Level of
computerisation and
use of MIS for
information
dissemination in
universities
UNIPORT
UI, UNN, ABU,
ILORIN and BUK
-
-
2
Availability of full
internet access in
universities
UI, UNN, ABU,
ILORIN,
UNIPORT,
UNIMAID and
BUK
-
-
-
3.
Availability and
stability of use of
Local Area Network
(LAN)
UI and UNIPORT
UNN, ABU,
UNIPORT,
ILORIN,
UNIMAID and
BUK
-
-
4.
Electronic
preparation of
students results and
transcripts
UI, UNN, ABU,
UNILORIN,
UNIPORT,
UNIMAID and
BUK
-
-
-
5. Fully operational
university web and
web portal
UI, UNN, ABU,
UNILORIN,
UNIMAID and
BUK
UNIPORT
-
-
6.
Availability of e
learning classrooms
UI, UNIPORT,
UNILORIN
UNN, ABU,
UNIMAID AND
BUK
-
-
7.
Use of electronic
smart boards as
teaching materials
-
UI
UNN, ABU,
ILORIN,
UNIMAID,
BUK
-
8.
Training programmes
on ICT adoption for
academic staff
UI, UNILORIN,
BUK &
UNIPORT
UNN, ABU &
UNIMAID
-
-
9.
Training programmes
on ICT adoption for
non academic staff
UI, UNN, ABU,
UNILORIN,
UNIPORT,
UNMAID & BUK
-
-
-
10.
Training programmes
on ICT for students
UI, UNN, ABU,
UNILORIN,
UNIPORT,
UNMAID & BUK
-
-
-
Source - complied from research checklist by the researcher 2009
85
Results in Table 4.11 unveiled efforts made by universities in Nigeria at
repositioning their academic environments to electronic information dissemination
such as e - learning that could show their levels of ICT compliance for global best
practices. Such practices go a long way to prepare the institutions for academic
planning effectiveness. In the first instance, it displayed the facilities available in each
university and the status in which they operate. The responses enabled some level of
comparison. Table 4.12 showed the level of electronic infrastructural foundations for
effective information management that can aid academic planning. For example, a
facility that is not available at all cannot be upgraded or maintained while a facility or
equipment that is available stands a good chance of been upgraded and utilized by all
stakeholders.
The revelation tabulated in Table 4.11 shows at a glance, what a university is
presently doing in terms of MIS infrastructure and the level varies from one university
to another. The margin of variation among the variables chosen for the study is quite
explicit. All universities claim access to full internet access but what the research
could not explain is the efficiency of the internet in these universities. Though all the
universities claimed to have electronic preparation of students lectures, it was
observed that it was still at proposal stages those that claimed to be running it but with
time such situations will change for the better.
Research Question 6:
What are the perceived evidences of successful academic planning effectiveness
in infrastructure development among Nigerian universities in the management of
information?
This research question was designed to find out the level of infrastructure for
academic planning effectiveness in Nigerian universities. The perception of lecturers
was elicited on the subject and produced in Table 4.13 .
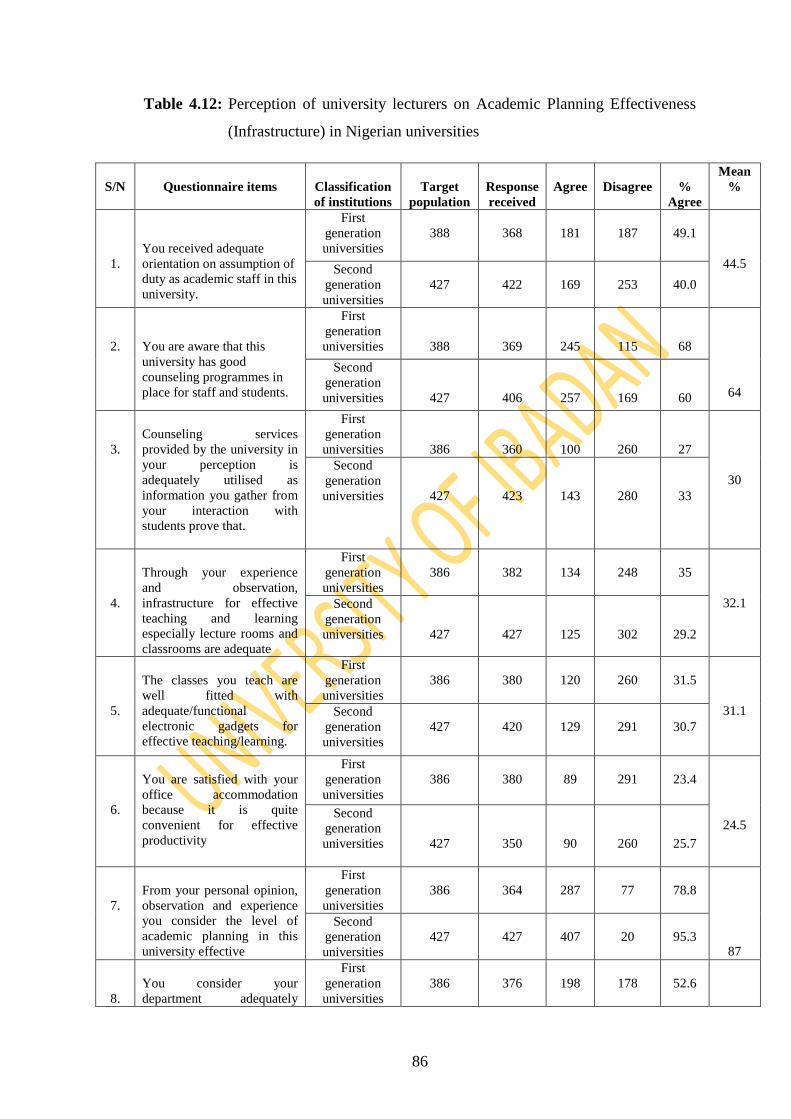
86
Table 4.12: Perception of university lecturers on Academic Planning Effectiveness
(Infrastructure) in Nigerian universities
S/N
Questionnaire items
Classification
of institutions
Target
population
Response
received
Agree
Disagree
%
Agree
Mean
%
1.
You received adequate
orientation on assumption of
duty as academic staff in this
university.
First
generation
universities
388
368
181
187
49.1
44.5 Second
generation
universities
427
422
169
253
40.0
2.
You are aware that this
university has good
counseling programmes in
place for staff and students.
First
generation
universities
388
369
245
115
68
64
Second
generation
universities
427
406
257
169
60
3.
Counseling services
provided by the university in
your perception is
adequately utilised as
information you gather from
your interaction with
students prove that.
First
generation
universities
386
360
100
260
27
30 Second
generation
universities
427
423
143
280
33
4.
Through your experience
and observation,
infrastructure for effective
teaching and learning
especially lecture rooms and
classrooms are adequate
First
generation
universities
386
382
134
248
35
32.1 Second
generation
universities
427
427
125
302
29.2
5.
The classes you teach are
well fitted with
adequate/functional
electronic gadgets for
effective teaching/learning.
First
generation
universities
386
380
120
260
31.5
31.1 Second
generation
universities
427
420
129
291
30.7
6.
You are satisfied with your
office accommodation
because it is quite
convenient for effective
productivity
First
generation
universities
386
380
89
291
23.4
24.5 Second
generation
universities
427
350
90
260
25.7
7.
From your personal opinion,
observation and experience
you consider the level of
academic planning in this
university effective
First
generation
universities
386
364
287
77
78.8
87
Second
generation
universities
427
427
407
20
95.3
8.
You consider your
department adequately
First
generation
universities
386
376
198
178
52.6
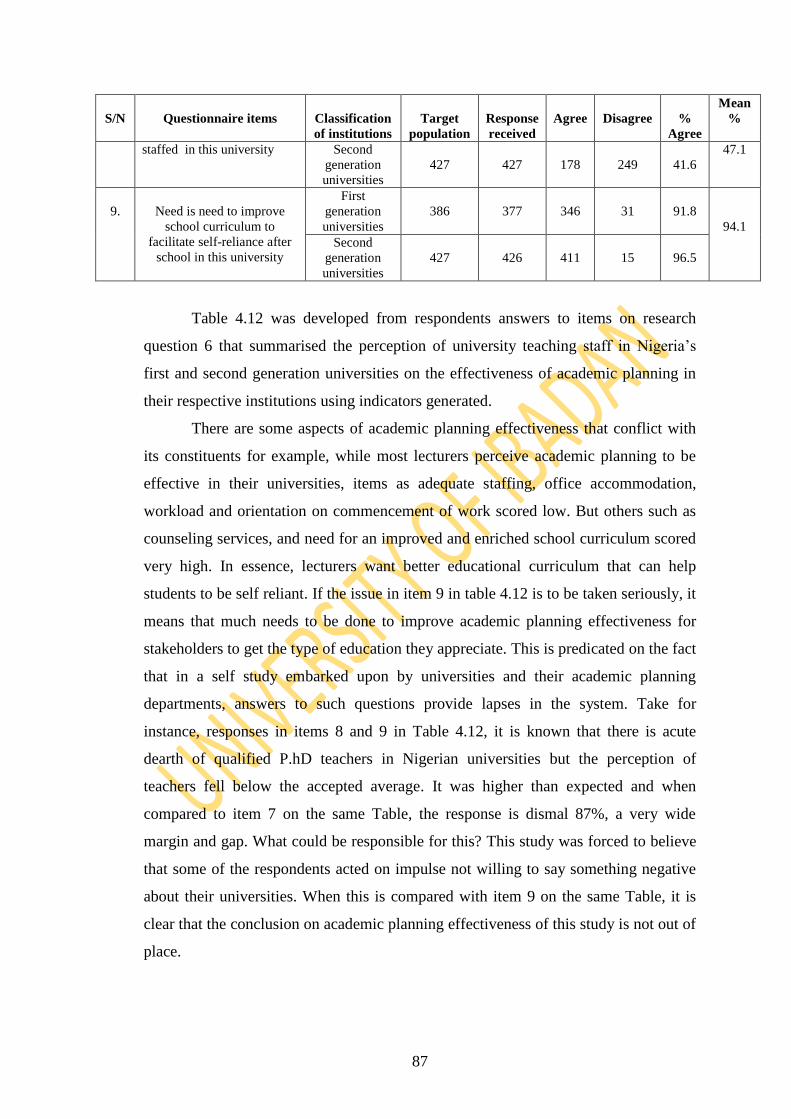
87
S/N
Questionnaire items
Classification
of institutions
Target
population
Response
received
Agree
Disagree
%
Agree
Mean
%
staffed in this university Second
generation
universities
427
427
178
249
41.6
47.1
9.
Need is need to improve
school curriculum to
facilitate self-reliance after
school in this university
First
generation
universities
386
377
346
31
91.8
94.1
Second
generation
universities
427
426
411
15
96.5
Table 4.12 was developed from respondents answers to items on research
question 6 that summarised the perception of university teaching staff in Nigeria‟s
first and second generation universities on the effectiveness of academic planning in
their respective institutions using indicators generated.
There are some aspects of academic planning effectiveness that conflict with
its constituents for example, while most lecturers perceive academic planning to be
effective in their universities, items as adequate staffing, office accommodation,
workload and orientation on commencement of work scored low. But others such as
counseling services, and need for an improved and enriched school curriculum scored
very high. In essence, lecturers want better educational curriculum that can help
students to be self reliant. If the issue in item 9 in table 4.12 is to be taken seriously, it
means that much needs to be done to improve academic planning effectiveness for
stakeholders to get the type of education they appreciate. This is predicated on the fact
that in a self study embarked upon by universities and their academic planning
departments, answers to such questions provide lapses in the system. Take for
instance, responses in items 8 and 9 in Table 4.12, it is known that there is acute
dearth of qualified P.hD teachers in Nigerian universities but the perception of
teachers fell below the accepted average. It was higher than expected and when
compared to item 7 on the same Table, the response is dismal 87%, a very wide
margin and gap. What could be responsible for this? This study was forced to believe
that some of the respondents acted on impulse not willing to say something negative
about their universities. When this is compared with item 9 on the same Table, it is
clear that the conclusion on academic planning effectiveness of this study is not out of
place.
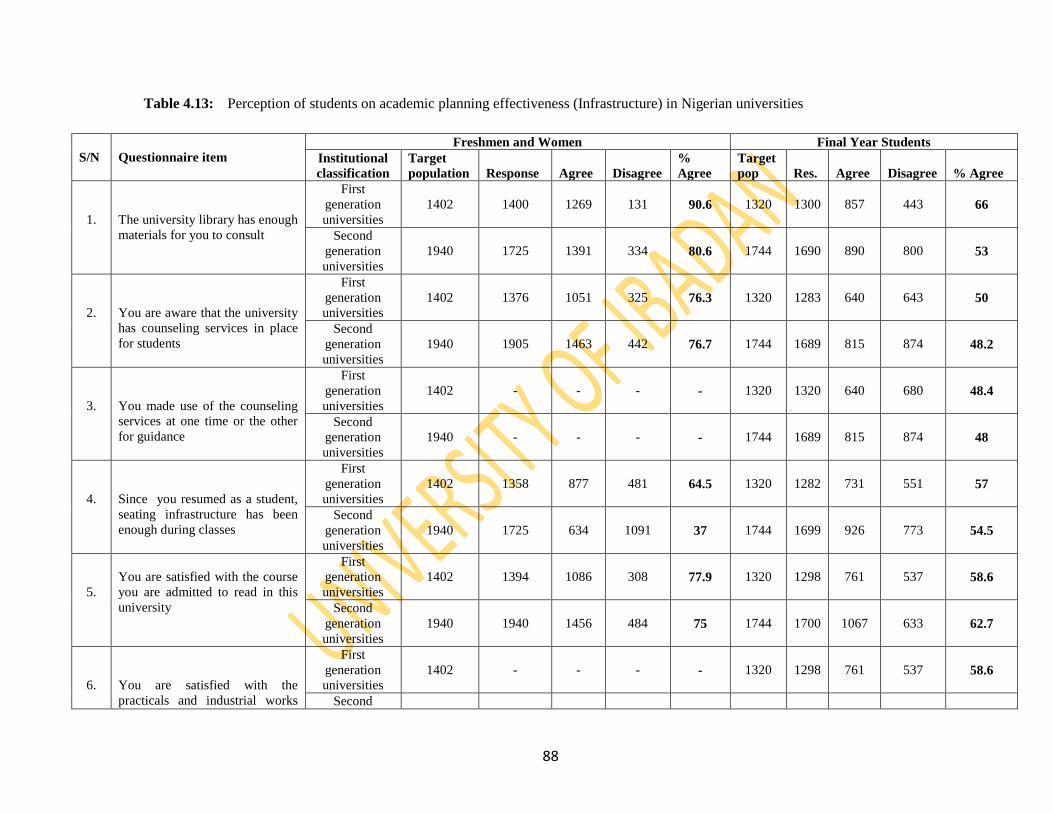
88
Table 4.13: Perception of students on academic planning effectiveness (Infrastructure) in Nigerian universities
S/N
Questionnaire item
Freshmen and Women Final Year Students
Institutional
classification
Target
population
Response
Agree
Disagree
%
Agree
Target
pop
Res.
Agree
Disagree
% Agree
1.
The university library has enough
materials for you to consult
First
generation
universities
1402
1400
1269
131
90.6
1320
1300
857
443
66
Second
generation
universities
1940
1725
1391
334
80.6
1744
1690
890
800
53
2.
You are aware that the university
has counseling services in place
for students
First
generation
universities
1402
1376
1051
325
76.3
1320
1283
640
643
50
Second
generation
universities
1940
1905
1463
442
76.7
1744
1689
815
874
48.2
3.
You made use of the counseling
services at one time or the other
for guidance
First
generation
universities
1402
-
-
-
-
1320
1320
640
680
48.4
Second
generation
universities
1940
-
-
-
-
1744
1689
815
874
48
4.
Since you resumed as a student,
seating infrastructure has been
enough during classes
First
generation
universities
1402
1358
877
481
64.5
1320
1282
731
551
57
Second
generation
universities
1940
1725
634
1091
37
1744
1699
926
773
54.5
5.
You are satisfied with the course
you are admitted to read in this
university
First
generation
universities
1402
1394
1086
308
77.9
1320
1298
761
537
58.6
Second
generation
universities
1940
1940
1456
484
75
1744
1700
1067
633
62.7
6.
You are satisfied with the
practicals and industrial works
First
generation
universities
1402
-
-
-
-
1320
1298
761
537
58.6
Second
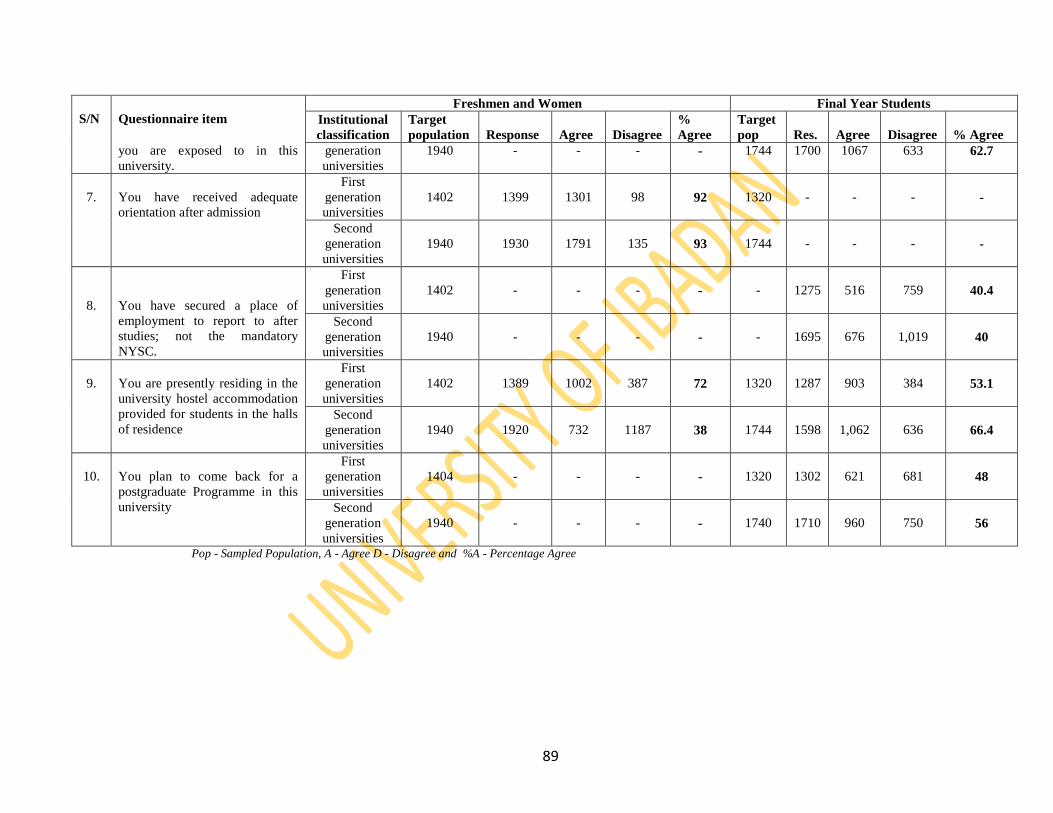
89
S/N
Questionnaire item
Freshmen and Women Final Year Students
Institutional
classification
Target
population
Response
Agree
Disagree
%
Agree
Target
pop
Res.
Agree
Disagree
% Agree
you are exposed to in this
university.
generation
universities
1940 - - - - 1744 1700 1067 633 62.7
7.
You have received adequate
orientation after admission
First
generation
universities
1402
1399
1301
98
92
1320
-
-
-
-
Second
generation
universities
1940
1930
1791
135
93
1744
-
-
-
-
8.
You have secured a place of
employment to report to after
studies; not the mandatory
NYSC.
First
generation
universities
1402
-
-
-
-
-
1275
516
759
40.4
Second
generation
universities
1940
-
-
-
-
-
1695
676
1,019
40
9.
You are presently residing in the
university hostel accommodation
provided for students in the halls
of residence
First
generation
universities
1402
1389
1002
387
72
1320
1287
903
384
53.1
Second
generation
universities
1940
1920
732
1187
38
1744
1598
1,062
636
66.4
10.
You plan to come back for a
postgraduate Programme in this
university
First
generation
universities
1404
-
-
-
-
1320
1302
621
681
48
Second
generation
universities
1940
-
-
-
-
1740
1710
960
750
56
Pop - Sampled Population, A - Agree D - Disagree and %A - Percentage Agree
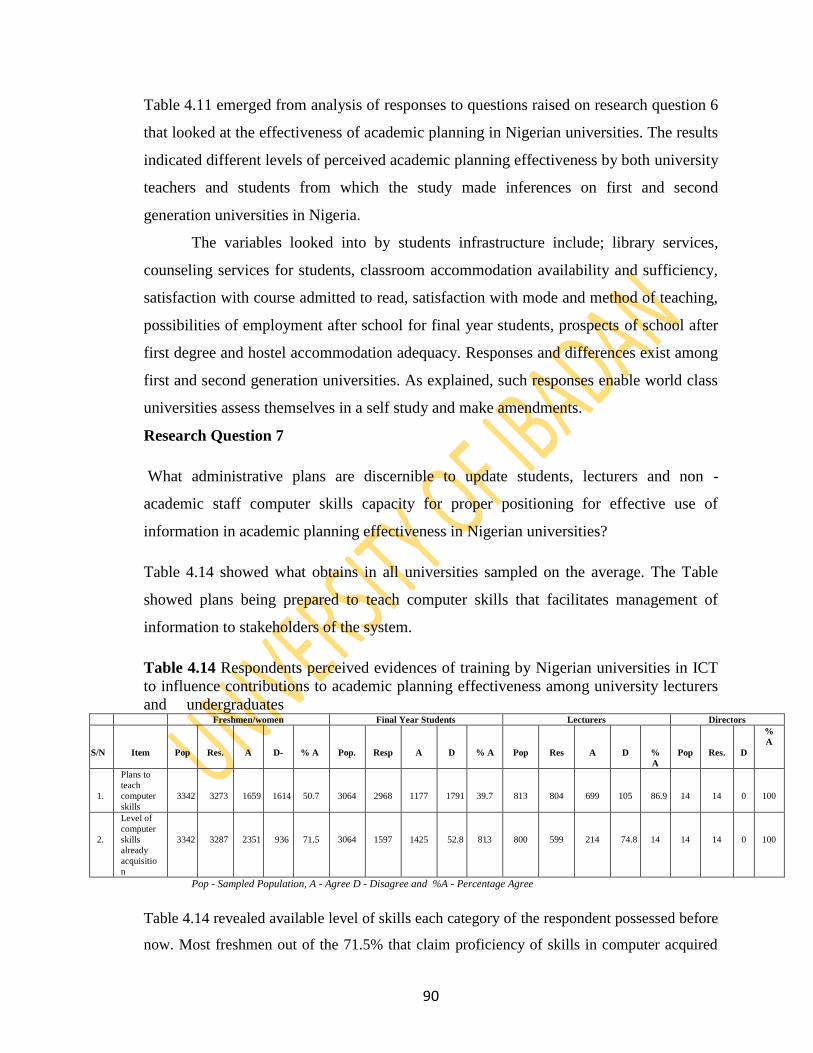
90
Table 4.11 emerged from analysis of responses to questions raised on research question 6
that looked at the effectiveness of academic planning in Nigerian universities. The results
indicated different levels of perceived academic planning effectiveness by both university
teachers and students from which the study made inferences on first and second
generation universities in Nigeria.
The variables looked into by students infrastructure include; library services,
counseling services for students, classroom accommodation availability and sufficiency,
satisfaction with course admitted to read, satisfaction with mode and method of teaching,
possibilities of employment after school for final year students, prospects of school after
first degree and hostel accommodation adequacy. Responses and differences exist among
first and second generation universities. As explained, such responses enable world class
universities assess themselves in a self study and make amendments.
Research Question 7
What administrative plans are discernible to update students, lecturers and non -
academic staff computer skills capacity for proper positioning for effective use of
information in academic planning effectiveness in Nigerian universities?
Table 4.14 showed what obtains in all universities sampled on the average. The Table
showed plans being prepared to teach computer skills that facilitates management of
information to stakeholders of the system.
Table 4.14 Respondents perceived evidences of training by Nigerian universities in ICT
to influence contributions to academic planning effectiveness among university lecturers
and undergraduates Freshmen/women Final Year Students Lecturers Directors
S/N
Item
Pop
Res.
A
D-
% A
Pop.
Resp
A
D
% A
Pop
Res
A
D
%
A
Pop
Res.
D
%
A
1.
Plans to
teach
computer
skills
3342
3273
1659
1614
50.7
3064
2968
1177
1791
39.7
813
804
699
105
86.9
14
14
0
100
2.
Level of
computer
skills
already
acquisitio
n
3342
3287
2351
936
71.5
3064
1597
1425
52.8
813
800
599
214
74.8
14
14
14
0
100
Pop - Sampled Population, A - Agree D - Disagree and %A - Percentage Agree
Table 4.14 revealed available level of skills each category of the respondent possessed before
now. Most freshmen out of the 71.5% that claim proficiency of skills in computer acquired
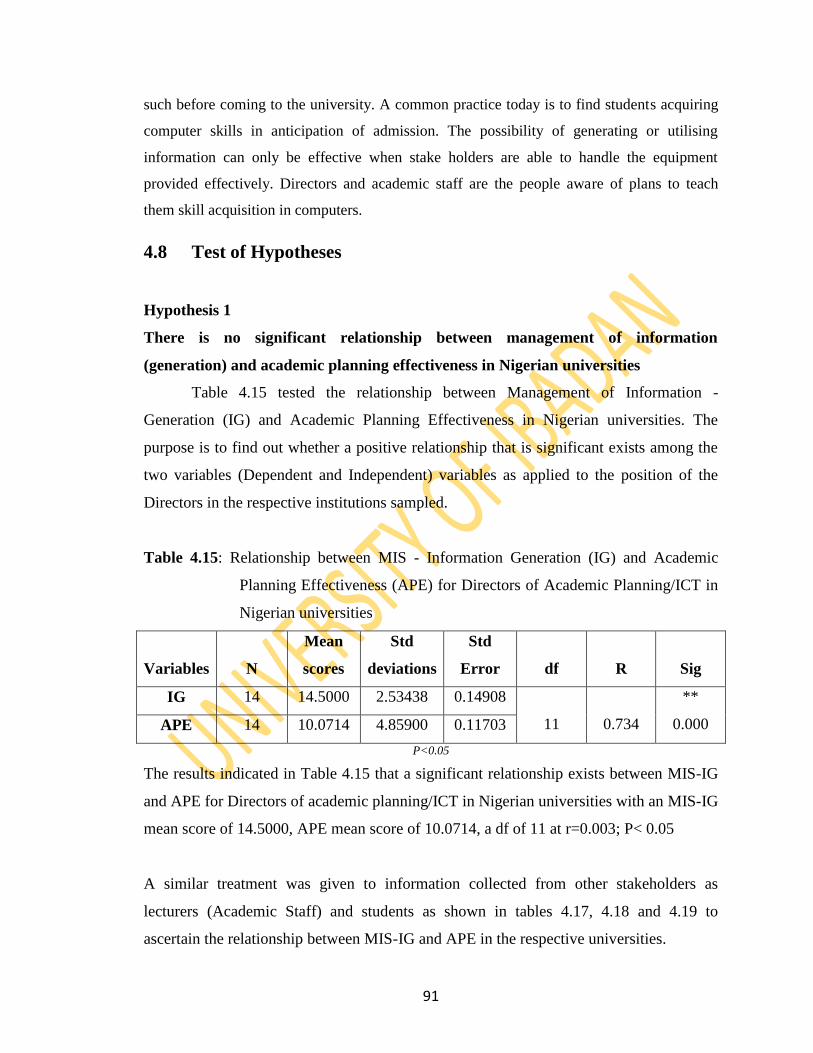
91
such before coming to the university. A common practice today is to find students acquiring
computer skills in anticipation of admission. The possibility of generating or utilising
information can only be effective when stake holders are able to handle the equipment
provided effectively. Directors and academic staff are the people aware of plans to teach
them skill acquisition in computers.
4.8 Test of Hypotheses
Hypothesis 1
There is no significant relationship between management of information
(generation) and academic planning effectiveness in Nigerian universities
Table 4.15 tested the relationship between Management of Information -
Generation (IG) and Academic Planning Effectiveness in Nigerian universities. The
purpose is to find out whether a positive relationship that is significant exists among the
two variables (Dependent and Independent) variables as applied to the position of the
Directors in the respective institutions sampled.
Table 4.15: Relationship between MIS - Information Generation (IG) and Academic
Planning Effectiveness (APE) for Directors of Academic Planning/ICT in
Nigerian universities
Variables
N
Mean
scores
Std
deviations
Std
Error
df
R
Sig
IG 14 14.5000 2.53438 0.14908
11
0.734
**
0.000 APE 14 10.0714 4.85900 0.11703
P<0.05
The results indicated in Table 4.15 that a significant relationship exists between MIS-IG
and APE for Directors of academic planning/ICT in Nigerian universities with an MIS-IG
mean score of 14.5000, APE mean score of 10.0714, a df of 11 at r=0.003; P< 0.05
A similar treatment was given to information collected from other stakeholders as
lecturers (Academic Staff) and students as shown in tables 4.17, 4.18 and 4.19 to
ascertain the relationship between MIS-IG and APE in the respective universities.
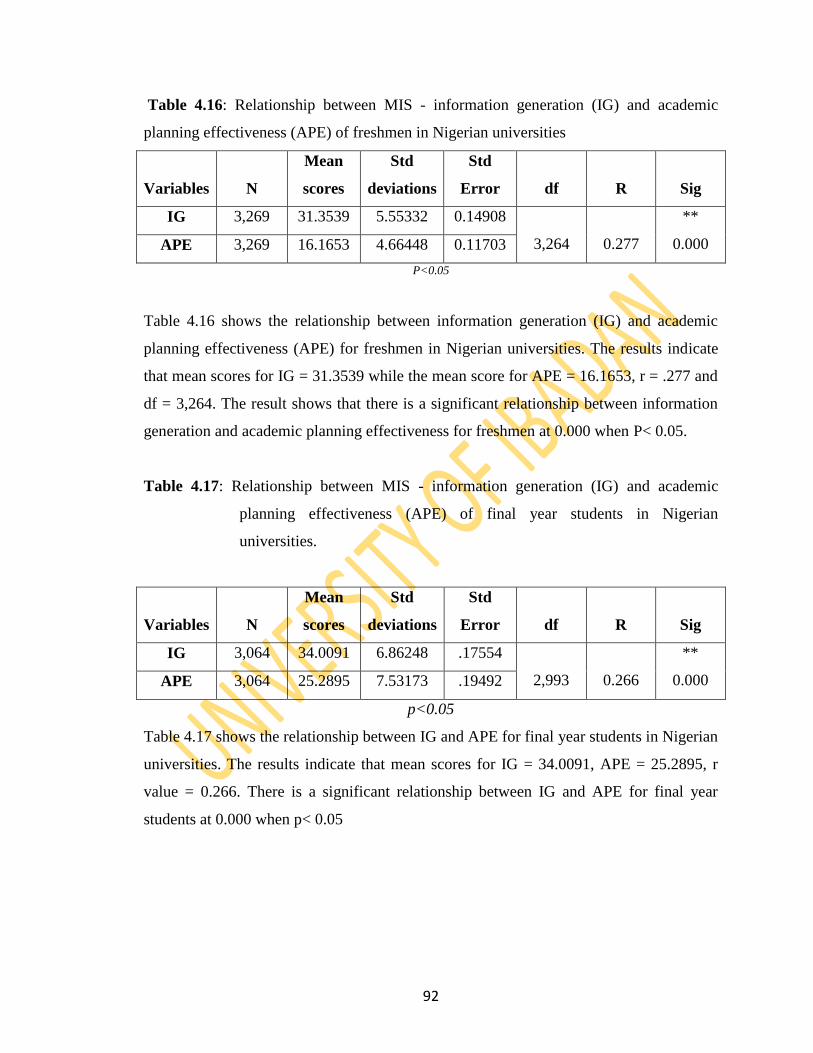
92
Table 4.16: Relationship between MIS - information generation (IG) and academic
planning effectiveness (APE) of freshmen in Nigerian universities
Variables
N
Mean
scores
Std
deviations
Std
Error
df
R
Sig
IG 3,269 31.3539 5.55332 0.14908
3,264
0.277
**
0.000 APE 3,269 16.1653 4.66448 0.11703
P<0.05
Table 4.16 shows the relationship between information generation (IG) and academic
planning effectiveness (APE) for freshmen in Nigerian universities. The results indicate
that mean scores for IG = 31.3539 while the mean score for APE = 16.1653, r = .277 and
df = 3,264. The result shows that there is a significant relationship between information
generation and academic planning effectiveness for freshmen at 0.000 when P< 0.05.
Table 4.17: Relationship between MIS - information generation (IG) and academic
planning effectiveness (APE) of final year students in Nigerian
universities.
Variables
N
Mean
scores
Std
deviations
Std
Error
df
R
Sig
IG 3,064 34.0091 6.86248 .17554
2,993
0.266
**
0.000 APE 3,064 25.2895 7.53173 .19492
p<0.05
Table 4.17 shows the relationship between IG and APE for final year students in Nigerian
universities. The results indicate that mean scores for IG = 34.0091, APE = 25.2895, r
value = 0.266. There is a significant relationship between IG and APE for final year
students at 0.000 when p< 0.05
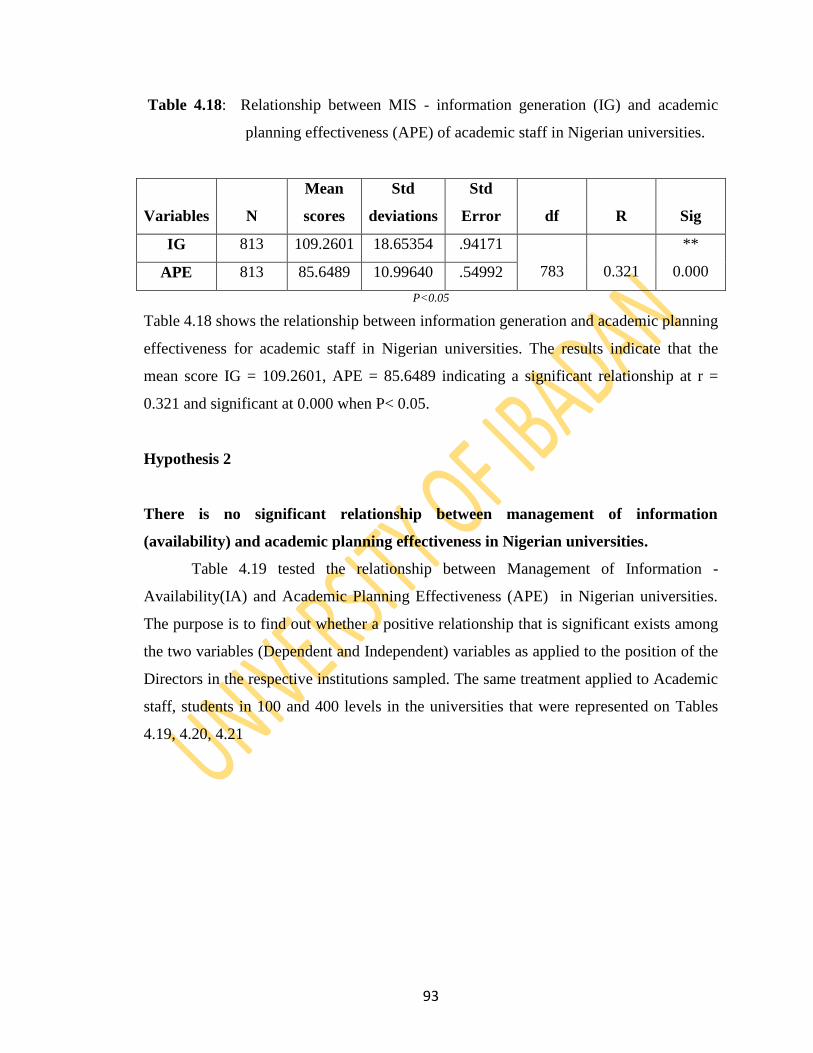
93
Table 4.18: Relationship between MIS - information generation (IG) and academic
planning effectiveness (APE) of academic staff in Nigerian universities.
Variables
N
Mean
scores
Std
deviations
Std
Error
df
R
Sig
IG 813 109.2601 18.65354 .94171
783
0.321
**
0.000 APE 813 85.6489 10.99640 .54992
P<0.05
Table 4.18 shows the relationship between information generation and academic planning
effectiveness for academic staff in Nigerian universities. The results indicate that the
mean score IG = 109.2601, APE = 85.6489 indicating a significant relationship at r =
0.321 and significant at 0.000 when P< 0.05.
Hypothesis 2
There is no significant relationship between management of information
(availability) and academic planning effectiveness in Nigerian universities.
Table 4.19 tested the relationship between Management of Information -
Availability(IA) and Academic Planning Effectiveness (APE) in Nigerian universities.
The purpose is to find out whether a positive relationship that is significant exists among
the two variables (Dependent and Independent) variables as applied to the position of the
Directors in the respective institutions sampled. The same treatment applied to Academic
staff, students in 100 and 400 levels in the universities that were represented on Tables
4.19, 4.20, 4.21
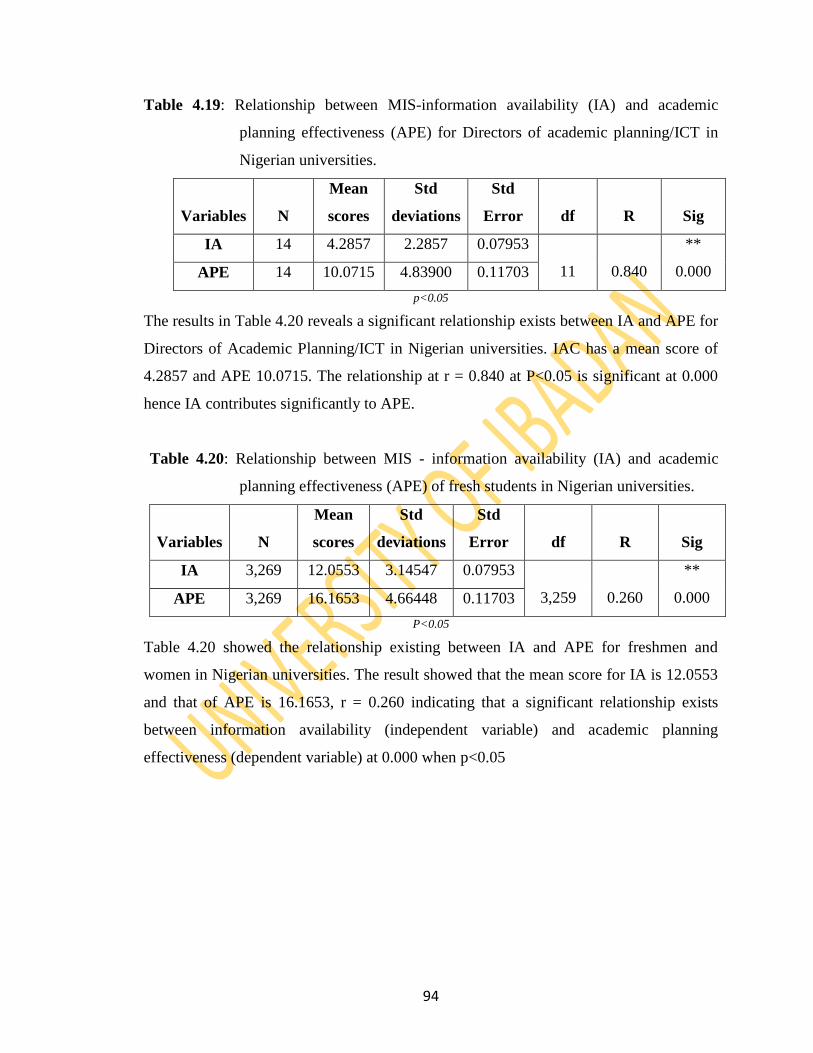
94
Table 4.19: Relationship between MIS-information availability (IA) and academic
planning effectiveness (APE) for Directors of academic planning/ICT in
Nigerian universities.
Variables
N
Mean
scores
Std
deviations
Std
Error
df
R
Sig
IA 14 4.2857 2.2857 0.07953
11
0.840
**
0.000 APE 14 10.0715 4.83900 0.11703
p<0.05
The results in Table 4.20 reveals a significant relationship exists between IA and APE for
Directors of Academic Planning/ICT in Nigerian universities. IAC has a mean score of
4.2857 and APE 10.0715. The relationship at r = 0.840 at P<0.05 is significant at 0.000
hence IA contributes significantly to APE.
Table 4.20: Relationship between MIS - information availability (IA) and academic
planning effectiveness (APE) of fresh students in Nigerian universities.
Variables
N
Mean
scores
Std
deviations
Std
Error
df
R
Sig
IA 3,269 12.0553 3.14547 0.07953
3,259
0.260
**
0.000 APE 3,269 16.1653 4.66448 0.11703
P<0.05
Table 4.20 showed the relationship existing between IA and APE for freshmen and
women in Nigerian universities. The result showed that the mean score for IA is 12.0553
and that of APE is 16.1653, r = 0.260 indicating that a significant relationship exists
between information availability (independent variable) and academic planning
effectiveness (dependent variable) at 0.000 when p<0.05
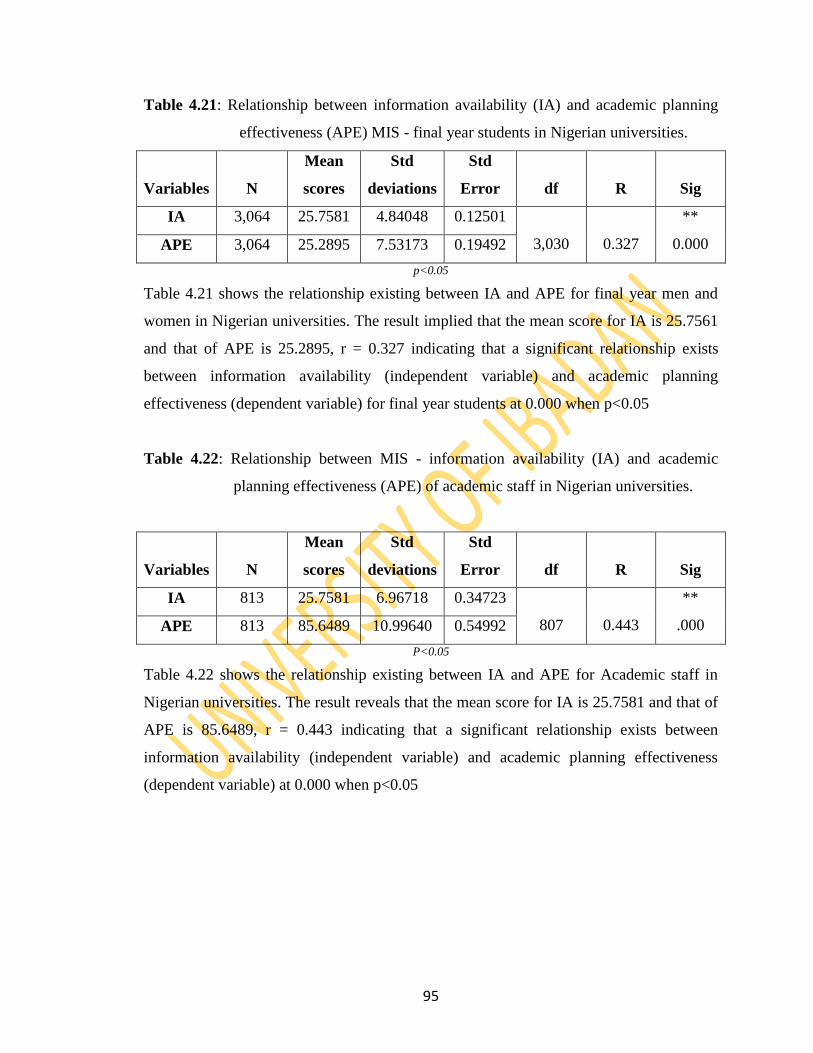
95
Table 4.21: Relationship between information availability (IA) and academic planning
effectiveness (APE) MIS - final year students in Nigerian universities.
Variables
N
Mean
scores
Std
deviations
Std
Error
df
R
Sig
IA 3,064 25.7581 4.84048 0.12501
3,030
0.327
**
0.000 APE 3,064 25.2895 7.53173 0.19492
p<0.05
Table 4.21 shows the relationship existing between IA and APE for final year men and
women in Nigerian universities. The result implied that the mean score for IA is 25.7561
and that of APE is 25.2895, r = 0.327 indicating that a significant relationship exists
between information availability (independent variable) and academic planning
effectiveness (dependent variable) for final year students at 0.000 when p<0.05
Table 4.22: Relationship between MIS - information availability (IA) and academic
planning effectiveness (APE) of academic staff in Nigerian universities.
Variables
N
Mean
scores
Std
deviations
Std
Error
df
R
Sig
IA 813 25.7581 6.96718 0.34723
807
0.443
**
.000 APE 813 85.6489 10.99640 0.54992
P<0.05
Table 4.22 shows the relationship existing between IA and APE for Academic staff in
Nigerian universities. The result reveals that the mean score for IA is 25.7581 and that of
APE is 85.6489, r = 0.443 indicating that a significant relationship exists between
information availability (independent variable) and academic planning effectiveness
(dependent variable) at 0.000 when p<0.05
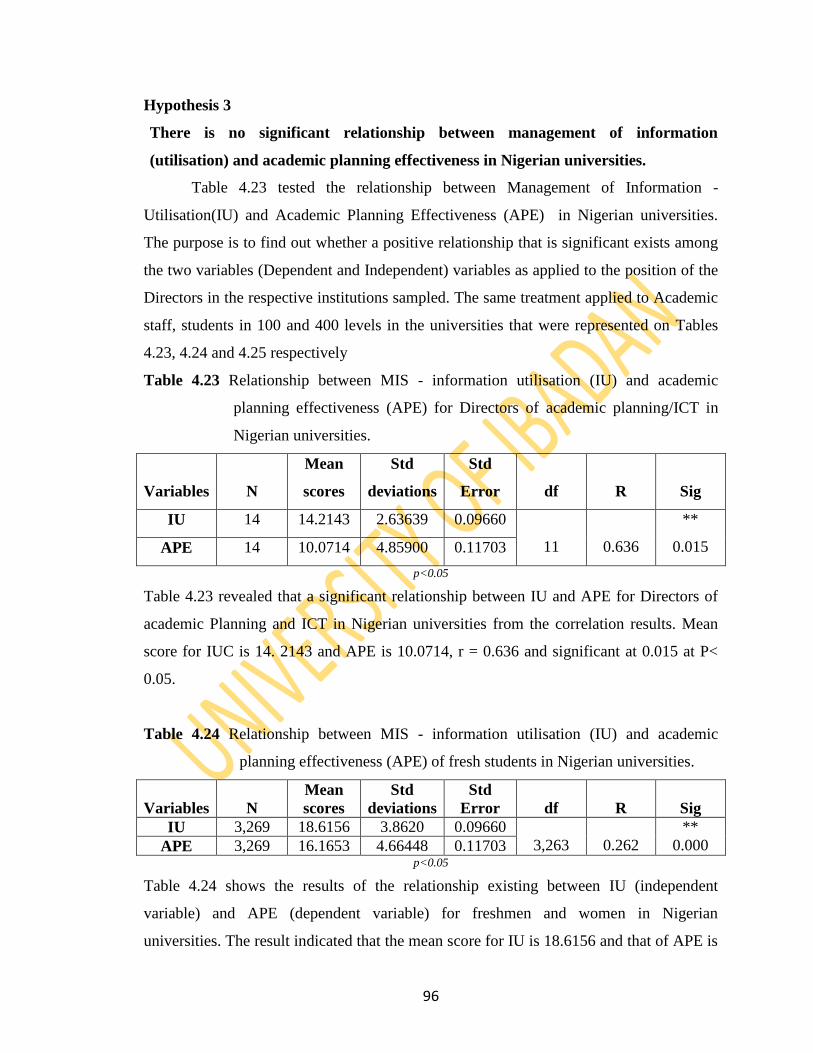
96
Hypothesis 3
There is no significant relationship between management of information
(utilisation) and academic planning effectiveness in Nigerian universities.
Table 4.23 tested the relationship between Management of Information -
Utilisation(IU) and Academic Planning Effectiveness (APE) in Nigerian universities.
The purpose is to find out whether a positive relationship that is significant exists among
the two variables (Dependent and Independent) variables as applied to the position of the
Directors in the respective institutions sampled. The same treatment applied to Academic
staff, students in 100 and 400 levels in the universities that were represented on Tables
4.23, 4.24 and 4.25 respectively
Table 4.23 Relationship between MIS - information utilisation (IU) and academic
planning effectiveness (APE) for Directors of academic planning/ICT in
Nigerian universities.
Variables
N
Mean
scores
Std
deviations
Std
Error
df
R
Sig
IU 14 14.2143 2.63639 0.09660
11
0.636
**
0.015 APE 14 10.0714 4.85900 0.11703
p<0.05
Table 4.23 revealed that a significant relationship between IU and APE for Directors of
academic Planning and ICT in Nigerian universities from the correlation results. Mean
score for IUC is 14. 2143 and APE is 10.0714, r = 0.636 and significant at 0.015 at P<
0.05.
Table 4.24 Relationship between MIS - information utilisation (IU) and academic
planning effectiveness (APE) of fresh students in Nigerian universities.
Variables
N
Mean
scores
Std
deviations
Std
Error
df
R
Sig
IU 3,269 18.6156 3.8620 0.09660
3,263
0.262
**
0.000 APE 3,269 16.1653 4.66448 0.11703 p<0.05
Table 4.24 shows the results of the relationship existing between IU (independent
variable) and APE (dependent variable) for freshmen and women in Nigerian
universities. The result indicated that the mean score for IU is 18.6156 and that of APE is
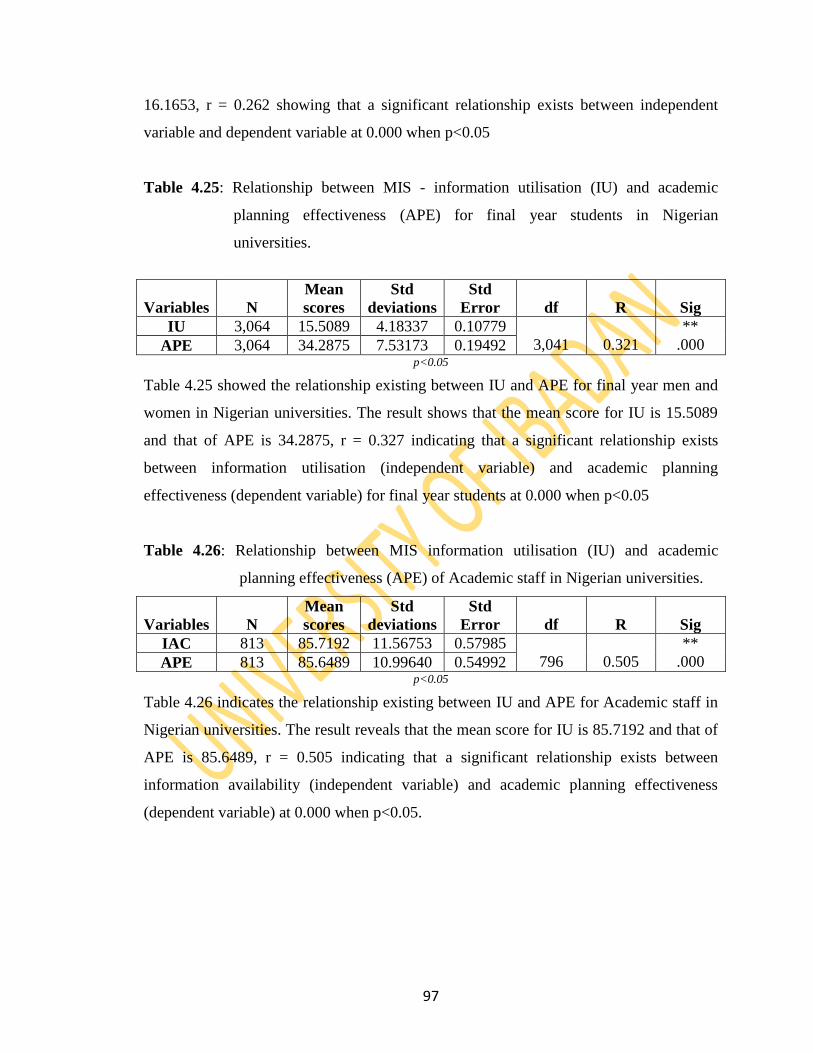
97
16.1653, r = 0.262 showing that a significant relationship exists between independent
variable and dependent variable at 0.000 when p<0.05
Table 4.25: Relationship between MIS - information utilisation (IU) and academic
planning effectiveness (APE) for final year students in Nigerian
universities.
Variables
N
Mean
scores
Std
deviations
Std
Error
df
R
Sig
IU 3,064 15.5089 4.18337 0.10779
3,041
0.321
**
.000 APE 3,064 34.2875 7.53173 0.19492 p<0.05
Table 4.25 showed the relationship existing between IU and APE for final year men and
women in Nigerian universities. The result shows that the mean score for IU is 15.5089
and that of APE is 34.2875, r = 0.327 indicating that a significant relationship exists
between information utilisation (independent variable) and academic planning
effectiveness (dependent variable) for final year students at 0.000 when p<0.05
Table 4.26: Relationship between MIS information utilisation (IU) and academic
planning effectiveness (APE) of Academic staff in Nigerian universities.
Variables
N
Mean
scores
Std
deviations
Std
Error
df
R
Sig
IAC 813 85.7192 11.56753 0.57985
796
0.505
**
.000 APE 813 85.6489 10.99640 0.54992 p<0.05
Table 4.26 indicates the relationship existing between IU and APE for Academic staff in
Nigerian universities. The result reveals that the mean score for IU is 85.7192 and that of
APE is 85.6489, r = 0.505 indicating that a significant relationship exists between
information availability (independent variable) and academic planning effectiveness
(dependent variable) at 0.000 when p<0.05.
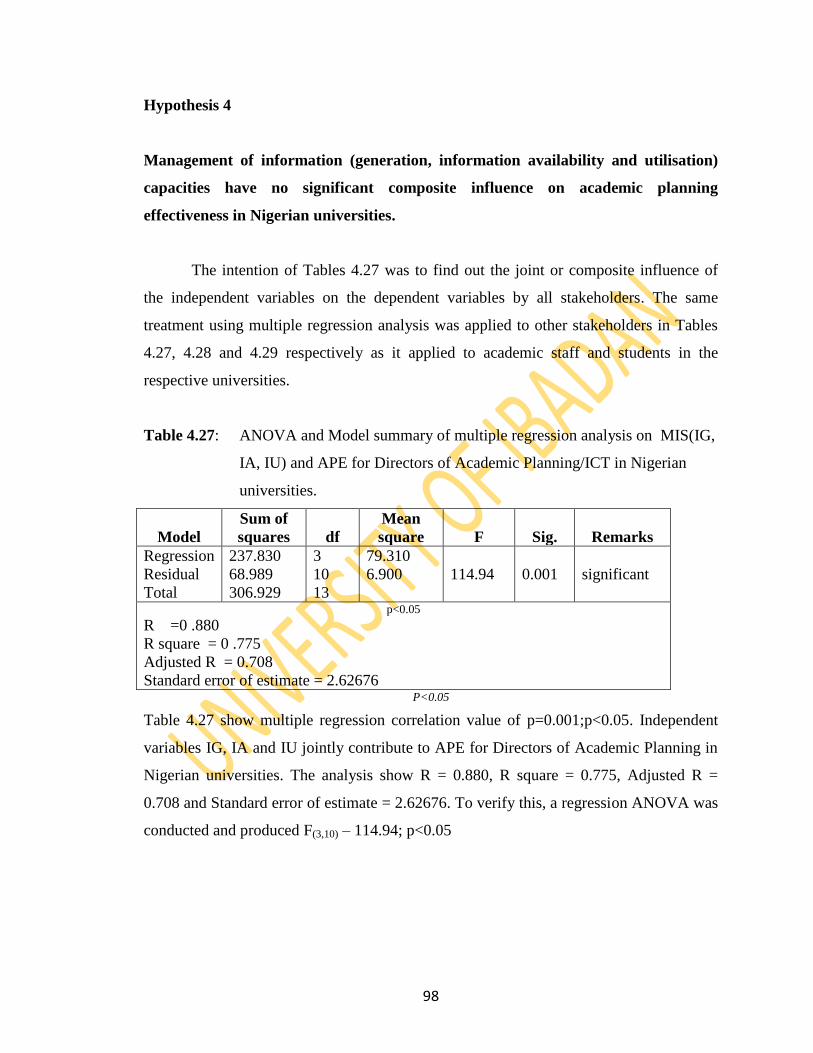
98
Hypothesis 4
Management of information (generation, information availability and utilisation)
capacities have no significant composite influence on academic planning
effectiveness in Nigerian universities.
The intention of Tables 4.27 was to find out the joint or composite influence of
the independent variables on the dependent variables by all stakeholders. The same
treatment using multiple regression analysis was applied to other stakeholders in Tables
4.27, 4.28 and 4.29 respectively as it applied to academic staff and students in the
respective universities.
Table 4.27: ANOVA and Model summary of multiple regression analysis on MIS(IG,
IA, IU) and APE for Directors of Academic Planning/ICT in Nigerian
universities.
Model
Sum of
squares
df
Mean
square
F
Sig.
Remarks
Regression
Residual
Total
237.830
68.989
306.929
3
10
13
79.310
6.900
114.94
0.001
significant
p<0.05
R =0 .880
R square = 0 .775
Adjusted R = 0.708
Standard error of estimate = 2.62676 P<0.05
Table 4.27 show multiple regression correlation value of p=0.001;p<0.05. Independent
variables IG, IA and IU jointly contribute to APE for Directors of Academic Planning in
Nigerian universities. The analysis show R = 0.880, R square = 0.775, Adjusted R =
0.708 and Standard error of estimate = 2.62676. To verify this, a regression ANOVA was
conducted and produced F(3,10) – 114.94; p<0.05
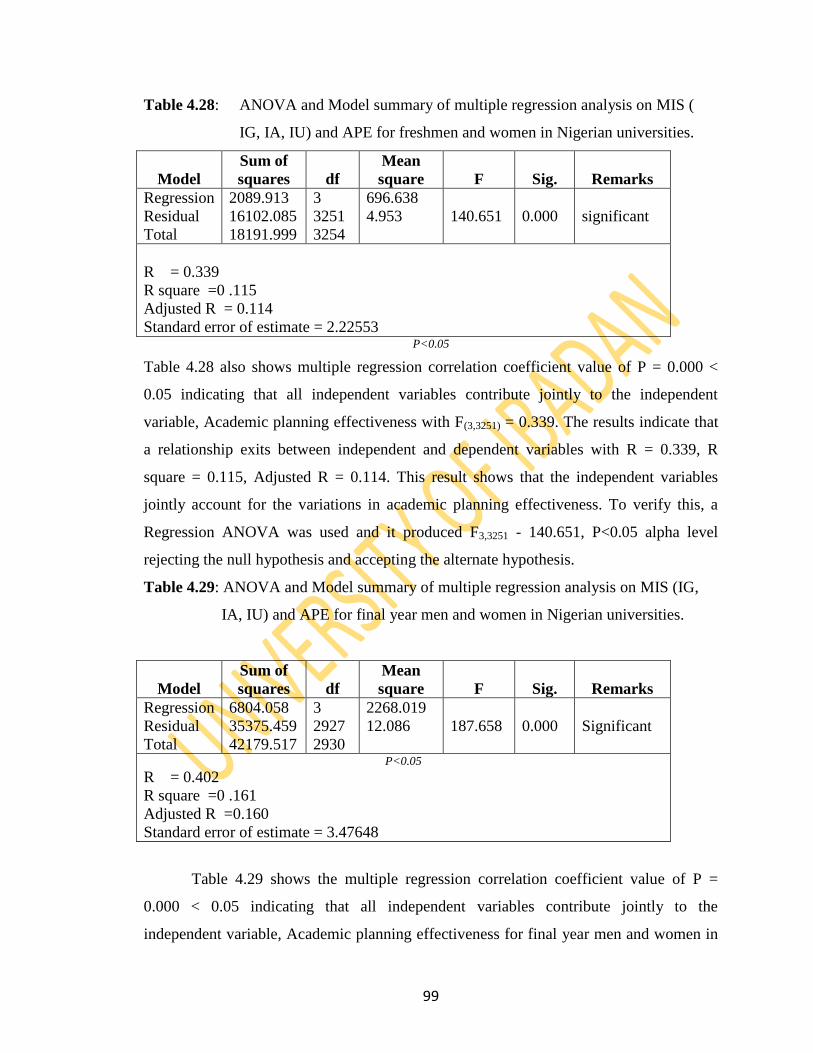
99
Table 4.28: ANOVA and Model summary of multiple regression analysis on MIS (
IG, IA, IU) and APE for freshmen and women in Nigerian universities.
Model
Sum of
squares
df
Mean
square
F
Sig.
Remarks
Regression
Residual
Total
2089.913
16102.085
18191.999
3
3251
3254
696.638
4.953
140.651
0.000
significant
R = 0.339
R square =0 .115
Adjusted R = 0.114
Standard error of estimate = 2.22553 P<0.05
Table 4.28 also shows multiple regression correlation coefficient value of P = 0.000 <
0.05 indicating that all independent variables contribute jointly to the independent
variable, Academic planning effectiveness with F(3,3251) = 0.339. The results indicate that
a relationship exits between independent and dependent variables with R = 0.339, R
square = 0.115, Adjusted R = 0.114. This result shows that the independent variables
jointly account for the variations in academic planning effectiveness. To verify this, a
Regression ANOVA was used and it produced F3,3251 - 140.651, P<0.05 alpha level
rejecting the null hypothesis and accepting the alternate hypothesis.
Table 4.29: ANOVA and Model summary of multiple regression analysis on MIS (IG,
IA, IU) and APE for final year men and women in Nigerian universities.
Model
Sum of
squares
df
Mean
square
F
Sig.
Remarks
Regression
Residual
Total
6804.058
35375.459
42179.517
3
2927
2930
2268.019
12.086
187.658
0.000
Significant
P<0.05
R = 0.402
R square =0 .161
Adjusted R =0.160
Standard error of estimate = 3.47648
Table 4.29 shows the multiple regression correlation coefficient value of P =
0.000 < 0.05 indicating that all independent variables contribute jointly to the
independent variable, Academic planning effectiveness for final year men and women in
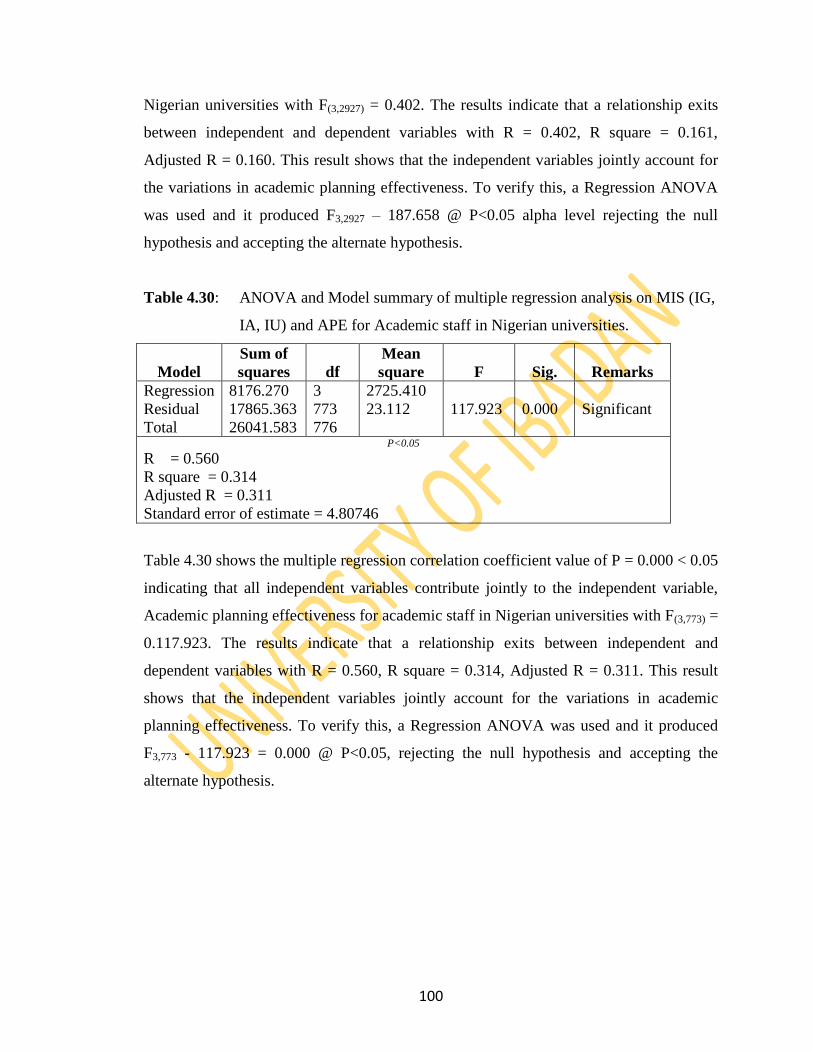
100
Nigerian universities with F(3,2927) = 0.402. The results indicate that a relationship exits
between independent and dependent variables with R = 0.402, R square = 0.161,
Adjusted R = 0.160. This result shows that the independent variables jointly account for
the variations in academic planning effectiveness. To verify this, a Regression ANOVA
was used and it produced F3,2927 – 187.658 @ P<0.05 alpha level rejecting the null
hypothesis and accepting the alternate hypothesis.
Table 4.30: ANOVA and Model summary of multiple regression analysis on MIS (IG,
IA, IU) and APE for Academic staff in Nigerian universities.
Model
Sum of
squares
df
Mean
square
F
Sig.
Remarks
Regression
Residual
Total
8176.270
17865.363
26041.583
3
773
776
2725.410
23.112
117.923
0.000
Significant
P<0.05
R = 0.560
R square = 0.314
Adjusted R = 0.311
Standard error of estimate = 4.80746
Table 4.30 shows the multiple regression correlation coefficient value of P = 0.000 < 0.05
indicating that all independent variables contribute jointly to the independent variable,
Academic planning effectiveness for academic staff in Nigerian universities with F(3,773) =
0.117.923. The results indicate that a relationship exits between independent and
dependent variables with R = 0.560, R square = 0.314, Adjusted R = 0.311. This result
shows that the independent variables jointly account for the variations in academic
planning effectiveness. To verify this, a Regression ANOVA was used and it produced
F3,773 - 117.923 = 0.000 @ P<0.05, rejecting the null hypothesis and accepting the
alternate hypothesis.
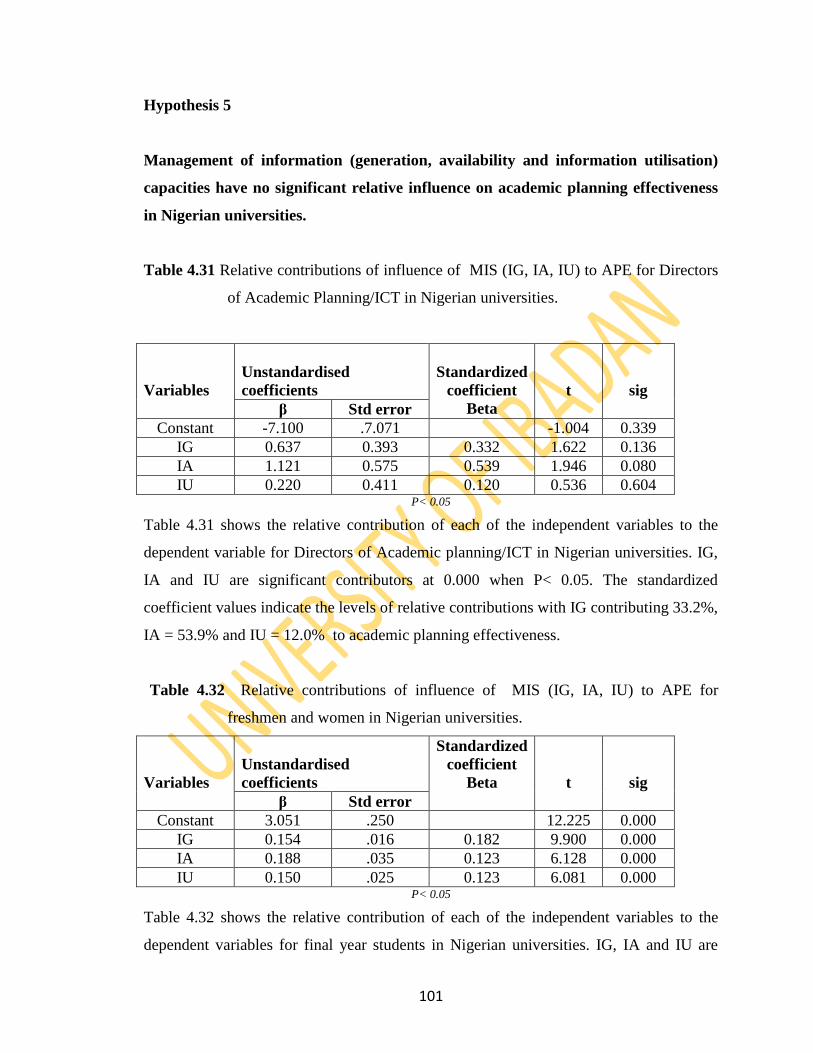
101
Hypothesis 5
Management of information (generation, availability and information utilisation)
capacities have no significant relative influence on academic planning effectiveness
in Nigerian universities.
Table 4.31 Relative contributions of influence of MIS (IG, IA, IU) to APE for Directors
of Academic Planning/ICT in Nigerian universities.
Variables
Unstandardised
coefficients
Standardized
coefficient
Beta
t
sig
β Std error
Constant -7.100 .7.071 -1.004 0.339
IG 0.637 0.393 0.332 1.622 0.136
IA 1.121 0.575 0.539 1.946 0.080
IU 0.220 0.411 0.120 0.536 0.604 P< 0.05
Table 4.31 shows the relative contribution of each of the independent variables to the
dependent variable for Directors of Academic planning/ICT in Nigerian universities. IG,
IA and IU are significant contributors at 0.000 when P< 0.05. The standardized
coefficient values indicate the levels of relative contributions with IG contributing 33.2%,
IA = 53.9% and IU = 12.0% to academic planning effectiveness.
Table 4.32 Relative contributions of influence of MIS (IG, IA, IU) to APE for
freshmen and women in Nigerian universities.
Variables
Unstandardised
coefficients
Standardized
coefficient
Beta
t
sig
β Std error
Constant 3.051 .250 12.225 0.000
IG 0.154 .016 0.182 9.900 0.000
IA 0.188 .035 0.123 6.128 0.000
IU 0.150 .025 0.123 6.081 0.000 P< 0.05
Table 4.32 shows the relative contribution of each of the independent variables to the
dependent variables for final year students in Nigerian universities. IG, IA and IU are
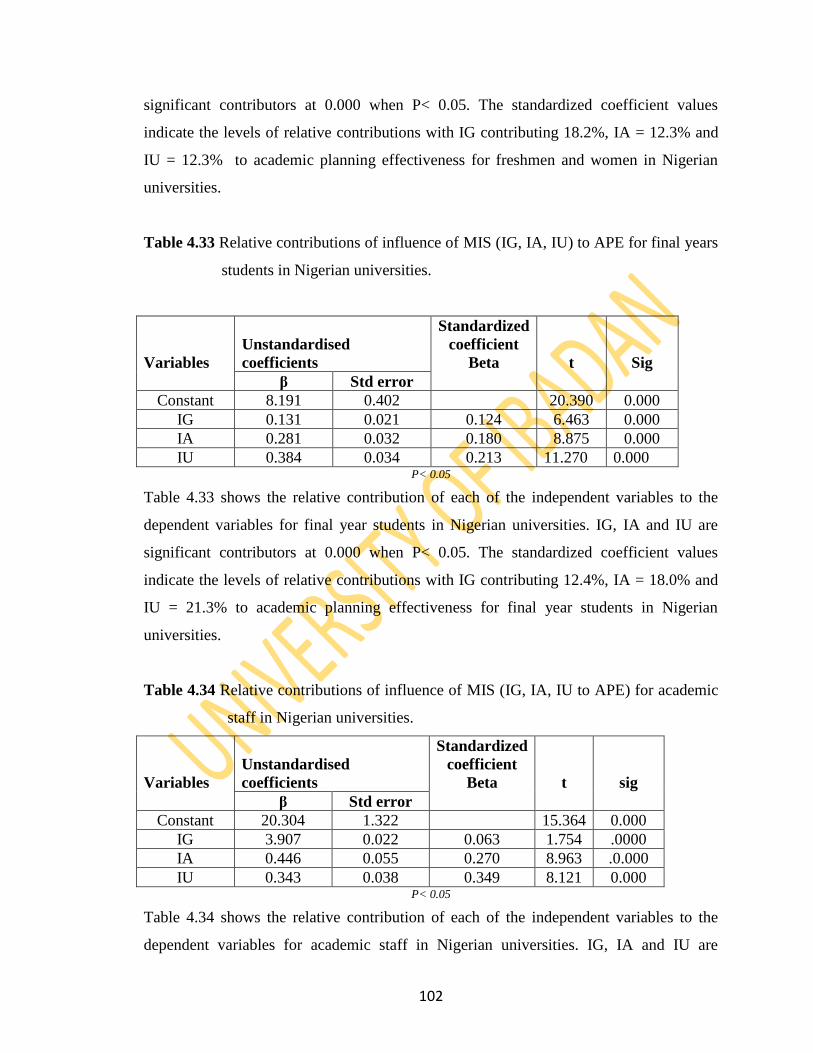
102
significant contributors at 0.000 when P< 0.05. The standardized coefficient values
indicate the levels of relative contributions with IG contributing 18.2%, IA = 12.3% and
IU = 12.3% to academic planning effectiveness for freshmen and women in Nigerian
universities.
Table 4.33 Relative contributions of influence of MIS (IG, IA, IU) to APE for final years
students in Nigerian universities.
Variables
Unstandardised
coefficients
Standardized
coefficient
Beta
t
Sig
β Std error
Constant 8.191 0.402 20.390 0.000
IG 0.131 0.021 0.124 6.463 0.000
IA 0.281 0.032 0.180 8.875 0.000
IU 0.384 0.034 0.213 11.270 0.000 P< 0.05
Table 4.33 shows the relative contribution of each of the independent variables to the
dependent variables for final year students in Nigerian universities. IG, IA and IU are
significant contributors at 0.000 when P< 0.05. The standardized coefficient values
indicate the levels of relative contributions with IG contributing 12.4%, IA = 18.0% and
IU = 21.3% to academic planning effectiveness for final year students in Nigerian
universities.
Table 4.34 Relative contributions of influence of MIS (IG, IA, IU to APE) for academic
staff in Nigerian universities.
Variables
Unstandardised
coefficients
Standardized
coefficient
Beta
t
sig
β Std error
Constant 20.304 1.322 15.364 0.000
IG 3.907 0.022 0.063 1.754 .0000
IA 0.446 0.055 0.270 8.963 .0.000
IU 0.343 0.038 0.349 8.121 0.000 P< 0.05
Table 4.34 shows the relative contribution of each of the independent variables to the
dependent variables for academic staff in Nigerian universities. IG, IA and IU are
103
significant contributors to APE at 0.000 when P< 0.05. The standardized coefficient
values indicate the levels of relative contributions with IG contributing 6.3%, IA = 27.0%
and IU = 34.9% to academic planning effectiveness by academic staff in Nigerian
universities.
4.9 Summary of findings
This summary of the salient findings are as follows;
1) Significant relationship exists between Management of Information Generation
and Academic Planning Effectiveness in Nigerian universities from Directors of
APU/ICT through to academic staff and students. This implies that MIS-G is
necessary for the proper functioning of the university system and must be given
attention.
2) Significant relationship exists between Management of Information Availability
(MIS-A) and Academic Planning Effectiveness in Nigerian universities from
Directors of Academic Planning Units and ICTs to Academic staff and Students.
3) Significant relationship exists between Management of Information Utilisation
(MIS-U) and Academic Planning Effectiveness in Nigerian universities.
4) That MIS-Generation, Availability and Utilisation have combined and relative
influences on Academic Planning Effectiveness in Nigerian universities.
5) The levels of MIS-Generation based on the perception of stake holders include;
Directors of Academic Planning and ICT in Nigerian universities - 100%,
Academic staff 93%, fresh undergraduates - 94.7 and Final year students - 70.5%.
Since the study adopted 50% as the average pass mark, it was concluded that
information generation in Nigerian universities is high when disaggregated but an
aggregated perspective still shows that the directors posses all information but
APE draws an aggregated information index to academic planning with New
students contributing 37% aggregate to information arriving in APU, Lecturers-
36% and final year students contributing an aggregate of 27% .
6) Indicators for MIS-Availability showed that the level of information available to
stake holders was also significant and average (See Table 4.7)
104
7) MIS-Utilisation was considered significant taken with academic planning
effectiveness as the capacity to utilise information was tested using multiple
regression analysis. Its indicators were that Directors utilise 100% information
generated and require more from other sources while lecturers utilise 57.5% of
information generated and available, fresh students utilise 74.5% of information
generated and available while final year students utilise less than average which is
40%. In this regard, Directors information utilisation is High, Lecturers - High,
Fresh Students - High and Final year students - Low. On an aggregated
perspective, it was observed that Freshmen and women utilise 64%, Lecturers,
27% and Final year students utilise just 11%.
8) Academic planning effectiveness could be described as follows from findings in
Tables 4.13 and 4.14;
Orientation services - Academic staff 44.5% (low), Students 92.5% (High)
Infrastructure - Academic staff (Low), Students (Low)
Accommodation - Low
Curriculum - Average
4.10 Discussion of Findings
Managing Information (Generation) for Academic Planning Effectiveness in
Nigerian Universities
Table 4.2 - 4.5 explained the levels of information that is generated in our
universities by different categories of stake holders. The study found out and revealed
that Directors of Academic planning generate as much as 100% information, academic
staff in first generation universities generate 97% and in second generation universities
89%. It was further found out that fresh undergraduates in 100 level in first generation
universities generate as much as 95% information in first generation universities and
94.7% in second generation universities. Final year students in first generation
universities generate as much as 73% information while their counterparts in second
generation universities generate 68%. This result derived from Directors of academic
planning and ICT can be understood in the light of the fact that they are responsible for
information gathering, collation and analyses in the university. Information so derived are
105
often used to advice the university on critical issues. Again, the functions of the
Academic Planning units requires that they request for information from faculties,
Departments and Centers in universities. With the level of expectation from within and
outside the universities, it is expected that the offices of the Directorate of Academic
Planning/ICT initiate request for information from all stakeholders for effective planning
and administration (Ojedele and Ilusanya, 2006). The Management of Information as
applied to generation by staff and students cumulatively is 100% that passes to the
APU/ICTs that confirms the claim. The APU/ICTs are custodian of information though
APE does not yet appear near perfect much information is generated confirming the
findings of and relevance of Barnes (1966) in the USA that electronic MIS is a must for
functional organisations.
In the observation of Barnes (1966), generated information under MIS (manual)
had the following challenges that includes how to store the generated material, secondly
how to locate documents and items when we want to retrieve them, it was for these
reason that the MIS became a viable option. In the process of ensuring academic planning
effectiveness, information is indispensible. A further look at Tables 4.10 and 4.11
indicated that there was perception variance by stakeholders on certain item variables in
the universities, for examples, the infrastructural variables examined varied from one
university to the other. There was a high perception variance between first and second
generation universities based on the findings of this study. Table 4.9 showed that there
were differences in infrastructural provision between first and second generation
universities. The revelation from the Tables indicates that the academic planning units
has much to be done in planning for and providing adequate infrastructure. In Table 4.10,
academic 65% of the academic staff of first generation universities disagreed that
infrastructure for effective teaching and learning was available. In the same vein, 70.9%
of academic staff of second generation universities attested to the fact that infrastructural
facilities for teaching were enough. This result agrees with the findings of Adeyemi and
Uko - Aviomoh (2004), Akpochafo and Fellio (2006) and Babalola (2010). It further
established that there was some level of difference between infrastructural development
in first and second generation universities although the result from the same Table 4.10
106
infers that 67.9% of Nigerian lecturers in first and second generation universities agree to
the poor infrastructural facilities in the environment.
Deriving from the above, a comparison was made to empirically see the
relationship that existed between generation of information and academic planning
effectiveness using the Pearson correlation coefficient. It was observed that the
relationship between Directors information generation and academic planning
effectiveness in Table 4.15 was significant at 0.734; p<0.05. Also the relationship
between information generation and academic planning effectiveness for freshmen and
women in Table 4.16 was also significant using the same test for lecturers and final year
students of Nigeria universities. The result tested significant indicating that the perception
of stake holders is uniform that information generation is very important to academic
planning effectiveness. Why is academic planning effectiveness perceived ineffective by
all stake holders? The answers may not be far fetched. In most Nigerian universities
sampled, the researcher went through various faculties to elicit questionnaire responses
and observed that 100 level students that were holding lectures in large auditoriums often
received their lectures with a larger percentage outside the lecture halls. It was further
observed that lecturers were not equipped with Public Address Systems (PAS) and where
the halls were equipped with PAS, there was no electricity to operate them. The
implication as observed was that most students outside the lecture halls were passive
about the lectures that were being received.
Why is academic planning perceived effective in Table 4.11 by academic staff
and perceived ineffective through the indicators used for measurement? An inference
from consultations with stakeholders through discussions reveal that most respondents
did not want to be pessimistic hence findings are at variance with reality. A variable said
to be effective became ineffective. It is expected that if the items leading to a conclusion
is negative, the cumulative effect to the conclusion will be negative. There is need to
examine reasons why this is so. Factors affecting information generation in Nigerian
universities could be inferred from the challenges facing information generally in the
Nigerian environment. Studies embarked upon by Nwankwo (1981), Ekwere (1990),
Adimorrah (1993) and Babalola (2010) observed that much information was generated in
107
Nigeria but the capacity to store such information was lacking especially in universities
though such studies were not targeted with academic planning effectiveness.
General challenges facing information management in Nigeria include poor
infrastructure that affects all universities (Ali, 2009 and Babalola, 2010). Wonnacourt and
Wonnacourt (1977) and Aminu (1982) were fast to point out that any plan based on
suspect date or herusitics was bound to fail. Nigerian universities fall short of
infrastructure for good information management. Though academic planning units and
MIS units are adequately equipped, such equipments are limited in quantity and quality
compared to the general information requirements of the larger university community to
store and retrieve information for academic planning purposes as and when due. The
universities can afford to spend heavy money to purchase equipment for those units
whose cost demands are relatively high but quantity effectively demanded of such items
by the universities are low.
The Academic planning units in universities comprise of few numbers of staff.
Their requirements in quality may be high but the quantity of what they need cannot be as
high as those required by a faculty. The relative contributions of information generation
to academic planning effectiveness in Table 4.28 is 13.6%.
Management of Information Availability in Nigerian Universities
The study established using Table 4.7 the following;
(i) Storage methods of information used for planning especially for lecturers,
students and Directors.
(ii) Availability of databases where information is downloaded or uploaded
(iii) Availability of a central database system
(iv) Availability of university websites and portals with access to staff and students.
Tables 4.18 - 4.20 established the correlation between information availability and
academic planning effectiveness. Tables 4.26, 4.30 - 4.33 explained the relative and
joint contributions of information availability on the one hand to academic planning
effectiveness and its share in the combined influence. Figure 4.1 and 4.2 showed
108
graphically the levels of information availability to academic staff and final year
students in Nigerian universities.
The study established that in both first and second generation universities, 71% of
lecturers store information in electronic formats, while 66.7% have personal databases.
Only 52% can access data in the university central database system and only 40.7% can
access university websites and web portals from their offices. For students, only 32% of
final year students store their information in electronic formats while no first year has
such a facility. 18.5% of final year students have personal databases in electronic
formats, 77.1% of freshmen can access the university web portal (from cyber cafes or
personal modems) and 40% of final year students do same. 65% of freshmen agreed that
they can access the university portal while 24.87% of final year students agree that they
do so.
On the correlation between information availability and academic planning
effectiveness, the study observed that there is a significant relationship between
information generation and academic planning effectiveness for Directors of academic
planning units and ICTs, academic staff and students. Information availability is r =
0.840; p< 0.05 for Directors, 0.505 at p<0.05 for academic staff, 0.260 for fresh students
and 0.327 for final year students. Information availability is very significant to academic
planning effectiveness. The tests further showed that IA contributes 53.9% to the
effectiveness of academic planning of Directors, contributes 27.0% to effectiveness of
academic planning of academic staff, 12.3% to the academic effectiveness of fresh
undergraduates and for final year students18.0%. It is true that information availability is
quite related to academic planning effectiveness.
The foregoing findings agree with the work of some scholars. Though most of the
scholars studied worked on the relationship between information and other issues,
Haiman (1976) was able to establish the importance of information to the general
principles of planning and in this study applied to academic planning. Haiman et al
(1976) in his work on information and general planning was able to draw out several
forms of planning styles that could be used by educational planners in different
occasions. In this study, the research was able to investigate the level of infrastructure in
these universities using a checklist. The result is sumarised in Table
109
4.9. The Table shows that MIS has not been integrated into all the universities. The
universities operate both the manual and electronic MIS at the same time. The reason for
this is not unconnected with the submissions of Ali (2009) and Babalola (2010) who
found out that funds and infrastructure for such operations were currently unavailable to
Nigerian universities. It must be noted that in Nigeria, funding is graded with several
criteria. First generation universities share much of the funds while second generation
also get a higher percentage and third generation get a particular percentage as dictated
by the NUC (Babalola, 2003) others get their own up to fourth and fifth generation
universities. It could be imagined that if the situation of first and second generation
universities is like this with the levels of funds available to them, how will it be for other
generations of universities particularly state owned universities. This is clearly seen why
the conflict between the NUC and many of these universities who are often accused of
exceeding their limits.
The study was able to show the integrity of available information to be reliable
from the perspective of stakeholders as it relates to academic planning effectiveness.
Reliability as used here simply indicates the incidence of relative absence of error from a
set of data or information provided. It could be further explained that reliability of
provided information has the ability to enhance accuracy and precision of decisions.
Also, the study showed that available information in databases were flexible as they
possessed the ability to be converted for use for another purpose to which it fits, for
instance, a census of students for matriculation purposes will indicate several indices of
the students such as name, department, faculty, matriculation number, sex etc. At the end
of matriculation, such data could be used to allocate students to hostels since some of the
required information are embedded in the former. Such actions make information
flexible. It was further discovered that generated information made available could be
adaptable. Adaptability in this sense meant changing the orientation of a set of data and
such data still obtain accurate result using the same set of data or readjusting the data to
fit into new situations. Haiman et al (1976:509) stated that data is used for predictions,
decisions and recommendations. This agrees with the submissions of Wolfgang (1966).
Haiman et al (1976) explained that prediction could be subdivided as follows;
110
Persistent Prediction: Persistent prediction is the correct fore telling of future events.
For example, if a university‟s carrying capacity is only 420, academic planning
effectiveness should be able to predict what would happen if we admit over 420 student
and could even state with some level of accuracy the extent of damage and destruction
such action will impact on the system. Another one is;
Cyclic Prediction: This explains the regularity of the occurrence of a prediction.
Looking at the university system, seasoned administrators and planners ought to be able
to observe national trends and predict their effects. For example, an excess of admission
over carrying capacity will bring in its trail several consequences that will bring undue
pressure on the system. With emerging policy options from the Federal government of
Nigeria, it ought to be possible for administrators and planners to predict pressures that
will impact on infrastructure due to infringements on policy. It is possible to ascertain
and predict with accuracy the minimum and maximum impacts of wrong policy choices.
To maintain quality and quantity in the schools system, cyclic predictions are necessary.
Another predictive index is the trajectory prediction principle.
Trajectory prediction: This is a predictive principle in which one event leads to another
something close to cause and effect relationship. The foregoing discussion clearly shows
that data integrity is important and must be well ascertained other wise we would be
planning with fact that leads to failure, chaos or a static situation (Wolfgang, 1966).
To establish data integrity in this study, the study made use of the responses
obtained from Nigerian universities lecturers. Their opinion was sought using probing
questions that could ascertain the integrity of data used. The directors of ICT and
academic planning unit responses were not used as they are very likely to score high.
Lecturers in the university system can be likened to the engine of a car, they are the
driving force behind all academic and supervisory works in the university system hence
their responses are considered more appropriate for this research question. Also, students
opinion was not sought on the issue as most of them will not understand what data
integrity means and the purpose for which the study seeks their opinion but the lecturers
are in a position to appreciate the study hence their responses are considered important.
From Table 4.9, it is seen that, availability and access to the internet is described
by the authorities of the institutions as full but responses from lecturers and students in
111
Tables 4.7 showed that the universities could possibly have established websites and web
portals but how accessible are they? Only few percentages of staff and students get access
to these portals and where it is done, it is with much rigour. Isah and Ayeni (2010) were
able to point out that most universities in Nigeria, in a bid to transform to world class
universities and also beat accreditation deadlines with the NUC commission usually
purchase these equipments without adequate preparation with the result that the
equipment often malfunctions. In a survey from www.factoids.org African higher
Education: Students Project; it was reported that the cost of internet access to US
universities per MbPs/month is $120.00 while the same access cost to a university in Sub
Saharan Africa is $13,000.00. The same document stated that cost of internet access in
Sub Saharan Africa per Mbps/month if communication cables to Sub Saharan Africa
were operated with regulated return on investment is $250 but present cost to a Sub
Saharan Africa university to buy the same bandwidth as a U.S. university (1 Gbps) is $13
million / month.
Other aspect visited by the study are:
1. Local Area Network (LAN):
Local Area Networks (LAN) are useful in organisational communication systems.
What is LAN? Botto (1999) described LAN as „a number of computers connected
together so that users can share resources as directories, application services as printers
and modems. The importance of LAN according to CISCO network solutions (2002)
include the fact that it gives low cost of operation, has a robust technology, low
maintenance for infrastructure and reserves the ability to accommodate expansion and an
upgrade. University of Maryland (2002) observes that other advantages of LAN over
wide area Network (WAN) is that LAN segment servers, facilitates fair scheduling of
tasks and shared resources, it is capable of resolving congestion analysis for wireless
infrastructure and does performance enhancement. Over the years, most universities have
found the use of LAN very helpful particularly for internal communication purposes.
Abels, Liebscher and Dennman, (1996), also gave reasons for the use of LAN in
organisations particularly university environments. Abels et al, (1996) said that the uses
of small network or localised networks are common to organisations like universities that
112
share the characteristics of having interlocking nature of information. They also
explained that all networks, big or small require pools from where they can draw
information from commonly referred to as data bases. They further explained that all
organisation often use two types of network, LAN or WAN or both which is in line with
all universities sampled in Nigeria. Both networks perform the same operation but at
different levels and technical topologies. While LAN is confined to the boundaries of the
organization, WAN is not. LAN facilitates efficiency in organizations and maintain
corporate information integrity.
This study sought to find out the level of LAN and WAN availability in Nigerian
universities as information resources and tool. Table 4.9 indicated that exposure to LAN
in Nigeria universities covers an average of 21.3% and only staff. The implication is that
only administrators in the universities central administrations are connected to LAN
specially to share information and resources. A very few section of the academic staff,
15% have access to LAN facilities. It is suspected that those exposed to university LAN
are in the categories of senior professors who are also directors of schools, Directorates
or Deans of faculties. The general body of academic staff, Head of Department (HoDs)
are excluded. From a target population of 813 academic staff 797 responded to the
question while only 118 claimed to have access and utilize LAN. A core implication of
this is that information flow within the system is not perfect but there is evidence of
prevalence of WAN. Rudimentary knowledge in information and communication studies
show that staff and student do not need any one or any assistance to get these services
these days because of its prevalence every where through Internet Services Providers
(ISP).
In Table 4.9, only two universities claimed to fully utilize LAN facilities, they
are, the Universities of Ibadan and Port Harcourt. The two universities share some
common information characteristic as both are recognised by McArthur Foundation of
America as development centres for information technology in Nigeria. The third
university with such facilities in Nigeria is the University of Abuja that did not fall within
the category for sampling. The importance of LAN and WAN in university environment
cannot be over-emphasised because it aids teaching, learning and research hence basic
113
knowledge of computer and the internet is important. The trend should be encouraged in
Nigerian universities.
2. Electronic processing and documentation of students result and transcript
The Nigerian universities sampled all indicated „partially operational electronic
student result and transcript preparation processes. Ali (2009), explained the case of BUK
and admitted that the university senate only approved the ICT/MIS unit of the university
handling students result and transcript preparation in 2006/2007 academic session. At
BUK, Ali (2009), that doubles as director for ICT and MIS of the university agreed that
the functions of the MIS unit among others include;
Collection and processing of staff and student personal, official and academic
records.
On-line registration formalities and processes for all categories of students.
Though BUK has been effecting the function, it is yet to fully complete it. The state of
student transcript preparation in other universities is not different from what obtains in
BUK. In some other universities, it was observed that rather than concentrating on the
collation, coordination and storage of data, the MIS units is involved in the processing
and distribution of identity cards to staff and students; a function which ought to be
effectively handled by the student affairs unit of any university or by external consultants
except for security reasons. Though some universities in Nigeria appear to have advanced
far beyond the manual MIS, some require individual students supplying them the same
manual information over and over again before giving the students electronically
processed information on transcript. The method adopted for doing this is to request
students to go to the faculties and departments where they graduated and there after
collect their data which will be passed to the examinations and records sections of those
universities and there after fed into the data base. While it can be vouched for the
university of Ibadan that electronic processing of students transcript has almost been
completed for the years 1990 to date, request for any transcript beyond 1989 graduation
date will take a Herculean task as it is boldly inscribed in the university exams and
records section that „all request for transcript beyond 1989 should collect forms to the
department from where they graduated to complete and be returned to the exams and
114
records section by the department (not the student) which can still be regarded as neat but
difficult, cumbersome and time consuming but in some universities, recent results are not
even seen and students and graduates are left to their fate after several and repeated trials
and failure those students give up the search. Such students loose the opportunities
they‟re seeking with not one to actually hold but it shows that the MIS in such
universities is in critical danger. It is such practices that result into forgery by students
when the students become frustrated and the universities have no means of verification
except to deny the students incase of external request for verification. This study is of the
opinion that detailed progress on the state of MIS in each university be spelt out in
university accreditations. University accreditation panels will only be playing Ostrich to
assume that seeing just a small compliance with policy indicates that all is well. If this is
emphasised, the universities and the units will sit up to become more efficient.
3. Operational University Websites and Portals
A website is a creation of server and software that support the server side
applications and data of web applications. Servers and websites usually contain
components and web addresses that contain address such as www.server.com. (Botto,
1999). A web portal is a subset of a website (Isah, 2007) since a website can contain
several portals depending on the purposes the web portals are to serve. All Nigerian
universities attest to having fully operational websites. What is the function of websites
and web portals? They inform the world through web pages and servers of events in the
organisation. Creating web portals has become fashionable globally because it keep the
world informed of happening in the hosting organisation. To verify the claims made by
Nigerian universities that they have fully functional websites, this study visited all
sampled universities websites on 20th April, 2010 with the following revelations;
1) All sampled university websites visited were actively functional and showed
evidence of good management and good update. Some university websites
contained details of their bulletins on line from 2007 till date especially the
university of Ibadan.
2) University portals for admission, registration, students information were active
and well updated.
115
3) Some universities are still constructing some aspects of their websites and portals
though they were active.
4) Some of the website visited had automated record of visitors but some important
information especially in respect to researchers of information considered not dangerous
as enrolment, financing, faculty and departmental information that ought to be found in
the web portals by researchers from any part of the world were conspicuously missing.
This shows that though universities have relatively complied with the NUC guideline on
ICT and the national information technology policy (NITP), a lot remains to be done.
4. E-learning classrooms
Asongwa (2007), describes e-learning as a technology that allows learners to learn
anytime and from every location across the world. The study further explained that the
operation of e-learning as facilitated with the availability of ICT equipment includes; the
use of computers, interactive video, radio and network systems. Close to this assertion is
the statement of Hawkridge (1990), schools can be changed for the better using
computers. (Starr, 1998), referred to electronic learning as the virtual classroom while
Dreyfus (1998), observed that e-learning brings about interconnections of knowledge.
Table 4.25 show 3 universities claiming fully operational e-learning classroom
being available to them while others attest to partial operation of e-learning classroom.
The advantages of e-learning classrooms are many. Onwuma, (2007) itemised such
advantages to include;
Accelerating students basic skills in the mastery of school subject especially in
mathematics and the sciences.
It challenges students to learn independently (a needed remedy in Nigeria‟s
educational system)
Updates student academic knowledge and instructional practices with interactions
with students and lecturers from other parts of the world.
Provides teachers with effective and efficient tools to take care of students
individual differences in the classroom.
Provides opportunities for cooperation with colleagues through networking and
internet services.
116
Challenges educators and learners to new methods of acquiring knowledge
through knowledge sharing and connections to the global virtual and digital
world.
Asongwa (2007), finally submitted that though the equipment that facilitate e-
learning are available in Nigeria, they are mostly for commercial purposes in business
centres and cybercafés. They are not found in schools and academic settings where they
are most needed. E-learning is still very novel to Nigeria. It is the observation of this
study that school and universities that claim that they are fully operational on e-learning
are being economical with the truth. Many of the created e-learning classrooms are only
seldomly used. Though the study will not out rightly condemn those universities it is
important to note that very recently Aborisade (2010) reported that students of the
national Open university of Nigeria (NOUN) decried the situation of e-learning in the
university whose foundation and policy setting rests upon e-learning. The students
complained that the Ibadan centre had in its enrolment a student population of five
thousand but had computers in its e-learning classrooms numbering just fifty but the
university is adopting the e-examination system with the result that since the year 2009,
the university had not graduated any student since it could not perfect the e-examination
system and with shortage of necessary infrastructure. The same as is in NOUN also
applies to other universities. This study is of the opinion that policy reforms are critically
necessary in this area.
5. The use of Smart boards in Nigerian Universities:
Smart boards are used in modern universities and are ICT materials that make
teaching and learning easier. They share similar advantage as indicated by (Asongwa,
2007). Table 4.25 shows that only one first generation university is trial testing it in
Nigeria while others claim to be planning how to introduce it. In essence 86.7% of
Nigerian universities are yet to trial test it even though they love it. Smart boards
facilitate understanding between lectures and students since lecture material have already
been placed on CD-ROMS, and power point software of hard disk drives of desktop
computers and laptops.
There are likely to be hindrances and obstacles to the adoption and trial testing of
the use of Smart board in our universities. Some of the problems include; unwillingness
117
to change and test new methods of doing thing. Fadipe and Adepoju (2009:490) see
change as “a process through which new programmes or practices, techniques and
approaches are put in place and/or injected into the operations of a system to replace old
or ineffective ones”. Alimba (2009), identified factors that bring about changes in
education referred to commonly as change drivers to include; technology
internationalisation, globalization etc as external drivers of change but internal drivers of
change are usually induced from the environment. The change from chalk board to Smart
boards have the factors identified by Alimba (2007), in Nigeria but many are resistant to
the change because, some are still not confident and comfortable with the introduction of
computers to education and such are unwilling to change and might resist such changes if
in position of authority. Another factor that could hinder the adoption of the use of Smart
board is the financial implication that may be considered high in an economy in which
education is heavily subsidised by government.
6. ICT training programmes in Nigerian Universities:
The importance of training in any endeavour is best illustrated in Babalola
(2009:21) expression to “encourage and invest in functional literacy education”. Other
scholars who have advocated the necessity of training in ICT in our universities include
Okunlola (2009), Ali (2009), Ayeomoni and Bilabi (2008). Automation of task ICT has
become the vogue in modern educational administration and planning and require
training all those who will be involved in the use of its materials such as student, lecturers
and non academic staff. Babalola and Jaiyeoba (2008), were among scholars that
observed that the digital revolution had taken a global dimension and schools and
universities curriculum must alter in that direction. With the changing global event,
external and internal drivers to change staring us in the face there must be training in
ICT. Table 4.28 show that all Nigerian universities indicate that there is full operation
training in ICT going on. This is not too far from the truth as deduced from table 4.15
where lecturers and students have a higher proportion of ICT skills than available ICT
equipment. University training programmes have prepared customised software for their
activities for example preparation of student result - Grade Point Average (G.P.A) which
used to be manual has been automated in a way. Again, some universities have automated
students registration (undergraduate and postgraduate), preparation of staff salaries have
118
been automated and where they have not been fully automated, they have been partially
automated. There is a general requirement that staff, students and non academic staff be
trained on the different ways of using such software. Where personnel for such training
are not available in universities, expert consultants are hired to do the training. (Ali,
2009) listed the various types of training programmes run by Bayero University, Kano
(BUK) ICT center in conjunction with the University administration to include:
Intensive computer training (literacy) for BUK student
Summer computer training for wards of staff members of the university
Intensive computer training for senior staff of the university (academic and non
academic staff)
Computer training for typist and secretaries of the university
Intensive computer training for university library staff
Computer training for bursary staff
Training the trainers programmes
This list appears in exhaustive as the study found out that at the university of
Ibadan, the university ventures organises training programmes regularly for any one
within and outside the university community on the use of computers and charges fees
that ultimately form part of the university internally generated revenue (IGR).
Information utilisation capacities in Nigerian universities
The capacity to utlise information in Nigerian universities is subject to the
availability of equipment and skills for that purpose. Table 4.6 clearly distinguished the
various capacities for information utilisation between the various stakeholders in first and
second generation universities. In the modern era, a good equipment for effective
academic work is the ownership of a computer why? It serves as the tool to generate data,
process data, utilise data and facilitate communication (Folorunsho, 2003). It was
discovered that all Directors of Academic planning/ICT are fully equipped with
functioning computers 100% inclusive of its accessories. Tables 4.6 - 4.9 clearly showed
the various levels of information equipment and its processing abilities. In Table 4.7, 4.8
and 4.9, it was established that academic staff have 50.2% equipment to process
119
information while fresh students have 52.5% and final year students 44%. The study
further shows that access to internet connectivity by academic staff is 54.3% while that of
new students is 51.3 and that of final year students is 39.4%. It may look ridiculous that
students‟ have more access to computing facilities than lecturers. The investigation
proved it wrong. While students can access information equipment through business
centres and cyber cafes, lecturers own their own equipment. It could be deduced that
there is almost no difference between first generation and second generation universities
on the items investigated in this section for example, while freshmen in first generation
universities claim 53.4% ownership of computers, their counterparts in second generation
universities claim 52% ownership. Final year students in first generation universities
claim to own 43% computers and their counterparts in second generation Nigerian
universities attest to either own computers or have access to the use of computers by sixty
(60%). Several factors could account for these claims. Though average ownership of
computers in this study appear to be higher than what obtained previous studies. Though
there is an improvement in facility acquisitions the rise is insufficient as it cannot
facilitate 100% response at any particular time by stakeholders and such there will be
shortages in whatever information that is required. However, the rise must have been due
to some of the factors listed below that have positive contribution to academic planning
effectiveness:
1. Over the years, the average income of the Nigerian university worker has been on
the increase thereby increasing the chances to own a computer. It is for this reason
that each successive study observes increases in computer ownership which is
good for the educational system and academic planning in general in universities.
2. Global competition and international opportunities are limited to any university
academic staff that is not computer literate or ICT complaint. For this reason,
university lecturers go through any hardship to own and access ICT equipment in
Nigeria. In some universities, the traditional blackboard and chalk is giving way
to smart boards and the use of e-learning facilities. It is clear that computer
literacy has become a condition of employment.
3. Volumes of information that need to be well handled are daily generated by
university staff and as such information need to be properly managed at different
120
levels of management. Though the organisation provides experts to handle
institutional and organisational information, the lecturer needs the organisation of
his personal information and hence must be information literate.
4. Most international and research libraries have gone virtual. Any university student
who is still computer illiterate may not be able to excel in his academic pursuit in
this millennium.
5. Information communication technologies (ICT) equipment producing companies
and firms are in experiencing keen competition to claim edges in the market
leading to crashes in prices computers and computer accessories and hence
enabling more people access their products. Again the extensive research that has
been going on in that area has made it possible for some materials to be sold off
the shelf to give room to new products enable more purchases and access due to
price reductions of older versions.
6. Several banks and cooperative societies inclusive of the federal government of
Nigeria have been encouraging people to own computers through soft loans or
multiple payments guaranteed by either organisations or government agencies.
The fact remains that ownership and access to computers can accelerate academic
planning effectiveness such that anyone who is computer literate can easily
perform the following tasks; personal access and to request for information,
respond to request for information that involves maintaining office ethics through
information confidentiality, browse the internet, thereby uploading and down
loading materials both to and from others and respond to urgent information needs
on-line. These are activities that take place in little or no time.
2. Access to information processing equipment and skills
Tables 4.7 - 4.10 give a general average of 65.7 of access to information
processing skills and equipment in universities. It is more acceptable as it is well known
that Directors of ICT, and academic planning having more ICT equipment than they
require. A Director has such facilities as scanner, computers (Desktop and Laptop)
photocopier access to university ICT server and other internet service providers (ISPs)
and would always claim 100%. Their submissions from observations on the field are true.
121
But the essence of this study is not only to examine top management but to find out the
process by which information reaches the top.
Table 4.10 indicates that 65.7% of the universities community have access to
information processing equipment and that 54.35% of the community have access to
information processing equipment and skills. A view of table 4.10 shows that there is
almost no difference between what happen in first generation and second generation
Nigerian universities on the subject of access to information, why? A cause for the
difference according to this investigation is relative need. For example, a department
cannot function adequately without a scanner or a computer printer while it is mandatory
for the Department to own one provided by the university, it is not mandatory to provide
for each lecturer. It is for this purpose that LAN is very useful. Most lecturers prepare
their works and patronize roadside business centres to print.
3. Availability of full internet access:
The results show that much access to the internet is still needed in Nigerian
universities as lecturers only have 50.3% access, freshmen 52.1%, final year 38.5%. The
general average obtained still falls below 50% indicating poor internet access. A reason
why fresh students have much more access to the internet than lecturers is not far fetched.
Students patronize cybercafés locate all around university campuses while lecturers
prefer to use the ones located in their offices or the ones provided by the university ICT
or by commercial ISPs. Where these are not available, lecturers appear stranded and at
times frustrated which is a negative to academic planning effectiveness. under the
condition just mentioned, academic planning could be adversely affected because
required information will not be timely as students and lecturers will not be current with
needed information or supplied with information as and when due. This study observes
that though the Federal Government of Nigeria made adequate plans for the provision of
internet in various institutions, its effectiveness is questionable.
4. Availability of LAN facilities for useage:
LAN as an ICT instrument gained prominence several years back due to its cost
effectiveness to organisations. Artkins and Norris (1996) described it as an
interconnectivity of terminal to terminal over short distances enabling the sharing of
information and at the same time enhancing the information security (IS) of the
122
organisation. Artkins and Norris (1996), further argued that LAN can be safer imposed
over WAN to cover large distances and at a lower cost to organisations. This study
looked into the availability of LAN in Nigerian universities and was able to observe that
only 15% of the university was covered by LAN (Local Area Net works). There is no
difference between first generation and second generation universities. In the opinion of
this investigation, LAN facilities in Nigerian universities are only assessable to very high
administrators and academics of the rank of professors and directors. It is likely that the
facility is not applicable to all professors. What could have informed this very low useage
of LAN in our universities as students have no access to it all? This study is of the
opinion that policy makers are yet to fully understand the need to liberalise its useage into
the university communication system as it is cost effective.
5. Utilisation of e-mail facilities for communication
It is the view of this research that every one in the university community at this
period of global digital revolution possess an e-mail account and address. The revelation
from this study is worrisome because, opening an e-mail account cost almost nothing
except the facilities that assist in opening such account like using a cyber cafe. It was
observed that communication by e-mail obtained a paltry 59% dispute it popularity. Most
disturbing is the 24% usage obtained from final year student and 98% by freshmen. Some
factors likely to have accounted for this wide disparity include the fact that admission
formalities in virtually all Nigerian universities take place outline and such all freshmen
must open e-mail account with addresses to facilitate admission and registration
formalities. At final year, much communication is done manually or by the universities as
final year students only look forward for participation in the National Youth Service
Corps (NYSC) scheme which require organizational communication and a regular check
at the intending youth corpers institutional website or the NYSC website to get further
directives. It is not yet know whether universities contact their students by e-mail hence
after first year, it is likely that student loose their email account. This revelation speaks
poorly of our system.
Turbman, Mclean and Wetherbe (2007) explains that the web revolution
emphasises networking, discovery, communication and collaboration to which these final
year students are missing out. This finding agrees entirely with Okhiria (2007), who
123
observed that the poor exposure of Nigerian student to their counterparts from the
advanced world keep our graduate less competitive several years after completing
university education. The effect of this revelation is two fold. It show that communication
between management and it community is still highly manual hence most of its student
see no reasons why they should maintain email accounts. The second is that such students
have not been adequately positioned for the challenges awaiting them after school. It is a
short coming on our academic planning system that needs to be addressed.
Tables 4.24 - 4.34 were able to show the relationship that exists between
information utilisation and academic planning effectiveness. The Tables explained that a
significant relationship exist between information utilization and academic planning
effectiveness at 0.05 level of significance. The test also indicated that the relative
contribution of information utilization by the various categories of stakeholders were
12% for Directors, 34% by academic staff, 12.3% by new under graduates and 21.3% by
final year students. What are the factors responsible for these levels of contributions?
Academic staff with the highest contributions to academic planning effectiveness will not
be unconnected with their direct impact with students and as such are able to assess the
true state of academic planning effectiveness. Directors make plans and such their
evaluations could be at variance with the objective of this study influencing their scores
to the items raised while students‟ perspective arises from their perception.
Academic Planning Effectiveness in Nigerian universities
Findings of this study on academic planning effectiveness can be seen in Tables
4.13 and 4.14. The study analysed the perception of stakeholders on some key item
variables on academic planning that included: lecturers perception of effectiveness of
academic planning in universities since they interact most with students and can evaluate
students abilities in the cognitive, affective and psychomotor domains. Perception of
students on availability, adequacy and utilisation of infrastructure. The study investigated
the correlation existing between information generation, information availability,
information utlisation and academic planning effectiveness. Among key items in
infrastructure investigated by this study were; library facilities, counseling facilities,
124
accommodation facilities for staff and students, effectiveness of teaching methodologies,
prospects for future life after university education and self reliance. Further to this, the
study established the relationship of academic planning effectiveness to generation of
information, availability of information, utilisation of information with their combined
and relative influences.
It was observed that perception of Directors of Academic Planning on the
effectiveness of academic planning in Nigerian universities was 100% as all of them
indicated that the items listed were effectively planned for though it was not the case with
academic staff perception on the same issue. Academic staff perceived that academic
planning was effective at 87%. First generation universities academic staff scored the
item 78.8% while second generation university lecturers scored the item 95.3% but
Nigerian universities students were not tested directly with such a question as their
responses to other items enable the research item get its inference.
35% of first generation universities lecturers in Nigeria agreed that infrastructure
for effective teaching and learning was in place while 29.2% of second generation
universities lecturers attested to that. In essence, 65% and 71% respectively of first and
second generation academic staff are saying that facilities for effective teaching and
learning are not there. This finding are not different from Adeyemi and Uko- Aviomoh
(2004), Akpochafo and Fellio (2006) and Babalola (2010). Other findings of this item
include the fact that an average of 86% of fresh students attested to the adequacy of
library facilities in their respective universities while 58% of graduating students attested
to same. 76% of new students claimed awareness that their universities had counseling
services but only 49% of outgoing students had such claims. There was similarity
between the number of outgoing students who claimed to be aware of universities
counseling services and those who utilised the services. 32% of lecturers claimed that the
classes they taught were well equipped and 68% claimed that the classes were ill
equipped with teaching and learning resources. 64.7% of first generation universities
agreed to adequacy of sitting infrastructure in classes for first year undergraduates while
for final year students it was 57% but for second generation universities it was 37% and
54.5% respectively.
125
On other issues in the study of academic planning effectiveness as orientation
services for staff and students, the following findings were observed; 49.1% of academic
staff in first generation universities claimed to have received orientation on assumption of
office while 40% of second generation universities claimed the same. In essence, 50.1%
of first generation academic staff received no orientation on assumption of office, while
60% of second generation universities received no orientation on assumption of office.
For students, an average of 92.5% of first year students interviewed agreed that they
received orientation before commencement of academic work for the session while final
year students did not respond to the item probably as it was considered irrelevant to them.
Similar world class universities understudied in the process of this research (Isah and
Ayeni, 2010), it was observed that orientation is tagged „settling down‟. It is a core aspect
of academic planning in the world class universities investigated. In such universities
admissions into any programme or recruitment into any level of employment is not
embarked upon once in any session but several times. There are various periods for
resumption for several programmes and students unlike what obtains in Nigeria where all
universities resume academic work at a particular time. The higher education regulators
in those countries perform their duties that includes supervision while governance and
management of higher education is liberalized (Erwat, Isah and Fabunmi, 2008).
University admission is an all year round event hence orientation for fresh
students and academic staff is a continuous exercise. The study was able to point out that
orientations enable genuine interaction between new staff and their principals who inform
new students and staff of their rights, privileged and limitations. The effectiveness of
academic planning can be imagined in Nigeria where a majority of university lecturers
receive no orientation. A visit to the official websites and Portals of most world class
universities display the following information in their academic calendars; date of
resumption for new students, returning students in each semester and dates for
orientation.
Findings on the relationship between academic planning effectiveness and the
independent variables – Management of Information (generation, availability and
utilisation)in Tables 4.16 - 4.34 indicated that all independent variables tested significant
to academic planning effectiveness. Again, the independent variables displayed
126
significant relative and joint contributions to effectiveness of academic planning in
Nigerian universities.
It could be rightly inferred that academic planning is not in anyway effective
when compared to the activities of world class universities as some indicators from those
universities show for example, in the world class universities according to Isah and Ayeni
(2010) and a similar study by Babalola (2010), orientation services are such that students
and staff are taking on excursion round university campuses and facilities. Orientation to
service or to settling down in school is a very important function of management and
administration of organisations. It is crucial and important to tertiary institution and
universities to enable new students and new staff settle down in any endeavour. It is for
this reason that most universities conduct orientation programmes more than once in a
given session.
According to DFAN Orientation Services (2009), America‟s top ten universities
that comprise of the universities of Harvard, Princeton, Yale, California Institute of
Technology in Cambridge Massachusetts, Stanford University, University of
Pennsylvania, Dartmouth University, Hanover and University of Columbia run
orientation programmes annually in their universities to address; Getting settled that
involves how new students get settled down on campus and go about activities that will
dictate their future in that university. University academic calendar; enables students and
staff to understand the dynamics of the university system through their academic
calendar; Health services: involves full assistance and how to go for medical assistance
when distressed health wise since health could impair academic performance. Career
services; when in need of career advice and counseling; Presentations: to receive
instruction and information on presentations at all level in the university; Graduate school
orientation programme designed for local and international students orientation to settle
down. The foregoing is for students, but where the orientation is for academic staff, the
same universities give orientation to staff on;
Sexuality: The intrigues and occurrence of sexual harassment or sex
discrimination
Teaching: Presentation of lectures inclusive of the nature and extent of
student/lecturers interactions
127
Student services
Human resource and employment
The purpose of orientation is to acclimatise the new entrant either staff or student
with the best practices of the organisation. Orientations are organised and executed as
part of university activities in a given year. Orientation programmes are held in high
esteem all over the world by universities as in most cases it prepares the principal and the
client for their first interactions and expectations on both sides. Also, Nigerian
universities hold orientation programmes in high esteem. In Table 4.13 and 4.14, 92.5%
of freshmen took part in orientation programmes and agreed that they were well informed
about their university programmes before they commenced full blown activities. In the
USA for instance, orientation is a university programme that features talks, workshops,
lectures etc. for staff and who ever is to be acquainted with the details being transmitted.
44.5% of lecturers interviewed accepted taking part in one orientation programme or the
other immediately after employment organised for them. The simple deduction from their
response is that an average of 55.5% of Nigerian lecturers and administrators hardly
acclimatise early to their jobs. It may account for reasons why attrition rate of academic
staff is high as many are not aware of their limits and what academic freedom is all about
and so often overstep their bounds as soon as they assume office and loose the same jobs
they secured not knowing the consequences of the actions they took.
Another reason that may have accounted for the high attestation by freshmen to
participation in orientations programmes could be due to the fact that almost all freshmen
and women in Nigerian universities resume their academic pursuit and calendar at the
same time hence holding orientation for fresh students give pleasure to administrators and
the students especially first generation universities. The same is not the case for second
generation universities that often have several batches of admission with the university
matriculation often been the decider of when admission ends and at that time orientation
has ended.
University academic staff are not as privileged as university undergraduates
because majority are not employed during mass recruitment. The implication of isolated
employment is that academic staff use trial and error method before adjusting to
university guidelines and ethics of operation. Examples of the USA top 10 universities
128
are handy as they hold several orientations in a given year. These orientations are planned
and budgeted for in the university‟s annual budget and included in the university calendar
so that anytime any student or lecturer arrives, he can participate in an orientation
programme. In such cases, the staff or student is easily adapted, settled, acclimatised and
sets in motion the actual pace to work.
In a study of the University of Massachusetts in the USA, the authorities were
definite on the space levels for academic staff offices and student accommodation both in
the classrooms and accommodation. Other aspects/indicators for academic planning
effectiveness included; transportation and communication facilities on campus. World
class universities often review teaching facilities and methodologies to which instruments
have been designed to collect responses from both incoming and out going students. The
purpose is to ensure and enhance continuous improvement in effective lecture delivery.
While it cannot be argued that such facilities are absent in most universities in
Nigeria, this study adapted some of the indicators obtained in those universities for
example, the study sought the opinion of academic staff on office accommodation and the
opinion of students on students accommodation for effective academic work. The
findings showed in the area of office accommodation that Nigerian university lecturers
were unanimous in disagreeing with adequacy of office accommodation provided. In the
world class universities, dimensions of offices and accommodation are displayed to the
knowledge of all but most times accommodation is a luxury in Nigerian universities.
There are some essential services and provisions in universities that create effective study
environments for learning, teaching and research that are often backed and supported by
policy and sometimes they are not. Some of the provisions backed by policy include
issues like university accommodation for undergraduate and post graduate students. In
Nigeria today, most government owned universities especially those run by states appear
to pay less attention to the provision of accommodation on campus and this study
observes that in such disciplines as the medical, basic medical sciences, natural sciences,
technology and pure sciences, residing in university accommodation helps improve
students academic performance positively because of the long hours usually spent in
practical classes in the laboratories and workshops.
129
Nigeria has experienced tremendous growth in university establishments and
admissions in recent years without a corresponding growth in infrastructure such as
hostels and classrooms infrastructure (Osinowo 2001 Citing Fadairo, 1984) observed that
there were excess congestion in some undergraduate halls of residence at the University
of Ibadan and that also applied to the university of Lagos. According to Osinowo (2001),
congestion results in stress, failing health and other allied health hazards.
Closely related to the above finding was that the stress arising from over crowed
students accommodation led to the development of aggressive tendencies to ward off the
effect of the stress associated with overcrowded hostel accommodation. The statement of
Osinowo (2001) can be a lead to reasons why cultism developed in many universities in
the recent years rapidly to the consternation of university administrations. As can be
observed, overcrowding of classrooms, overcrowding in hostel accommodation have
become a source of frustration to both lecturers and students. There are minimum
standards of hostel accommodation prescribed for Nigerian universities.
Furthermore, Mbat (2000), Akpochapo and Fellio (2006), at different times
agreed that university admission rate has been on the increase in the last few years. In
Table 4.33, only 55% of fresh undergraduates‟ clamed to reside in university
accommodation while 57% of final year undergraduates were so accommodated. In some
universities, the accommodation policy provides for 40% accommodation with priorities
being accorded fresh students, final year undergraduates, medical students, sportsmen
and women and physically challenged students. For several reasons as shown in the study
of (Osinowo, 2001) many students and parent shun university hostel accommodation.
On the other hand, university academic staff appear dissatisfied with the quality
of office accommodation and infrastructure given to them. For instance in Table 4.13
item 6, only 24.5% of lecturers, agreed that they were satisfied with the office space and
furniture provided them because in most universities as observed during the study, junior
academic staff are usually paired in two‟s, three‟s or fours and above in their offices with
the result that such offices lack privacy, security and the general decorum/ ethical
conduct required by academics to effectively carry out their duties. On staffing, 47.1% of
academic staff were satisfied with the level of staffing in their departments as several
130
practical and official indicators show that university academic staff are overworked in
Nigeria, such indicators can include;
1) Overflowing lecture halls and theatres easily observable without any research
arising from insufficient manpower and desire to up hold quality by utilizing a
single lecturer.
2) Payment for overtime services known as „excess work load capacity to
lecturers‟ This means a job that ought to be done by four lecturers may be
done by one and so he is compensated for the excess work because the
authorities are unwilling to employ more hands. Finally, 94.1% of university
lecturers agreed to the need for modification in university students‟ education
curriculum.
3) On a closer intimate discussion with some lecturers, it was observed that some
lecturers felt dissatisfied with the system (Administration) as they were unable
to proceed on Sabbatical leave due to the extreme low staff strength of their
respective departments. To see a 52.1 disagreement over staff adequacy shows
the level of dissatisfaction and it is one area that Planners must look into.
Viewing this study, it could be safely concluded that policy execution deficiencies
especially in the area of academic planning effectiveness in Nigerian universities is not
due to either inadequate information, its availability or utilisation but other factors which
are not the focus of this study. Most administrators fail to remain firm in the face of
intimidating demands from politicians and acquaintances hence at times, they exceed
approved limits.
Again, there appears to be an excess of demand over education supply in Nigeria placing
undue pressures on institutional administrators. Complaints by stakeholders may not be
unconnected with the widened access to educational facilities due to the liberalization of
education in the new Millennium in Nigeria bring about private investment in education.
With increased enrollments and increase in the number of institutions, effective and
efficient supervision of institutions is poor due to low infrastructure.
131
CHAPTER FIVE
SUMMARY, CONCLUSION AND RECOMMENDATIONS
This chapter presents a summary of the investigation into the Management of
information as predictors of academic planning effectiveness in Nigerian universities. It
also gives the conclusion and recommendations for policy makers.
5.1 Summary
This study investigated the management of information (generation, availability
and utilisation) for the prediction of academic planning effectiveness in Nigerian
universities. The study examined the problems and challenges associated with
information and its management especially the generation of such information and the
relationship that exists among the three independent sub variables and single dependent
variable (academic planning effectiveness) used for the study. The study was premised on
stakeholders‟ complaints of non-compliance by Nigerian universities to agreed quotas
and limits thereby reducing standards and quality in university graduate production in
Nigeria. The study investigated perceived non-compliance to the university system‟s
lapses in information management in terms of information generation, availability and
utilisation especially as it relates to academic planning in universities.
The study raised and answered seven research questions and tested five
hypotheses. Five hypotheses were tested using the correlation analysis and multiple
regression analysis.
The study adopted the survey research design of the exposed facto type while
adopting the multi stage sampling procedure. It adopted the purposive sampling
technique to select seven out of Nigeria‟s thirteen first and second generation
universities. Target population consisted of Directors of Academic Planning and ICT in
Nigerian universities, lecturers and students. The research questions were able to unveil
the pertinent issues involved in each sub topic while the hypotheses gave a good account
of the degree of relationships among the variables. The universities sampled for the study
included the universities of Ibadan, Lagos, Nsukka, Benin, Obafemi Awolowo and
Ahmadu Bello University. Others are the universities of Calabar, Ilorin, Jos, Kano,
132
Maiduguri, Port Harcourt and Sokoto. The study ensured that it sampled at least one
university from each of Nigeria‟s six geopolitical zones.
The study was able to show that Nigerian universities generate information at all
levels but the availability is not as much as the generation. Principal reasons for these
were that most universities in Nigeria fall short of funds to meet standards especially as it
relates to ICT infrastructure which determines in modern times the effectiveness of
teaching and learning. The utilisation of information was also observed to be average as
access to channels for storage and capacity acquisitions where low. Infrastructure in all
fronts as pertained to Management of information were found to be low in some cases
and high in others impacting negatively on the effectiveness of academic planning.
Finding on infrastructure that is considered important to the study which other scholars
had at one time or the other hammered on, needed improvement. Academic planning
effectiveness, though relatively high, low and average, was observed still needed much to
be done especially in the provision of infrastructure.
There is the need to improve on students‟ academic welfare; counseling and
orientation services should be stepped up in all universities especially for staff. Students
did not feel comfortable with the levels of training they were exposed to while lectures
advocated for a review of students curriculum to enhance self reliance after school.
In respect to information processing infrastructure, and foundation for ICT, the
study observed that Nigerian universities have created websites and web portals as the
case might be but the functionality of these web sites was questionable. Also, it was
discovered that ownership of information processing equipment was at low ebb. Again,
most universities do not practice full MIS but most still combined the electronic and the
manual MIS.
The hypotheses of the study cumulatively revealed significant relationships
between Management of information (generation, availability and utilisation) of
information and academic planning effectiveness as the correlation „r‟ was 0.734 for
Directors, 0.321 for academic staff, 0.277 for freshmen and women and 0.266 for final
year students at 0.05 alpha level. The respective results in the order indicated above are in
the Tables. The independent variables also displayed significant multiple relationships
133
with the dependent variable while there was significant relative contributions of each of
the independent variables to the dependent variables.
5.2 Conclusion
The study arrived at the following conclusions from its findings;
Arising from the need to investigate academic planning effectiveness, this study
embarked on an examination of older Nigerian universities of the first and second
generation stock to find out its level of preparedness for challenges in this 21st century.
The study used the Management of Information (generation, availability and utilisation)
being a current requirement for ranking universities world wide and contributes to the
repositioning of tertiary institutions to test the effectiveness of academic planning. In the
process, Management of information was correlated with academic planning
effectiveness to establish that a relationship exists or not. The study raised and answered
seven research questions and tested five hypotheses at p<0.05 level of significance. The
study utilised the survey research design and adopted the multi stage sampling procedure
to select 7,160 respondents across the six geopolitical zones in Nigeria.
The study revealed that universities teaching staff possessed an aggregate
information generation capacity of 37%, fresh students generate 36% and final year
students possessed aggregate contribution to academic planning effectiveness of 27%. It
was further discovered that universities teachers in Nigeria possessed an aggregate
utilisation capacity of 64% of information and its contribution to academic planning
effectiveness. In the same vein, it was observed that fresh students utilise an aggregate of
25% and final year students, 11%. Other revelations included that university teachers
enjoyed 71.7% access to information.
The study found out that some challenges were being experienced by universities
in the area of information infrastructure. Many universities had not completely adopted
the computerised management information systems. LAN and adoption of smart boards
for teaching were almost completely not existent in all the universities studied. If the
situation be so with first and second generation universities, then, it could be imagined
134
what it is for states and private universities whose funding cannot match the first and
second generation universities.
The study observed that the independent variable contributed significantly to
academic planning effectiveness in Nigerian universities hence its absence could impact
negatively on academic planning effectiveness. It was revealed in the study that the
independent variable (Management of information) and its sub variables (generation,
availability and utilisation) jointly and relatively contributed to academic planning
effectiveness. Levels of contribution of MIS (generation, availability and utilisation) to
academic planning effectiveness varied among stakeholders though the aggregate
contribution is what was presented in the preceding paragraphs. In the main study report;
Directors, lecturers and students had high contributions in the management of
information, in other aspects - average while in some others, low.
5.3 Recommendations
In view of the investigations, findings and discussion in this study, the following
recommendations are hereby suggested to enable the independent variables impact more
on academic planning effectiveness;
1) The computerised MIS should be adopted by all Nigerian universities. Its
adoption should not be optional hence this study strongly recommends that the
FGN and the NUC come up with a policy (done in 1990 but not enforced) that
will enforce the adoption of the computerised MIS in all universities. The study
discovered that among the federal universities, Information capacity utilisation
was low and availability epileptic due to poor, unmaintained and sometime
outdated equipment/infrastructure hindering the success of academic planning.
The study recommends that accountable funds be approved by the NUC for this
purpose. It is advisable that proper monitoring be done by the NUC and from the
perspective of this research should be one of the items for accreditations.
2) This study, strongly recommends the IT training be provided for all categories of
stake holders on the use of computerised MIS in the universities. For lecturers,
computer literacy should be adopted as one of the skills that must be acquired to
135
move to a particular level. It should be adopted to assist teaching and learning.
The infrastructure should not only be provided but policy must enforce
compliance. For students, the skill must be enforced and a course like the GES
(General Studies) introduced that students must compulsorily take. IT laboratories
should be provided. While this study appreciates the enormity of the cost,
government must enforce them for a better future.
3) Most universities are yet to adopt the uniform information policy in line with the
FGN policy on IT. Internal policies must be consistent and comply with
established national policy especially as it relates to IT and the universities. This
study is also of the recommendation that the FGN should establish without further
delay an ICT that will enforce compliance of all government institutions to
comply with IT and ICT as it has become the issue globally.
4) Nigerian universities lecturers should be empowered to purchase information
processing equipment without stress on their incomes. Government or school
authorities should provide soft loans to teaching staff which can be deducted from
source over time. The current practice is that teaching staff obtain loans either
from finance houses or cooperative societies. The practice of soft loans will
encourage teaching staff to adopt computerised MIS.
5) To assist students, government and school authorities should provide well
furnished computer laboratories with up to date softwares in the departments and
faculties that students can access. The current practice is that there are computer
laboratories but the infrastructure is few and cannot go round. Again, periods of
use are limited to when the provider allows. It is observed that because of high
cost of maintenance, access to these equipment is restricted. This study is
recommending that access be expanded. It can be done through provision of
security for the laboratories.
6) Expansion of access should of necessity be complemented with provision of
infrastructure as office accommodation, employment of more academic staff and
provision of teaching and learning equipment.
7) There should be regular policy reviews with self study conducted by the academic
planning units of universities. Obsolete courses should either be reviewed or
136
removed from the universities for example, in this Millennium, some first and
second generation universities still have the Department of History while others
have modified theirs to Department of Diplomatic studies or International
relations. It is clear that such institutions have not conducted an effective self
study over time. Their products will have challenges in the labour market with the
type of certificates they are carrying.
8) There must be improvements in university services especially as it relates to
LAN, WAN and Networks. Nigerian universities should initiate and encourage
local research into the development of ICT and ICT related materials to reduce
costs and close the gap the universities located in the developed and the
developing nations.
5.4 Implications of the Study to Planning and Policy
The findings of this study are generalisable especially its recommendations
arising from the findings. In the first instance, a holistic approach will give a casual
observer the impression that the numbers of schools used were few but the number
should be viewed in the light of policy. Age is an important demographic tool in
educational management (planning) hence the age of the institution opens a new chapter
through which any in coming institution must undergo in the frame work of the national
universities commission and in that light, a 50% sample across the geopolitical zones of
Nigeria is a good and unbiased approach to universities management taking first and
second generation universities as our launching pad.
Educational managers and policy makers should ensure in the light of the revealed
findings that a target date is set in which Nigerian universities are to adopt
computerisation in MIS. This has implications for management in the light of
infrastructure provision, skill acquisition and improved capacity utilisation of provided
infrastructure. Planning and policy must ensure and enhance an improved university
calendar that will include orientation services all year round, regular training on the use
of ICT all the year round for all categories of stakeholders in the university system. New
infrastructure that can assist in the implementation of database creation, Networks
137
linkages and university wide internet services should be created with strong monitoring
and compliance ensure by the NUC.
Another strong implication of this study to management is the drive to ensure a
university ICT policy which is yet to be in existence. Nigeria presently has an IT policy
but the bench marks failed the test of time. The ICT policy should be pursued vigorously
specially as it applies to higher education and institutions while the IT policy be reviewed
especially its outdated bench marks and be made to function properly.
It is advisable that policy makers ensure that Nigerian universities (Departments
of Academic Planning) implement regularly self study programmes. Though some of
these have been going on much more needed to be done for example, the University of
Ibadan recently changed its mission statement after so many years indicating „towards a
world class university’. The change in vision has brought about a new mission and new
way to doing things. The foregoing implications are in no way exhaustive but could be
seen to involve huge capital outlay. Funding must be commensurate to needs.
5.5 Suggestions for further research
This investigation focused on the Management of Information (generation,
availability and utilisation) as predictor of academic planning effectiveness in Nigerian
universities. The study focused on the federal government owned universities of the first
and second generation classification. The scope of the study could be expanded to include
state owned universities and private universities whose short comings in the area of
policy implementation motivated the project in the first instance. The inclusion of states
and private universities will not only widen the scope but will enable comparisons and
greater generalizations. Though this work is generalisable, Private universities were not
taken into consideration since they were so young when the project began in 2006/2007.
They are now of age and could be included in another survey.
138
5.6 Contributions to Knowledge
This study has been able to close some gaps in the field of educational planning
and policies especially delving away from the traditional research in the well known
areas using that are well understood indices. The study undertook an independent study
of academic planning effectiveness using management of information as its predictive
variable and to this end was able to provide an index.
The study observed and reported that aggregate contributions of Lecturers MIS to
Academic Planning Effectiveness in Nigerian universities is 36% while Final year
students and fresh students contribution to MIS information generation for academic
planning is (27 & 37)% respectively. The study also established as index for MIS
utilisation that saw Lecturers, Final year and undergraduate students utilise information
as follows ( 25, 11 & 64)% respectively. Several other indicators were presented
concerning academic planning effectiveness. Previous studies hardly considered the area
of academic planning as most works concentrated on information acquisitions, capacity
development etc. This study examined the relationship between academic planning and
Management of Information. It is a pioneering work in academic planning that is not a
self study.
5.7 Limitations of the Study
The study was limited by some factors among which were funds and time. In the
first instance, the study experience one of the peculiarities to Ph.D research in Nigeria. It
lacked a formal financial sponsor so it could not afford to include state universities and
private universities. Including them would have exacerbated the cost of the programme
and probably truncate it because the research bore a national outlook.
Secondly, time was of essence. The demographic information of the study was
collected in 2006/2007 academic session. The period of the study witnessed an unstable
university wide distorted academic calendar with elongated or truncated sessions. Such
unsettled calendars made the study tough. Further research could include states and
private universities
139
REFERENCES
Abels, E.G, Leibsecher, P and Denman D.W 1996. Factors that Influence the Use of
Electronic Networks by Science and Engineering Faculties at small Institutions.
Journal of American Society for information Science. 7.2:146-158.
Aborisade. A 2010. 30th
May. NOUN Students Grumble Over Poor Academic
Environment. The Punch Newspapers. 17.19,588:4 www.punchontheweb.com
retrieved 30th
May, 2010.
Adam, L. 2003. Information and Communication Technologies in Higher Education in
Africa: Initiatives and Challenges. Journal of Higher Education in Africa. 1: 196-197.
An Inter Disciplinary International Journal on Research and Policy. Boston USA.
Adekanbi G. 2008. Neo - Liberal Ideology and the Future of Higher Education in Africa:
Vital Lessons for Nigeria. Department of Educational Administration, University of
Calabar: 33 - 35. Nigeria.
Adesanya.O.O., Onilude.O.O. and Sodipe.R.O. 2004. Database Design and Creation: As
Sources of Information for Libraries and Information Centres. Madu (Ed.)
Technology for Information Management and Service in Modern Libraries and
Information Centres in Developing Countries. Ibadan: Chapter 3:78 - 94. Nigeria.
Adeyemi J.K. and UKO - Aviomoh, E.E. 2004. Effective Technological Delivery in
Nigerian Polytechnics: Need for Academic Manpower Development Policy:
Education Policy Analysis Archives Journal of Education. Arizona, USA. 12: 4.
Adeyemi N.M 1991. Issues in the Provision of Information Services to Developing
Countries. African Journal of Library, Archives and Information Science. A
Publication of Arclib and Information Services, Ibadan. Nigeria: 1.1:1-8.
Adimorah, E.N.O. 1993. An Empirical Study of the Information Needs of Industries in
Nigeria. African Journal of Library Archival and Information Science. Ibadan,
Nigeria. 3.1
Aiyepeku W.O. 1978. The Information Component in Decision Making: A framework
for Analysis. Quarterly Journal of Administration: 127 - 139.
Aiyepeku W.O. 1993. Developing Information for Development Information. Inaugural
Lecture, University of Ibadan. University Press PLC Nigeria.
Aiyepeku W.O. 1982. Information Utilisation by Policy Makers in Nigeria, Part III:
Information Packages Preferred. Journal of Information Science U.K:25 - 27.
140
Ajayi.A.O.1986. Organisational Theory: its Ramifications, Overview and Critical
Approach. African Journal of Educational Management. Ibadan. Nigeria.1.1:102 -
112
Akangbou. S.D. 1985. Introduction to Economics of Educational Planning in Nigeria.
Vikas Publishing House PVT Ltd, India.
Akerele,W.O. 2008. Quality Assurance in Nigeria‟s University System: Imperatives for
the 21st Century. Towards Quality in African Higher Education. Babalola,J.B,
Popoola, L, Onuka, A.O, Oni.S , Olatokun, W and Agbonlahor, R (ed.) Chapter 7
:119-141
Akpochafo, W.C. and Fellio W.L. 2006. An Overview of Barriers to Curriculum
Implementation in Nigeria. International Journal of Continuing Engineering
Education and Life Long Learning: 16. 6: 493 - 501.
Alabi, A.T. 2006. The Use of Computer in Educational Management. Educational
Management: Thought and Practices. Babalola,J.B, Ayeni,A.O, Adedeji,S.O
Suleiman and Arikewuyo (Eds.) Codat Publishers, Ibadan, Nigeria Chapter 27:560-
581.
Ali, M.H 2009. Centre for Information Technology, (CIT). Bayero University, Kano.
Quarterly News Bulletin, Kano. Nigeria. 4:3:26 - 28.
Alimba C.N. 2009. Managing Change in Education. Educational Management: Theories
and Tasks. Babalola J.B and Ayeni. A.O. (Ed.) Macmillan, Nigeria Chapter 25:470
485.
Aminu, J. 1982. Quality and Stress in Nigeria‟s Education. Selected Addresses and
Papers, 1975 - 1985. University of Maiduguri. Northern Nigeria Publishing
Company.
Anderson, L.W. 2004. Increasing Teacher Effectiveness. IIEP. Paris. UNESCO: 68.
Arahan. R.F.M, Ganti. V, Naranayan. S. Muthukrishnan. C.R, Prasad. S.T.S and
Ramamrithan. K. 1996. Implementation of a Real Time Database System.
Information Systems Journal. Exeter Britain. 21.1:55-57.
Artkins J., Norris. M. 1996. Total Area Networking. John Wiley and Sons Ltd. London:
7 & 8.
Asongwa, U.D. 2007. E-learning: A Panacea for Access, Equity and Quality Higher
Education in Nigeria. Access, Equity and Quality in Higher Education. Babalola J.B,
Akpa, G.O., Ayeni A.O. & Adedeji, S.O. (Ed.), Nigerian Association of Educational
Administrators and Planning (NAEAP) Publication Chapter 6:497-504.
141
Aver.A, Hall.W, Leilich.H.O, Lie.J.S, Schweppe.H. Sechusen.S, Sliege.G, Teach.W and
Zedlier.H.C. 1981. Relational Database Machine. International Journal of
Information Science. Britain. 6.2:91 – 100.
Awopegba P.O. 1995. An Analysis of Factors Influencing Labour Markets for Nigerian
Graduates. Unpublished Ph.D Thesis of the University of Ibadan. Nigeria.
xvii+358pp.
Ayeni.A.O. Isah.E.A, Erwat.E.A and Ileuma.E. 2009. Managing Inventions in Nigeria
Through Educational Research, Innovations, Creativity and Policy Reforms.
Babalola,J.B, Akpa,G.O, Ayeni,A.O and Ikediugwu, N (ed.) Managing Inventions
in the Nigerian Educational System. Nigeria. Chapter 1:17-29.
Ayeomomi, S.N and Bilabi V 2008. Technology Education and National Development.
Babalola, J.B., Akpa. G.O., Ayeni A.O. (ed.) Managing Technical and Vocational
Education in the Era of Globalization. Nigeria. Chapter 7:341-345.
Babalola J.B & Jaiyeoba A.O. 2008. Curriculum Development for Effective Learning in
Higher Education During Knowledge and Digital Revolutions. Department of
Educational Management University of Ibadan. Nigeria.
Babalola, J.B. 2003. Fundamentals of Economics of Education. Basic Text in Economics
of Education. Department of Educational Management, University of Ibadan. Ibadan,
Nigeria.
Babalola, J.B. 2009. Education That Can Raise Productivity in Nigeria. University of
Ilorin, Nigeria: 21.
Babalola, J.B., Tayo. A.S., Okediran A. Ayeni A.O and Adedeji S.O. 2006. Economic
Thought About Private Aspect of Education. Policy Implications for Management
in Africa. Turkish Online Journal of Distance Education (TODJE) 7:2 139-153.
Babalola,J.B. 2010. Transition from Chalk Board to Digital Whiteboard: Keeping Pace
with Challenges of the 21st Century Learning Technologies in Developing
Economy. 22-27
Babu. A.R., Singh, Y.P & Sachdeva, R.K 1997. Establishing a Management Information
System. Swanso, B.E (ed.). Improving Agricultural Extension. F.A.O. Reference
Manual. Rome. Italy.
Barnes C.P. 1966. Methods of Information Handling. John Wiley & Sons Inc. N.Y. USA:
1-30.
Baumol. N.J. 1988. Entrepreneurship and Productivity. Journal of Development
Planning. 18:90.
142
Benhardsen.T. 2000. Geographic Information Systems: An Introduction 2nd
ed. John
Wiley and sons, USA: 92-115
Blaug M. 1970. An Introduction to the Economics of Education. Penguin Books, London,
U.K.
Botto. F. 1999. Dictionary of Multimedia and Internet Applications. John Willy and Sons
Ltd, London: 183.
Bowman E.H 1963. Consistency and Optimality in Managerial Decision Making. Journal
of Management Science 9:310 - 321.
Christiano. Z.J. 1981. A Survey of Measures of Capacity Utilisation. IMF Staff Papers,
Washington. USA. 28.1:144-198.
CISCO Network Solutions 2002. LAN Solutions, Guide to Higher Educational
Universities. Retrieved 20th April 2010. http://www.cisco.ac/en/us
Clare C. & Stanley G.1995. Information Systems Strategy to Design. Chapman and Hall
Publishers. London: 18 - 25.
Council for the Development of Social Science Research in Africa (CODESRIA). 2004.
CODESRIA Editorial Opinion. Bulletin. 1and 2:1- 2
Dauda, D.1983. Industrial Policy and the Nigerian Bureaucracy 1900 - 1988. African
Economic History 21:73-96.
David .H. 1959. Manpower Development and Utilisation. A Government or Private
Responsibility. Annals of the American Academy of Political and Social
Sciences. USA: 325.
Dallas Forth Worth (DFW) Orientation Services 2009. DFW Orientation Services - USA
Resources. Top College. Retrieved on 28th April, 2010
http://www.desisgoftsystems.com/websites/dforientation/langeva/USAResources/Coll
ege_Harvard.html.
Dillon.C and Backhouse.J. 2000. Information Systems Security Management in the New
Millennium . Communications of the ACM. NY, USA. 43.1
Dimmers. M.N. 1999. Fundamentals of Geography Information Systems (2nd
ed). John
Wiley and Sons. USA: 92 - 115
Dreyfus H.L. 1998. Education on the Internet. The Internet and Higher Education. A
Quarterly Review of Innovations in Post Secondary Education. London, England.1.2:
115.
143
Durotoye, .K.K 2003. Characteristics of Strategic Information Systems. Planning and
Implementation in Nigerian Manufacturing Companies. University of Ibadan.
Nigeria.
Ehiametalor E.T. 2005. Issues of Access, Equity and Private Sector Participation in the
Deregulation of Education. Akpa, G.O, Udoh, S.U and Fagbamiye, E.O (Ed.)
Deregulating the Provision and Management of Education in Nigeria. Chapter
48:267-279.
Ekwere C.E. 1990. Information Processing and Staff Productivity. A study of the
University of Cross River State, Uyo. Unpublished Thesis of the University of
Ibadan. Nigeria. xiii+214pp
Encarta Premium 2009. Encarta Encyclopedia © Microsoft Corporation Belmont,
California, USA
Erwat, E.A. 2004. Information Acquisition and Management Capacity as Correlates of
Administrators Decision-making Effectiveness in Tertiary Institutions in
Southwestern Nigeria. Thesis of the University of Ibadan, Nigeria. xvi + 236pp.
Erwat, E.A., Isah E.A and Fabunmi. M. 2008. Economic Liberalization Policy and
Higher Education Management in Nigeria. Proceedings of the National Conference
on the Transformation of Nigerian Economy. Lead City University, Ibadan, Nigeria.
3rd - 7th Dec. 2008:84.
Erwat, E.A., Isah. E.A. and Fabunmi M 2009. Economic Diversification and Education:
Perspectives from the Asian Tigers and Lessons for Nigeria. Journal of Management
and Liberal Studies Ghana.3.1:142-160.
Fabunmi, M. 2003 Management Information Systems in Babalola, J.B. (eds) Basic Text
for Educational Planning. Awemark Publishers, Ibadan
Fabunmi, M. 2004. Perspectives in Educational Planning. Odun Prints and Publishers
Ibadan, Nigeria.
Fadairo, A.T. 1984. The Effect of Crowding on Student in the New Hostels of University
of Lagos. Unpublished dissertation of the Department of Psychology University of
Lagos Nigeria.
Fadipe J.O. and Adepoju T.L. 2009. Change and Innovation Process in Formal
Organizations. Educational Management: Theories and Tasks. Babalola J.B. and
Ayeni A.O. (ed.). Macmillan, Nigeria: Chapter 26:486-516.
Fafunwa, B.A 1974. History of Western Education in Nigeria. George Allen and Unwin,
London.
144
Falola. 2009. NECO Releases SSCE 2009 Results. Punch Newspapers 17:20, 477
Thursday, 2009 September 10th
, Lagos, Nigeria.
Faludi, A.A 1982. Three Paradigms of Planning Theory. Healy, P., McDougall, G and
Thomas, M.J (Ed.) Planning Theory: Prospects for the 1980’s. Oxford UK 81-
101 Journal of spatial planning and research 15:4:101
Http://www.otb.tudelft.nl/live/pagina retrived 1st December, 2010.
Ferriera. A., Sykes. O. and Batey 2009. Planning Theory or Planning Theories: The
Hydra Model and its Implications for Educational Planning. Journal Theory of
Education and Environment 4:2:29 - 54.
http://www.cebe.leacademy.ac.uk/jebe/pdf retrieved 1st December, 2010
Folorunsho O. 2003. Essentials of Computing. Yomight Ventures, Abeokuta Nigeria: 4 -
17.
Federal Republic of Nigeria (FRN) 2004. National Policy on Education. Federal
Government Press, Lagos, Nigeria. Pp2
FRN 1960. Investment in Education: The Report of the Commission on Post Secondary
school Certificate and Higher Education in Nigeria. Federal Government Press:
Lagos. Nigeria.
Grimshow A. 1995. Information Culture and Business Performance. Northfield, U.K
Faludi, A.A. 2000. The Performance of Spatial Planning. Herts. University of
Hertfordshire Press. U.K.
Haiman,T., Scott, W.G. and Coonor, P.E. 1976. Managing the Modern Organisation (3rd
ed). Houghton Mifflin Company, Boston. USA
Hogarth R.M & Makridakisi 1981. The Value of Decision Making in a Complex
Environment: An Experimental Approach. Journal of the Institute of Management
Sciences 27.1:93 – 107.
Hopkins, C.D. and Antes, R.L. 1990. Educational Research, a Structure for Inquiry (3rd
ed) Hasca IIinois; F.Z. Peacock Publishers, Inc: 261, 276-304.
Howkridge D. 1990. Computers in Third World Countries. British Journal of
Educational Technology, London. England. 21.1. 4-20.
Hubbard T. 2003. Information Decisions and Productivity on Board Computers and
Capacity Utilisation in Trucking. The American Economic Review. Nashville,
USA.93:4.
145
IBRD 2007. World Development Report. A Publication of the World Bank. Washington,
D.C. USA.
Igani, F.K. 1990. PADIS Efforts in Improving Information Flow in African Region.
Seminar Conference held in Nairobi 31st October to 9th of November in
Bonn/Nairobi: Heinemann and S.K Nig. (ed.) Kenya. Co-ordination of
Information Systems. DSE/KNLS Pp 45.
Igbeka. J.U. 2001. Information Seeking Behaviour and Information Utilisation as
Correlates of Agricultural Engineers Productivity in Nigeria. Unpublished Ph.D
Thesis of the University of Ibadan, Ibadan. Nigeria. xii+196pp
Isah, E.A. and Ayeni, A.O. 2010. Global Digital Revolution and Africa: Transforming
Nigerian Universities to World Class Universities. African Higher Education
Review USA 3:41 - 58
JAMB 2009. UME/DE Brochure. JAMB Publishers. Lagos Nigeria.
JAMB 2010. Jamb releases UTME results. Retrieved 24th April
2010.http://www.punchonthe web.com.
Jimminez E., Lockheed.M. & Wattanawah. A 1988. The Relative Efficiency of Private
and Public Schools: The Case of Thailand. World Bank Economic Review. IBRD,
Washington,USA. 2
Johnson O.A. 2007. Enhancing Quality in Higher Education through Information and
Communication Technology in Nigeria.. Access, Equity and Quality in Higher
Education. Babalola, Akpa, Ayeni & Adedeji (ed.) Nigeria. Chapter 6:505-512.
Kadowaki N, and Suzuki R. 2007. Overview of the Wide Band Internet Working
Engineering Tests and Demonstration Satellite Projects. Journal of the National
Institute of Information and Communications Technology:. Tokyo, Japan. 54.4:3-10.
Kerschberg.L. 1990. Expert Database Systems: Knowledge/Data Management
Environment for Intelligent Information Systems. Information Systems Journal.
Britain. 15.1:247 – 259.
Klara, T. 2001. The Information Technology Approach in the Core Curriculum of
Hungary. In Education Media International (Online Learning Design) the Official
Quarterly Journal of the International Council for Educational Media: Routhledge
Publications, USA. 38: 4. 293 - 294
Kock, N. 2001. Benefits for Virtual Organisations from Distributed Groups Commission
of the ACM. 43.11:108-109. Addisson-Wesley ACM press. New York.
146
Leibscher, P; Abels. E.G; Denman. D.W 1997. Factors that Influence the Use of
Electronic Networks by Science and Engineering Faculty at Small Institutions.
Part II. Preliminary Use Indicators. Journal of American Society for Information
Science. 4.8: 496-507.
Longe R.S 2003. Introduction to Educational Planning. Basic Text in Economics of
Education. Babalola, J.B (ed.) Department of Educational Management University
of Ibadan.1- 38.
Longe, R.S. 2000. Introduction to Educational Planning. Department of Educational
Management, University of Ibadan. Nigeria.
Lundu. M.C & Mbewe G. 1993. Factors Restraining the Formulation and Implementation
of a National Information Policy (NIP) Process: The Zambian Experience.
African Journal of Library and Information Science. Nigeria. 3.1: 23-33
Macguigan J.R., Mayer, R.C & Harris F. 2005. Managerial Economics: Application
Strategy and Tactics (9th ed) Southwestern Publishing Co. USA.
Marttey J.J. 2005. The Challenges of University Governance in the 21st Century.
CODESSRIA Bulletin. 1 & 2:9-14.
Mbat, D.O. 1992. Issues and Problems Facing National Agencies and Institutions
Responsible for Human Resources Development (ASCON). Spectrum Books Ltd,
Ibadan Nigeria. 154 -160.
Mcleod. R. Jr 1985. Management Information Systems, A Computer Study of Computer
Based Information Systems. Prentice Hall publishing company. Texas. 4 -51.
Moriano A. & Rodden. T. 1996. Comparative Information Sharing: Developing a Shared
Objective Service. Computer Journal of the British Computer Society. U.K. 39.6:
Oxford University press.
Mondy.R.W.1990. Management and Organisational Behaviour. Allyn and Acon
Publishers. USA. 693.
Middle States Commission in Higher Education of America Reports.( MSCHEA.) 2004.
Assessing Students Learning and Educational Effectiveness. Philadelphia. USA.:
5 – 8.
Nnebe, H.E 2008. National Policy on Information Technology (IT). Policies of the
Federal Republic of Nigeria. The Obasanjo years (1999-2007). 3:45-91.
Neil D. and Anderson, A. 1972. Marketing Information: Three Square Meal a Day
Required for the Food Industry. In Management Adviser. July - August ed. NY, USA.
19.
147
Norton J.H. 1970. Setting Up a Personal Information Retrieval System. Journal of
Management Review. 59. 3:1 - 39.
National University Commission (NUC) 2005. Monday Memo 4(9) Feb 28th
2005.
Nwankwo J.I 1982. Establishment of Management Information Systems in Sind
Province. UNESCO Technical Report. UNESCO. Paris. France. Project
PAK/77/038.
Nwankwo J.I. 1981. Educational Planning, Theory and Methods. Izahsons. Publishers
Ltd Pakistan.
Nwankwo, J.I. 1985. Fundamentals of Management Information Systems. Spectrum
books, Ibadan. Nigeria.
Obanya. A.I. 1999. Higher Education for an Emergent Nigeria (Faculty of Education
50th Anniversary lecture) University of Ibadan. Nigeria, Heinemann Educational
Books, Nigeria. 648 - 694.
Ojedele, P. and Ilusanya G. 2006. Planning and Policy of Higher Education in Nigeria.
Educational Management: Thoughts and Practice. Babalola,J.B., Ayeni, A.O,
Adedeji, S.O, Suleiman and Ariskewuyo (ed.) Codat Publications. Nigeria Chapter
3:48-80.
Okhiria, P. 8th
February, 2007. Zinox Spearheads ICT Revolution in Nigerian Schools.
Vanguard Thursday February 8th:
:37.
Okoli, E.C. and Umeh, E. 2007. The Place of Improved Communication Technology in
the Management of Nigerian University Education. Access Equity and Quality in
Higher Education. Babalola,J.B, Akpa,G.O, Ayeni,A.O & Adedeji,S.O (ed)
Nigeria. Chapter 6:523-541.
Okojie J. 2007. Quest for Long Term Resource Allocation Information Data.
http://www.nuc.org.
Okonjo C. 2000. The Quiet Revolution: On Creating an Information - Age Education
System for Nigeria. Spectrum Books Limited. Ibadan. Nigeria.
Okunola O. 2009. Improving Student Performance Through Computer Aided Formative
Assessment. Africa Journal of Technology and Policy. Ghana. 5.1: 101-111.
Oladele, J.O. 2007. Guidance and Counseling: A Functional Approach. Focus on the 6-3-
3-4 Educational System. John - Lads Publishers Ltd, Lagos Nigeria:108-133.
148
Olopoenia S.F 2006. Influence of Comprehensive in English Language, Age, Home and
School Environments on Students Achievement in Secondary School‟s
Economics in Ibadan. PhD Thesis. ICEE, University of Ibadan. Xiii + 203pp.
Oni F.A. 2004. Enhancing the Performance of Library Operations through Appropriate
Information Technology in Madu, E.C (ed.) Technology for Information
Management and Service in Developing Countries. Eri. Coleman Publications,
Ibadan. Nigeria 3:95-105.
Onwuma. N. 2007. Utilisation of Information and Communication Technology in
Schools: Problems and Suggestions. Access, Equity and Quality in Higher
Education. Babalola, J.B., Akpa, G.O., Ayeni A.O, Adedeji S.O. (ed.) Nigeria
Chapter 6:488 - 496.
Onwubiko, C.P.C 1999. Information Repackaging for the 21st Century Rural Nigerian.
African Journal of Library, Archives and Information Sciences. Archlib Nigeria
9:2:187 - 194.
Opeke, R.O. 1984. Information Consciousness as a Factor in Organisational Decision-
making; the Case of Ogun State Ministry of Education. Unpublished Ph.D Thesis of
the university of Ibadan xii+174 pp.
Opeke, R.O. 1986. Information Flow Pattern in Public Organisations. Journal of
Research, Educational Administration and Planning (1). A Publication of the Nigeria
Association of Education and Planning Western Zonal Chapter. Nigeria: 56 - 62.
Osinowo H.O. 2001. Impact of Overcrowding-Related Stress on the Psychological Health
of University Students in Ibadan Metropolis, Nigeria. Implications for Policy Review
and Counseling. Africa Journal of Educational Management, University of Ibadan.
6:138-139.
Osokoya, I.O. 2003. 6-3-3-4 Education in Nigeria. History, Strategies, Issues and
Problems. Laurel Educational Publishers, Ibadan. Nigeria.
Owens, I. Wilson. T.D. and Abel. A. 1997. Information and Business Performance: A
Study of Information Systems and Services in High Performing Companies. Journal
of Librarianship and Information Science. 29:19 - 28
Oyebade.S.A, Oladipo, S.A and Adetoro, J. 2007. Determinants and Strategies for
Quality Assurance in Nigerian University Education. Babalola, J.B, Labode, P.,
Onuka,A., Oni, S., Olatokun, W and Agbonlahor.R (ed.) Towards Quality in African
Higher Education. Chapter 24: 330-347
Plunkett, W.R.A and Attner, R.F 1994. Introduction to management. Woodsworth
Publishing Co. Belmount California, USA Pp 223 234, 643 646
149
Poor, A. 1990. The Data Exchange: Dow & Jones. Irwin Hornewood Publishers Ilinious,
USA Pp 7-8.
Popoola, S.O. 2000. Records Management Programme in Nigeria: A Survey of Osun
State Civil Service, Osogbo. Nigerian libraries Journal Vol.34, No 1. Publication by
Nigeria Library Association Pp 37-39.
Psacharaopolous. G. 1973. Investment and Returns to Higher Education. World Bank
Working Papers. Washington D.C, USA.
Psacharaopolous. G. and Patrinos, H. 2002. Returns to Investment in Education: a Further
Update. World Bank Policy Research Working Papers No. 2881
Psacharaopolous. G. 1994. Returns to Investment in Education: A Global Update. World
Development 22:1325-1343.
Ricks, E., Swafford and Gow. C. 1992. Information Image Management. Cincinnati
Southwestern Publishing Company, USA: 8 - 11.
Rogers E.M 1995. Diffusion of Innovations 4th edition. The Free Press, New York, USA.
Schultz T.W 1961. Investment in Human Capital (Presidential Address Delivered at the
Annual Meeting of the American Economic Association, St. Loius, M.O.,
December 1960). Journal of American Economic Review. 51: 1-17, 13-50.
Columbia University press.
Schultz T.W. 1971. Investment in Human Capital. The Free New York, USA.
Sivert, M.C. 1996. Full Text Information Retrieval: Introduction. Journal of the American
Society for Information Science. John Wiley and Sons, USA. 47(4):261-262.
Soyibo.A. 1985. Academic Planning in the University of Ibadan, Nigeria. The Manager
Department of Educational Management, University of Ibadan. 1: 11 -15.
Starr D.R. 1998. Virtual Education: Education. The Internet and Higher Education. A
Quarterly Review of Innovations in Post Secondary Education. London 1.2: 160.
Sturgess W, Dunn. J., Davies L. 2001. Young Children‟s Perception of their Relationship
with Family Members: Links with Family Setting, Friendship and Adjustment.
International Journal of Behaviour Development, Germany. 25.6: 521-529.
Turban. E., Mclean. E and Wetherbe. J. 2007. Information Technologies and
Management 4th (ed). John Wiley and Sons Inc. USA:125 – 169.
150
University of Maryland 2002. Wireless Area Networks (WAN): Advantages &
disadvantages. Retrieved 20th April 2010. http://www.silicom.com/whitepapers/lan-
wan/2002/htm
University of Pennsylvania 2009. Classroom Design and Higher Education. Pennsylvania
State University, University Park. Retrieved 29th April 2010.
http//www.edfaciities.orgtr_design_HE.cfm
University Quarterly News, 2009. A Quarterly Publication of Bayero University Kano,
Nigeria. 4.3:26-28.
Uys, P. 2000. Managing Tertiary Education in a Global Vertical Environment.
http://www.globe-online.com. Retrieved 26th October 2009.
Wabe T. 1974. Issues in Manpower Forecasting. Problems of Manpower Forecasting,
Saxon House. England.
Wolfgang, S.F. 1966. Planning Without Facts. Harvard University Press, Cambridge
Massachusetts, U.S.A.
Wonnacott, T.H and Wonnacott R.J. 1977. Introductory Statistics for Business
Economics 2nd
ed. John Wiley Inc. New York pp 3.
World Development Indicators 2007. Portrait of the Global Economy. IBRD Publications
Washington, D.C USA.
World Development Indicators 2008. Tata McGraw Hill Publishing Company. India.
World University Ranking 2010. World Best 400 Universities. Retrieved 29th April 2010
http//www.usanews.com/articles/education/worldbest universities.html.
Zill, N. 1994. Characteristics of Teenage Mothers. Talking Points for the American
Enterprise. Institute Conference on the Cost of Teenage Child Bearings
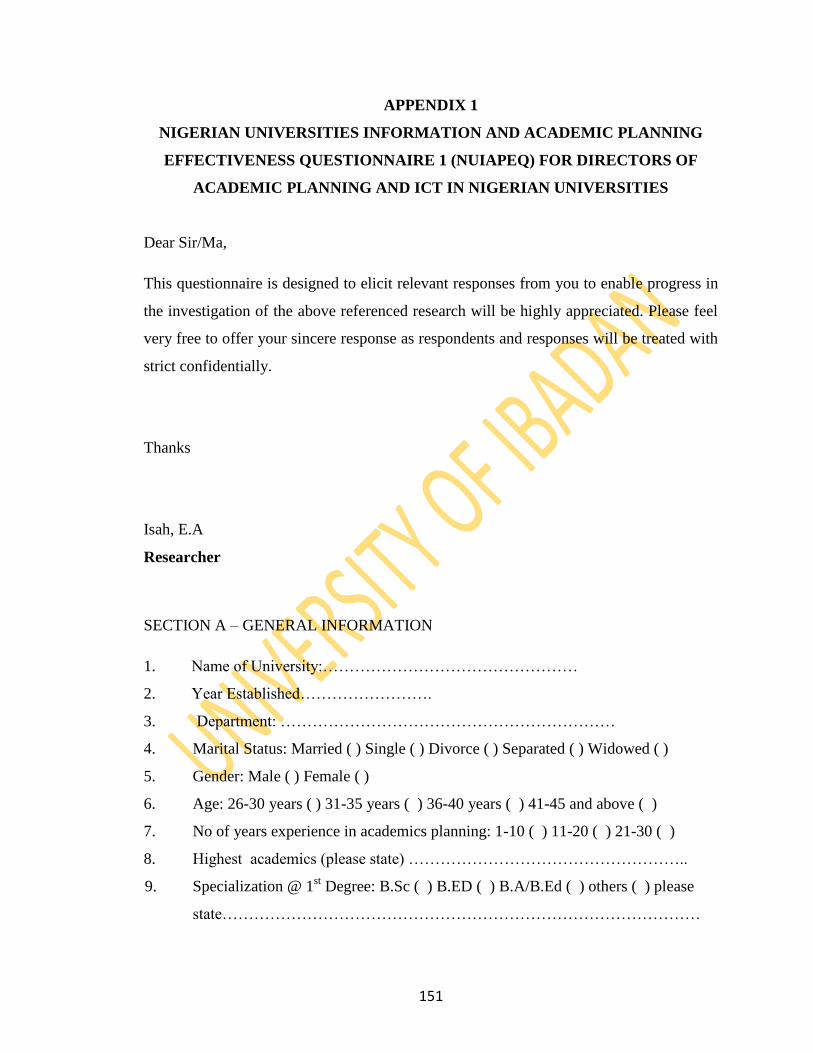
151
APPENDIX 1
NIGERIAN UNIVERSITIES INFORMATION AND ACADEMIC PLANNING
EFFECTIVENESS QUESTIONNAIRE 1 (NUIAPEQ) FOR DIRECTORS OF
ACADEMIC PLANNING AND ICT IN NIGERIAN UNIVERSITIES
Dear Sir/Ma,
This questionnaire is designed to elicit relevant responses from you to enable progress in
the investigation of the above referenced research will be highly appreciated. Please feel
very free to offer your sincere response as respondents and responses will be treated with
strict confidentially.
Thanks
Isah, E.A
Researcher
SECTION A – GENERAL INFORMATION
1. Name of University:…………………………………………
2. Year Established…………………….
3. Department: ………………………………………………………
4. Marital Status: Married ( ) Single ( ) Divorce ( ) Separated ( ) Widowed ( )
5. Gender: Male ( ) Female ( )
6. Age: 26-30 years ( ) 31-35 years ( ) 36-40 years ( ) 41-45 and above ( )
7. No of years experience in academics planning: 1-10 ( ) 11-20 ( ) 21-30 ( )
8. Highest academics (please state) ……………………………………………..
9. Specialization @ 1st Degree: B.Sc ( ) B.ED ( ) B.A/B.Ed ( ) others ( ) please
state………………………………………………………………………………
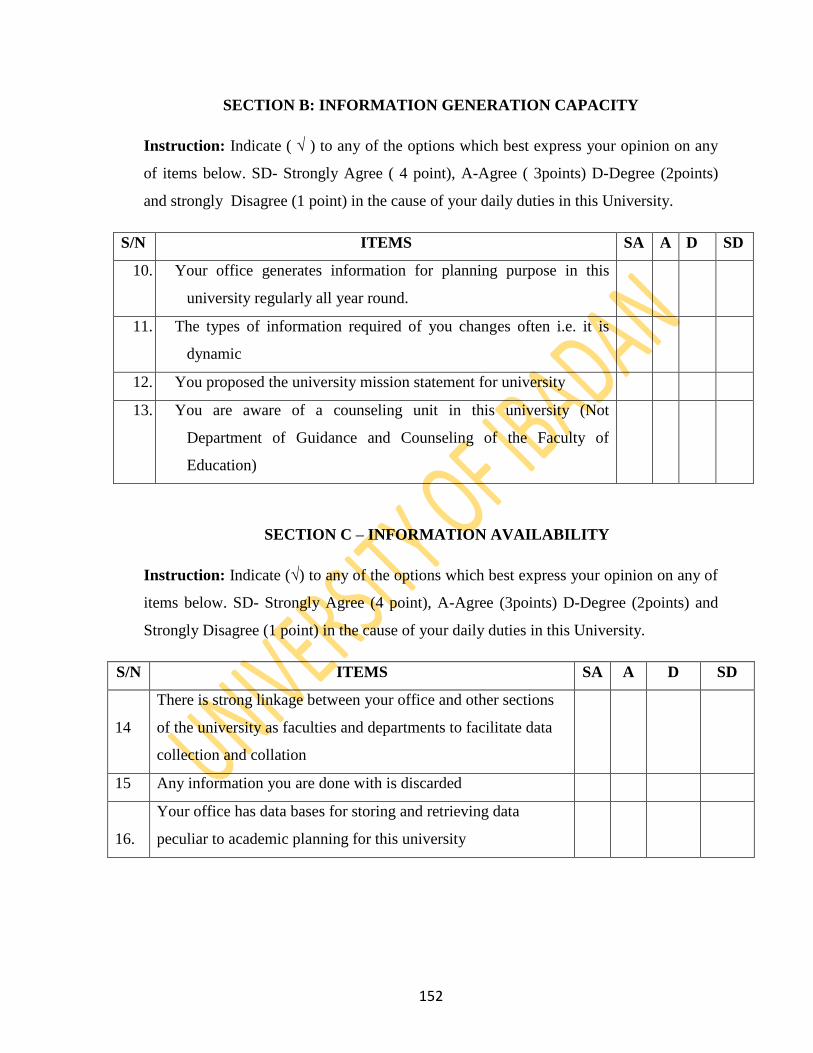
152
SECTION B: INFORMATION GENERATION CAPACITY
Instruction: Indicate ( √ ) to any of the options which best express your opinion on any
of items below. SD- Strongly Agree ( 4 point), A-Agree ( 3points) D-Degree (2points)
and strongly Disagree (1 point) in the cause of your daily duties in this University.
S/N ITEMS SA A D SD
10. Your office generates information for planning purpose in this
university regularly all year round.
11. The types of information required of you changes often i.e. it is
dynamic
12. You proposed the university mission statement for university
13. You are aware of a counseling unit in this university (Not
Department of Guidance and Counseling of the Faculty of
Education)
SECTION C – INFORMATION AVAILABILITY
Instruction: Indicate (√) to any of the options which best express your opinion on any of
items below. SD- Strongly Agree (4 point), A-Agree (3points) D-Degree (2points) and
Strongly Disagree (1 point) in the cause of your daily duties in this University.
S/N ITEMS SA A D SD
14
There is strong linkage between your office and other sections
of the university as faculties and departments to facilitate data
collection and collation
15 Any information you are done with is discarded
16.
Your office has data bases for storing and retrieving data
peculiar to academic planning for this university
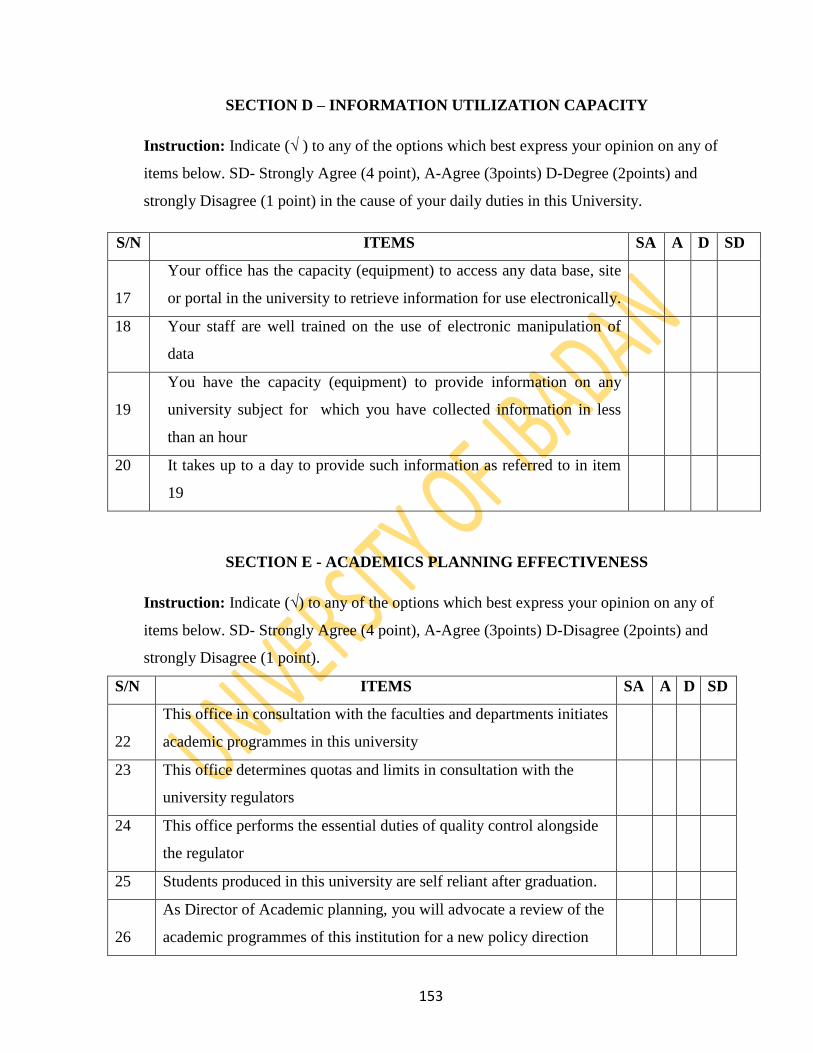
153
SECTION D – INFORMATION UTILIZATION CAPACITY
Instruction: Indicate (√ ) to any of the options which best express your opinion on any of
items below. SD- Strongly Agree (4 point), A-Agree (3points) D-Degree (2points) and
strongly Disagree (1 point) in the cause of your daily duties in this University.
S/N ITEMS SA A D SD
17
Your office has the capacity (equipment) to access any data base, site
or portal in the university to retrieve information for use electronically.
18 Your staff are well trained on the use of electronic manipulation of
data
19
You have the capacity (equipment) to provide information on any
university subject for which you have collected information in less
than an hour
20 It takes up to a day to provide such information as referred to in item
19
SECTION E - ACADEMICS PLANNING EFFECTIVENESS
Instruction: Indicate (√) to any of the options which best express your opinion on any of
items below. SD- Strongly Agree (4 point), A-Agree (3points) D-Disagree (2points) and
strongly Disagree (1 point).
S/N ITEMS SA A D SD
22
This office in consultation with the faculties and departments initiates
academic programmes in this university
23 This office determines quotas and limits in consultation with the
university regulators
24 This office performs the essential duties of quality control alongside
the regulator
25 Students produced in this university are self reliant after graduation.
26
As Director of Academic planning, you will advocate a review of the
academic programmes of this institution for a new policy direction
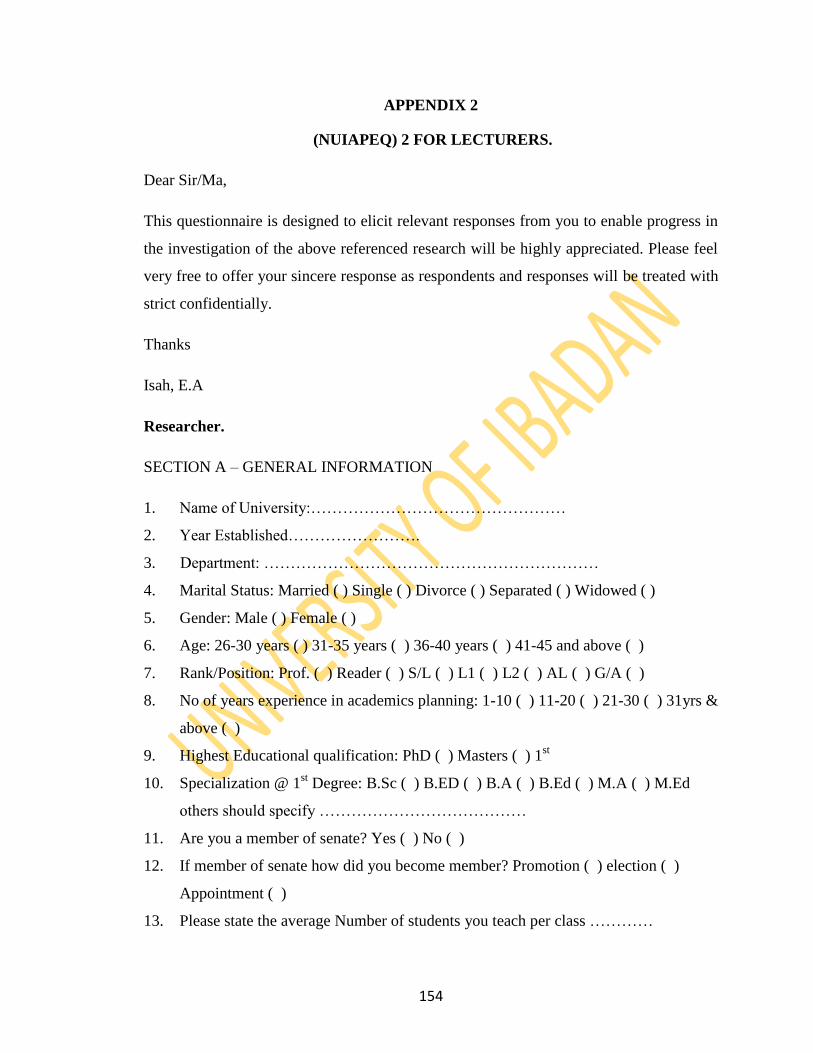
154
APPENDIX 2
(NUIAPEQ) 2 FOR LECTURERS.
Dear Sir/Ma,
This questionnaire is designed to elicit relevant responses from you to enable progress in
the investigation of the above referenced research will be highly appreciated. Please feel
very free to offer your sincere response as respondents and responses will be treated with
strict confidentially.
Thanks
Isah, E.A
Researcher.
SECTION A – GENERAL INFORMATION
1. Name of University:…………………………………………
2. Year Established…………………….
3. Department: ………………………………………………………
4. Marital Status: Married ( ) Single ( ) Divorce ( ) Separated ( ) Widowed ( )
5. Gender: Male ( ) Female ( )
6. Age: 26-30 years ( ) 31-35 years ( ) 36-40 years ( ) 41-45 and above ( )
7. Rank/Position: Prof. ( ) Reader ( ) S/L ( ) L1 ( ) L2 ( ) AL ( ) G/A ( )
8. No of years experience in academics planning: 1-10 ( ) 11-20 ( ) 21-30 ( ) 31yrs &
above ( )
9. Highest Educational qualification: PhD ( ) Masters ( ) 1st
10. Specialization @ 1st Degree: B.Sc ( ) B.ED ( ) B.A ( ) B.Ed ( ) M.A ( ) M.Ed
others should specify …………………………………
11. Are you a member of senate? Yes ( ) No ( )
12. If member of senate how did you become member? Promotion ( ) election ( )
Appointment ( )
13. Please state the average Number of students you teach per class …………
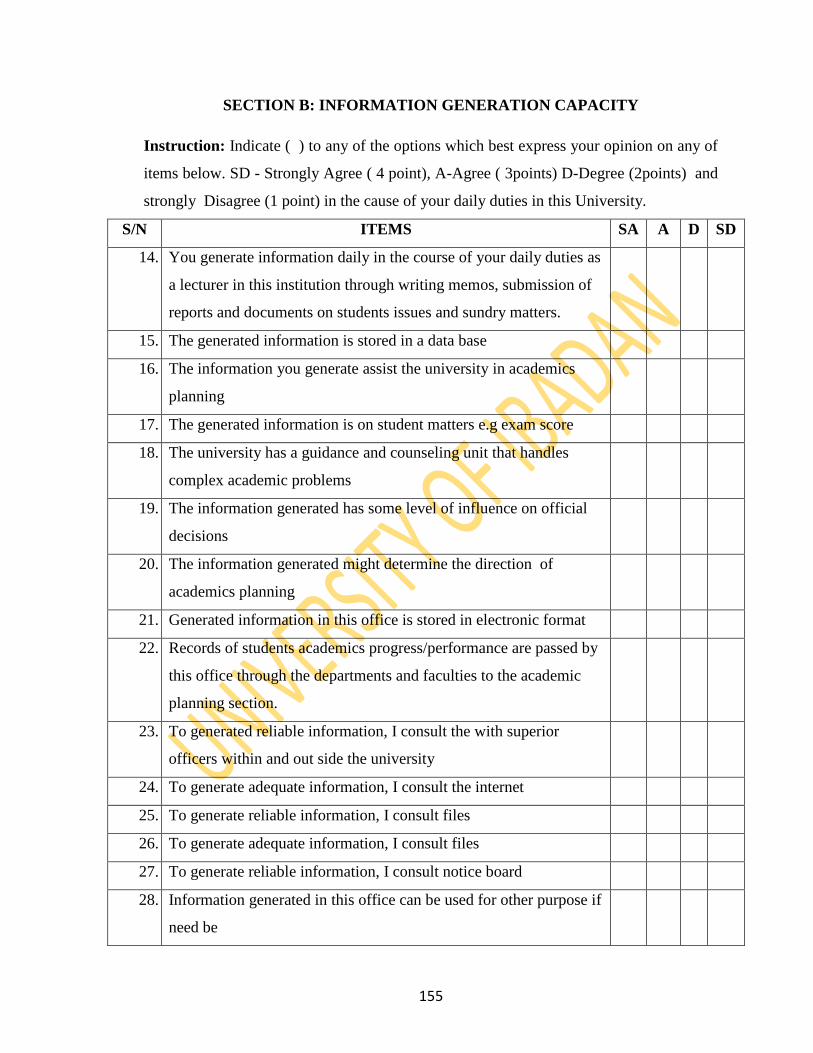
155
SECTION B: INFORMATION GENERATION CAPACITY
Instruction: Indicate ( ) to any of the options which best express your opinion on any of
items below. SD - Strongly Agree ( 4 point), A-Agree ( 3points) D-Degree (2points) and
strongly Disagree (1 point) in the cause of your daily duties in this University.
S/N ITEMS SA A D SD
14. You generate information daily in the course of your daily duties as
a lecturer in this institution through writing memos, submission of
reports and documents on students issues and sundry matters.
15. The generated information is stored in a data base
16. The information you generate assist the university in academics
planning
17. The generated information is on student matters e.g exam score
18. The university has a guidance and counseling unit that handles
complex academic problems
19. The information generated has some level of influence on official
decisions
20. The information generated might determine the direction of
academics planning
21. Generated information in this office is stored in electronic format
22. Records of students academics progress/performance are passed by
this office through the departments and faculties to the academic
planning section.
23. To generated reliable information, I consult the with superior
officers within and out side the university
24. To generate adequate information, I consult the internet
25. To generate reliable information, I consult files
26. To generate adequate information, I consult files
27. To generate reliable information, I consult notice board
28. Information generated in this office can be used for other purpose if
need be
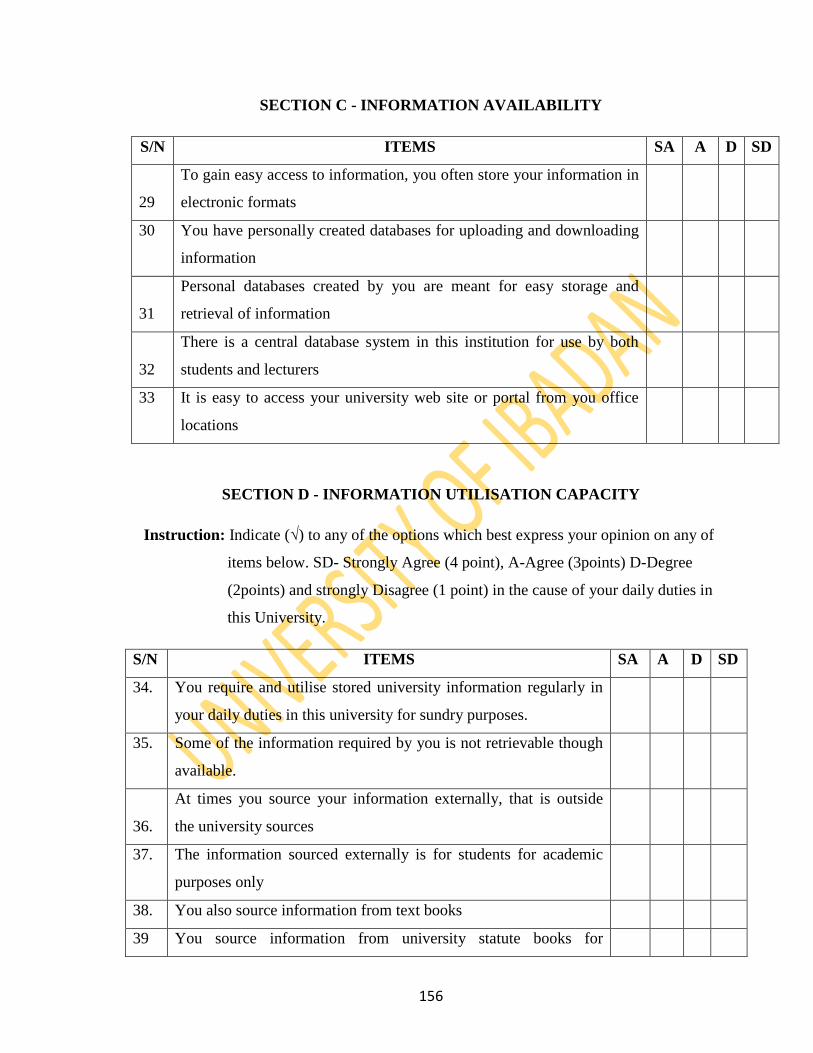
156
SECTION C - INFORMATION AVAILABILITY
S/N ITEMS SA A D SD
29
To gain easy access to information, you often store your information in
electronic formats
30 You have personally created databases for uploading and downloading
information
31
Personal databases created by you are meant for easy storage and
retrieval of information
32
There is a central database system in this institution for use by both
students and lecturers
33 It is easy to access your university web site or portal from you office
locations
SECTION D - INFORMATION UTILISATION CAPACITY
Instruction: Indicate (√) to any of the options which best express your opinion on any of
items below. SD- Strongly Agree (4 point), A-Agree (3points) D-Degree
(2points) and strongly Disagree (1 point) in the cause of your daily duties in
this University.
S/N ITEMS SA A D SD
34. You require and utilise stored university information regularly in
your daily duties in this university for sundry purposes.
35. Some of the information required by you is not retrievable though
available.
36.
At times you source your information externally, that is outside
the university sources
37. The information sourced externally is for students for academic
purposes only
38. You also source information from text books
39 You source information from university statute books for
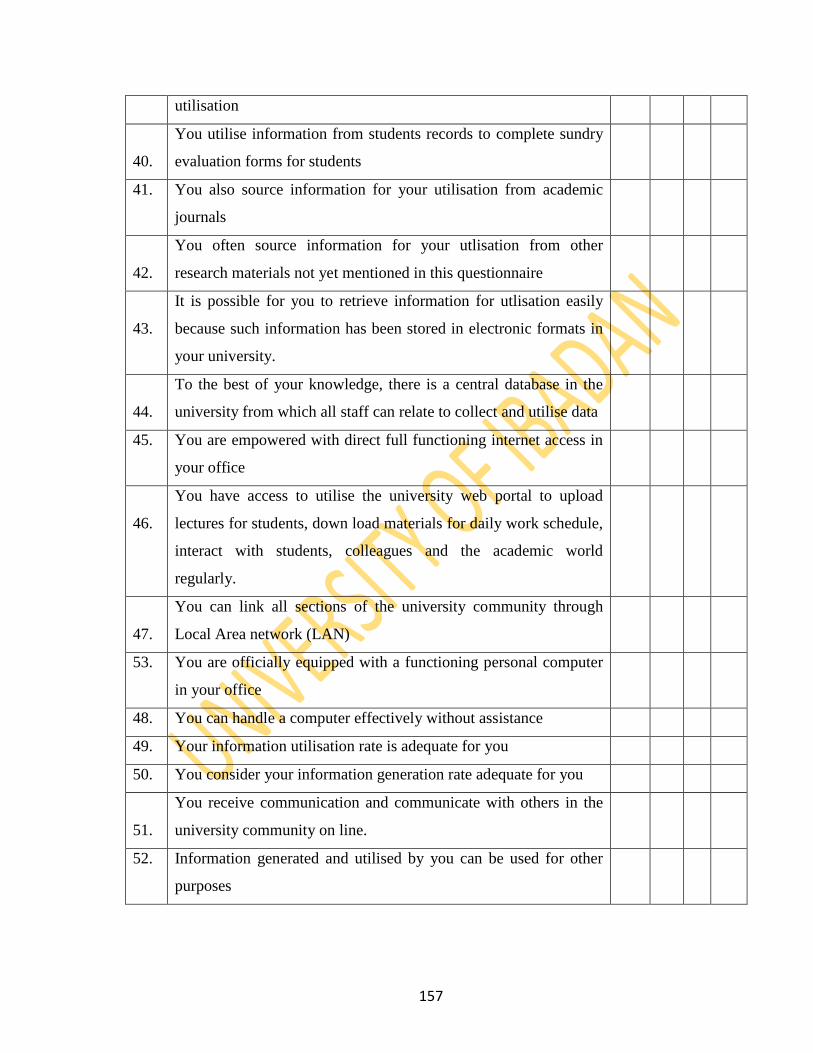
157
utilisation
40.
You utilise information from students records to complete sundry
evaluation forms for students
41. You also source information for your utilisation from academic
journals
42.
You often source information for your utlisation from other
research materials not yet mentioned in this questionnaire
43.
It is possible for you to retrieve information for utlisation easily
because such information has been stored in electronic formats in
your university.
44.
To the best of your knowledge, there is a central database in the
university from which all staff can relate to collect and utilise data
45. You are empowered with direct full functioning internet access in
your office
46.
You have access to utilise the university web portal to upload
lectures for students, down load materials for daily work schedule,
interact with students, colleagues and the academic world
regularly.
47.
You can link all sections of the university community through
Local Area network (LAN)
53. You are officially equipped with a functioning personal computer
in your office
48. You can handle a computer effectively without assistance
49. Your information utilisation rate is adequate for you
50. You consider your information generation rate adequate for you
51.
You receive communication and communicate with others in the
university community on line.
52. Information generated and utilised by you can be used for other
purposes
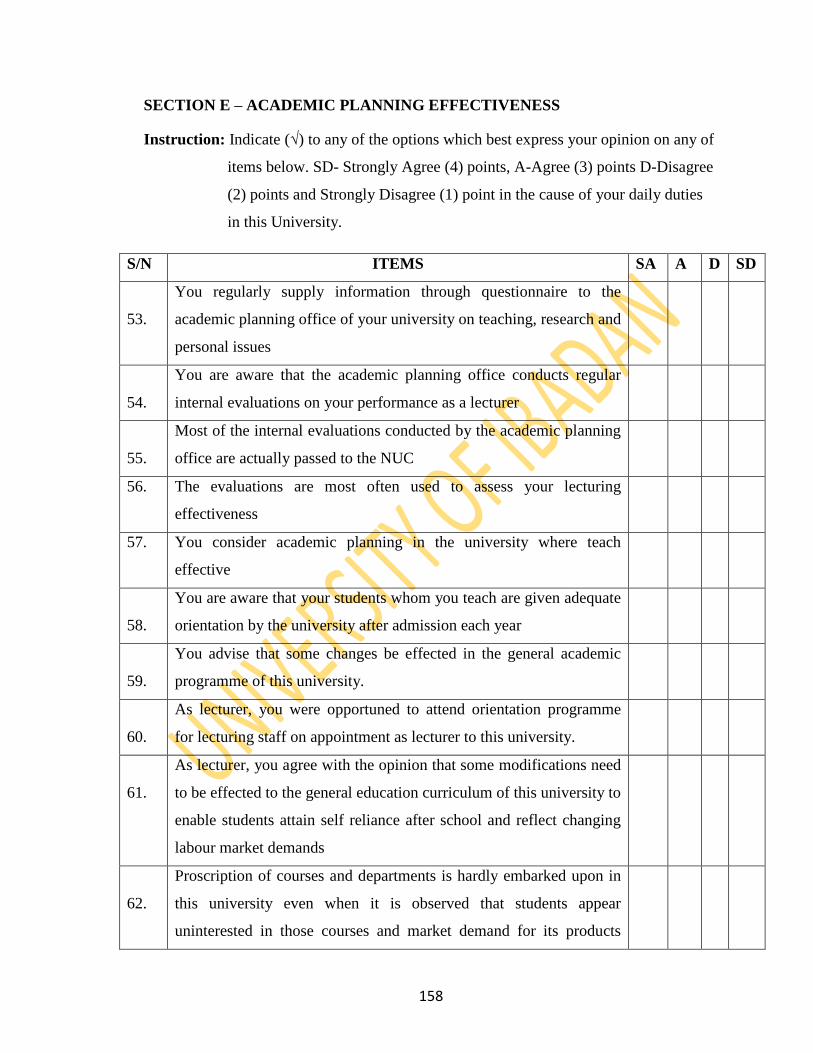
158
SECTION E – ACADEMIC PLANNING EFFECTIVENESS
Instruction: Indicate (√) to any of the options which best express your opinion on any of
items below. SD- Strongly Agree (4) points, A-Agree (3) points D-Disagree
(2) points and Strongly Disagree (1) point in the cause of your daily duties
in this University.
S/N ITEMS SA A D SD
53.
You regularly supply information through questionnaire to the
academic planning office of your university on teaching, research and
personal issues
54.
You are aware that the academic planning office conducts regular
internal evaluations on your performance as a lecturer
55.
Most of the internal evaluations conducted by the academic planning
office are actually passed to the NUC
56. The evaluations are most often used to assess your lecturing
effectiveness
57. You consider academic planning in the university where teach
effective
58.
You are aware that your students whom you teach are given adequate
orientation by the university after admission each year
59.
You advise that some changes be effected in the general academic
programme of this university.
60.
As lecturer, you were opportuned to attend orientation programme
for lecturing staff on appointment as lecturer to this university.
61.
As lecturer, you agree with the opinion that some modifications need
to be effected to the general education curriculum of this university to
enable students attain self reliance after school and reflect changing
labour market demands
62.
Proscription of courses and departments is hardly embarked upon in
this university even when it is observed that students appear
uninterested in those courses and market demand for its products
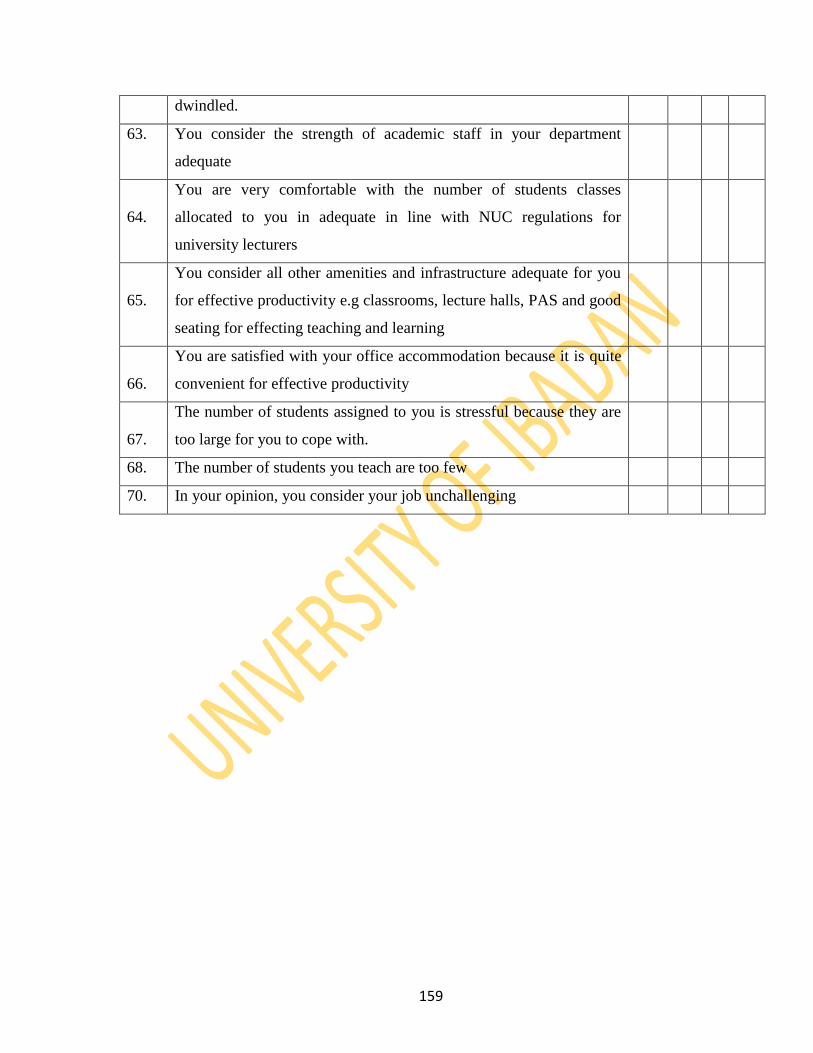
159
dwindled.
63. You consider the strength of academic staff in your department
adequate
64.
You are very comfortable with the number of students classes
allocated to you in adequate in line with NUC regulations for
university lecturers
65.
You consider all other amenities and infrastructure adequate for you
for effective productivity e.g classrooms, lecture halls, PAS and good
seating for effecting teaching and learning
66.
You are satisfied with your office accommodation because it is quite
convenient for effective productivity
67.
The number of students assigned to you is stressful because they are
too large for you to cope with.
68. The number of students you teach are too few
70. In your opinion, you consider your job unchallenging
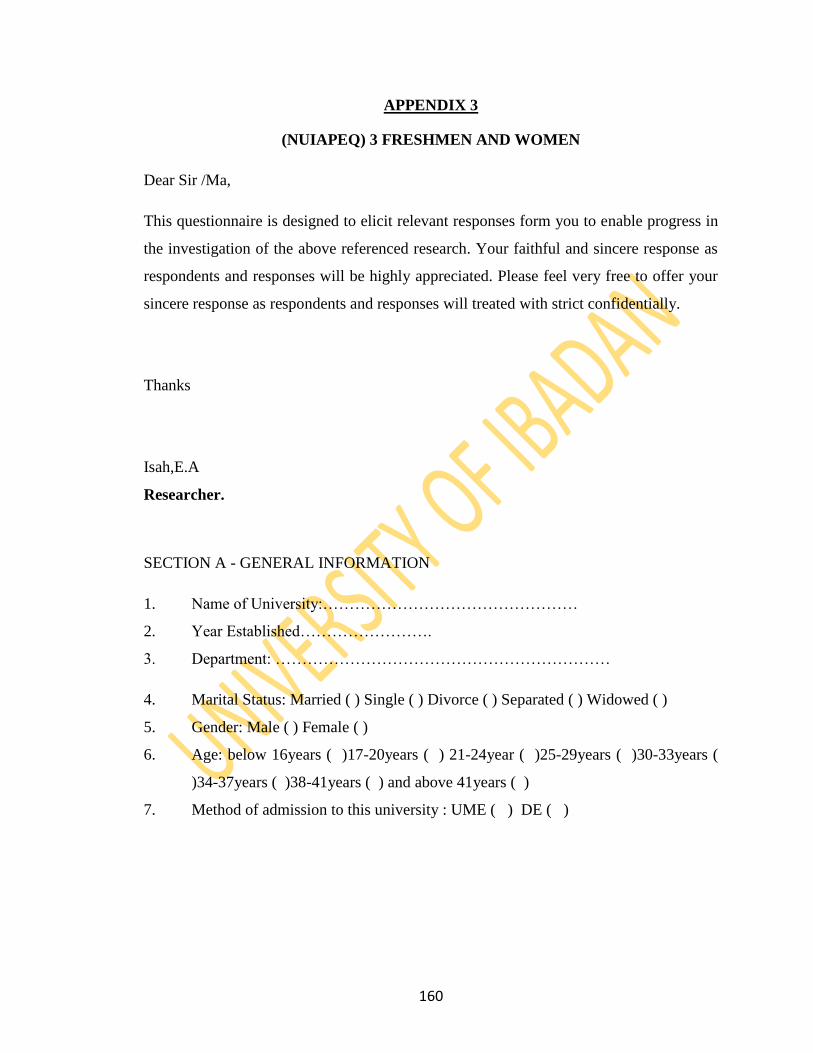
160
APPENDIX 3
(NUIAPEQ) 3 FRESHMEN AND WOMEN
Dear Sir /Ma,
This questionnaire is designed to elicit relevant responses form you to enable progress in
the investigation of the above referenced research. Your faithful and sincere response as
respondents and responses will be highly appreciated. Please feel very free to offer your
sincere response as respondents and responses will treated with strict confidentially.
Thanks
Isah,E.A
Researcher.
SECTION A - GENERAL INFORMATION
1. Name of University:…………………………………………
2. Year Established…………………….
3. Department: ………………………………………………………
4. Marital Status: Married ( ) Single ( ) Divorce ( ) Separated ( ) Widowed ( )
5. Gender: Male ( ) Female ( )
6. Age: below 16years ( )17-20years ( ) 21-24year ( )25-29years ( )30-33years (
)34-37years ( )38-41years ( ) and above 41years ( )
7. Method of admission to this university : UME ( ) DE ( )
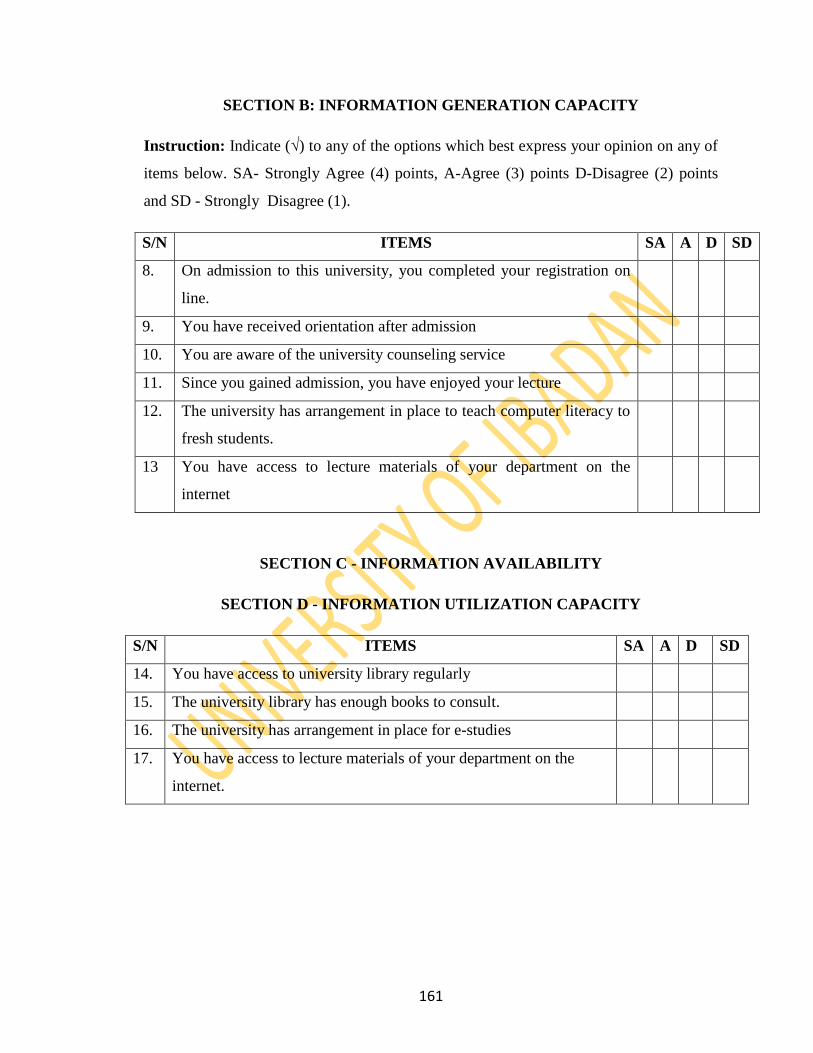
161
SECTION B: INFORMATION GENERATION CAPACITY
Instruction: Indicate (√) to any of the options which best express your opinion on any of
items below. SA- Strongly Agree (4) points, A-Agree (3) points D-Disagree (2) points
and SD - Strongly Disagree (1).
S/N ITEMS SA A D SD
8. On admission to this university, you completed your registration on
line.
9. You have received orientation after admission
10. You are aware of the university counseling service
11. Since you gained admission, you have enjoyed your lecture
12. The university has arrangement in place to teach computer literacy to
fresh students.
13 You have access to lecture materials of your department on the
internet
SECTION C - INFORMATION AVAILABILITY
SECTION D - INFORMATION UTILIZATION CAPACITY
S/N ITEMS SA A D SD
14. You have access to university library regularly
15. The university library has enough books to consult.
16. The university has arrangement in place for e-studies
17. You have access to lecture materials of your department on the
internet.
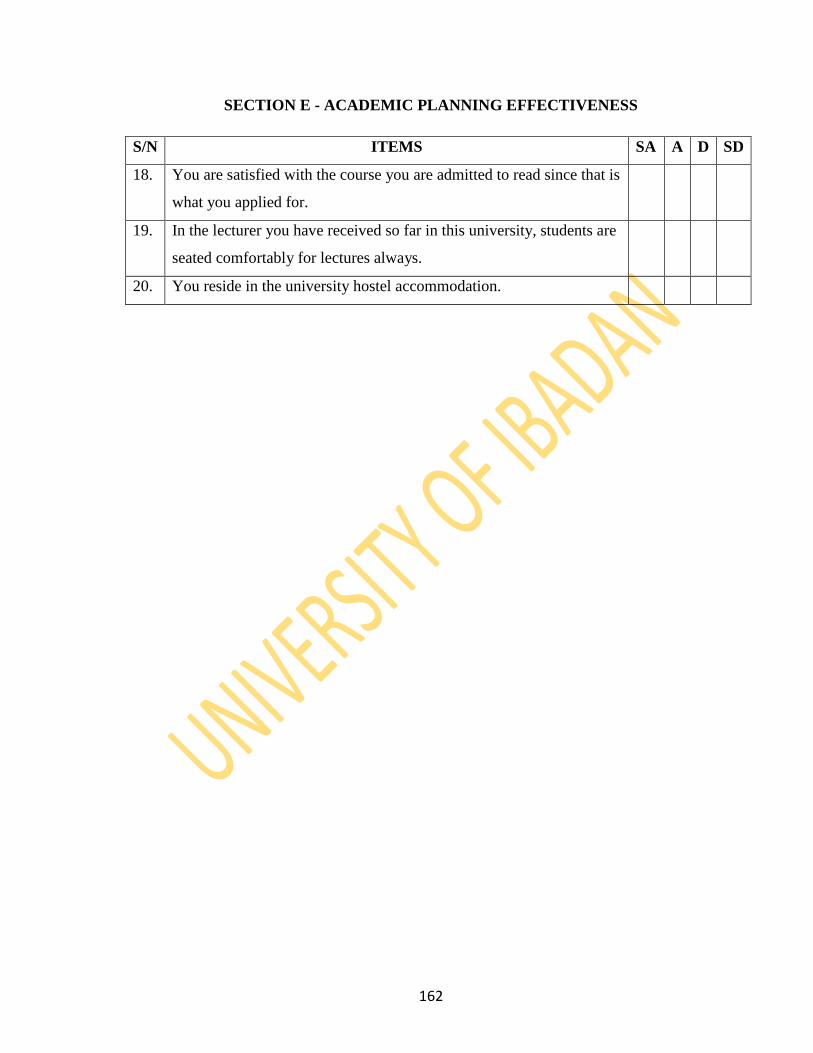
162
SECTION E - ACADEMIC PLANNING EFFECTIVENESS
S/N ITEMS SA A D SD
18. You are satisfied with the course you are admitted to read since that is
what you applied for.
19. In the lecturer you have received so far in this university, students are
seated comfortably for lectures always.
20. You reside in the university hostel accommodation.
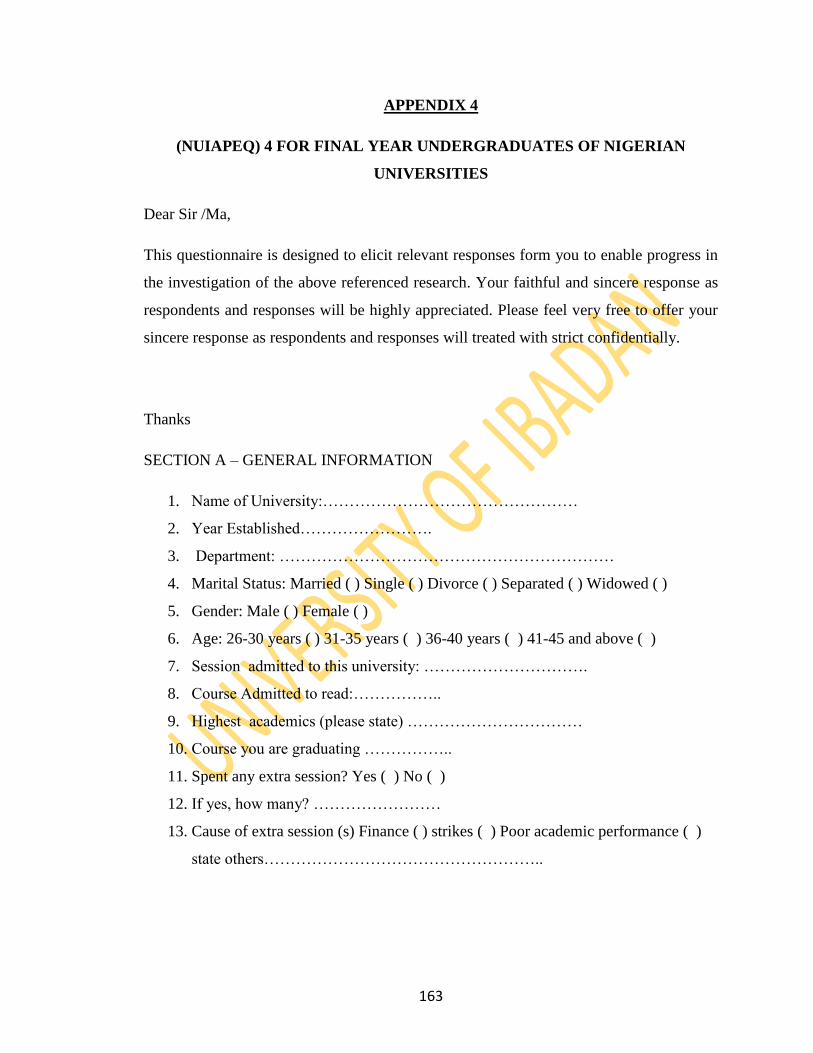
163
APPENDIX 4
(NUIAPEQ) 4 FOR FINAL YEAR UNDERGRADUATES OF NIGERIAN
UNIVERSITIES
Dear Sir /Ma,
This questionnaire is designed to elicit relevant responses form you to enable progress in
the investigation of the above referenced research. Your faithful and sincere response as
respondents and responses will be highly appreciated. Please feel very free to offer your
sincere response as respondents and responses will treated with strict confidentially.
Thanks
SECTION A – GENERAL INFORMATION
1. Name of University:…………………………………………
2. Year Established…………………….
3. Department: ………………………………………………………
4. Marital Status: Married ( ) Single ( ) Divorce ( ) Separated ( ) Widowed ( )
5. Gender: Male ( ) Female ( )
6. Age: 26-30 years ( ) 31-35 years ( ) 36-40 years ( ) 41-45 and above ( )
7. Session admitted to this university: ………………………….
8. Course Admitted to read:……………..
9. Highest academics (please state) ……………………………
10. Course you are graduating ……………..
11. Spent any extra session? Yes ( ) No ( )
12. If yes, how many? ……………………
13. Cause of extra session (s) Finance ( ) strikes ( ) Poor academic performance ( )
state others……………………………………………..
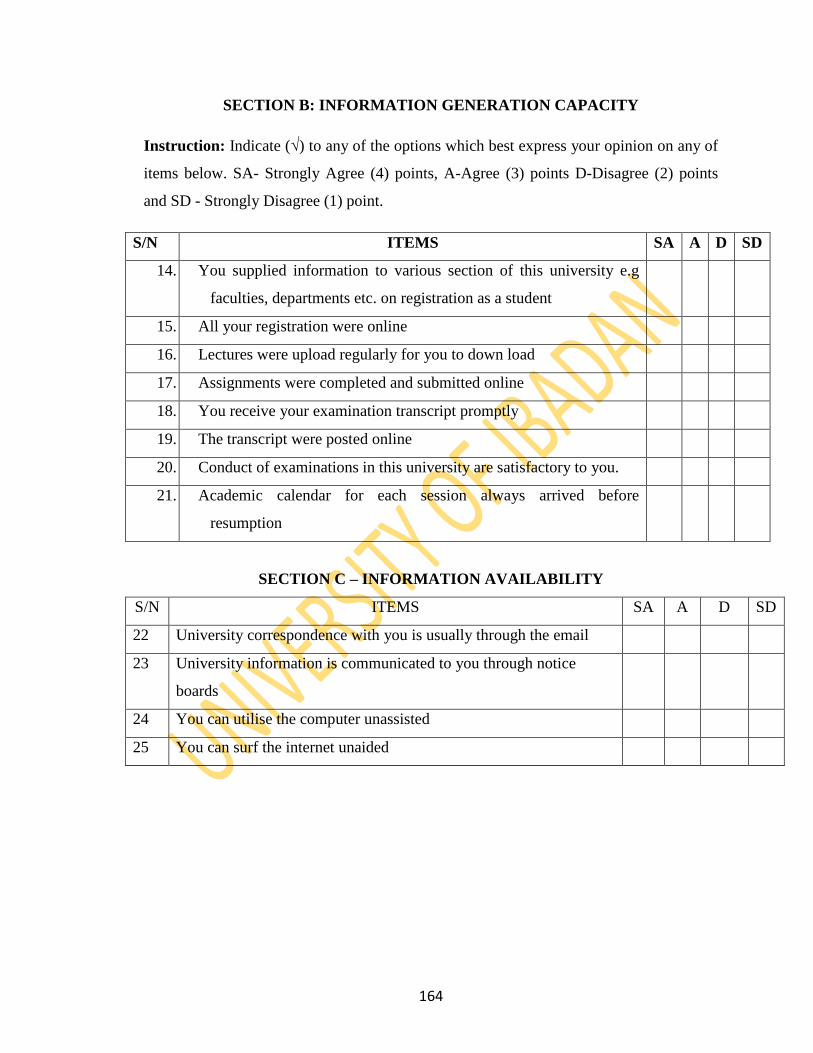
164
SECTION B: INFORMATION GENERATION CAPACITY
Instruction: Indicate (√) to any of the options which best express your opinion on any of
items below. SA- Strongly Agree (4) points, A-Agree (3) points D-Disagree (2) points
and SD - Strongly Disagree (1) point.
S/N ITEMS SA A D SD
14. You supplied information to various section of this university e.g
faculties, departments etc. on registration as a student
15. All your registration were online
16. Lectures were upload regularly for you to down load
17. Assignments were completed and submitted online
18. You receive your examination transcript promptly
19. The transcript were posted online
20. Conduct of examinations in this university are satisfactory to you.
21. Academic calendar for each session always arrived before
resumption
SECTION C – INFORMATION AVAILABILITY
S/N ITEMS SA A D SD
22 University correspondence with you is usually through the email
23 University information is communicated to you through notice
boards
24 You can utilise the computer unassisted
25 You can surf the internet unaided
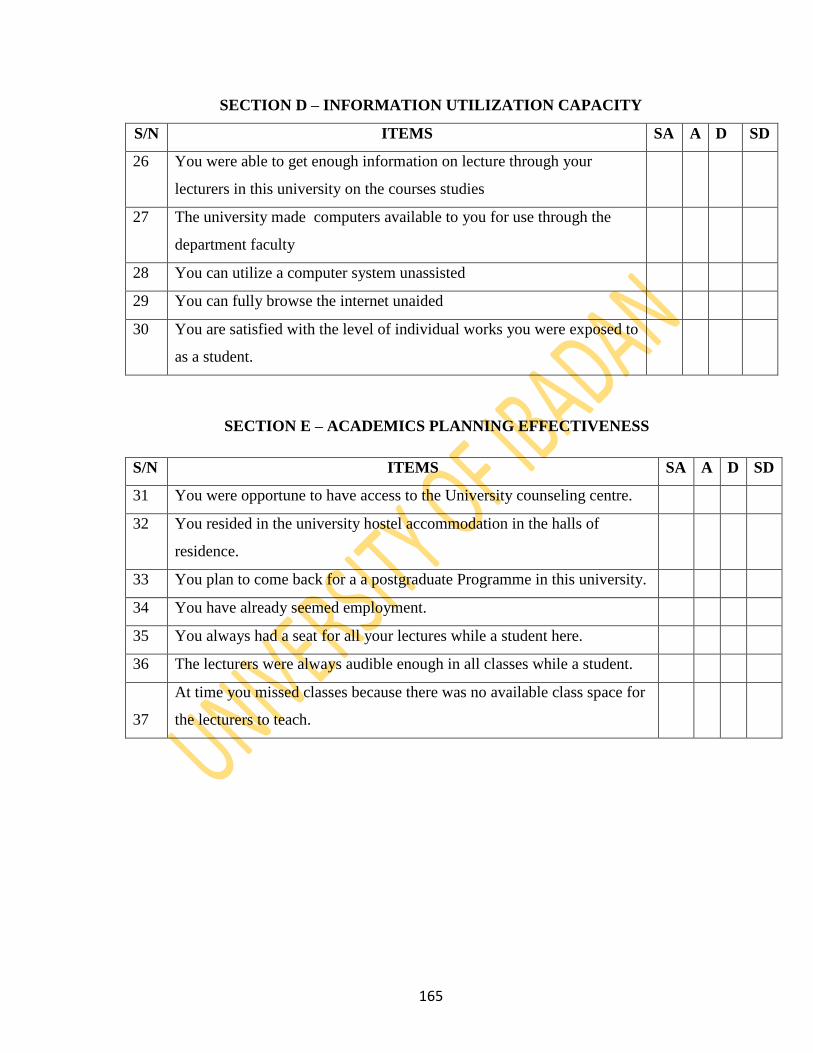
165
SECTION D – INFORMATION UTILIZATION CAPACITY
S/N ITEMS SA A D SD
26 You were able to get enough information on lecture through your
lecturers in this university on the courses studies
27 The university made computers available to you for use through the
department faculty
28 You can utilize a computer system unassisted
29 You can fully browse the internet unaided
30 You are satisfied with the level of individual works you were exposed to
as a student.
SECTION E – ACADEMICS PLANNING EFFECTIVENESS
S/N ITEMS SA A D SD
31 You were opportune to have access to the University counseling centre.
32 You resided in the university hostel accommodation in the halls of
residence.
33 You plan to come back for a a postgraduate Programme in this university.
34 You have already seemed employment.
35 You always had a seat for all your lectures while a student here.
36 The lecturers were always audible enough in all classes while a student.
37
At time you missed classes because there was no available class space for
the lecturers to teach.
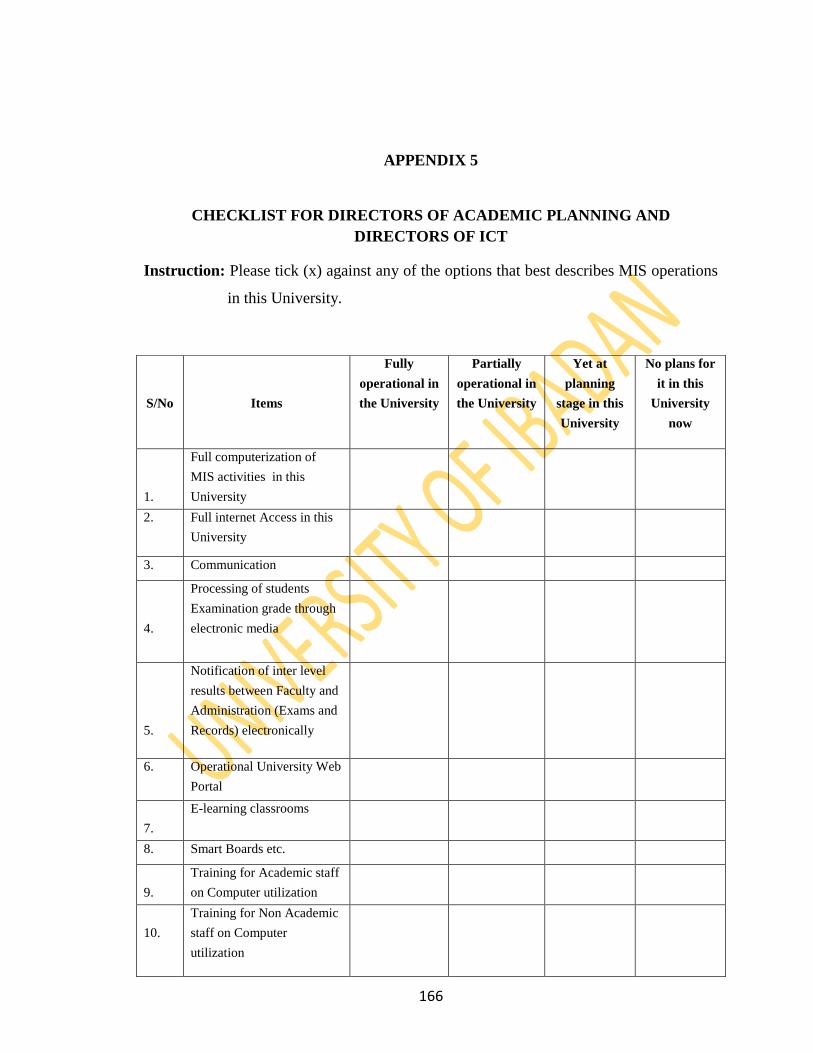
166
APPENDIX 5
CHECKLIST FOR DIRECTORS OF ACADEMIC PLANNING AND
DIRECTORS OF ICT
Instruction: Please tick (x) against any of the options that best describes MIS operations
in this University.
S/No
Items
Fully
operational in
the University
Partially
operational in
the University
Yet at
planning
stage in this
University
No plans for
it in this
University
now
1.
Full computerization of
MIS activities in this
University
2. Full internet Access in this
University
3. Communication
4.
Processing of students
Examination grade through
electronic media
5.
Notification of inter level
results between Faculty and
Administration (Exams and
Records) electronically
6. Operational University Web
Portal
7.
E-learning classrooms
8. Smart Boards etc.
9.
Training for Academic staff
on Computer utilization
10.
Training for Non Academic
staff on Computer
utilization
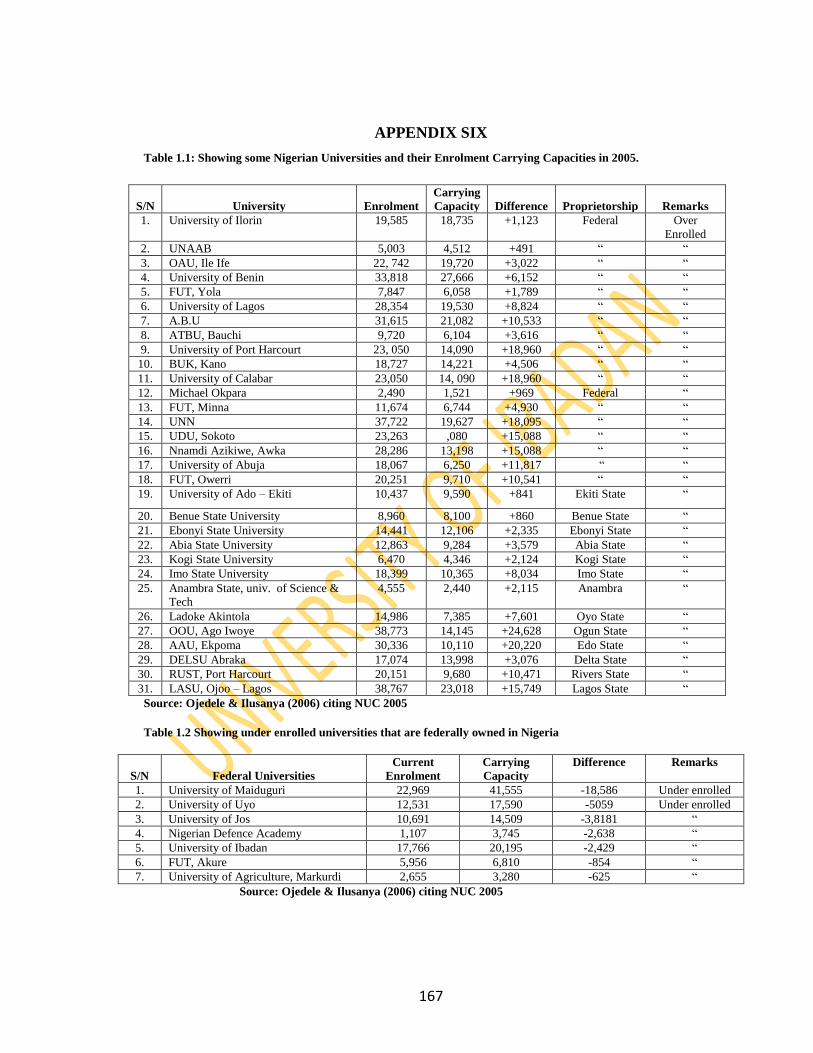
167
APPENDIX SIX
Table 1.1: Showing some Nigerian Universities and their Enrolment Carrying Capacities in 2005.
S/N
University
Enrolment
Carrying
Capacity
Difference
Proprietorship
Remarks
1. University of Ilorin 19,585 18,735 +1,123 Federal Over
Enrolled
2. UNAAB 5,003 4,512 +491 “ “
3. OAU, Ile Ife 22, 742 19,720 +3,022 “ “
4. University of Benin 33,818 27,666 +6,152 “ “
5. FUT, Yola 7,847 6,058 +1,789 “ “
6. University of Lagos 28,354 19,530 +8,824 “ “
7. A.B.U 31,615 21,082 +10,533 “ “
8. ATBU, Bauchi 9,720 6,104 +3,616 “ “
9. University of Port Harcourt 23, 050 14,090 +18,960 “ “
10. BUK, Kano 18,727 14,221 +4,506 “ “
11. University of Calabar 23,050 14, 090 +18,960 “ “
12. Michael Okpara 2,490 1,521 +969 Federal “
13. FUT, Minna 11,674 6,744 +4,930 “ “
14. UNN 37,722 19,627 +18,095 “ “
15. UDU, Sokoto 23,263 ,080 +15,088 “ “
16. Nnamdi Azikiwe, Awka 28,286 13,198 +15,088 “ “
17. University of Abuja 18,067 6,250 +11,817 “ “
18. FUT, Owerri 20,251 9,710 +10,541 “ “
19. University of Ado – Ekiti 10,437 9,590 +841 Ekiti State “
20. Benue State University 8,960 8,100 +860 Benue State “
21. Ebonyi State University 14,441 12,106 +2,335 Ebonyi State “
22. Abia State University 12,863 9,284 +3,579 Abia State “
23. Kogi State University 6,470 4,346 +2,124 Kogi State “
24. Imo State University 18,399 10,365 +8,034 Imo State “
25. Anambra State, univ. of Science &
Tech
4,555 2,440 +2,115 Anambra “
26. Ladoke Akintola 14,986 7,385 +7,601 Oyo State “
27. OOU, Ago Iwoye 38,773 14,145 +24,628 Ogun State “
28. AAU, Ekpoma 30,336 10,110 +20,220 Edo State “
29. DELSU Abraka 17,074 13,998 +3,076 Delta State “
30. RUST, Port Harcourt 20,151 9,680 +10,471 Rivers State “
31. LASU, Ojoo – Lagos 38,767 23,018 +15,749 Lagos State “
Source: Ojedele & Ilusanya (2006) citing NUC 2005
Table 1.2 Showing under enrolled universities that are federally owned in Nigeria
S/N
Federal Universities
Current
Enrolment
Carrying
Capacity
Difference Remarks
1. University of Maiduguri 22,969 41,555 -18,586 Under enrolled
2. University of Uyo 12,531 17,590 -5059 Under enrolled
3. University of Jos 10,691 14,509 -3,8181 “
4. Nigerian Defence Academy 1,107 3,745 -2,638 “
5. University of Ibadan 17,766 20,195 -2,429 “
6. FUT, Akure 5,956 6,810 -854 “
7. University of Agriculture, Markurdi 2,655 3,280 -625 “
Source: Ojedele & Ilusanya (2006) citing NUC 2005
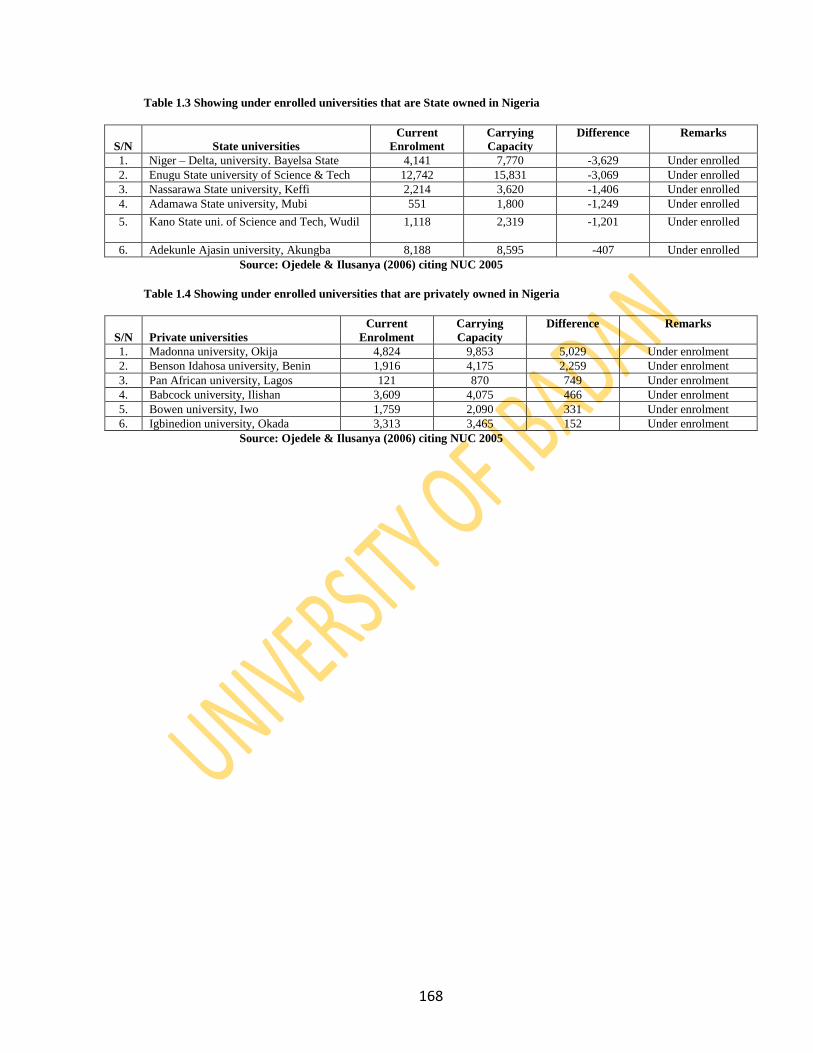
168
Table 1.3 Showing under enrolled universities that are State owned in Nigeria
S/N
State universities
Current
Enrolment
Carrying
Capacity
Difference Remarks
1. Niger – Delta, university. Bayelsa State 4,141 7,770 -3,629 Under enrolled
2. Enugu State university of Science & Tech 12,742 15,831 -3,069 Under enrolled
3. Nassarawa State university, Keffi 2,214 3,620 -1,406 Under enrolled
4. Adamawa State university, Mubi 551 1,800 -1,249 Under enrolled
5. Kano State uni. of Science and Tech, Wudil 1,118 2,319 -1,201 Under enrolled
6. Adekunle Ajasin university, Akungba 8,188 8,595 -407 Under enrolled
Source: Ojedele & Ilusanya (2006) citing NUC 2005
Table 1.4 Showing under enrolled universities that are privately owned in Nigeria
S/N
Private universities
Current
Enrolment
Carrying
Capacity
Difference Remarks
1. Madonna university, Okija 4,824 9,853 5,029 Under enrolment
2. Benson Idahosa university, Benin 1,916 4,175 2,259 Under enrolment
3. Pan African university, Lagos 121 870 749 Under enrolment
4. Babcock university, Ilishan 3,609 4,075 466 Under enrolment
5. Bowen university, Iwo 1,759 2,090 331 Under enrolment
6. Igbinedion university, Okada 3,313 3,465 152 Under enrolment
Source: Ojedele & Ilusanya (2006) citing NUC 2005
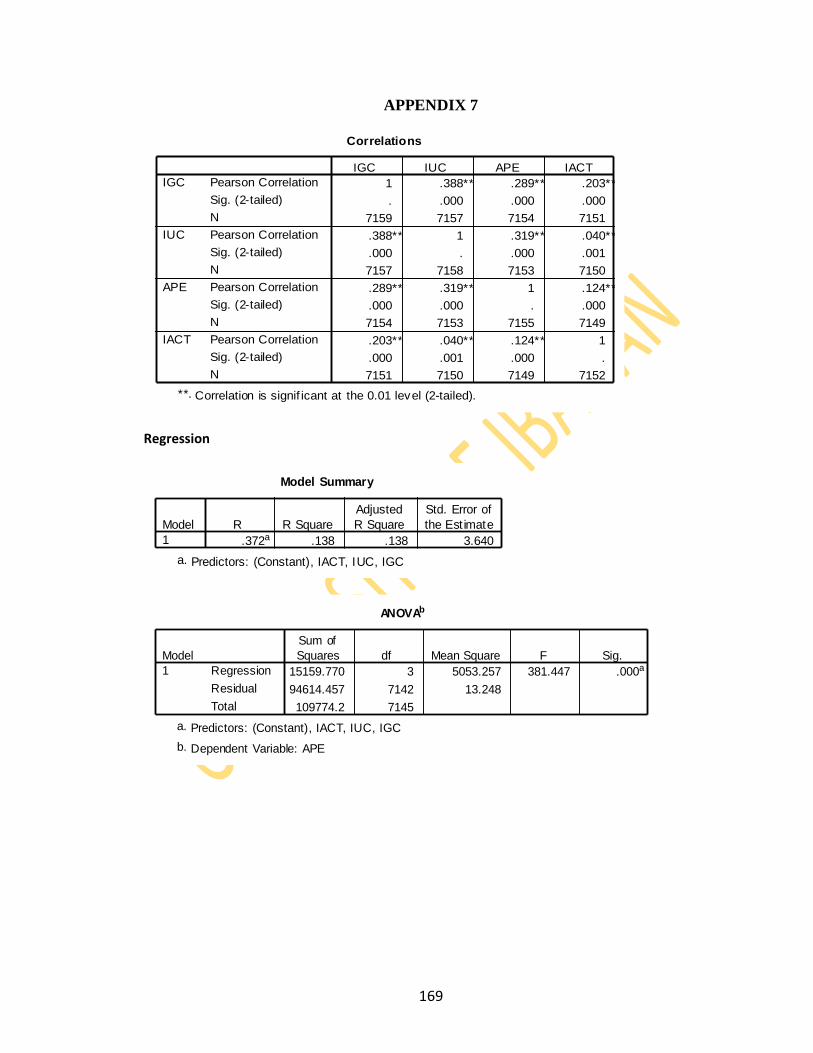
169
APPENDIX 7
Regression
Correlations
1 .388** .289** .203**
. .000 .000 .000
7159 7157 7154 7151
.388** 1 .319** .040**
.000 . .000 .001
7157 7158 7153 7150
.289** .319** 1 .124**
.000 .000 . .000
7154 7153 7155 7149
.203** .040** .124** 1
.000 .001 .000 .
7151 7150 7149 7152
Pearson Correlation
Sig. (2-tailed)
N
Pearson Correlation
Sig. (2-tailed)
N
Pearson Correlation
Sig. (2-tailed)
N
Pearson Correlation
Sig. (2-tailed)
N
IGC
IUC
APE
IACT
IGC IUC APE IACT
Correlation is signif icant at the 0.01 level (2-tailed).**.
Model Summary
.372a .138 .138 3.640
Model
1
R R Square
Adjusted
R Square
Std. Error of
the Est imate
Predictors: (Constant), IACT, IUC, IGCa.
ANOVAb
15159.770 3 5053.257 381.447 .000a
94614.457 7142 13.248
109774.2 7145
Regression
Residual
Total
Model
1
Sum of
Squares df Mean Square F Sig.
Predictors: (Constant), IACT, IUC, IGCa.
Dependent Variable: APEb.
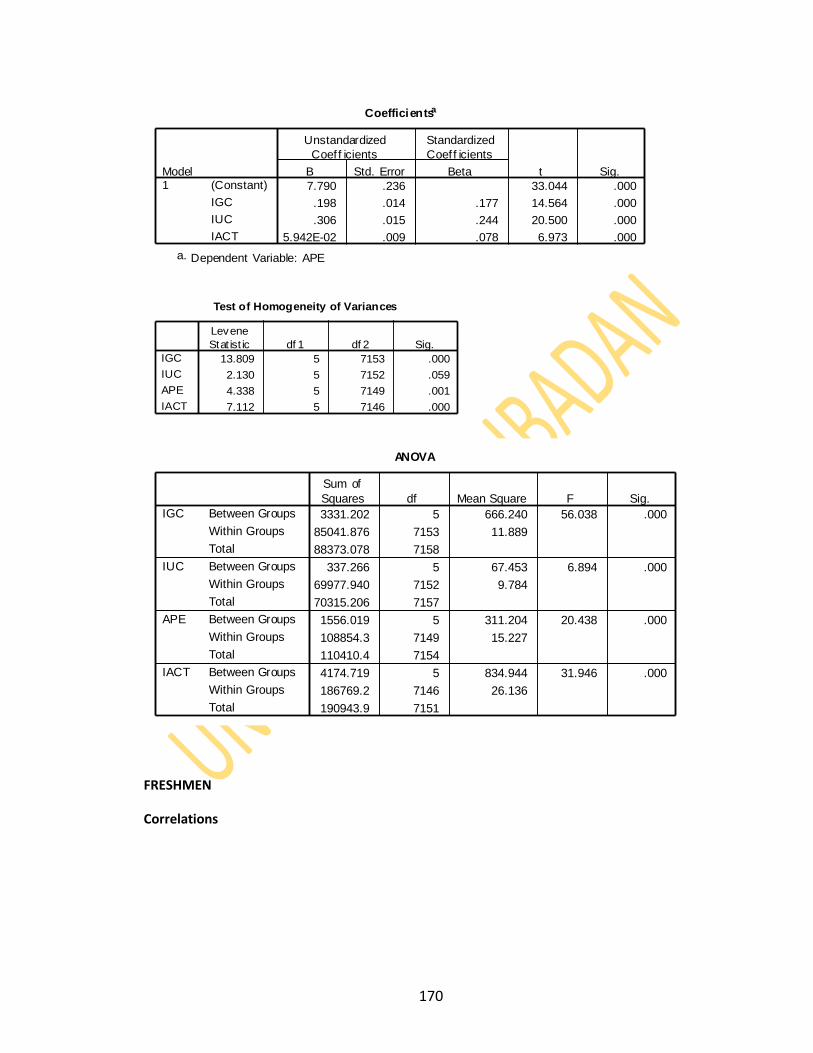
170
FRESHMEN
Correlations
Coefficientsa
7.790 .236 33.044 .000
.198 .014 .177 14.564 .000
.306 .015 .244 20.500 .000
5.942E-02 .009 .078 6.973 .000
(Constant)
IGC
IUC
IACT
Model1
B Std. Error
Unstandardized
Coef f icients
Beta
Standardized
Coef f icients
t Sig.
Dependent Variable: APEa.
Test of Homogeneity of Variances
13.809 5 7153 .000
2.130 5 7152 .059
4.338 5 7149 .001
7.112 5 7146 .000
IGC
IUC
APE
IACT
Levene
Stat ist ic df 1 df 2 Sig.
ANOVA
3331.202 5 666.240 56.038 .000
85041.876 7153 11.889
88373.078 7158
337.266 5 67.453 6.894 .000
69977.940 7152 9.784
70315.206 7157
1556.019 5 311.204 20.438 .000
108854.3 7149 15.227
110410.4 7154
4174.719 5 834.944 31.946 .000
186769.2 7146 26.136
190943.9 7151
Between Groups
Within Groups
Total
Between Groups
Within Groups
Total
Between Groups
Within Groups
Total
Between Groups
Within Groups
Total
IGC
IUC
APE
IACT
Sum of
Squares df Mean Square F Sig.
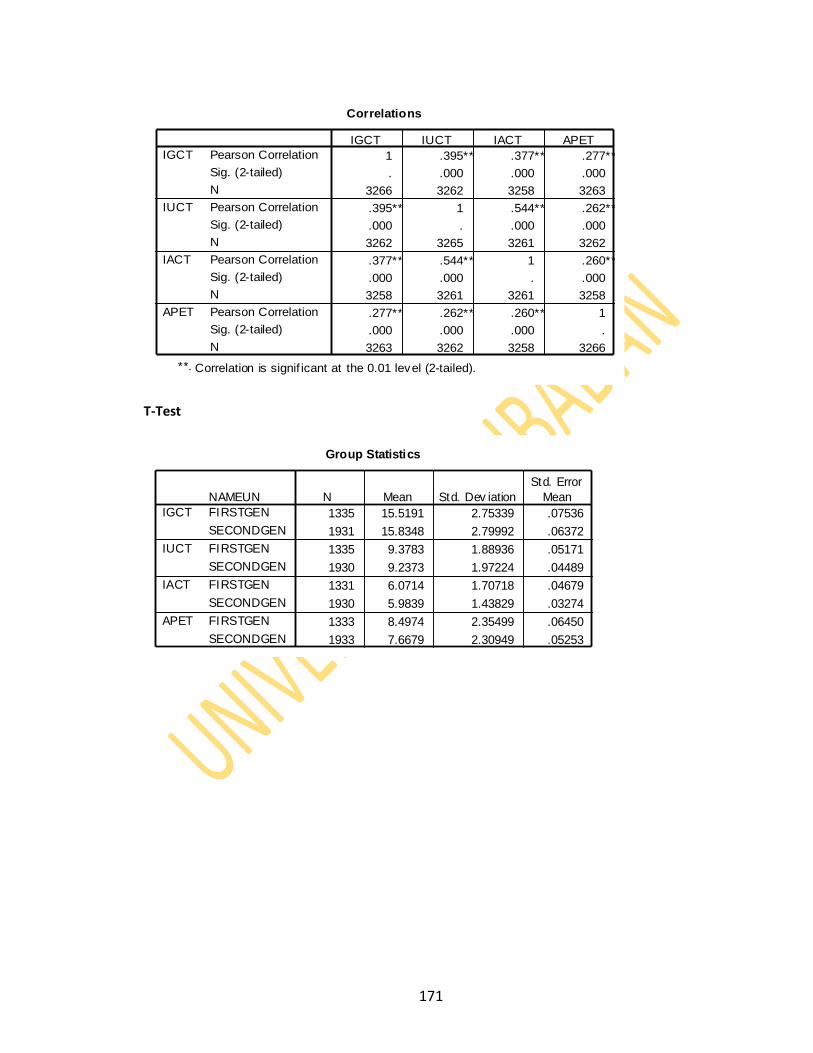
171
T-Test
Correlations
1 .395** .377** .277**
. .000 .000 .000
3266 3262 3258 3263
.395** 1 .544** .262**
.000 . .000 .000
3262 3265 3261 3262
.377** .544** 1 .260**
.000 .000 . .000
3258 3261 3261 3258
.277** .262** .260** 1
.000 .000 .000 .
3263 3262 3258 3266
Pearson Correlation
Sig. (2-tailed)
N
Pearson Correlation
Sig. (2-tailed)
N
Pearson Correlation
Sig. (2-tailed)
N
Pearson Correlation
Sig. (2-tailed)
N
IGCT
IUCT
IACT
APET
IGCT IUCT IACT APET
Correlation is signif icant at the 0.01 level (2-tailed).**.
Group Statistics
1335 15.5191 2.75339 .07536
1931 15.8348 2.79992 .06372
1335 9.3783 1.88936 .05171
1930 9.2373 1.97224 .04489
1331 6.0714 1.70718 .04679
1930 5.9839 1.43829 .03274
1333 8.4974 2.35499 .06450
1933 7.6679 2.30949 .05253
NAMEUN
FIRSTGEN
SECONDGEN
FIRSTGEN
SECONDGEN
FIRSTGEN
SECONDGEN
FIRSTGEN
SECONDGEN
IGCT
IUCT
IACT
APET
N Mean Std. Dev iation
Std. Error
Mean
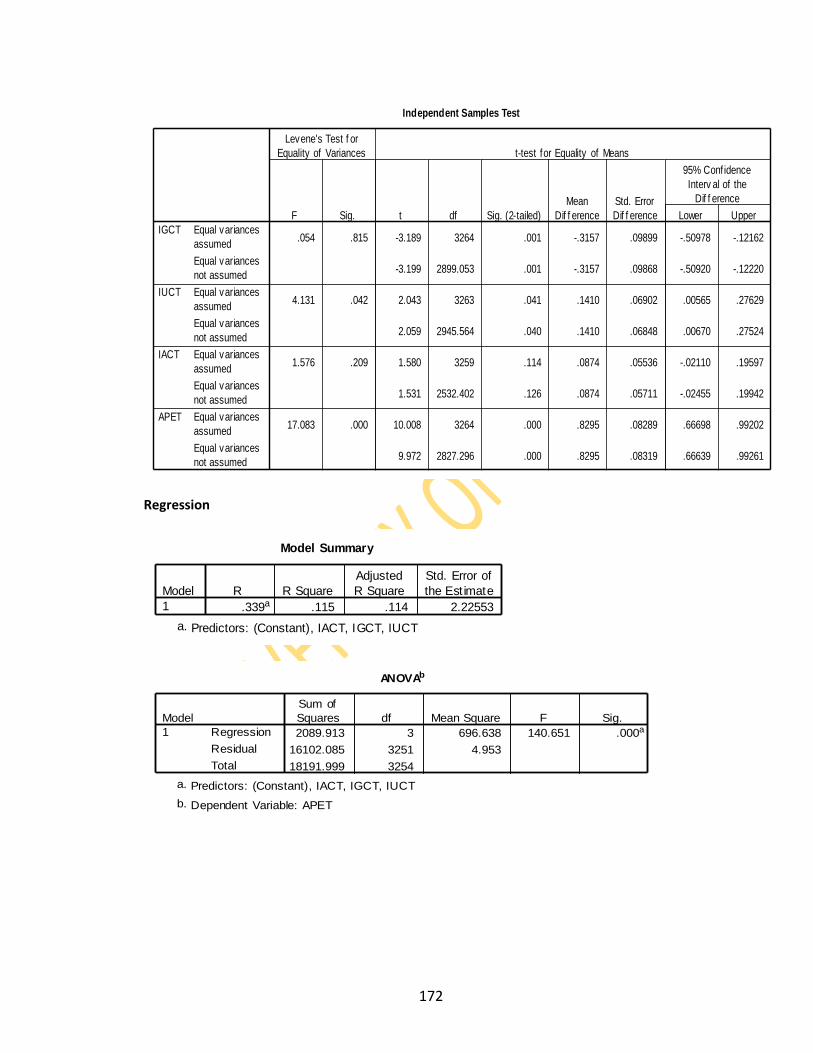
172
Regression
Independent Samples Test
.054 .815 -3.189 3264 .001 -.3157 .09899 -.50978 -.12162
-3.199 2899.053 .001 -.3157 .09868 -.50920 -.12220
4.131 .042 2.043 3263 .041 .1410 .06902 .00565 .27629
2.059 2945.564 .040 .1410 .06848 .00670 .27524
1.576 .209 1.580 3259 .114 .0874 .05536 -.02110 .19597
1.531 2532.402 .126 .0874 .05711 -.02455 .19942
17.083 .000 10.008 3264 .000 .8295 .08289 .66698 .99202
9.972 2827.296 .000 .8295 .08319 .66639 .99261
Equal variances
assumed
Equal variances
not assumed
Equal variances
assumed
Equal variances
not assumed
Equal variances
assumed
Equal variances
not assumed
Equal variances
assumed
Equal variances
not assumed
IGCT
IUCT
IACT
APET
F Sig.
Levene's Test f or
Equality of Variances
t df Sig. (2-tailed)
Mean
Dif f erence
Std. Error
Dif f erence Lower Upper
95% Conf idence
Interv al of the
Dif f erence
t-test for Equality of Means
Model Summary
.339a .115 .114 2.22553
Model
1
R R Square
Adjusted
R Square
Std. Error of
the Est imate
Predictors: (Constant), IACT, IGCT, IUCTa.
ANOVAb
2089.913 3 696.638 140.651 .000a
16102.085 3251 4.953
18191.999 3254
Regression
Residual
Total
Model
1
Sum of
Squares df Mean Square F Sig.
Predictors: (Constant), IACT, IGCT, IUCTa.
Dependent Variable: APETb.
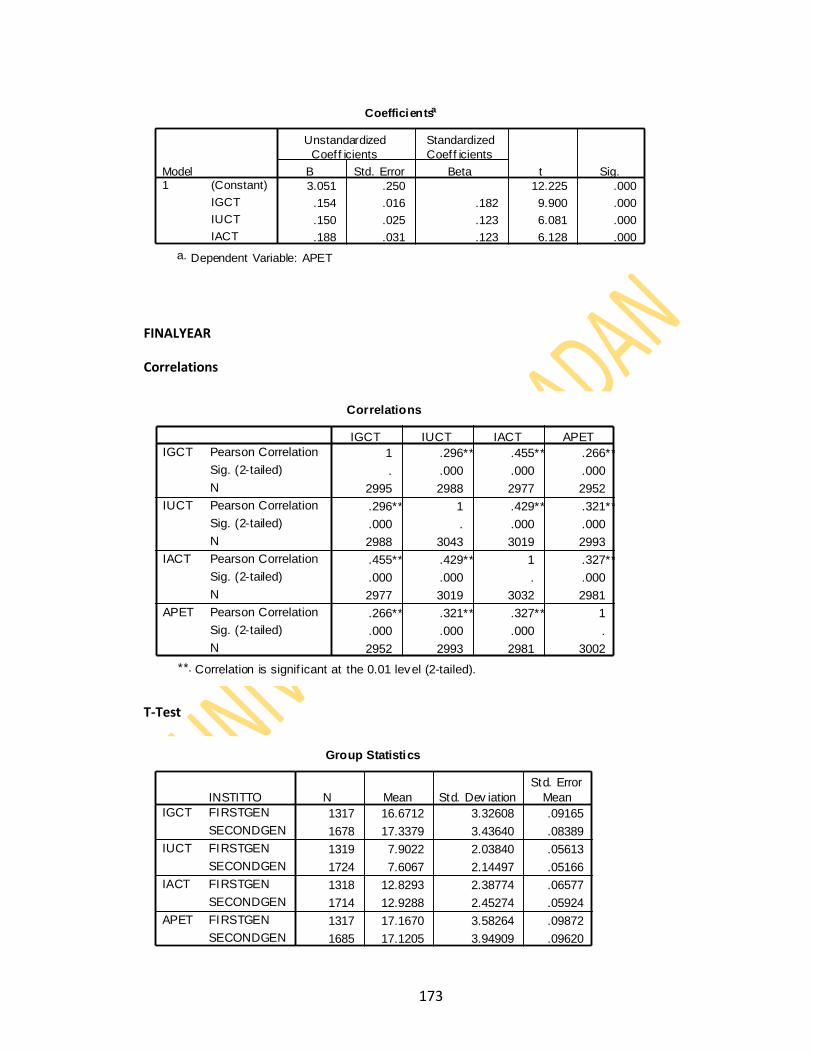
173
FINALYEAR
Correlations
T-Test
Coefficientsa
3.051 .250 12.225 .000
.154 .016 .182 9.900 .000
.150 .025 .123 6.081 .000
.188 .031 .123 6.128 .000
(Constant)
IGCT
IUCT
IACT
Model1
B Std. Error
Unstandardized
Coef f icients
Beta
Standardized
Coef f icients
t Sig.
Dependent Variable: APETa.
Correlations
1 .296** .455** .266**
. .000 .000 .000
2995 2988 2977 2952
.296** 1 .429** .321**
.000 . .000 .000
2988 3043 3019 2993
.455** .429** 1 .327**
.000 .000 . .000
2977 3019 3032 2981
.266** .321** .327** 1
.000 .000 .000 .
2952 2993 2981 3002
Pearson Correlation
Sig. (2-tailed)
N
Pearson Correlation
Sig. (2-tailed)
N
Pearson Correlation
Sig. (2-tailed)
N
Pearson Correlation
Sig. (2-tailed)
N
IGCT
IUCT
IACT
APET
IGCT IUCT IACT APET
Correlation is signif icant at the 0.01 level (2-tailed).**.
Group Statistics
1317 16.6712 3.32608 .09165
1678 17.3379 3.43640 .08389
1319 7.9022 2.03840 .05613
1724 7.6067 2.14497 .05166
1318 12.8293 2.38774 .06577
1714 12.9288 2.45274 .05924
1317 17.1670 3.58264 .09872
1685 17.1205 3.94909 .09620
INSTITTO
FIRSTGEN
SECONDGEN
FIRSTGEN
SECONDGEN
FIRSTGEN
SECONDGEN
FIRSTGEN
SECONDGEN
IGCT
IUCT
IACT
APET
N Mean Std. Dev iation
Std. Error
Mean
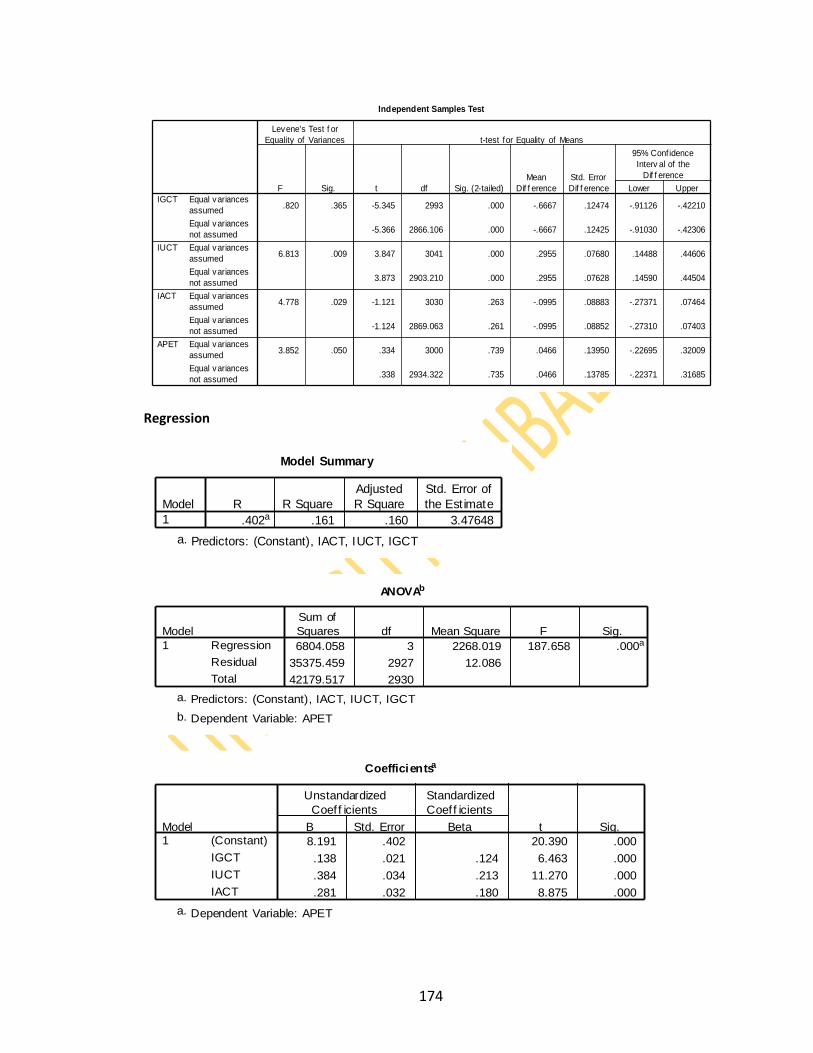
174
Regression
Independent Samples Test
.820 .365 -5.345 2993 .000 -.6667 .12474 -.91126 -.42210
-5.366 2866.106 .000 -.6667 .12425 -.91030 -.42306
6.813 .009 3.847 3041 .000 .2955 .07680 .14488 .44606
3.873 2903.210 .000 .2955 .07628 .14590 .44504
4.778 .029 -1.121 3030 .263 -.0995 .08883 -.27371 .07464
-1.124 2869.063 .261 -.0995 .08852 -.27310 .07403
3.852 .050 .334 3000 .739 .0466 .13950 -.22695 .32009
.338 2934.322 .735 .0466 .13785 -.22371 .31685
Equal variances
assumed
Equal variances
not assumed
Equal variances
assumed
Equal variances
not assumed
Equal variances
assumed
Equal variances
not assumed
Equal variances
assumed
Equal variances
not assumed
IGCT
IUCT
IACT
APET
F Sig.
Levene's Test f or
Equality of Variances
t df Sig. (2-tailed)
Mean
Dif f erence
Std. Error
Dif f erence Lower Upper
95% Conf idence
Interv al of the
Dif f erence
t-test for Equality of Means
Model Summary
.402a .161 .160 3.47648
Model
1
R R Square
Adjusted
R Square
Std. Error of
the Est imate
Predictors: (Constant), IACT, IUCT, IGCTa.
ANOVAb
6804.058 3 2268.019 187.658 .000a
35375.459 2927 12.086
42179.517 2930
Regression
Residual
Total
Model
1
Sum of
Squares df Mean Square F Sig.
Predictors: (Constant), IACT, IUCT, IGCTa.
Dependent Variable: APETb.
Coefficientsa
8.191 .402 20.390 .000
.138 .021 .124 6.463 .000
.384 .034 .213 11.270 .000
.281 .032 .180 8.875 .000
(Constant)
IGCT
IUCT
IACT
Model1
B Std. Error
Unstandardized
Coef f icients
Beta
Standardized
Coef f icients
t Sig.
Dependent Variable: APETa.
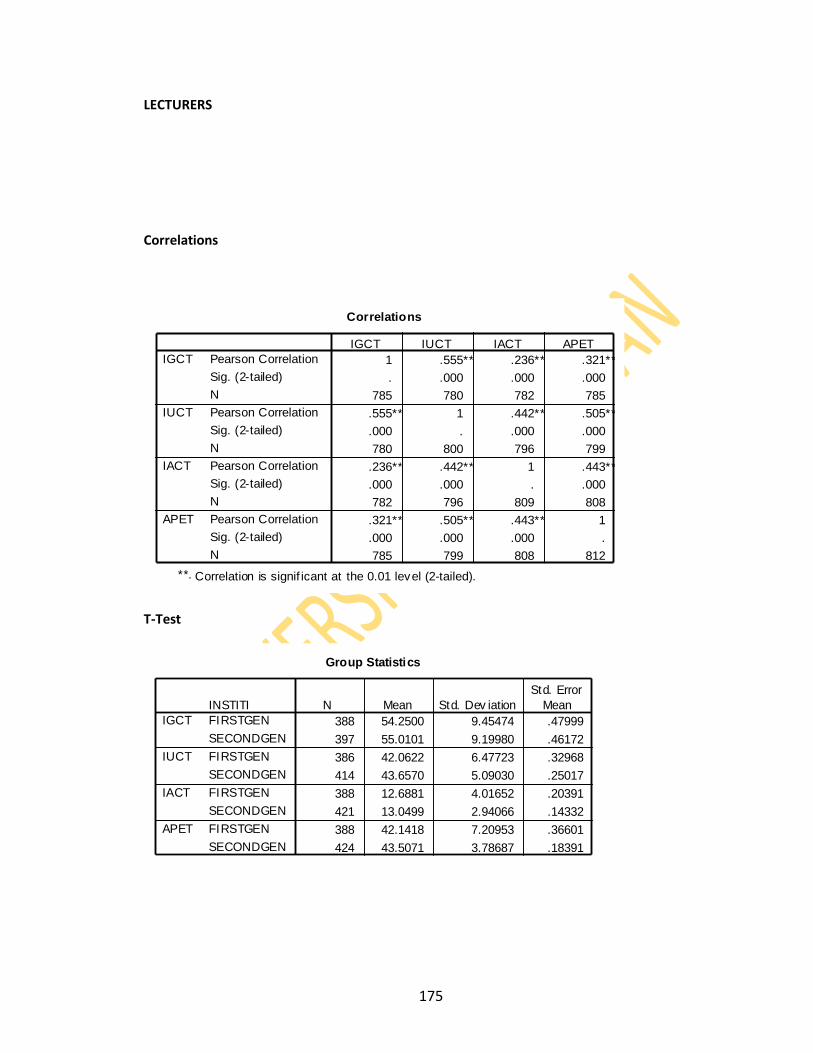
175
LECTURERS
Correlations
T-Test
Correlations
1 .555** .236** .321**
. .000 .000 .000
785 780 782 785
.555** 1 .442** .505**
.000 . .000 .000
780 800 796 799
.236** .442** 1 .443**
.000 .000 . .000
782 796 809 808
.321** .505** .443** 1
.000 .000 .000 .
785 799 808 812
Pearson Correlation
Sig. (2-tailed)
N
Pearson Correlation
Sig. (2-tailed)
N
Pearson Correlation
Sig. (2-tailed)
N
Pearson Correlation
Sig. (2-tailed)
N
IGCT
IUCT
IACT
APET
IGCT IUCT IACT APET
Correlation is signif icant at the 0.01 level (2-tailed).**.
Group Statistics
388 54.2500 9.45474 .47999
397 55.0101 9.19980 .46172
386 42.0622 6.47723 .32968
414 43.6570 5.09030 .25017
388 12.6881 4.01652 .20391
421 13.0499 2.94066 .14332
388 42.1418 7.20953 .36601
424 43.5071 3.78687 .18391
INSTITI
FIRSTGEN
SECONDGEN
FIRSTGEN
SECONDGEN
FIRSTGEN
SECONDGEN
FIRSTGEN
SECONDGEN
IGCT
IUCT
IACT
APET
N Mean Std. Dev iation
Std. Error
Mean
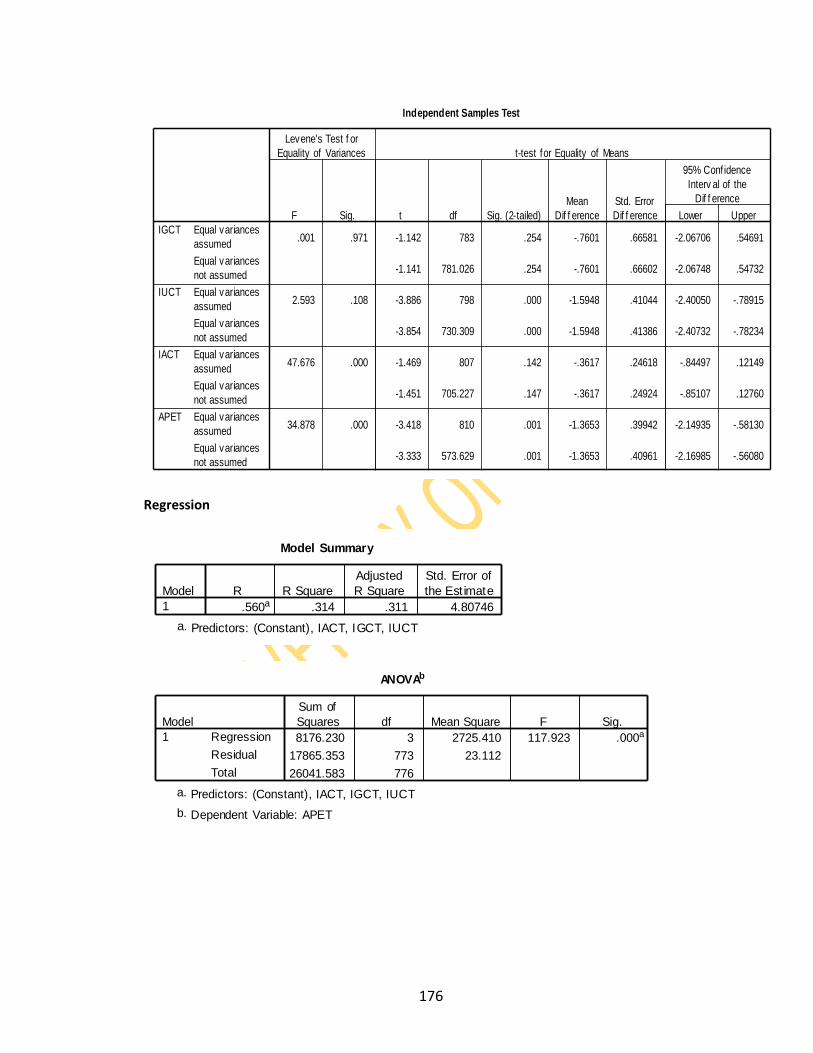
176
Regression
Independent Samples Test
.001 .971 -1.142 783 .254 -.7601 .66581 -2.06706 .54691
-1.141 781.026 .254 -.7601 .66602 -2.06748 .54732
2.593 .108 -3.886 798 .000 -1.5948 .41044 -2.40050 -.78915
-3.854 730.309 .000 -1.5948 .41386 -2.40732 -.78234
47.676 .000 -1.469 807 .142 -.3617 .24618 -.84497 .12149
-1.451 705.227 .147 -.3617 .24924 -.85107 .12760
34.878 .000 -3.418 810 .001 -1.3653 .39942 -2.14935 -.58130
-3.333 573.629 .001 -1.3653 .40961 -2.16985 -.56080
Equal variances
assumed
Equal variances
not assumed
Equal variances
assumed
Equal variances
not assumed
Equal variances
assumed
Equal variances
not assumed
Equal variances
assumed
Equal variances
not assumed
IGCT
IUCT
IACT
APET
F Sig.
Levene's Test f or
Equality of Variances
t df Sig. (2-tailed)
Mean
Dif f erence
Std. Error
Dif f erence Lower Upper
95% Conf idence
Interv al of the
Dif f erence
t-test for Equality of Means
Model Summary
.560a .314 .311 4.80746
Model
1
R R Square
Adjusted
R Square
Std. Error of
the Est imate
Predictors: (Constant), IACT, IGCT, IUCTa.
ANOVAb
8176.230 3 2725.410 117.923 .000a
17865.353 773 23.112
26041.583 776
Regression
Residual
Total
Model
1
Sum of
Squares df Mean Square F Sig.
Predictors: (Constant), IACT, IGCT, IUCTa.
Dependent Variable: APETb.
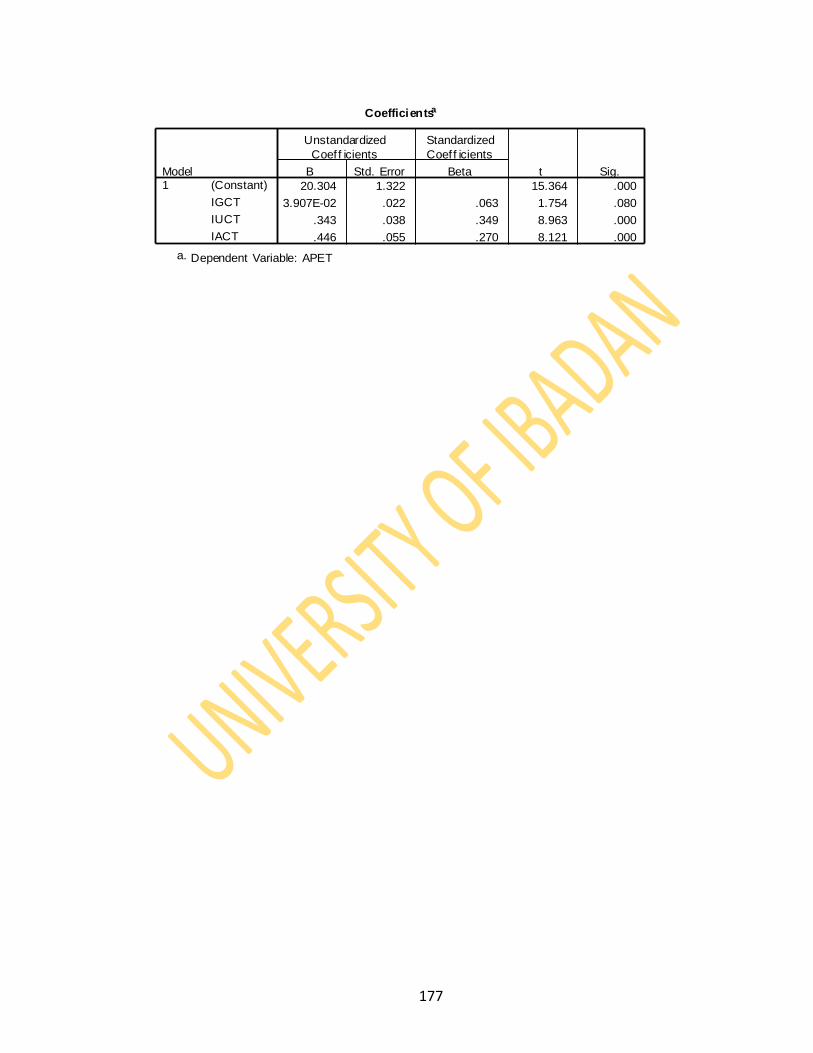
177
Coefficientsa
20.304 1.322 15.364 .000
3.907E-02 .022 .063 1.754 .080
.343 .038 .349 8.963 .000
.446 .055 .270 8.121 .000
(Constant)
IGCT
IUCT
IACT
Model1
B Std. Error
Unstandardized
Coef f icients
Beta
Standardized
Coef f icients
t Sig.
Dependent Variable: APETa.
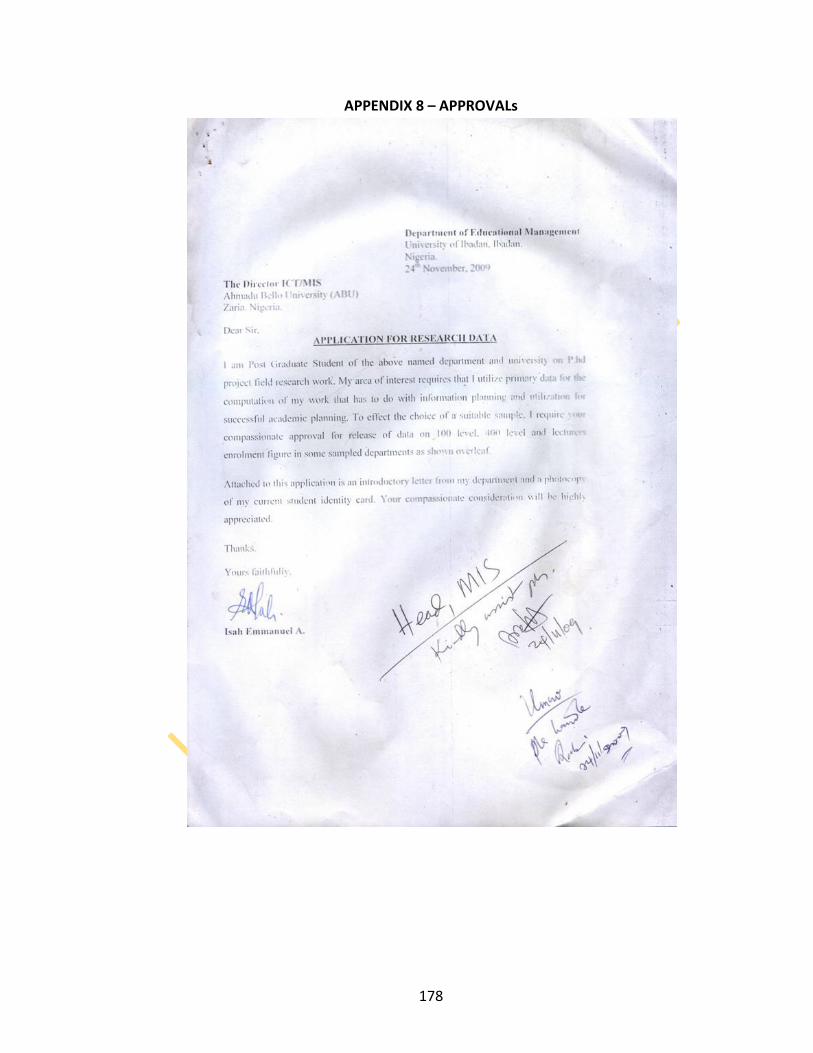
178
APPENDIX 8 – APPROVALs
179
180
181
182
183
184