Embed Size (px)
Citation preview

HAL Id: hal-00582260https://hal.archives-ouvertes.fr/hal-00582260
Submitted on 1 Apr 2011
HAL is a multi-disciplinary open accessarchive for the deposit and dissemination of sci-entific research documents, whether they are pub-lished or not. The documents may come fromteaching and research institutions in France orabroad, or from public or private research centers.
L’archive ouverte pluridisciplinaire HAL, estdestinée au dépôt et à la diffusion de documentsscientifiques de niveau recherche, publiés ou non,émanant des établissements d’enseignement et derecherche français ou étrangers, des laboratoirespublics ou privés.
Management of Climate Risks in Agriculture - WillWeather Derivatives Permeate?Oliver Musshoff, Martin Odening, Wei Xu
To cite this version:Oliver Musshoff, Martin Odening, Wei Xu. Management of Climate Risks in Agriculture - WillWeather Derivatives Permeate?. Applied Economics, Taylor & Francis (Routledge), 2009, pp.1.�10.1080/00036840802600210�. �hal-00582260�

For Peer Review
Management of Climate Risks in Agriculture - Will Weather Derivatives Permeate?
Journal: Applied Economics
Manuscript ID: APE-07-0509.R1
Journal Selection: Applied Economics
Date Submitted by the Author: 17-Sep-2008
Complete List of Authors: Musshoff, Oliver; Georg-August-Universität Göttingen, Department forAgricultural
Economics and Rural Development
Odening, Martin; Humboldt Universität zu Berlin, Department of Agricultural Economics
and Social Sciences
Xu, Wei; Humboldt Universität zu Berlin, Department of Agricultural Economics and Social Sciences
JEL Code:
G32 - Financing Policy|Capital and Ownership Structure < G3 - Corporate Finance and
Governance < G - Financial Economics, Q12 - Micro Analysis of Farm Firms, Farm
Households, and Farm Input Markets < Q1 - Agriculture < Q - Agricultural and Natural
Resource Economics, Q54 - Climate|Natural Disasters < Q5 - Environmental Economics
< Q - Agricultural and Natural Resource Economics
Keywords: Weather derivatives, precipitation risk, hedging effectiveness, local basis risk,
geographical basis risk
Editorial Office, Dept of Economics, Warwick University, Coventry CV4 7AL, UK
Submitted Manuscript

For Peer Review
1
Management of Climate Risks in Agriculture
- Will Weather Derivatives Permeate?
It is a matter of common knowledge that weather represents the major source of uncertainty in
crop production. It is to be expected that weather fluctuations will increase in the future due to
climate change. Traditionally, farmers tried to protect themselves against weather-related yield
variations by buying insurances. More recently, there has been a discussion regarding the use of
weather derivatives to safeguard against volumetric risks. Although weather derivatives display
advantages over traditional insurances, there is only a relatively small market for these products
in agriculture. This is partly attributed to the fact that it is unclear whether and to what extent
weather derivatives are a useful instrument of risk management in agriculture. This study ap-
plies real yield and weather data from northeast Germany in order to quantify the risk-reducing
effect that can be achieved in wheat production by using precipitation options. To do so stochas-
tic simulation is used. The hedging effectiveness is controlled by the contract design (index,
strike level, tick size). However, the local basis risk and the geographical basis risk remain with
the farmer. We separate both causes of basis risk and reveal the extent of each. This enables
conclusions regarding the design of weather derivatives; thus the question dealt with here is
relevant both for farmers and for potential sellers of weather derivatives.
Page 1 of 25
Editorial Office, Dept of Economics, Warwick University, Coventry CV4 7AL, UK
Submitted Manuscript
123456789101112131415161718192021222324252627282930313233343536373839404142434445464748495051525354555657585960

For Peer Review
2
I. Introduction
Weather is an important production factor and at the same time one of the greatest sources of
risk in agriculture. Perhaps, the most obvious impact of weather is on crop production (cf. e.g.,
Isik and Devadoss, 2006). There is scarcely a year in which there are no drought periods or ex-
treme precipitation in the most diverse regions of the world leading to crop failures. The impact
of the weather risk is not limited to crop production. The performance of livestock farms, the
turnover of processors, the use of pesticides and fertilizers as well as the demand for many food
products also depends on weather. Hence, large parts of the agribusiness are affected by weather
risks.
It is expected that fluctuations in temperature and rainfall will increase in the wake of global
climate change and thereby the volumetric risk will rise further. At the same time, the suscepti-
bility of farms to risk will rise as a result of the increasing capital intensity of agriculture and the
associated increasing debt ratio. Therefore, it will become increasingly necessary for farmers to
insure themselves against weather risks.
Farmers have always been confronted with risks. In the past, farmers tried to protect them-
selves against the negative economic consequences of bad weather events by using on-farm risk
management instruments like choosing less weather-dependent production activities, choosing a
widely diversified production program, procuring overcapacities or investing in technologies to
control the environment (e.g. irrigation technologies). Additionally, farmers have tried to share
risks through buying damage-based insurances (cf. e.g., Mishra and Goodwin, 2006). Agricul-
tural policy support (e.g., direct government aids in response to natural calamities and disasters)
can also yield an insurance effect (cf. e.g., Thompson et al., 2004).
From the end of the 1990s onwards, there has been a discussion about the use of index-
based instruments, also called weather derivatives, as a new instrument to safeguard against
volumetric risks (cf. Tigler and Butte, 2001; Cao et al., 2003; Berg et al., 2004; Jewson et al.,
2005). Weather derivatives are financial market products, such as futures, options or swaps,
which allow exchanging weather risks. They are related to objectively measurable weather vari-
ables (temperature, rainfall, wind etc.). Until now, weather derivatives have been used mainly
by energy companies. Trading of weather derivatives also occurs predominantly in the over-the-
counter (OTC) market. This means that the contracting parties have to establish their contract
specification bilaterally. As a contractual partner for a farmer wishing to be insured against in-
Page 2 of 25
Editorial Office, Dept of Economics, Warwick University, Coventry CV4 7AL, UK
Submitted Manuscript
123456789101112131415161718192021222324252627282930313233343536373839404142434445464748495051525354555657585960

For Peer Review
3
sufficient rainfall during the growth phase of crops, for instance, the tourist industry (e.g., theme
parks) can be considered, which exhibits a contrary risk exposure with regard to rainfall. How-
ever, weather derivatives also offer attractive opportunities for institutional investors such as in-
surers or banks to diversify a portfolio, since the weather-related risks are only correlated rela-
tively weakly with the systematic risk of a national economy.
Whereas traditional damage-based insurances predominantly protect against damages from
catastrophic events (e.g. hail), weather derivatives can be designed to release payments even for
less drastic events (e.g. insufficient rainfall). A holder of a traditional insurance must also prove
the damage in order to obtain indemnity payments. Unlike conventional damage-based instru-
ments, the hedge from weather derivatives results from payments which are tied to weather
variables that are measured objectively at a specified location; that is, weather derivates are not
impact-oriented, but cause-oriented. Weather derivatives thus offer administrative advantages
over traditional insurances. Furthermore, weather derivatives, unlike insurances (cf. e.g., Jin et
al., 2005), are not affected by moral hazard problems and adverse selection. Therefore, weather
derivatives have the advantage of relatively low transaction costs.
Although (i) agriculture is directly dependent on the weather, (ii) experts point out numer-
ous potential applications of weather derivatives especially because of the advantages named
above (cf. Turvey, 2001; Skees, 2002), and (iii) there have already been some promising practi-
cal experiences in the USA and Canada, the market for weather derivatives in agriculture is cur-
rently still relatively small. This may partly be accounted for by the fact that farmers are not yet
familiar with using weather derivatives. Another problem is that different valuation methods for
weather derivatives can provide different prices. A possible consequence is that no unique price
is found which market participants consider to be fair. The market then lacks liquidity and there
is consequently a lack of orientation for other potential market participants. Another possible
obstacle to their application can be seen in the basis risk which remains with the farmer when he
uses weather derivatives, and which means that yield variations are not compensated exactly by
corresponding payoffs from the weather derivative. One cause of the basis risk is that yield
variations are generally not perfectly correlated with the relevant weather variable (local basis
risk). For example, the weather derivative could refer to the rainfall sum at the place of produc-
tion in May, although e.g. the rainfall at other time periods, the timing of the rainfall and the
temperature also influence the yield in the crop production. On the other hand, there is a geo-
Page 3 of 25
Editorial Office, Dept of Economics, Warwick University, Coventry CV4 7AL, UK
Submitted Manuscript
123456789101112131415161718192021222324252627282930313233343536373839404142434445464748495051525354555657585960

For Peer Review
4
graphical basis risk. In this context, this means the non-insurable risk which results from the dif-
ference between the weather event at the reference point of the derivative and the site of agricul-
tural production. Although this aspect is not so important for temperature-related instruments, it
cannot be neglected in the analysis of the hedging effectiveness of rainfall derivatives, as there
is a high spatial variability of rainfall.
An increasing number of publications investigate the usefulness of weather derivatives as a
risk management instrument in agribusiness. Previous studies have focussed on the one hand on
theoretical questions of pricing weather derivatives and on the other hand on analysing tempera-
ture-related instruments (cf. van Asseldonk, 2003; Richards et al., 2004; Manfredo and Rich-
ards, 2005; Turvey, 2005). For agricultural applications, rainfall-related instruments ought to
play a greater role. Hitherto, however, there have been very few publications especially on the
analysis of the hedging effectiveness of precipitation-based instruments (cf. Turvey, 2001;
Stoppa and Hess, 2003). As yet, therefore, it is unclear whether weather derivatives will perme-
ate in agriculture (Edwards and Simmons, 2004).
The aim of this study is to clarify the risk-reducing effect of using rainfall options, specifi-
cally by considering wheat production in northeast Germany by means of a with/without deriva-
tive comparison. Special attention will be given to quantifying the basis risk, which will be di-
vided into the previously mentioned components (i) local basis risk and (ii) geographical basis
risk. The separation of the basis risk, which to our knowledge has not been treated previously in
literature, will provide important findings for the design of weather derivatives and their poten-
tial for usage in agriculture. Thus, the questions dealt with here will be relevant both for farmers
and for potential sellers of weather derivatives.
The remainder of the paper is structured as follows: In Section II, the database and methodi-
cal procedure are described. In Section III, the analysis of the hedging effectiveness of rainfall
options for a representative cash crop farm in northeast Germany is carried out. The paper ends
with conclusions for the design of weather derivatives (Section IV).
II. Data and methodical procedure
Grain production in northeast Germany, Brandenburg in particular, is highly affected by rainfall
risk. During the important grain-yield months of April to June, the rainfall sum in Brandenburg
was between 64 and 258 mm over the last 20 years (at an average of 141 mm and a standard
deviation of 46 mm) - measured at the Berlin-Brandenburg central weather station in Berlin-
Page 4 of 25
Editorial Office, Dept of Economics, Warwick University, Coventry CV4 7AL, UK
Submitted Manuscript
123456789101112131415161718192021222324252627282930313233343536373839404142434445464748495051525354555657585960

For Peer Review
5
Tempelhof. The grain yields have fluctuated similarly, due to the sandy soil possessing little
water-storing capacity and a lack of artificial irrigation facilities. Currently there exists no op-
portunity of insuring against yield losses caused by rainfall. During the drought years 2000 and
2003, disaster relief was even granted by the government on account of the extreme harvest
failures, in order to protect farms against insolvency. Of course, such government supports are
not always be guaranteed. Therefore, there is a pronounced interest among affected farmers for
a routine form of hedging weather-related risks.
For a farm-specific analysis of the hedging effectiveness of weather derivatives, a represen-
tative cash crop farm with approximately 850 ha of acreage operating in the Federal State of
Brandenburg, more precisely in Ketzin, is considered. The farmer wishes to be insured against
weather-related yield losses in wheat production. Wheat is the major production activity with a
crop proportion of more than one third. Without a weather station or a suitable contractual part-
ner, it is difficult for the farmer to obtain a derivative which refers directly to the weather on site
of production. Nonetheless, it is assumed that derivatives which refer to the rainfall measured at
the weather station in Berlin-Tempelhof are available on the OTC market. Ketzin is situated
about 39 km west of Berlin-Tempelhof. Both causes of basis risk which have previously been
outlined are evident here: on the one hand, a number of weather variables influence the wheat
yield while the payoff of the derivative and the indemnity payments is solely derived from rain-
fall. On the other hand, Ketzin is 39 km away from Berlin-Tempelhof, which means that the
rainfall in each location can be completely different in principle. Thus, even if the agricultural
production were only dependent on the rainfall, indemnity payments and yield failure could still
be different on account of the spatial distance.
In order to evaluate the hedging effectiveness of weather derivatives, a weather variable
must first be specified and the production function must be estimated in which the weather is
not - as is usual - a part of the error term, but a non-controllable (though measurable) production
factor. Derivatives, which refer to the weather variable in the production function, are then
specified. Before the hedging effectiveness of weather derivatives can be quantified, the deriva-
tives - which do not yet exist but which could be available in principle - must be priced. The
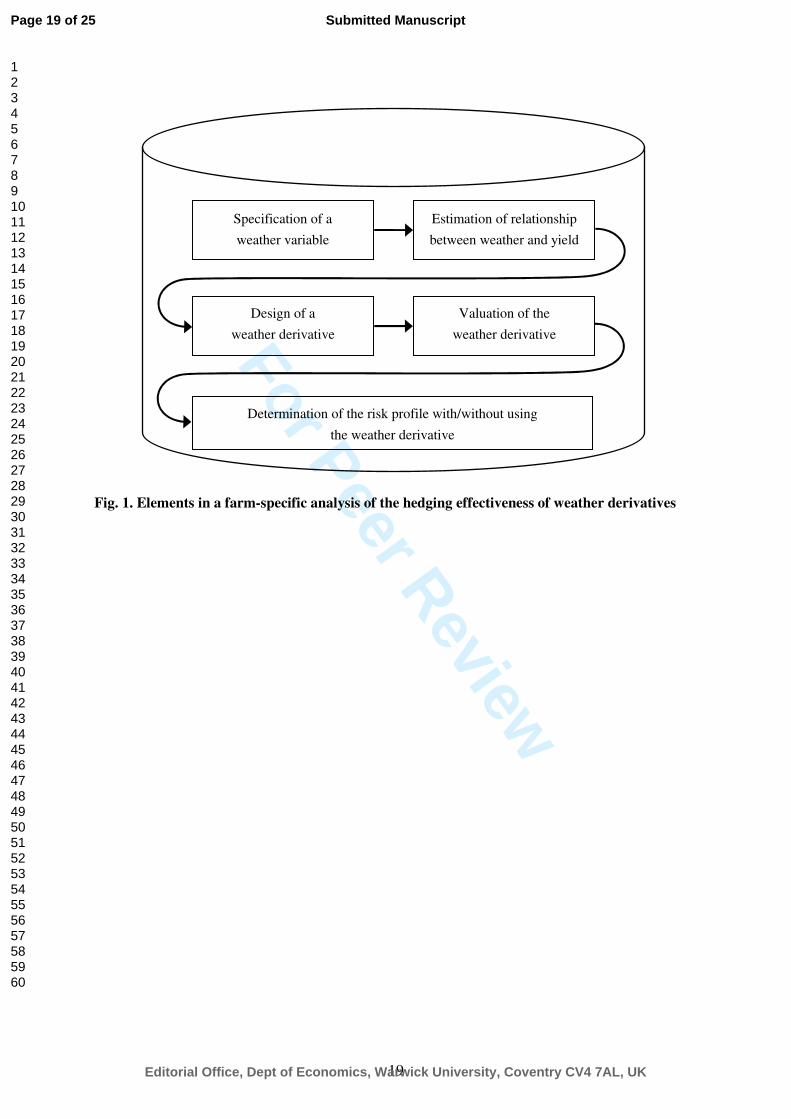
elements of a farm-specific analysis of the hedging effectiveness of weather derivatives are
summarized in Fig. 1.
Page 5 of 25
Editorial Office, Dept of Economics, Warwick University, Coventry CV4 7AL, UK
Submitted Manuscript
123456789101112131415161718192021222324252627282930313233343536373839404142434445464748495051525354555657585960

For Peer Review
6
Fig. 1 about here
On the specification of the weather variables
Previous publications on rainfall-related derivatives have tended to refer to an accumulation in-
dex (cf. Turvey, 2001; Skees et al., 2001; Stoppa and Hess, 2003; Vedenov and Barnett, 2004).
The cumulative rainfall index CTI corresponds to the rainfall sum within a specific time period:
∑=
=x
t
tCT yI
1
(1)
Here, ty indicates the rainfall on day t and x indicates the length of the accumulation period.
Alternatively, the rainfall deficit index DTI is suggested here, which expresses the timing of
rainfall in addition to the quantity:1
∑ ∑=
⋅
+⋅−=
−=
zmin
s
st
tDT yyI
1 1)1(
,0minτ
τ
τ
(2)
This index measures the shortfall of the rainfall sum in an s -days period relative to a reference
level miny . This shortfall is cumulated over z periods. Hence, the construction principle is
similar to that of degree-day-indices, which are widely used for the specification of temperature
derivatives (cf. e.g. Alaton et al., 2002; Zeng, 2000a).
On the estimation of the production function
For the considered cash crop farm yield data for winter wheat over a period from 1993 to 2006
are available. Fourteen observations seem to be a poor database for the estimation of the yield
model. However, a longer time series is not available for the new federal states in Germany in
general and Brandenburg in particular, since production took place under totally different condi-
tions prior to German reunification. Furthermore, it should also be noted that the yield data sur-
vey was not performed in accordance with the wheat variety, even though certain wheat varie-
ties are better suited to regions with low rainfall such as Brandenburg and are preferred there for
cultivation. Using statistical tests, no significant trend can be found for the wheat yields.
1 This definition may appear unusual since the rainfall deficit index will take negative values. However, the defini-
tion is convenient for the present application because then the relationship between yield and rainfall deficit index
is similar to that between yield and rainfall sum index.
Page 6 of 25
Editorial Office, Dept of Economics, Warwick University, Coventry CV4 7AL, UK
Submitted Manuscript
123456789101112131415161718192021222324252627282930313233343536373839404142434445464748495051525354555657585960

For Peer Review
7
Using daily rainfall data measured at the weather station in Berlin-Tempelhof, the rainfall
indices described in (1) and (2) for the years 1993 ( 14−T ) to 2006 ( 1−T ) are calculated. To
specify the relationship between the rainfall sum or rainfall deficit index observed in Berlin-
Tempelhof bI and the wheat yield observed for the farm in Ketzin bQ~
, a linear-limitational
(Leontief) production function seems most suitable:2
+
<+⋅+=
otherwise,
if,~
3
210
b
bbbb
a
aIIaaQ
ε
ε, with 1...,,13,14 −−−= TTTb and ],0[~ εσε Nb (3)
“~” makes it clear that the yield at the farm location in Ketzin is meant, whereas the weather in-
dex is related to weather data measured in Berlin-Tempelhof ( bI instead of bI~
). 0a , 1a , 2a and
3a describe the parameters of the production function to be estimated. When 01 >a , then
drought-related yield losses are to be expected for the rainfall index below 2a mm. If values for
the rainfall index are above 2a mm the expected wheat yield corresponds to 3a dt/ha. bε indi-
cates the normally distributed error term with a standard deviation of εσ . It should be noted that
this error term expresses both the local basis risk and the geographical basis risk: on the one
hand, the yield-explaining weather index only refers to rainfall in a specific accumulation pe-
riod. On the other hand, the production function is determined on the basis of yield data at the
site of production and the weather event at the reference weather station.
There is some back coupling between the estimation of the production function and the pre-
cise specification of the rainfall indices, since weather variables are sought which are correlated
as highly as possible to production output. Variant calculations are used to examine which ref-
erence period delivers the “best” rainfall sum index and which reference period allows the
“best” rainfall deficit index. In order to do so, systematic variations for x as well as for z and
s are carried out. miny was selected so as to provide a maximum correlation between the wheat
yield and the deficit index.
Table 1 shows the parameter estimates and the explanatory power for selected production
functions. Measured at R2, the best rainfall sum index for the accumulation period June and the
best rainfall deficit index for the accumulation period April to June are obtained. It should be
noted that the explanatory power between the wheat yield and the best rainfall deficit index
2 Several further functional forms for the yield model have been tested; in particular a quadratic and a logarithmic
production functions. Nonetheless, the linear-limitational production function showed the best fit in terms of R2
for the empirical data and both rainfall indices. It should be noted that this result cannot be generalized. VEDENOV
and BARNETT (2004) point out that a suitable yield-rainfall-model is dependent on type of variety and region.
Page 7 of 25
Editorial Office, Dept of Economics, Warwick University, Coventry CV4 7AL, UK
Submitted Manuscript
123456789101112131415161718192021222324252627282930313233343536373839404142434445464748495051525354555657585960

For Peer Review
8
(R2 = 0.48) is considerably higher than that between the wheat yield and the best rainfall sum
index (R2 = 0.15).
Table 1 about here
The specification of derivatives which refer to the best rainfall sum or rainfall deficit index
is described in the following.
On the specification of the weather derivatives
The revenue function of wheat production can be derived from the production function. As only
volumetric risks are to be considered, it is assumed that the wheat price P is fixed by a forward
contract and amounts to 10 €/dt. A derivative is now constructed respectively for the best rain-
fall sum index and the best rainfall deficit index in such a way that it compensates for expected
revenue fluctuations precisely by corresponding payoffs. For a linear-limitational production
function this can be achieved using an option. The payoff for a (European) put option corre-
sponds to:
( ) VISF TT ⋅−= 0,max (4)
At expiry time T the put option generates a positive payoff TF when the rainfall index TI is
below the strike level S . If the strike level is above the index, the payoff is zero. The tick
size V monetizes the positive difference between S and TI .
One put option relates to the cumulative index CTI which is measured in June 2007 at the
weather station at Berlin-Tempelhof. The second put option refers to the rainfall deficit in-
dex DTI between the 7-day rainfall measured at the weather station in Berlin-Tempelhof and
7.4 mm cumulated during the period April to June 2007. Farmers can obtain each of the two op-
tions in July 2006. In order to design the options in such a way that their payoff is complete in-
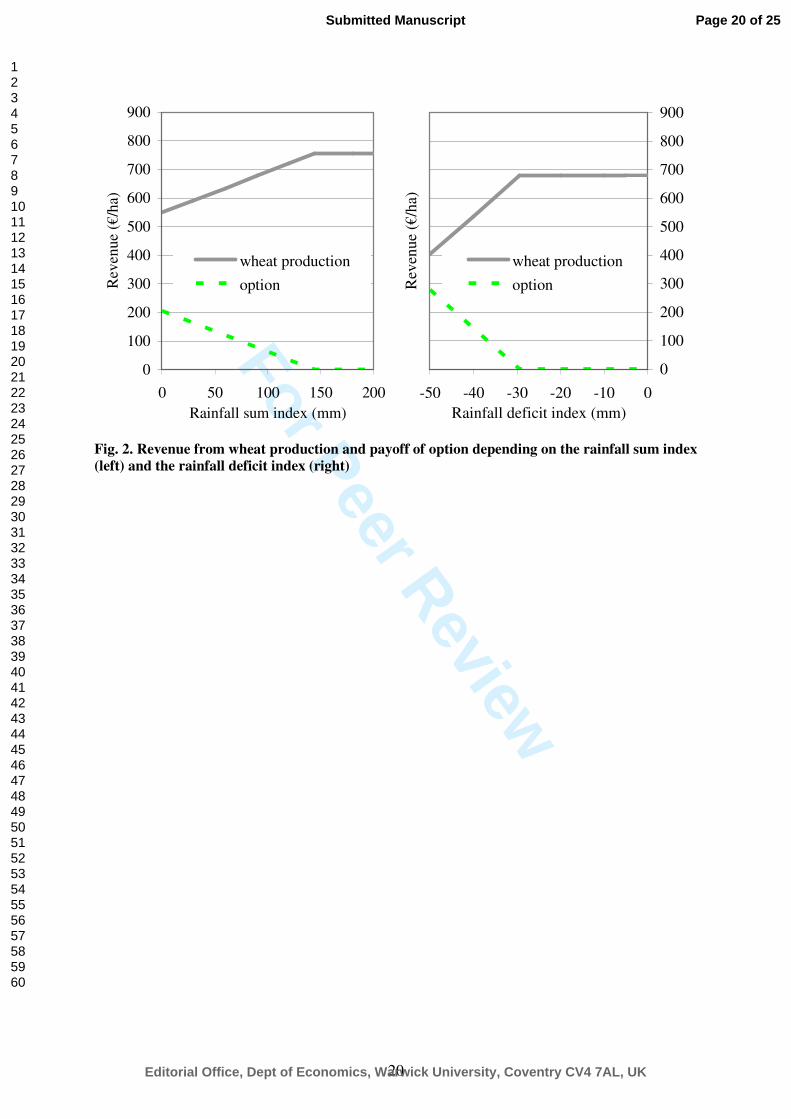
versely to the expected revenues from the wheat production (per ha), strike level and tick size
must be selected as follows: 2aS = and PaV ⋅= 1 .3 As illustrated in Fig. 2, the options deliver
3 It should be noted that an option cannot be designed in such a way that its payoff is correlated perfectly negatively
to the expected revenue from the production, if production function did not display a linear-limitational function
form. To insure the production risk for a linear production function, a future can be used. For more complex pro-
duction functions, several weather derivatives can be combined. In this way, a combination of put and call options
Page 8 of 25
Editorial Office, Dept of Economics, Warwick University, Coventry CV4 7AL, UK
Submitted Manuscript
123456789101112131415161718192021222324252627282930313233343536373839404142434445464748495051525354555657585960

For Peer Review
9
a payoff for yield-reducing rainfall. However, there is no payoff if the weather is suitable for
yield-formation.
Fig. 2 about here
The contract specifications for the rainfall options which are considered here are summa-
rized in Table 2.
Table 2 about here
On the calculation of the option price
If farmers wish to insure their revenue in wheat production by using a rainfall option, they must
first spend the option price. As the options are not market-traded, their price must also be de-
termined. Unfortunately, the preference-independent valuation procedures developed in the fi-
nancial option pricing theory cannot be used, since the rainfall index which forms the basis of a
rainfall option is non-tradable (cf. Jewson et al., 2005: 28-34; Richards et al., 2004). In order to
avoid the difficulties which are therefore associated with pricing weather derivatives, the price
of both options is calculated as a “fair premium” in an actuarial sense, i.e. the profit expected
from the option trade is precisely zero for both parties. Since therefore neither a risk premium
from the seller or buyer nor transaction costs are taken into account, the option price can simply
be calculated as the expected payoff of the option discounted with risk-free interest rate r :
( ) ( )trFEF T ∆⋅−⋅= exp0 (5)
where t∆ is the maturity of the option.
The fair premium can basically be determined by means of analytical procedures, historical
simulation (burn analysis), index value simulation or daily simulation. Analytical procedures
like the Black-Scholes formula require restrictive assumptions e.g. regarding the distribution for
the weather variable underlying the derivative (cf. Hull, 2006). Option prices determined by
means of historical simulation as a non-parametric procedure can be very imprecise, because for
could be suitable for a quadratic production function. In the “left area” (“right area”) of the production function,
the put option (the call option) insures against volumetric risks.
Page 9 of 25
Editorial Office, Dept of Economics, Warwick University, Coventry CV4 7AL, UK
Submitted Manuscript
123456789101112131415161718192021222324252627282930313233343536373839404142434445464748495051525354555657585960

For Peer Review
10
instance the length of the data series is too short to obtain a good approximation of the theoreti-
cal distribution for the weather index (Zeng, 2000b). Using the daily simulation based on a
model for the daily rainfall, the volatility of the rainfall and thus the option price are systemati-
cally underestimated (cf. Dubrovsky et al., 2004; Odening et al., 2007). Therefore, the index
value simulation is used here.
Using daily rainfall data which were measured in Berlin-Tempelhof between 1948 and
2006, the respective value for the rainfall index is calculated for each year. In the result, 59 em-
pirical observations are available for each index. The MS-EXCEL-Add-In BEST-FIT is used to
test which assumption regarding the distribution of the index is adequate. According to the
standard tests (Chi-Square, Kolmogorov-Smirnov and Anderson-Darling test), the lognormal
distribution shows the best fit to empirical distribution for the rainfall sum index and the
Weibull distribution delivers the best fit for the rainfall deficit index; whereas only distributions
were considered which did not permit a change of sign of the uncertain variable. In the context
of the index value simulation, a value is randomly drawn 10 000 times from the estimated dis-
tribution for the rainfall index.4 In each simulation run the payoff of the option is determined in
accordance with (4). The discounted average payoff of the derivative corresponds to the fair
premium (cf. (5)). Using a risk-free interest rate r of 5%, the fair premium amounts to 108.1 €
for the rainfall sum index and 56.8 € for the rainfall deficit index.
On the estimation of the hedging effectiveness
General procedure
The risk-reducing effect which can be attained by using weather derivatives is usually quanti-
fied by a comparison of the revenue distribution with and without having a derivative (cf. e.g.
Vedenov and Barnett, 2004). Without a derivative, the revenue from wheat production 0R (in
€/ha) related to the time of buying the derivative corresponds to the wheat yield (in dt/ha) mul-
tiplied by the wheat price (in €/dt) and the discounting factor:5
4 Regarding the number of required simulation runs, Haug (1998: 40), e.g., stipulates that at least 10 000 runs
should be carried out. For technical details describing how to use stochastic simulation to model a wide variety of
distributions with established software packages see e.g. Winston (1998).
5 We are only focussing on the risk-reducing effect of weather derivatives in wheat production, i.e. we abstract
from cross effects resulting from the fact that the payoff of a weather derivative is correlated with the yields of
several crops.
Page 10 of 25
Editorial Office, Dept of Economics, Warwick University, Coventry CV4 7AL, UK
Submitted Manuscript
123456789101112131415161718192021222324252627282930313233343536373839404142434445464748495051525354555657585960

For Peer Review
11
( ) ( )trPIQR TT ∆⋅−⋅⋅= exp~
0 (6)
With a derivative, the revenue '0R (in €/ha) is to be calculated as follows:
( ) ( ) 00'0 exp FtrIFRR TT −∆⋅−⋅+= (7)
If farmers wishing to be insured against volumetric risks using a derivative, at first, they have to
pay the purchase price 0F . Afterwards, farmers receive in addition to the revenue from wheat
production 0R the payoff of the derivative TF , whose level - just like the success of the produc-
tion (cf. (3)) - is dependent on the weather variable TI .
On the separation of the basis risk
To separate the basis risk and its causes, three scenarios are considered when estimating the
hedging effectiveness of rainfall options; two of these scenarios are synthesized in order to work
on the specific effects. As the option is always related to the rainfall at the reference weather
station Berlin-Tempelhof, the three scenarios are not distinguished with regard to the option
price 0F and the payoff of the option TF , but only in determining the production success of
wheat production in T :
• In the first hypothetical scenario it is assumed that there is no basis risk. It is supposed that
the location of the agricultural production is not in Ketzin, but in the immediate vicinity of
the reference weather station in Berlin-Tempelhof ( TQ instead of TQ~
) and that the relation-
ship between yield and rainfall index is not influenced by random effects ( 0=Tε ). Techni-
cally, the wheat yield in scenario 1 1TQ is derived directly from the rainfall index in Berlin-
Tempelhof:
<⋅+
=otherwise,
if,
3
2101
a
aIIaaQ TT
T (8)
• In the second hypothetical scenario, the fact that the wheat production takes place 39 km
away from the reference weather station is taken into account (geographical basis risk).
However, it is further assumed that the relationship between yield and rainfall index at the
site of production is purely deterministic ( 0=Tε ). Technically, the wheat yield in sce-
nario 2 2~TQ is directly derived from the rainfall index at the site of production in Ketzin ( TI
~
instead of TI ):
<⋅+
=otherwise,
~if,
~~
3
2102
a
aIIaaQ TT
T (9)
Page 11 of 25
Editorial Office, Dept of Economics, Warwick University, Coventry CV4 7AL, UK
Submitted Manuscript
123456789101112131415161718192021222324252627282930313233343536373839404142434445464748495051525354555657585960

For Peer Review
12
The value for the rainfall index in Ketzin TI~
is derived from the value for the rainfall index
in Berlin-Tempelhof TI while taking a correlation yet to be determined into consideration
(see below).
• In the third scenario, the spatial distance between the reference weather station and the site
of production as well as the stochastic relationship between yield and rainfall are taken into
consideration (geographical basis risk and local basis risk). Technically, the wheat yield in
scenario 3 3~TQ is derived from the relevant value for the rainfall index at the reference
weather station Berlin-Tempelhof and while taking into consideration the error term of the
production function Tε , which expresses both basis risks:
+
<+⋅+=
otherwise,
if,~
3
2103
T
TTTT
a
aIIaaQ
ε
ε (10)
To determine the distribution for the revenues without option (cf. (6)) and with option (cf.
(7)) in the three scenarios, the stochastic simulation (10 000 simulation runs) is used.
Decorrelation analysis
Usually, one would quantify geographical basis risk (second scenario) by means of comparing
the hedging effectiveness of weather derivatives based on weather data measured at the produc-
tion site versus taken weather data some distance apart. Unfortunately, for the showcased farm
in Brandenburg weather data measured on the production location are not available. For that
reason we have to replace actual weather data by randomly generated values using an appropri-
ate correlation coefficient. This correlation coefficient is derived from a statistically estimated
decorrelation function.
In order to estimate the correlation between the rainfall index at the site of production and
the rainfall index at the reference weather station, data is used from 23 weather stations in Ber-
lin and Brandenburg from 1983 to 2003, all located within a 100 km radius of Berlin-
Tempelhof and relatively uniformly distributed over the area. The correlation coefficients ji,ρ
between the values for the rainfall index at the weather stations i and j are determined. Then
the distances jid , between the individual weather stations are calculated. On the basis of the
correlation coefficients and each respective distance a so-called decorrelation function can be
estimated.
Page 12 of 25
Editorial Office, Dept of Economics, Warwick University, Coventry CV4 7AL, UK
Submitted Manuscript
123456789101112131415161718192021222324252627282930313233343536373839404142434445464748495051525354555657585960

For Peer Review
13
Rubel (1996) suggests the following non-linear decorrelation function for modelling spatial
correlation for rainfall in Europe:6
( )3
,21, expc
jiji dcc ⋅−⋅=ρ (11)
For the best rainfall sum index we find 1c = 0.94, 2c = 0.0033, 3c = 0.88 and for the best rainfall
deficit index 1c = 0.92, 2c = 0.0012, 3c = 1.11. The R2 is 0.24 for the rainfall sum index and 0.48
for the rainfall deficit index. The scatter diagram shown in Fig. 3 makes it clear, however, that
the relationship between distance and correlation becomes more diffuse as the distance in-
creases, that is the scatter plot reveals heteroscedasticity. It is also apparent that - as expected -
the correlation between the rainfall index at two weather stations decreases with the distance. At
a distance of 39 km between Berlin-Tempelhof and production location in Ketzin the rainfall
sum index has an expected correlation of 0.87 and the rainfall deficit index has an expected cor-
relation of 0.86.
Fig. 3 about here
Since the correlation coefficient is derived from the decorrelation analysis it implies an es-
timation error. This estimation error is not taken into account in the subsequent analysis of the
hedging effectiveness. Actually, we calculate only the hedging effectiveness for an average cor-
relation. The geographical basis risk and the hedging effectiveness of an individual farm can
differ from the depicted values. However, there is no systematic over- or underestimation of the
results as long as the estimated correlation is unbiased.
III. Results
In Table 3 the expected value, the standard deviation and selected percentiles of the revenue dis-
tribution are given for all three scenarios in order to assess the hedging effectiveness of the two
rainfall options described above. The situation without and with insurance by a rainfall option is
considered for each scenario. Fig. 4 illustrates the revenue distributions for selected scenarios.
6 The de-correlation function is invariant regarding direction. Thus, topographical differences potentially influenc-
ing precipitation are neglected. In Brandenburg, topographical conditions play to the assumption of a correlation
independent of location and direction.
Page 13 of 25
Editorial Office, Dept of Economics, Warwick University, Coventry CV4 7AL, UK
Submitted Manuscript
123456789101112131415161718192021222324252627282930313233343536373839404142434445464748495051525354555657585960

For Peer Review
14
Table 3 about here
Fig. 4 about here
It is apparent first of all that there is no difference between the expected values for the reve-
nue without and with the option. This is because the option price was calculated as a fair pre-
mium, therefore the insurance in average “brings as much as it costs”. With regard to the hedg-
ing effectiveness of an option, the following can be established:
• Scenario 1: When there is no basis risk (site of production in immediate vicinity of reference
weather station and deterministic relationship between yield and weather index), farmers
can completely eliminate the revenue risk of wheat production by buying a put option on the
rainfall sum or rainfall deficit index. This is possible because the payoff of the option is cor-
related perfectly negatively to the revenue from the wheat production (cf. Fig. 2).
• Scenario 2: When it is taken into consideration that the site of the agricultural production is
39 km away from the reference weather station, the revenue distribution without the option
is unchanged in comparison to scenario 1, because the same distribution underlies the rain-
fall index in Ketzin as that in Berlin-Tempelhof (cf. footnote 6). Nonetheless, the standard
deviation of the revenue in wheat production can only be reduced by about 45% using the
put option on the rainfall sum index or on the rainfall deficit index. Eventually, there may be
cases in which farmers obtain a payoff from the option even though no yield loss could be
registered (and vice versa), because the rainfall in Ketzin is different from that in Berlin-
Tempelhof. In comparison to the results from scenario 1, it is evident that the risk-reducing
effect of the option decreases with increasing distance from the reference weather station.
• Scenario 3: When both the geographical basis risk and a stochastic relationship between
yield and rainfall index are realistically taken into consideration, the standard deviation of
the revenue in wheat production can only be reduced by 10% by buying the put option on
the rainfall sum index. That is to say, the hedging effectiveness of a put option on the best
rainfall sum index is nearly completely eroded when the geographical basis risk and the lo-
cal basis risk are considered; even though the option was explicitly tailored to the revenue
function of the farm. Using the put option on the rainfall deficit index results in a 30% re-
duction of the standard deviation. The reason for the greater hedging effectiveness of the
Page 14 of 25
Editorial Office, Dept of Economics, Warwick University, Coventry CV4 7AL, UK
Submitted Manuscript
123456789101112131415161718192021222324252627282930313233343536373839404142434445464748495051525354555657585960

For Peer Review
15
rainfall option on the rainfall deficit index is that the explanatory power of the production
function for the wheat yield depending on the rainfall deficit index is much higher than that
depending on the rainfall sum index. The reduction of the hedging effectiveness of both op-
tions, in comparison to scenario 2, is to be attributed to the additional consideration of the
local basis risk.
IV. Conclusions and outlook
The model calculations have shown that by using rainfall options a very considerable risk-
reducing effect can be obtained when the reference weather station is located in the immediate
vicinity of the site of production and when there is a very close relationship between yield and
rainfall index. That is, while not being able to avoid climate change on a farm-level, such in-
struments could generate valuable support for those farming under risky conditions.
However, the model calculations also demonstrated that the basis risk has an extraordinarily
high influence on the hedging effectiveness of rainfall options. When the site of agricultural
production is only at a relatively small distance from the nearest reference weather station (e.g.
39 km in the application available here), the hedging effectiveness is considerably reduced. If,
in addition, an index which only shows a small correlation to the yield underlies the option (as
is established here between the wheat yield and the rainfall sum index, which is often suggested
in literature), the hedging effectiveness decreases even further.
One could be tempted to conclude from a low hedging effectiveness that the farmers’ poten-
tial demand would be low. However, such an interpretation would disregard the difference be-
tween effectiveness and efficiency. The potential demand for a weather derivative results from
the ratio of its costs and its benefits. Derivatives which are based on simple indices and which
display low effectiveness lead to a lower willingness-to-pay on the part of the farmers. How-
ever, as a result of their lower transaction costs they can also be provided at lower prices. We
can, therefore, not a priori conclude that weather derivatives with a low hedging effectiveness
are “inapplicable” or that they do not have a trading potential.
However, if potential sellers of rainfall options wish to increase the hedging effectiveness,
they should permit a dense network of weather stations as reference points and a widely diversi-
fied spectrum of differently specified weather derivatives. Of course, it is inconceivable that de-
rivatives will be offered for every weather station. The demand for products of this kind would
certainly be too low. A compromise could be to select the average derived from the values of a
Page 15 of 25
Editorial Office, Dept of Economics, Warwick University, Coventry CV4 7AL, UK
Submitted Manuscript
123456789101112131415161718192021222324252627282930313233343536373839404142434445464748495051525354555657585960

For Peer Review
16
rainfall index at several weather stations as a weather variable underlying the option. The rec-
ommendation for offering differently specified weather derivatives affects the derivative type
on the one hand (cf. footnote 3) and the design of the index, the tick size and the strike level on
the other hand. Many reference weather stations and weather derivatives designed in very dif-
ferent ways result in a fragmentation of the demand.
There is a further need for research with regard to the specification of the payoff function of
an option. Rainfall sum indices dominating the scientific discussion until now are not suffi-
ciently target-orientated in the opinion of many producers. An alternative suggestion was made
here in the form of a rainfall deficit index. From an agronomic viewpoint, however, it could also
be advisable to incorporate not only the rainfall but also the temperature, the wind etc. in the in-
dex underlying the option. In this way, for instance, allowance could be made for a situation in
which low rainfall at high temperatures would lead to higher yield losses than at lower tempera-
tures. Another task of research concerns the question which was consciously avoided here,
namely of valuing weather derivatives.
References
Alaton, P., Djehiche, B. and Stillberger, D. (2002) On Modelling and Pricing Weather Deriva-
tives, Applied Mathematical Finance, 9, 1-20.
Berg, E., Schmitz, B., Starp, M. and Trenkel, H. (2004) Weather Derivatives as a Risk Man-
agement Tool in Agriculture, Paper presented at the 86th EAAE Seminar: Farm Income Sta-
bilisation: What role should public policy play?, Anacapri, October 21-22.
Cao, M., Li., A. and Wei, J. (2003) A New Class of Financial Instruments, University of To-
ronto, Working-Paper.
Dubrovsky, M., Buchtele, J. and Zalud, Z. (2004) High-Frequency and Low-Frequency Vari-
ability in Stochastic Daily Weather Generator and its Effect on Agricultural and Hydrologic
Modelling, Climatic Change, 63, 145-179.
Edwards, M.J. and Simmons, P. (2004) Preliminary Results for the Measurement of Willing-
ness to Pay for Climate Derivatives, Paper presented at the Australian Agricultural and Re-
source Economics Society Annual Conference, Melbourne, February 11-13.
Haug, E.G. (1998) The Complete Guide to Option Pricing Formulas, McGraw-Hill, New York.
Hull, J. C. (2006) Options, Futures and other Derivatives, Prentice Hall, New Jersey.
Isik, M. and Devadoss, S. (2006): An Analysis of the Impact of Climate Change on Crop Yields
and Yield Variability, Applied Economics, 38, 835 - 844.
Page 16 of 25
Editorial Office, Dept of Economics, Warwick University, Coventry CV4 7AL, UK
Submitted Manuscript
123456789101112131415161718192021222324252627282930313233343536373839404142434445464748495051525354555657585960

For Peer Review
17
Jewson, S., Brix, A. and Ziehmann, C. (2005) Weather Derivative Valuation, Cambridge Uni-
versity Press, Cambridge.
Jin, Y., Rejesus, R.M. and Little B.B. (2005): Binary Choice Models for Rare Events Data: A
Crop Insurance Fraud Application, Applied Economics, 37, 841-848.
Manfredo, M.R. and Richards, T.J. (2005) Hedging Yield with Weather Derivatives, A Role for
Options, Paper presented at the American Agricultural Economics Association Annual Meet-
ing, Rhode Island, July 24-27.
Mishra, A.K. and Goodwin, B.K. (2006): Revenue Insurance Purchase Decisions of Farmers,
Applied Economics, 38, 149-159.
Odening, M., Mußhoff, O. and Xu, W. (2007) Analysis of Rainfall Derivatives Using Daily
Precipitation Models: Opportunities and Pitfalls, Agricultural Finance Review, 67, 135-156.
Richards, T.J., Manfredo, M.R. and Sanders, D.R. (2004) Pricing Weather Derivatives, Ameri-
can Journal of Agricultural Economics, 86, 1005-1017.
Rubel, F. (1996) Scale Dependent Statistical Precipitation Analysis, Proceedings of the Interna-
tional Conference on Water Resource and Environment Research, 317-324.
Skees, J. (2002) The Potential Role of Weather Markets for U.S. Agriculture, in Inman, L., Wil-
liamson, L., Scorsone, E. (Eds.). Agricultural Situation and Outlook, Fall 2002, 77-81, Uni-
versity of Kentucky, Kentucky.
Skees, J., Gober, S., Varangis, P., Lester, R. and Kalavakonda, V. (2001) Developing Rainfall-
Based Index Insurance in Morocco, Policy Research Working Paper 2577, The World Bank,
Washington D.C.
Stoppa, A. and Hess, U. (2003) Design and Use of Weather Derivatives in Agricultural Policies:
the Case of Rainfall Index Insurance in Morocco, Paper presented at the International Con-
ference: Agricultural Policy Reform and the WTO: Where are we Heading, Capri, June 23-
26.
Thompson, S.R., Schmitz, P.M., Iwai N. and Goodwin, B.K. (2004): The Real Rate of Protec-
tion: The Income and Insurance Effects of Agricultural Policy, Applied Economics, 36,
1851-1858.
Tigler, J. and Butte, T. (2001) Weather Derivatives, A Quantitative Analysis, Research Thesis,
Institute of Finance and Banking, Department of Business Administration, Economics and
Law, University of Technology, Darmstadt.
Turvey, C.G. (2001) Weather Derivatives for Specific Event Risks in Agriculture, Review of
Agricultural Economics, 23, 333-351.
Page 17 of 25
Editorial Office, Dept of Economics, Warwick University, Coventry CV4 7AL, UK
Submitted Manuscript
123456789101112131415161718192021222324252627282930313233343536373839404142434445464748495051525354555657585960

For Peer Review
18
Turvey, C.G. (2005) The Pricing of Degree-day Weather Options, Agricultural Finance Review
65, 59-85.
van Asseldonk, M.A.P.M. (2003) Insurance Against Weather Risk, Use of Heating Degree-days
from non-local Stations for Weather Derivatives, Theoretical and Applied Climatology, 74,
137-144.
Vedenov, D.V. and Barnett, B.J. (2004) Efficiency of Weather Derivatives as Primary Crop In-
surance Instruments, Journal of Agricultural and Resource Economics, 29, 387-403.
Winston, W. (1998) Financial Models Using Simulation and Optimization, Palisade, New York.
Zeng, L. (2000a) Weather Derivatives and Weather Insurance, Concept, Application, and
Analysis, Bulletin of the American Meteorological Society, 81, 2075-2082.
Zeng, L. (2000b) Pricing Weather Derivatives, Journal of Risk Finance, 1, 72-78.
Page 18 of 25
Editorial Office, Dept of Economics, Warwick University, Coventry CV4 7AL, UK
Submitted Manuscript
123456789101112131415161718192021222324252627282930313233343536373839404142434445464748495051525354555657585960
For Peer Review
19
Fig. 1. Elements in a farm-specific analysis of the hedging effectiveness of weather derivatives
Estimation of relationship
between weather and yield
Design of a
weather derivative
Valuation of the
weather derivative
Determination of the risk profile with/without using
the weather derivative
Specification of a
weather variable
Page 19 of 25
Editorial Office, Dept of Economics, Warwick University, Coventry CV4 7AL, UK
Submitted Manuscript
123456789101112131415161718192021222324252627282930313233343536373839404142434445464748495051525354555657585960
For Peer Review
20
0
100
200
300
400
500
600
700
800
900
0 50 100 150 200
Rainfall sum index (mm)
Rev
enu
e (€
/ha)
wheat production
option
0
100
200
300
400
500
600
700
800
900
-50 -40 -30 -20 -10 0
Rainfall deficit index (mm)R
even
ue
(€/h
a)
wheat production
option
Fig. 2. Revenue from wheat production and payoff of option depending on the rainfall sum index
(left) and the rainfall deficit index (right)
Page 20 of 25
Editorial Office, Dept of Economics, Warwick University, Coventry CV4 7AL, UK
Submitted Manuscript
123456789101112131415161718192021222324252627282930313233343536373839404142434445464748495051525354555657585960

For Peer Review
21
0
0.2
0.4
0.6
0.8
1
0 50 100 150 200Distance (km)
Co
rrel
atio
n
estimated observed
0
0.2
0.4
0.6
0.8
1
0 50 100 150 200Distance (km)
Co
rrel
atio
n
estimated observed
Fig. 3. Decorrelation analysis for the rainfall sum index (left) and the rainfall deficit index
(right)
Page 21 of 25
Editorial Office, Dept of Economics, Warwick University, Coventry CV4 7AL, UK
Submitted Manuscript
123456789101112131415161718192021222324252627282930313233343536373839404142434445464748495051525354555657585960

For Peer Review
22
0
0.2
0.4
0.6
0.8
1
0 400 800 1200Revenue (€/ha)
Cu
mu
lati
ve
pro
bab
ilit
ywithout option (scenario 3)
with option (scenario 3)
with option (scenario 1)
0
0.2
0.4
0.6
0.8
1
0 400 800 1200Revenue (€/ha)
Cu
mu
lati
ve
pro
bab
ilit
y
without option (scenario 3)
with option (scenario 3)
with option (scenario 1)
Fig. 4. Revenue distributions without and with insurance for the rainfall sum index (left) and the
rainfall deficit index (right)
Page 22 of 25
Editorial Office, Dept of Economics, Warwick University, Coventry CV4 7AL, UK
Submitted Manuscript
123456789101112131415161718192021222324252627282930313233343536373839404142434445464748495051525354555657585960

For Peer Review
23
Table 1. Estimates for different production functions*
Rainfall sum index Rainfall deficit index
Period Jan. –
June
April –
June
May –
June June Jan. –
June
April –
June April –
June
April –
June
June
x 181 91 61 30 – – – – –
z – – – – 26 19 13 11 4
s – – – – 7 5 7 9 7
ymin
– – – – 7.5 2.9 7.4 22.1 7.5
a0 0 (0.00)
0 (0.00)
50.9 (4.91)
54.9 (8.10)
88.5 (6.84)
137.9 (13.17)
107.8 (8.81)
87.8 (4.96)
81.8 (15.67)
a1 0.28 (5.23)
0.58 (7.23)
0.10 (1.20)
0.14 (1.38)
0.38 (2.06)
3.73 (6.40)
1.35 (3.62)
0.22 (1.45)
1.98 (3.81)
a2 233.1 109.6 220.1 144.3 -39.8 -19.0 -29.4 -53.6 -7.1
a3 64.6 (1.11)
64.1 (3.88)
73.7 (1.37)
75.5 (2.68)
73.4 (2.08)
67.1 (2.38)
68.0 (2.15)
76.0 (1.91)
67.7 (2.80)
σε 10.2 11.0 11.1 10.9 9.9 8.7 8.7 10.8 9.0
R2 0.10 0.09 0.13 0.15 0.30 0.47 0.48 0.17 0.43
* The t-values are given in parentheses. The critical t-value is 1.81 or 1.37 at a probability of er-
ror of 5 or 10%.
Page 23 of 25
Editorial Office, Dept of Economics, Warwick University, Coventry CV4 7AL, UK
Submitted Manuscript
123456789101112131415161718192021222324252627282930313233343536373839404142434445464748495051525354555657585960

For Peer Review
24
Table 2. Specification of rainfall options under consideration
Option 1 Option 2
Designation Cumulative rainfall index Rainfall deficit index
Reference point Rainfall data at the weather sta-
tion in Berlin-Tempelhof
Rainfall data at the weather sta-
tion in Berlin-Tempelhof
Accumulation period June April – June
Wea
ther
in
dex
Calculation ∑=
=30
1t
tCT yI ∑ ∑
=
⋅
+⋅−=
−=
13
1
7
17)1(
4.7 ,0minτ
τ
τt
tDT yI
Option type (European) put (European) put
Strike level S 144.3 mm –29.4 mm
Tick size V 1.4 €/index point 13.5 €/index point
Maturity ∆t 1 year
(01.07.2006 to 30.06.2007)
1 year
(01.07.2006 to 30.06.2007)
Expiry time T 2007 2007
Payoff FT ( ) 4.10,3.144max ⋅− CTI ( ) 5.130,4.29max ⋅−− D
TI
Page 24 of 25
Editorial Office, Dept of Economics, Warwick University, Coventry CV4 7AL, UK
Submitted Manuscript
123456789101112131415161718192021222324252627282930313233343536373839404142434445464748495051525354555657585960

For Peer Review
25
Table 3. Parameters for revenue distributions of wheat production without and with insurance
(in €/ha)
Scenario 1 Scenario 2 Scenario 3
Local basis risk without without with
Geographical basis risk without with with
Rainfall option without with without with without with
Expected value 620 620 620 620 620 620
Standard deviation 49 0 49 27 117 104
5% 558 620 558 574 429 446
10% 565 620 565 588 471 485
50% 608 620 608 620 619 620
90% 702 620 702 652 771 755
Rai
nfa
ll s
um
in
dex
Per
cen
tile
95% 728 620 728 666 815 793
Expected value 599 599 599 599 599 599
Standard deviation 84 0 84 51 119 83
5% 417 599 417 509 381 461
10% 471 599 471 537 441 492
50% 656 599 656 599 610 599
90% 656 599 656 661 740 706
Rai
nfa
ll d
efic
it i
nd
ex
Per
cen
tile
95% 656 599 656 690 773 737
Page 25 of 25
Editorial Office, Dept of Economics, Warwick University, Coventry CV4 7AL, UK
Submitted Manuscript
123456789101112131415161718192021222324252627282930313233343536373839404142434445464748495051525354555657585960