Embed Size (px)
Citation preview

Royal Dutch Shell November 28-29, 2017
Royal Dutch Shell plcNovember 28-29, 2017
Management DayDelivering a world-class investment case
#makethefuture

Royal Dutch Shell November 28-29, 2017
Ben van BeurdenChief Executive OfficerRoyal Dutch Shell
Bangkok – Thailand

Royal Dutch Shell November 28-29, 2017 3
Definitions & cautionary note
Reserves: Our use of the term “reserves” in this presentation means SEC proved oil and gas reserves. Resources: Our use of the term “resources” in this presentation includes quantities of oil and gas not yet classified as SEC proved oil and gas reserves. Resources are consistent with the Society of Petroleum Engineers (SPE) 2P + 2C definitions.
Operating costs as defined as underlying operating expenses, which are operating expenses less identified items. Organic free cash flow is defined as free cash flow excluding inorganic capital investment and divestment proceeds. Clean CCS ROACE (Return on Average Capital Employed) is defined as defined as the sum of CCS earnings attributable to shareholders excluding identified items for the current and previous three quarters, as a percentage of the average capital employed for the same period. Capital employed consists of total equity, current debt and non-current debt. Capital investment comprises capital expenditure, exploration expense excluding well write-offs, new investments in joint ventures and associates, new finance leases and investments in Integrated Gas, Upstream and Downstream securities, all of which on an accruals basis. In 2016, the capital investment was impacted by the acquisition of BG Group plc. Divestments comprises proceeds from sale of property, plant and equipment and businesses, joint ventures and associates, and other Integrated Gas, Upstream and Downstream investments, reported in “Cash flow from investing activities”, adjusted onto an accruals basis and for any share consideration received or contingent consideration recognised upon divestment, as well as proceeds from the sale of interests in entities while retaining control (for example, proceeds from sale of interest in Shell Midstream Partners, L.P.), which are included in “Change in non-controlling interest” within “Cash flow from financing activities”. This presentation contains the following forward-looking Non-GAAP measures: Organic Free Cash Flow, Free Cash Flow, Capital Investment, CCS Earnings, CCS Earnings less identified items, Gearing, Underlying Operating Expenses, ROACE, Capital Employed and Divestments. We are unable to provide a reconciliation of the above forward-looking Non-GAAP measures to the most comparable GAAP financial measures because certain information needed to reconcile the above Non-GAAP measure to the most comparable GAAP financial measure is dependent on future events some which are outside the control of the company, such as oil and gas prices, interest rates and exchange rates. Moreover, estimating such GAAP measures consistent with the company accounting policies and the required precision necessary to provide a meaningful reconciliation is extremely difficult and could not be accomplished without unreasonable effort. Non-GAAP measures in respect of future periods which cannot be reconciled to the most comparable GAAP financial measure are calculated in a manner which is consistent with the accounting policies applied in Royal Dutch Shell plc’s financial statements. The financial measures provided by strategic themes represent a notional allocation of ROACE, capital employed, capital investment, free cash flow, organic free cash flow and underlying operating expenses of Shell’s strategic themes for the purpose of Management Day presentations. Shell’s segment reporting under IFRS 8 remains Integrated Gas, Upstream, Downstream and Corporate.
The companies in which Royal Dutch Shell plc directly and indirectly owns investments are separate legal entities. In this presentation “Shell”, “Shell group” and “Royal Dutch Shell” are sometimes used for convenience where references are made to Royal Dutch Shell plc and its subsidiaries in general. Likewise, the words “we”, “us” and “our” are also used to refer to subsidiaries in general or to those who work for them. These expressions are also used where no useful purpose is served by identifying the particular company or companies. ‘‘Subsidiaries’’, “Shell subsidiaries” and “Shell companies” as used in this presentation refer to companies over which Royal Dutch Shell plc either directly or indirectly has control. Entities and unincorporated arrangements over which Shell has joint control are generally referred to “joint ventures” and “joint operations” respectively. Entities over which Shell has significant influence but neither control nor joint control are referred to as “associates”. The term “Shell interest” is used for convenience to indicate the direct and/or indirect ownership interest held by Shell in a venture, partnership or company, after exclusion of all third-party interest.
This presentation contains forward-looking statements concerning the financial condition, results of operations and businesses of Royal Dutch Shell. All statements other than statements of historical fact are, or may be deemed to be, forward-looking statements. Forward-looking statements are statements of future expectations that are based on management’s current expectations and assumptions and involve known and unknown risks and uncertainties that could cause actual results, performance or events to differ materially from those expressed or implied in these statements. Forward-looking statements include, among other things, statements concerning the potential exposure of Royal Dutch Shell to market risks and statements expressing management’s expectations, beliefs, estimates, forecasts, projections and assumptions. These forward-looking statements are identified by their use of terms and phrases such as ‘‘anticipate’’, ‘‘believe’’, ‘‘could’’, ‘‘estimate’’, ‘‘expect’’, ‘‘goals’’, ‘‘intend’’, ‘‘may’’, ‘‘objectives’’, ‘‘outlook’’, ‘‘plan’’, ‘‘probably’’, ‘‘project’’, ‘‘risks’’, “schedule”, ‘‘seek’’, ‘‘should’’, ‘‘target’’, ‘‘will’’ and similar terms and phrases. There are a number of factors that could affect the future operations of Royal Dutch Shell and could cause those results to differ materially from those expressed in the forward-looking statements included in this presentation, including (without limitation): (a) price fluctuations in crude oil and natural gas; (b) changes in demand for Shell’s products; (c) currency fluctuations; (d) drilling and production results; (e) reserves estimates; (f) loss of market share and industry competition; (g) environmental and physical risks; (h) risks associated with the identification of suitable potential acquisition properties and targets, and successful negotiation and completion of such transactions; (i) the risk of doing business in developing countries and countries subject to international sanctions; (j) legislative, fiscal and regulatory developments including regulatory measures addressing climate change; (k) economic and financial market conditions in various countries and regions; (l) political risks, including the risks of expropriation and renegotiation of the terms of contracts with governmental entities, delays or advancements in the approval of projects and delays in the reimbursement for shared costs; and (m) changes in trading conditions. No assurance is provided that future dividend payments will match or exceed previous dividend payments. All forward-looking statements contained in this presentation are expressly qualified in their entirety by the cautionary statements contained or referred to in this section. Readers should not place undue reliance on forward-looking statements. Additional risk factors that may affect future results are contained in Royal Dutch Shell’s 20-F for the year ended December 31, 2016 (available at www.shell.com/investor and www.sec.gov ). These risk factors also expressly qualify all forward looking statements contained in this presentation and should be considered by the reader. Each forward-looking statement speaks only as of the dates of this presentation, November 28-29, 2017. Neither Royal Dutch Shell plc nor any of its subsidiaries undertake any obligation to publicly update or revise any forward-looking statement as a result of new information, future events or other information. In light of these risks, results could differ materially from those stated, implied or inferred from the forward-looking statements contained in this presentation. This presentation may contain references to Shell’s website. These references are for the readers’ convenience only. Shell is not incorporating by reference any information posted on www.shell.com. We may have used certain terms, such as resources, in this presentation that United States Securities and Exchange Commission (SEC) strictly prohibits us from including in our filings with the SEC. U.S. Investors are urged to consider closely the disclosure in our Form 20-F, File No 1-32575, available on the SEC website www.sec.gov.
Royal Dutch Shell November 28-29, 2017 4
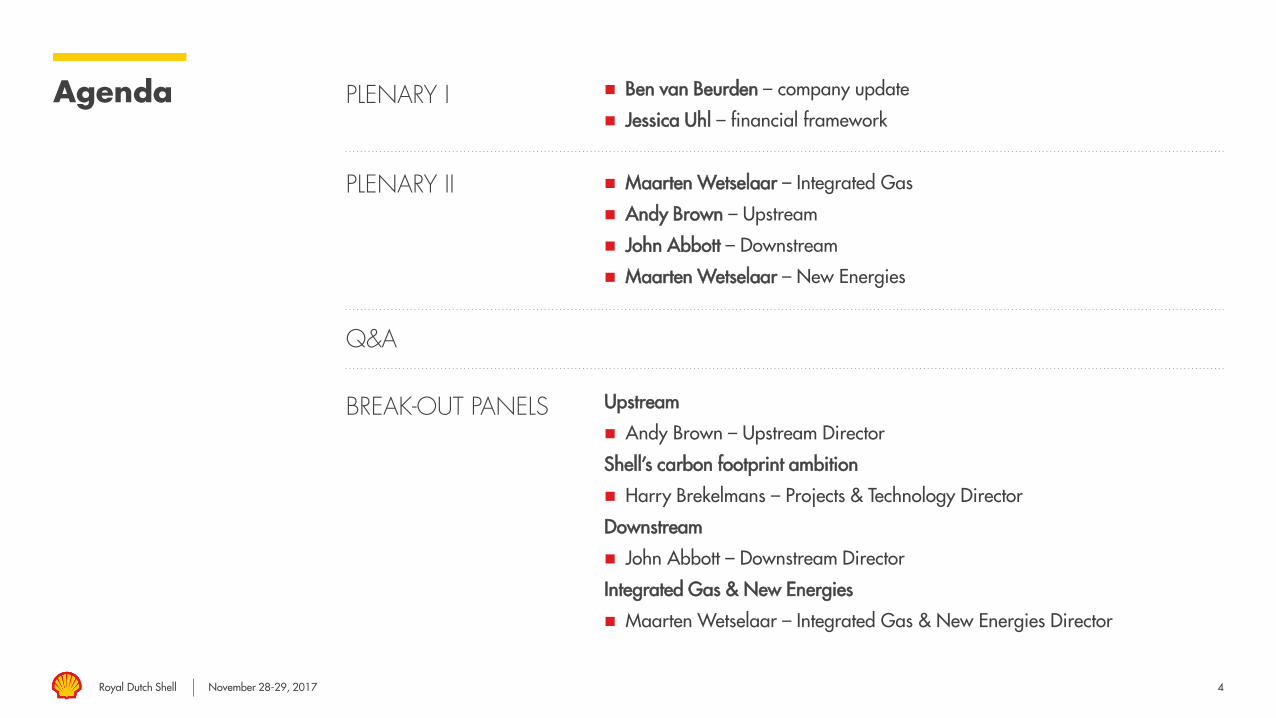
Agenda PLENARY I Ben van Beurden – company update
Jessica Uhl – financial framework
Maarten Wetselaar – Integrated Gas
Andy Brown – Upstream
John Abbott – Downstream
Maarten Wetselaar – New Energies
Upstream
Andy Brown – Upstream Director
Shell’s carbon footprint ambition
Harry Brekelmans – Projects & Technology Director
Downstream
John Abbott – Downstream Director
Integrated Gas & New Energies
Maarten Wetselaar – Integrated Gas & New Energies Director
PLENARY II
Q&A
BREAK-OUT PANELS

Royal Dutch Shell November 28-29, 2017 5
Summary
*subject to progress with debt reduction and recovery in oil prices; **2019-21: 2016 RT $60 per barrel, mid-cycle Downstream
Key messages
Cancel scrip dividend programme from Q4 2017 dividend
Confirming the plans for share buybacks*
Organic free cash flow by 2020**: $25-30 billion per year
Grow free cash flow per share from 2020 to 2025
Resilient and relevant portfolio positioned long term
Reduce the net carbon footprint of our energy products
Thrive in the energy transition
World-class investment case
Strong license
to operate

Royal Dutch Shell November 28-29, 2017 6
Significant changes delivered since early ‘16
*4-quarters rolling Q3 2017; ROACE on CCS basis, excluding identified items; Shell share at peak production. Divestments: headline
BG AcquisitionCompleted and fully integrated
~$27 billion
Free cash flow* at $51 per barrel
13,000Fewer staff
11Major project start-ups
and >500kboe/d avg. production increase from start-ups
~$23 billion
Divestments completed
~$9 billionFree cash flow* and
~17% ROACE in
Downstream
Royal Dutch Shell November 28-29, 2017 7
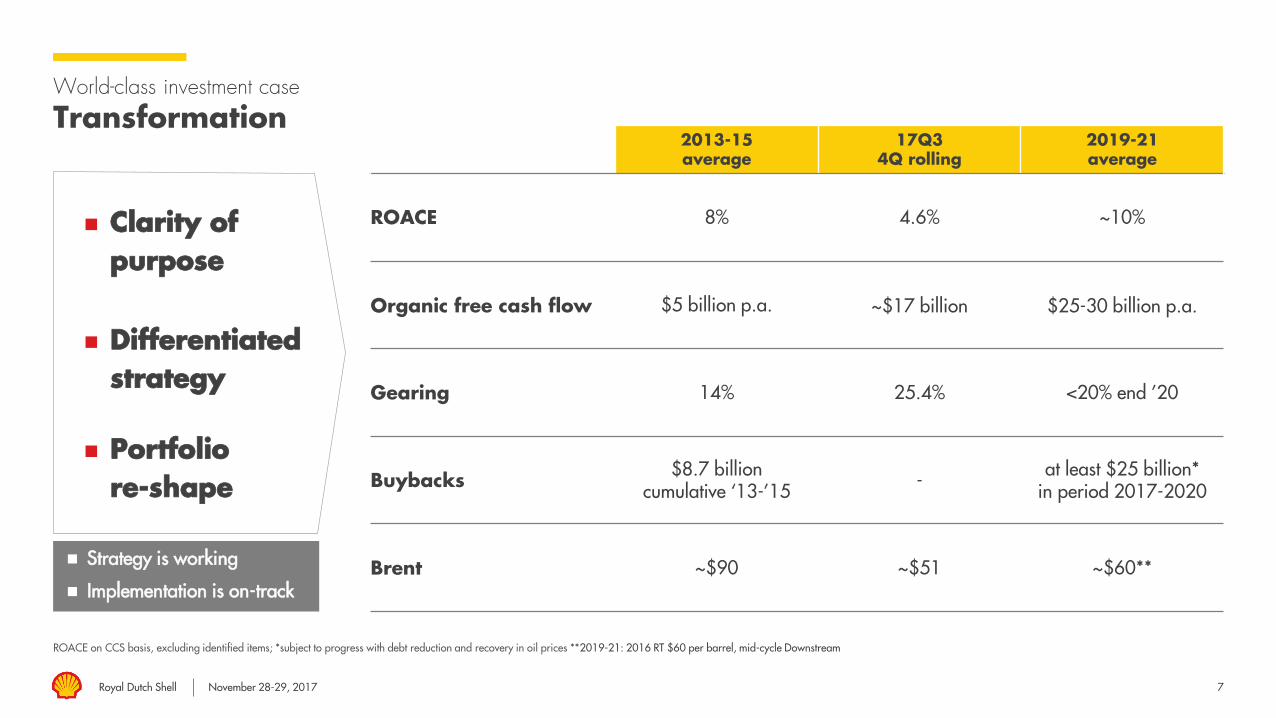
World-class investment case
Transformation
ROACE on CCS basis, excluding identified items; *subject to progress with debt reduction and recovery in oil prices **2019-21: 2016 RT $60 per barrel, mid-cycle Downstream
Strategy is working
Implementation is on-track
2013-15average
17Q34Q rolling
2019-21average
ROACE 8% 4.6% ~10%
Organic free cash flow $5 billion p.a. ~$17 billion $25-30 billion p.a.
Gearing 14% 25.4% <20% end ’20
Buybacks $8.7 billioncumulative ‘13-’15 - at least $25 billion*
in period 2017-2020
Brent ~$90 ~$51 ~$60**
Portfolio re-shape
Clarity of purpose
Differentiated strategy

Royal Dutch Shell November 28-29, 2017 8
World-class investment case
Transformation: ways of working
Reduction in invoice value
# of FTE (thousands)
Culture change Performance unit management
Credible, competitive and affordable Accountable leadership
‘Fit for the future’
Digitalisation – benefiting cost and availability
Shell employee survey results confirm change
FTE reductions
Category spend reductions
Shell
BG
Competitive scoping - Vito
20162017E
Index base year 2014
RigsWells Installed Equipment Engineering services
Professional services
Maintenance services
Logistics
IT
-60% -50% -40% -30% -20% -10%-70%
2015

Royal Dutch Shell November 28-29, 2017
$ billion 2017E 2018-20 expectation
Operating costs <38 (underlying)
Further reductionpotential
Capital investment 25 25 – 30
Divestments 30 over 2016 – 2018
>5 p.a.2019 – 2020
Projects start-up post-2014(CFFO)
~52017
~10incremental* over
2018 – 2020
9
Four powerful levers
*2016 RT $60 per barrel, mid-cycle Downstream
Relentless portfolio high-grading

Royal Dutch Shell November 28-29, 2017 10
HSSEperformance Injuries – TRCF/million working hours
Goal zero on safety
Million tonnes CO2e
Upstream flaring
Volume in thousand tonnes
Spills – operational
Number of incidents
Process safety
HSSE priority
Performance + transparency
million working hours
Working hours (RHS)TRCF
Number of spills
Volume Spills (RHS)
Tier 1 incidents Tier 2 incidents

Royal Dutch Shell November 28-29, 2017
Competitive performance
World class investment case
Competitive financial data as published. Free cash flow: cash flow from operations less cash used in investing activities. $/ADR for European companies.
ROACE underlying: European companies: CCS basis excluding identified items. US companies: reported earnings excluding special non-operating items. Capital employed on gross debt basis. TSR: in USD, 90-day averages until Nov 17, 2017.
%
ROACE
%
Gearing
$ billion
Free cash flow – 4 quarters rolling
Total shareholder return
Shell Peer group
11
% Since Jan 2015 Since Jan 2016 Since Jan 2017
Shell Peer group
Thrive in the energy transition
World-class investment case
Strong license
to operate
Royal Dutch Shell November 28-29, 2017
Emerging opportunities
12
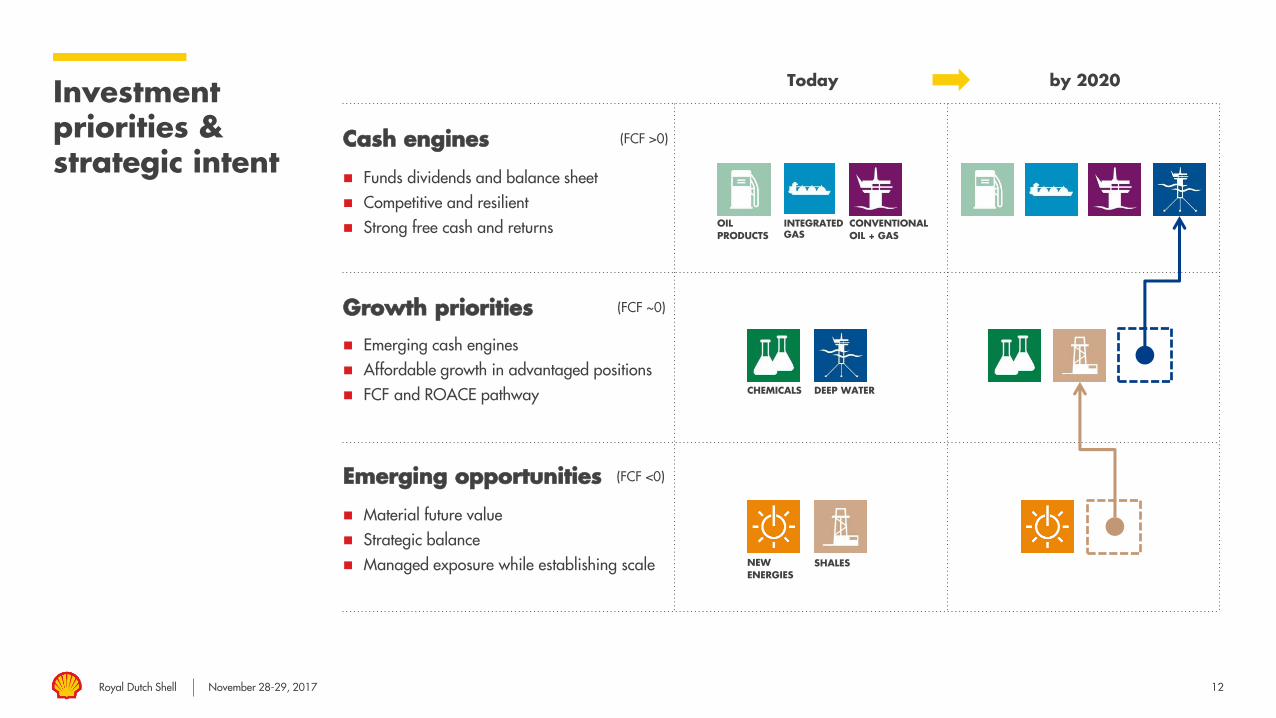
Investment priorities & strategic intent
Cash engines
Growth priorities
Funds dividends and balance sheet Competitive and resilient Strong free cash and returns
Material future value Strategic balance Managed exposure while establishing scale
Emerging cash engines Affordable growth in advantaged positions FCF and ROACE pathway
Today by 2020
(FCF >0)
(FCF ~0)
(FCF <0)
OIL PRODUCTS
CONVENTIONAL OIL + GAS
INTEGRATEDGAS
DEEP WATERCHEMICALS
SHALESNEW ENERGIES
Royal Dutch Shell November 28-29, 2017
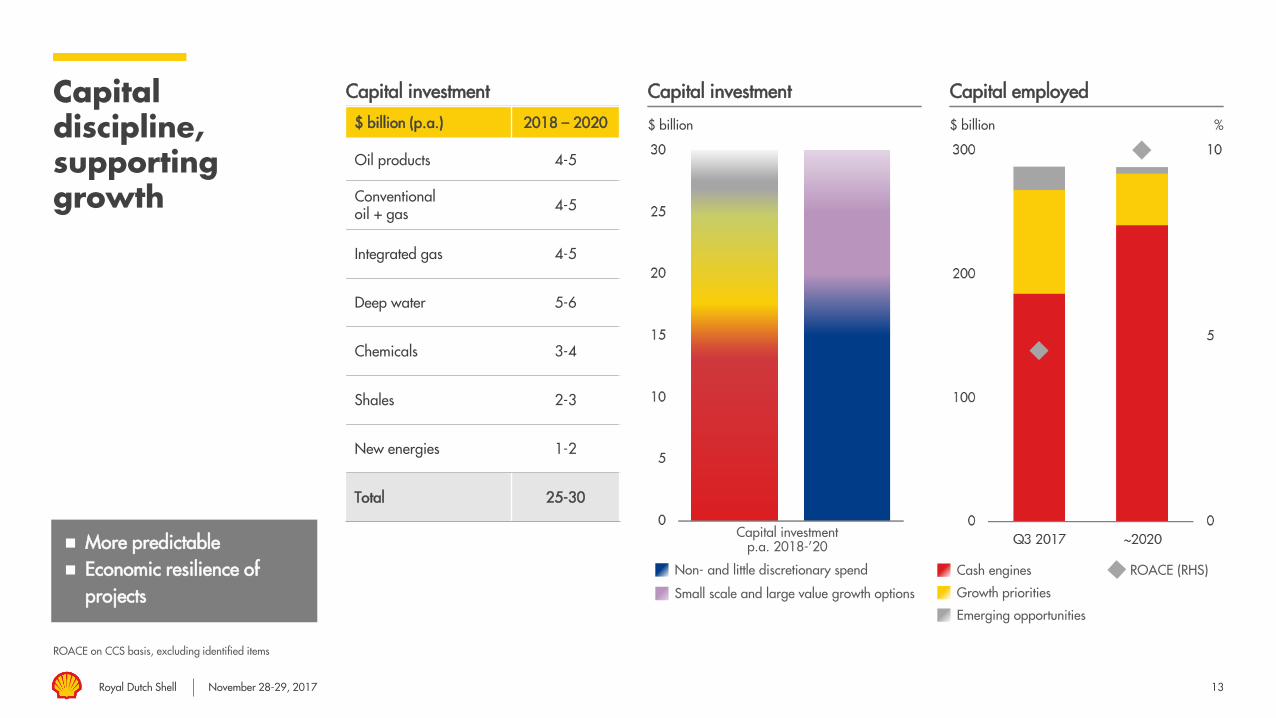
Capital discipline, supporting growth
ROACE on CCS basis, excluding identified items
Capital investment
$ billion
Capital investment
$ billion
Capital employed
More predictable Economic resilience of
projectsCash engines
Growth priorities
Emerging opportunities
ROACE (RHS)
%
Non- and little discretionary spend
Small scale and large value growth options
$ billion (p.a.) 2018 – 2020
Oil products 4-5
Conventional oil + gas 4-5
Integrated gas 4-5
Deep water 5-6
Chemicals 3-4
Shales 2-3
New energies 1-2
Total 25-30
Capital investment p.a. 2018-’20
13

Royal Dutch Shell November 28-29, 2017 14
2016 – 2019+
Delivering cash flow growth
Shell share at peak production
2016+ start-ups: >500kboe/d ; 9.5 mtpa LNG
Geismar AO4 (2018)
Schiehallion redevelopment (2017)Clair Ph2 (2018)
Coulomb (2018)
Fox Creek (2016-19+)
Permian (2016-19+)
Appomattox (2019+)
Kaikias Ph 1 (2019+)
Pennsylvania Chemicals (2019+)
Stones (2016)
Scotford HCU debottleneck (2016)
Brazil Deepwater(2016-19+)
Gorgon T3 (2017)
ML South start-up (2016)Baronia / Tukau Timur (2018)
Prelude FLNG (2018)
Nanhai China Chemicals (2019+)
Kashagan (2016)
Malikai (2016)
Pernis – Solvent deasphalting(2018)
Tempa Rossa(2018)
Rahab HarweelIntegrated Project (2019+)
Gbaran Ubie Ph2 (2017)Forcados Yokri Integrated Projects (FYIP) (2018)Southern Swamp AG (2019+)
Mexico retail entry (2017)

Royal Dutch Shell November 28-29, 2017
Price sensitivity:
+/- $10 Brent =
+/- ~$6 billion CFFO
Capital employed
($ bln)
Free cash flow*
($ bln p.a)
ROACE
(%)
~70% 25-30 >10
~20% 1-2 ~5
~5% (2) - (1) ~5
25-30
>5
~290 30-35 ~10
15
Financial performance:On-track
*2019-21: 2016 RT $60 per barrel, mid-cycle Downstream. **Includes Deep water in cash engines and Shales in growth priorities by 2020
2019-21 ~$6017Q3 – 4Q rolling ~$512019-21 ~$60June 2016 CMD
Cash engines
Growth priorities
Emerging opportunities
Organic FCF
Divestments & acquisitions
Total (incl. Corporate)
Capital employed($ bln end ’17Q3)
Free cash flow($ bln p.a)
ROACE
(%)
~60% ~15 ~8
~25% ~1 ~3
~5% ~-1 ~-4
~17
~10
287 ~27 ~5
Free cash flow*
($ bln p.a)
ROACE
(%)
15-20 ~10
~5 ~10
~0 <5
20-25
~5
20-30 ~10
Previous Update**

Royal Dutch Shell November 28-29, 2017 16
Thrive in the energy transition
Societal challenge
Sources: Population – UN World Population projections; Energy consumption: 2015 – IEA World Energy Outlook (“WEO”) 2017; 2070 outlook – Shell scenarios analysis from A Better Life with a Healthy Planet
CO2 emissions: 2015 – IEA WEO 2017; 2040 – IEA WEO 2017 Current policies scenario; 2070 – Shell scenarios analysis from A better life with a healthy planet.
Challenge for more and cleaner energy
Reduction required in the carbon intensity of every unit of energy consumed
2 0 1 5 2 0 7 0
>10 billion7 billion
1000 Exajoules570 Exajoules
Net ZeroEmissions
32 gt CO2e CO2
43 gt CO2e current policies
2 0 4 0
Increasing population
Increasing energy demand
Need to reduce CO2 emissions
Royal Dutch Shell November 28-29, 2017 17
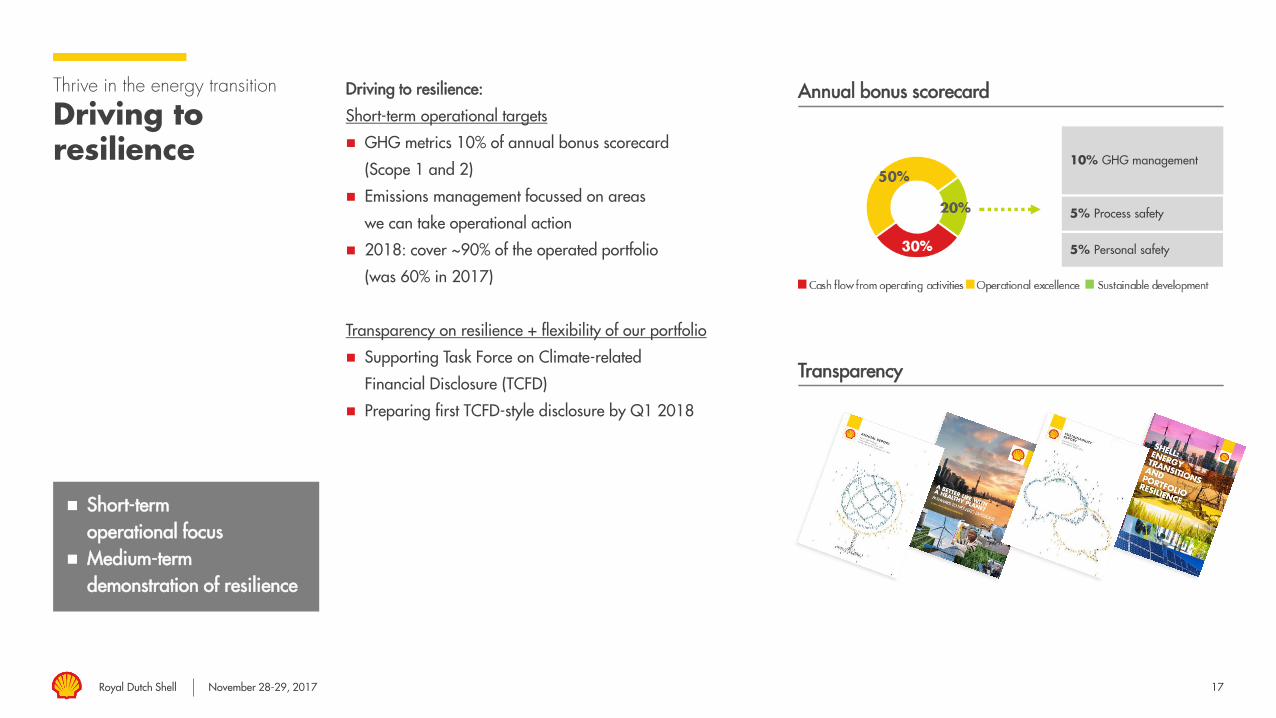
Thrive in the energy transition
Driving to resilience
Driving to resilience:
Short-term operational targets
GHG metrics 10% of annual bonus scorecard
(Scope 1 and 2)
Emissions management focussed on areas
we can take operational action
2018: cover ~90% of the operated portfolio
(was 60% in 2017)
Transparency on resilience + flexibility of our portfolio
Supporting Task Force on Climate-related
Financial Disclosure (TCFD)
Preparing first TCFD-style disclosure by Q1 2018
Annual bonus scorecard
Short-term operational focus
Medium-term demonstration of resilience
5% Process safety
5% Personal safety
10% GHG management
Transparency

Royal Dutch Shell November 28-29, 2017 18
Thrive in the energy transition
Ambition – Net Carbon Footprint
1: Net Carbon Footprint measured on an aggregate “well to wheel” or “well to wire” basis, from production through to consumption, on grams of CO2 equivalent per megajoule of energy products consumed; chemicals + lubricants products are excluded. Carbon
Footprint of the energy system is modelled using Shell methodology aggregating lifecycle emissions of energy products on a fossil-equivalence basis. The methodology will be further reviewed and validated in collaboration with external experts.
2: Potential society trajectory includes analysis from Shell scenarios estimate of Net Zero Emissions by 2070 and IEA Energy Technology Perspectives 2017; Potential illustrative Shell trajectory
WtW gCO2e/MJ1
Ambition to reduce Net Carbon Footprint1 of our energy products by around 20% by 2035
Covers full range of emissions from energy products
Emissions in the supply chain (Scope 1 + 2; ~15%)
Emissions from consumption of our energy products (Scope 3; ~85%)
Aim to reduce overall intensity including production, supply chain, and customers
Government policy, technology, and consumer choice will drive actual energy transition pace and outcomes
Drive strategy over time in step with society
5-year reviews to ensure in line with societal progress
Flexibility and mix of options to achieve ambition
Allows for oil and gas production growth offset by evolving product mix
Ambition for Net Carbon Footprint1
WtW gCO2e/MJ1
Potential tools to achieve our 2035 ambition
Ambitions: Reduce Net Carbon
Footprint1 of our energy products by ~20% by 2035
Be in line with society Net Carbon Footprint by 2050
Society trajectory2 Shell trajectory2
2 0 3 5 A M B I T I O N
Shell “business as usual”
~20% reduction by 2035
In line with society by 2050
(Scope 1+2)
Royal Dutch Shell November 28-29, 2017 19
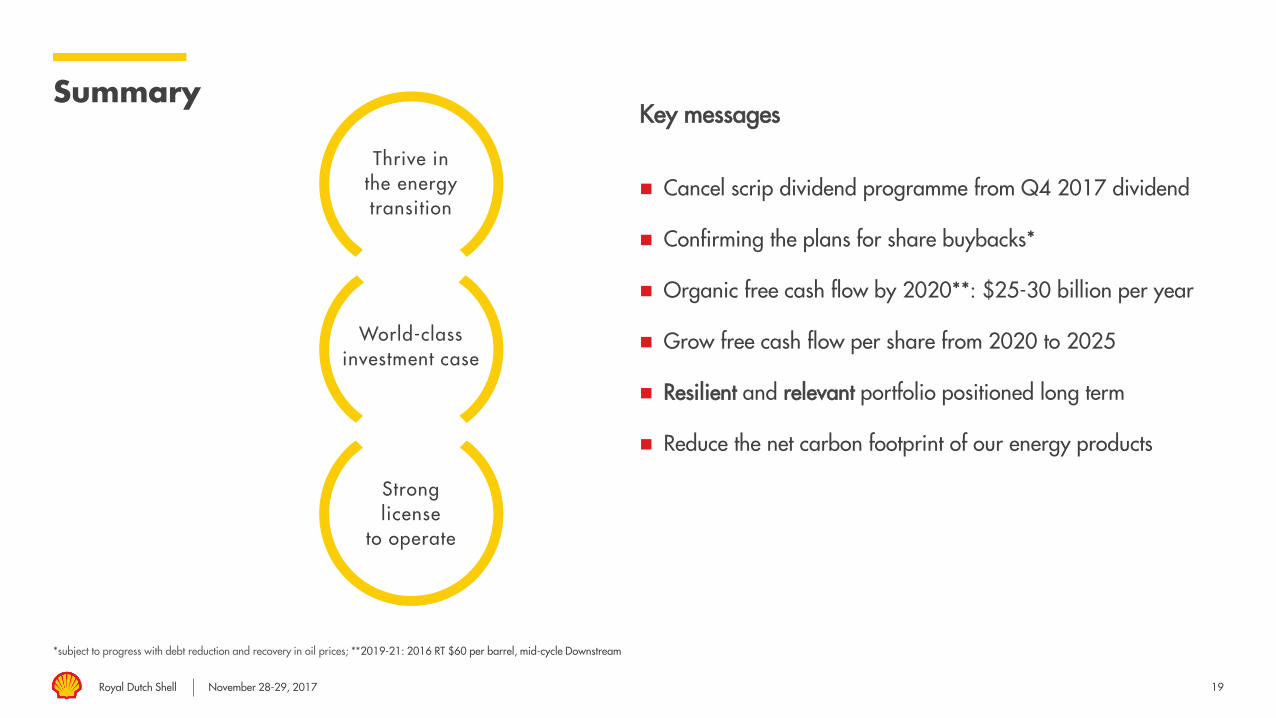
Summary
*subject to progress with debt reduction and recovery in oil prices; **2019-21: 2016 RT $60 per barrel, mid-cycle Downstream
Key messages
Cancel scrip dividend programme from Q4 2017 dividend
Confirming the plans for share buybacks*
Organic free cash flow by 2020**: $25-30 billion per year
Grow free cash flow per share from 2020 to 2025
Resilient and relevant portfolio positioned long term
Reduce the net carbon footprint of our energy products
Thrive in the energy transition
World-class investment case
Strong license
to operate

Royal Dutch Shell November 28-29, 2017
Jessica UhlChief Financial OfficerRoyal Dutch Shell

Royal Dutch Shell November 28-29, 2017 21
Financial framework
Foundation of the world-class investment case
Key features
Maximising value for shareholders through cycle
Multi-year timescales
Surplus free cash flow in up-cycle and dividends fully covered
in down-cycle
Gearing 0-30%; AA credit metrics
Thrive in the energy transition
World-class investment case
Strong license
to operate
Conservative financial management
FCF/share & ROACE growth Focus on shareholder
distributions

Royal Dutch Shell November 28-29, 2017 22
Financial framework
BG acquisition and shareholder distributions
BG post-offer intention statements
at the time of the acquisition
Pay at least dividends of $1.88 per
Shell share for 2016
Subject to progress with debt reduction
and recovery in oil prices:
Withdraw the scrip dividend
programme in 2017
Share buyback programme of at least
$25 billion over the period 2017-2020
Growing shareholder distributions
Delivering on the BG post-offer intention statements
Capital investment
$25-30 billion
Dividend
Interest
Debt reduction
to 20% gearing
Buybacks
Divestment
proceeds
CFFO
Surplus
CFFO

Royal Dutch Shell November 28-29, 2017 23
Free cash flow performance and payout
* 2016 RT $60 per barrel, mid-cycle Downstream
2014 cash dividend includes $3.3bln share buy backs, more than offsetting scrip issuance of $2.4bln.
$ billion
Distributions from free cash flow
Financial transformation 2014-2017
2019-2021 average:FCF $30-35 billion
Organic FCF
Divestment proceeds less acquisitions
Cash dividend
Scrip dividend Interest paid
$99/bbl $51/bbl $60/bbl*
2014 17Q34Q rolling
2019-2021average

Royal Dutch Shell November 28-29, 2017 24
Achieving divestment and debt reduction objectives
Integrated Gas split out from Upstream from 2011 onwards
* Includes Gabon, UK North Sea and Woodside divestments
$ billion
Divestment proceeds
$ billion
Net debt & gearing
Visibility on lower gearing through progress on divestments
%
Downstream/CorporateUpstreamIntegrated Gas
Announced and well-advanced deals
Net debt
Gearing (RHS)
Gearing with impact of divestments completed since Q3 2017 included (RHS)*

Royal Dutch Shell November 28-29, 2017 25
Deliver new projects:CFFO growth 2014 – 2020
Pricing assumes, 2017E:$50, 2018:$60, 2020:2016 RT $60 per barrel,
Thousand boe per day
Shell project start-ups 2014 through 2020 Selected key projects
~$10 billion CFFO by 2018 Incremental ~$5 billion
2019-2020 period Delivery de-risked On-stream projects
ramping up
$ billion p.a.
Production CFFO (RHS)
AppomattoxBrazil FPSO 7-10Brazil FPSO 11-14Stones
Permian & Fox Creek
GorgonPrelude
KashaganSchiehallion redevelopmentClair Ph2
Nanhai China ChemicalsGeismar AO4
Pernis SDAScotford
Started Under construction
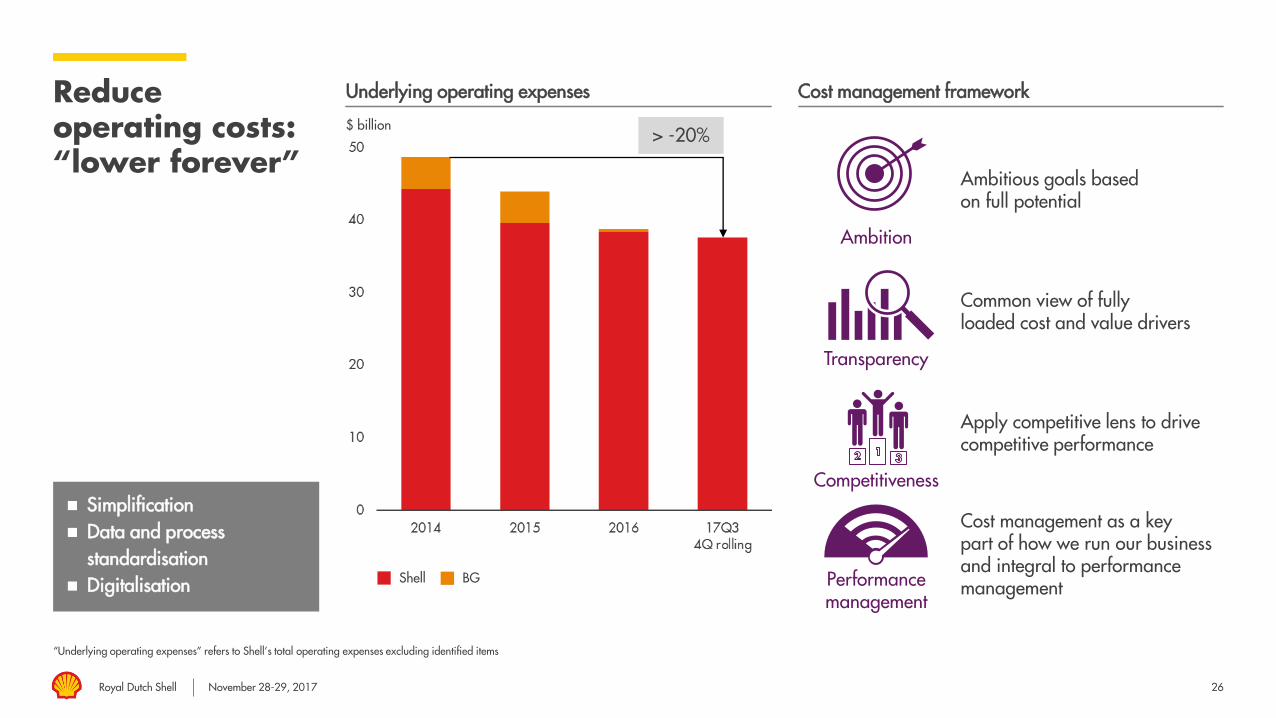
Royal Dutch Shell November 28-29, 2017 26
Reduce operating costs: “lower forever”
“Underlying operating expenses” refers to Shell’s total operating expenses excluding identified items
$ billion
Underlying operating expenses Cost management framework
Simplification Data and process
standardisation Digitalisation
> -20%
Shell BG
Cost management as a key part of how we run our business and integral to performance management
Apply competitive lens to drive competitive performance
Common view of fully loaded cost and value drivers
Ambitious goals based on full potential
Performance management
Competitiveness
Transparency
Ambition

Royal Dutch Shell November 28-29, 2017 27
Higher capital efficiency and more consistent capital investment
Capital investment excludes BG acquisition in 2016.
$ billion
Capital investment
Capital discipline Resilient projects Flexibility Shell BG
$25-30 billion
> -40%
Increased capital efficiency
Resilient projects
$30 billion per year ceiling
Options to reduce capital investment below $25 billion if warranted
Sustain current cash flow at a capital investment level of $17- 20 billion

Royal Dutch Shell November 28-29, 2017 28
World-class investment case
Cash flow priorities
Priorities for cash Debt reduction Dividends
Buybacks & capital
investment
1 2 3
Continue to reduce gearing to 20%
Cancel scrip dividend Buy back shares
Progress towards a world-class investment case Increase shareholder distributions

Royal Dutch Shell November 28-29, 2017
Maarten WetselaarIntegrated Gas & New Energies DirectorRoyal Dutch Shell

Royal Dutch Shell November 28-29, 2017
Cash engine
As of Q3 2017; capital employed includes new energies; average capital investment per annum in period 2018-20
Creating & securing demand Optimisation Managing supply
Capital employed: $90 billion
Production: 1.0 mboe/d
Liquefaction volume:34 mtpa
LNG sales volumes: 64 mtpa
Capital investment: $4-5 billion
30
LNG
Gas and power
Gas-to-liquids premium products
Marketing and trading
Shipping and transport
Regasification
Gas and liquids production
Liquefaction
Gas-to-liquids
Integrated Gas
World leader Growing markets Differentiated portfolio Cash delivery

Royal Dutch Shell November 28-29, 2017
Capital employed
$ per barrel
31
Integrated Gas
Financial performance
Earnings and ROACE on CCS basis, excluding identified items. Capital employed under construction: assets under construction plus exploration and evaluation assets.
$ billion
Cash flow from operations
Earnings and ROACE
$90 billion as of Q3 2017
$ billion
LNG liquefaction and sales volumes
Resilience Cash delivery and growth $8 – 10 billion organic FCF
by 2020 ~10% ROACE by 2020
CFFO excl. working capital Brent (RHS)
Earnings ROACE (RHS)
%
Liquefaction volumes Sales volumes
In service Under construction
$62 billion as of Q3 2015
Million tonnes

Royal Dutch Shell November 28-29, 2017 32
Integrated Gas
Gas-to-liquidsvalue chain
Pearl - the world’s largest gas-to-liquids plant
Marketing integration
Integrated value chain Differentiated products Premium vs Brent
Continuous innovation
Record-breaking offshore performance
Jane.Adam: replace with
piucture of Helix Ultra only
North Field Pearl GTL Plant
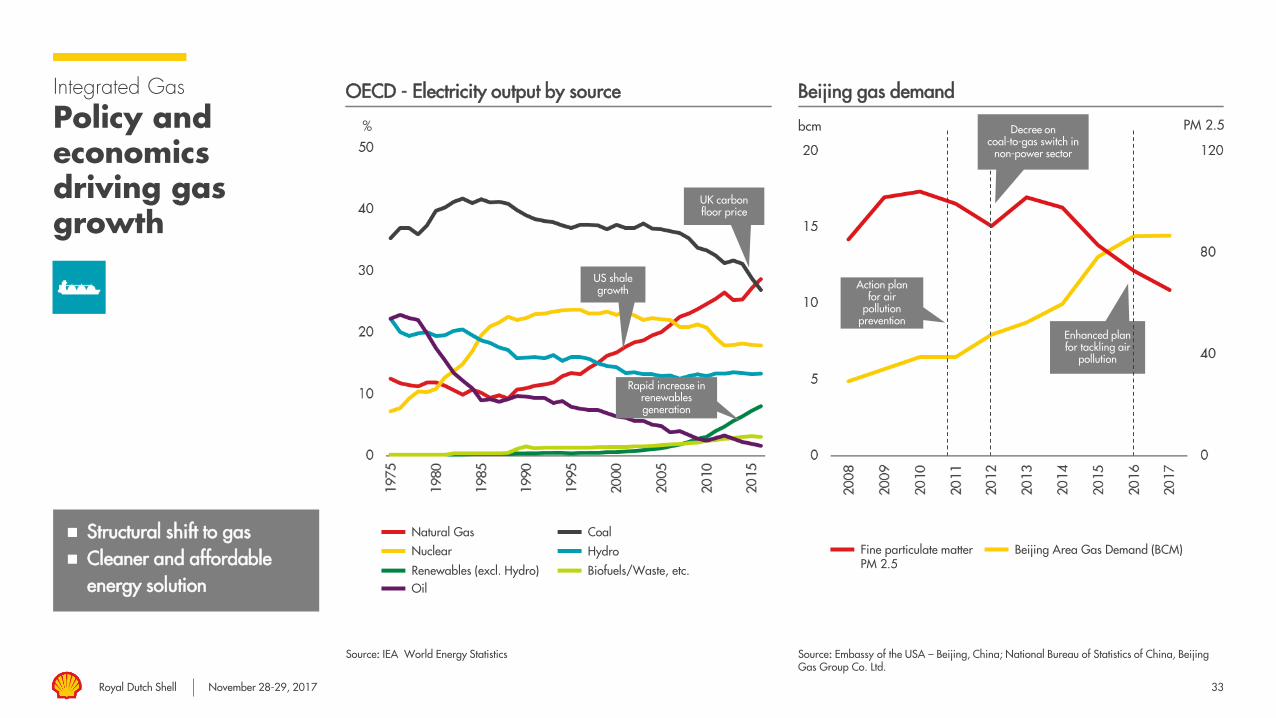
Royal Dutch Shell November 28-29, 2017 33
Integrated Gas
Policy and economics driving gas growth
OECD - Electricity output by source
bcm
Beijing gas demand
Structural shift to gas Cleaner and affordable
energy solution
Source: Embassy of the USA – Beijing, China; National Bureau of Statistics of China, Beijing Gas Group Co. Ltd.
Action plan for air
pollution prevention
Enhanced plan for tackling air
pollution
Fine particulate matterPM 2.5
Beijing Area Gas Demand (BCM)
Source: IEA World Energy Statistics
UK carbon floor price
US shale growth
Rapid increase in renewables generation
PM 2.5
Natural Gas Coal
Nuclear Hydro
Renewables (excl. Hydro) Biofuels/Waste, etc.Oil
Decree on coal-to-gas switch in
non-power sector
%

Royal Dutch Shell November 28-29, 2017 34
Integrated Gas
LNG supplyand demand
Source: Shell interpretation of Wood Mackenzie- LNG Tool Q3 2017, IHS Markit, Poten, BNEF, FGE.
Million tonnes
2015-20: 50% supply capacity growth
50% of new supply capacity already in operation
2017: supply growth matched by solid demand
Supply/demand gap emerging early 2020’s
New FIDs challenged
LNG supply/demand gap Capacity additions – 2015 to 2020
Supply growth driven by Australia & USA projects
LNG supply in operation
Demand forecasts
LNG supply under construction Annualized capacity additions under construction
Annualized capacity additions in operation
Cumulative share online (RHS)
Source: IHS Markit Liquefaction Projects Database Oct 2017
Million tonnes %

Royal Dutch Shell November 28-29, 2017
Integrated Gas
LNG – Global integrated value chain
Largest LNG marketer
Largest supplier to China & JKT
Leader in LNG for transport
Gas advocacy
Deliveries to 25+ countries
2 LNG cargoes loaded every day
Regas capacity in 10 terminals
90 LNG carriers
Production: 1 million boe/d
13 LNG plants – all supply basins
LNG supply from 17 countries
C R E AT I N G A N D S E C U R I N G D E M A N D O P T I M I S AT I O N M A N A G I N G
S U P P L Y
Leverage portfolio flexibility and
arbitrage opportunities
Market-driven value chain
35
JKT: Japan, Korea, Taiwan
Royal Dutch Shell November 28-29, 2017 36
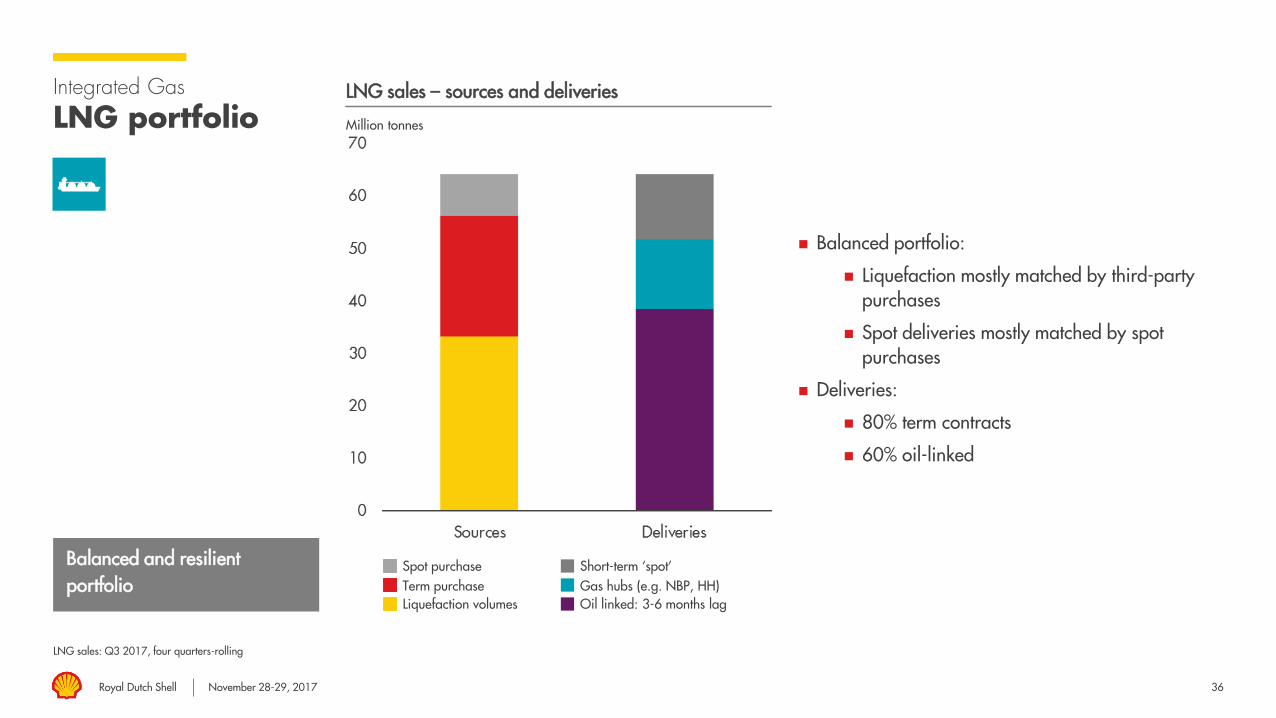
Integrated Gas
LNG portfolio
LNG sales: Q3 2017, four quarters-rolling
Million tonnes
Balanced portfolio:
Liquefaction mostly matched by third-party purchases
Spot deliveries mostly matched by spot purchases
Deliveries:
80% term contracts
60% oil-linked
LNG sales – sources and deliveries
Short-term ‘spot’Gas hubs (e.g. NBP, HH)Oil linked: 3-6 months lag
Term purchaseLiquefaction volumes
Spot purchaseBalanced and resilient portfolio

Royal Dutch Shell November 28-29, 2017 37
Integrated Gas
Create and secure demand
2017 - Shell and JV marketed volumes
% total sales – geographic split
LNG customers Market-specific strategies
Globally balanced and diversified customers portfolio
Gasnor
Dragon RotterdamEurope
BarcelonaAttiki
Qatar
Brazil
Altamira`
Costa Azul
Cove Point
Lake Charles
Canada
USAChina
Hangzhou
Singapore
Australia
Indonesia
India
HaziraMahanagar Gas`
LNG Import terminals (incl. capacity rights)
Natural Gas Distribution
D-LNG Fuel Markets
D-LNG Fuel Target Markets
Gas and power marketing and trading
LNG Markets
Evolving business model in mature markets
Securing positions in priority growth markets
Trading portfolio optimization
Grow Downstream-LNG fuel markets
Gas advocacy
Elba

Royal Dutch Shell November 28-29, 2017 38
Integrated Gas
World-class LNG supply portfolio
Source: Shell Financial Statement, IHS Markit for 3rd parties’ capacity – October 2017 - Total excl. recently announced Engie acquisition
Million tonnes per annum
Liquefaction capacity by independent company Leading portfolio
13 liquefaction plants
41 million tonnes per annum capacity
95% reliability
Utilisation upside – feedgas availability
Focus on unit cost reduction All supply basins Operational excellence
In operation Under construction
Brunei LNGMalaysia LNG
Sakhalin
QCLNG
PreludeNorth West Shelf
Gorgon
Gasnor
Existing
Under construction
Oman LNG
Qatar Gas 4
Nigeria LNG Atlantic LNG
Peru LNG
Egypt LNG

Royal Dutch Shell November 28-29, 2017
North American projects set new market benchmark
‘’Build’’ as well as ‘’Buy’’ opportunities
Advantaged positions
Capital efficiency – technical & commercial innovation
Differentiated portfolio and financial strength
39
Integrated Gas
Selective growth: pre-FID portfolio
Cost of supply includes shipping costs, excludes finding costs and fiscal take
$/mmBtu
LNG pre-FID unit cost of supply Cost of supply is key
Competitive pre-FID opportunities in all supply basins
LNG Canada
Lake Charles
Abadi
Browse
Tanzania
Sakhalin expansion
Nigeria LNGexpansion
Baltic LNG
Mozambique GTL
In-/Post-FEED
Pre-FEED

Royal Dutch Shell November 28-29, 2017
Cash engine
As of Q3 2017; capital employed includes new energies; average capital investment per annum in period 2018-20
Creating & securing demand Optimisation Managing supply
Capital employed: $90 billion
Production: 1.0 mboe/d
Liquefaction volume:34 mtpa
LNG sales volumes: 64 mtpa
Capital investment: $4-5 billion
40
LNG
Gas and power
Gas-to-liquids premium products
Marketing and trading
Shipping and transport
Regasification
Gas and liquids production
Liquefaction
Gas-to-liquids
Integrated Gas
World leader Growing markets Differentiated portfolio Cash delivery

Royal Dutch Shell November 28-29, 2017
Appomattox hull arrival in Ingleside Texas – USA
Andrew BrownUpstream DirectorRoyal Dutch Shell

Royal Dutch Shell November 28-29, 2017 42
Upstream
High-grading position
Operational excellence focus
Driving continuous improvement
Advantaged portfolio
Delivery track record
Continuing to lower costs
Enhance position
Improved competitiveness
Accelerating selective growth
Cash engines Growth priorities Emerging opportunities
Delivering profitable growth
Conventional oil & gas Deep water Shales
$39 billion
1.6 mboe/d
$4-5 billion
Capital employed:
Production:
Capital Investment:
$63 billion
0.7 mboe/d
$5-6 billion
$18 billion
0.3 mboe/d
$2-3 billion
Capital employed:
Production:
Capital Investment:
Capital employed:
Production:
Capital Investment:
Capital employed and production based on Q3 2017; capital investment in period 2018-20; data excludes oil sands
Perdido – USA Gulf of Mexico Permian - USAGbaran Ubie - Nigeria

Royal Dutch Shell November 28-29, 2017
CFFO Quarterly
43
Upstream financial performance
$ billion
Cash flow from operations
$ CFFO per boe
Unit cash flow
$ billion
Organic free cash flow
$ billion
Earnings by strategic theme & ROACE
Drive stability & sustain cash delivery
Portfolio delivering higher cash margins
$ per barrel
%
Brent (RHS)
16Q1 16Q3 16Q4 17Q116Q2 17Q317Q2
+$10 per barrel margin
$52 $52$44$99Brent
Conventional oil & gas ShalesDeep water Other ROACE (RHS)
4 quarter rolling (RHS)
$ billion
Cash flow from operations includes working capital; earnings excludes identified items; data includes oil sands

Royal Dutch Shell November 28-29, 2017 44
“Fit for the future”
Improving results
Gap to potential
Granular improvement plans
Rigorous cadence
50% fewer tier 1 & 2 incidents
Production Availability Total costProcess safety
Competitive unit operating costs
>90%Unlock 150 kboe/d from optimization
Million boe per day
Production & availability
$ billion
Upstream operating costs
%
Availability (RHS)BG portion in integration year
ProductionBG portion in integration year
Total Upstream operating costs
2018 aspirations

Royal Dutch Shell November 28-29, 2017 45
Scoping & executing for resilience
Replication & standardisation Competitive scoping Project execution
3 platform tiebacks with a standard design in Malaysia
30% below best in class in the industry development costs
72 kboe/day + ~250 million boe resources
Shell share 30%
Vito project re-scoped to reduce costs 70% versus initial estimates
<$40 per barrel break-even
100 kboe/day + ~300 million boe resources
Shell share ~63%
New processing plant in Fox Creek
Full modular construction
30% lower cost than competitor plants
5 months ahead of schedule + 35% under budgetFocus on capital efficient
and profitable growth
Fox Creek Kaybob plant - CanadaVito – USA Gulf of MexicoSK408 - Malaysia
Comparisons based Shell analysis of public information; production and resources (2P + 2C development pending) are Shell estimates of total gross values; production is an estimate of total gross peak rate

Royal Dutch Shell November 28-29, 2017 46
Project delivery 2016+
Key Upstream start-ups & under construction
Started >400 kboe/d since 2016
>600 kboe/d still to start through into the early 2020’s
FPSO 9 100 kboe/d Shell 30%
Kashagan 370 kboe/d Shell 17%
Stones 50 kboe/d Shell 100%
FPSO 7+8+10 450 kboe/d Shell 25%
ML South 40 kboe/d Shell 35%
On-stream
Forcados Yokri 50 kboe/d Shell 30%
Gbaran Ubie Ph2 150 kboe/d Shell 30%
Malikai 60 kboe/d Shell 35%
Schiehallion redevelopment 125 kboe/d Shell 45%
Baronia/Tukau Timur 65 kboe/d Shell 40%
Clair Ph2 100 kboe/d Shell 28%
Coulomb Ph2 10 kboe/d Shell 100%
Kaikias Ph1 40 kboe/d Shell 80%
Tempa Rossa 50 kboe/d Shell 25%
Southern Swamp AG 30 kboe/d Shell 30%
Rabab HarweelIntegrated Project 40 kboe/d Shell 34%
Permian & Fox Creek 200 kboe/dincremental Shell shareby 2020
FPSO 11+12+13+14+15 750 kboe/d Shell 25%1
Appomattox 175 kboe/d Shell 79%
Libra EWT FPSO 50 kboe/d Shell 20%
1 Berbigão, Sururu and Atapú West (3 FPSOs) are subject to unitisation agreements
Individual project volumes are total gross peak production with the exception of the Brazil FPSOs which is oil capacity as per operator; sum is estimate of Shell share production at peak

Royal Dutch Shell November 28-29, 2017 47
Conventional oil & gas
Portfolio & priorities
Million boe per day
Production & availability
$ billion
Operating costs
$ CFFO per boe
Unit cash flow
Nigeria
KazakhstanUK
Norway
Divesting the non-core assets
Improving existing operations – fit for the future
Negotiating to more resilient positions
Selective growth to offset decline
%
4Q rolling
Production Availability (RHS)
Royal Dutch Shell November 28-29, 2017 48
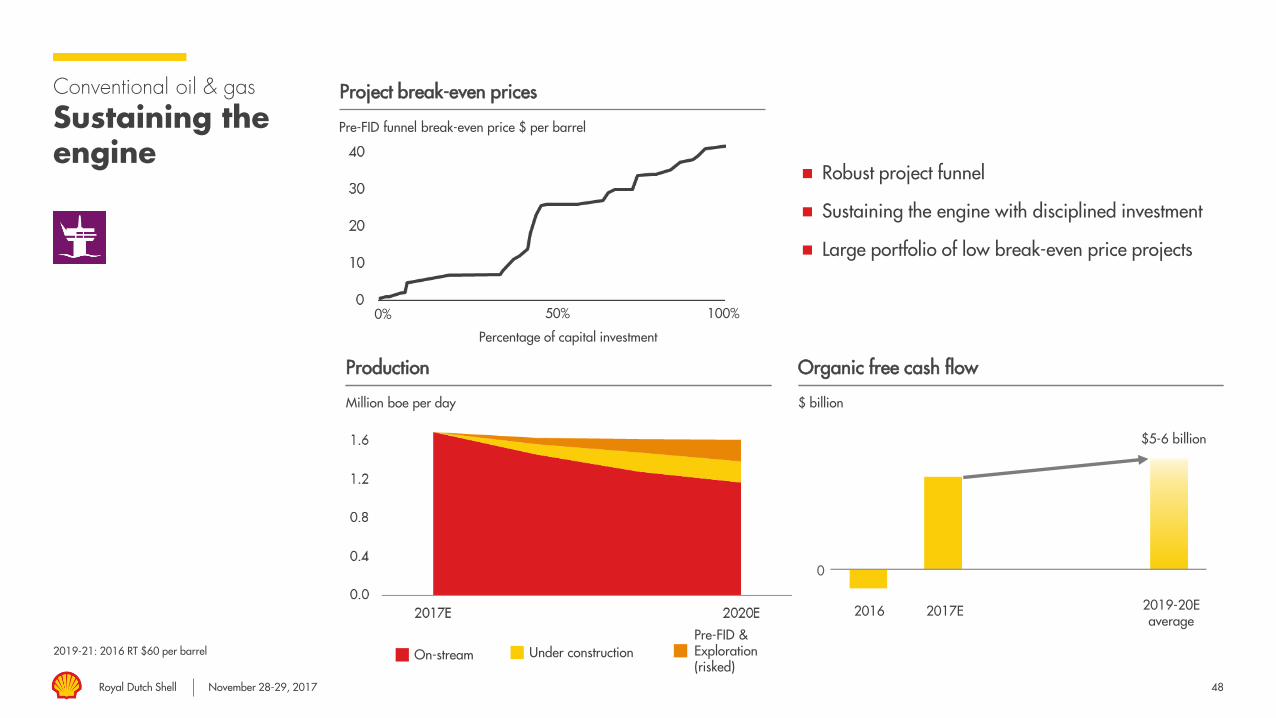
Conventional oil & gas
Sustaining the engine
2019-21: 2016 RT $60 per barrel
Million boe per day
Production
Project break-even prices
$ billion
Organic free cash flow
On-stream Under constructionPre-FID &Exploration (risked)
0
2016 2019-20Eaverage
2017E
$5-6 billion
Pre-FID funnel break-even price $ per barrel
Robust project funnel
Sustaining the engine with disciplined investment
Large portfolio of low break-even price projects
Percentage of capital investment
0% 100%50%
Royal Dutch Shell November 28-29, 2017 49
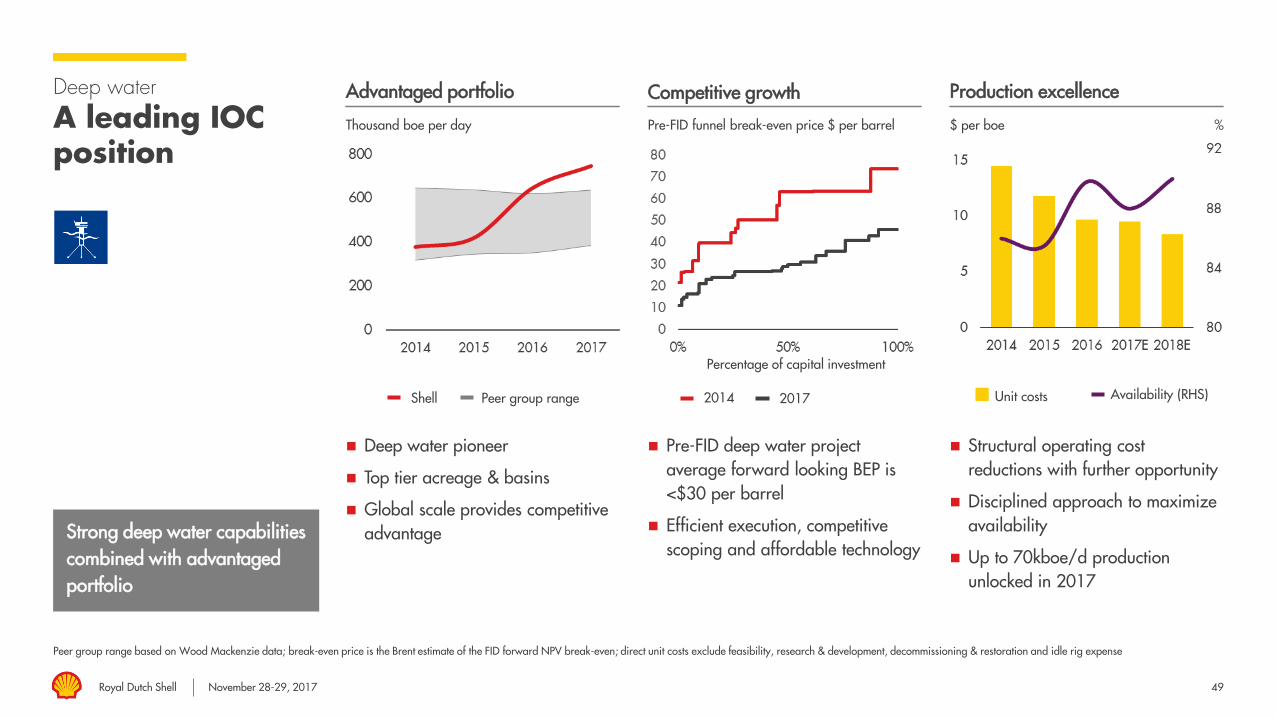
Deep water
A leading IOC position
Thousand boe per day
Advantaged portfolio
Pre-FID funnel break-even price $ per barrel
Competitive growth
$ per boe
Production excellence
Deep water pioneer
Top tier acreage & basins
Global scale provides competitive advantage
Pre-FID deep water project average forward looking BEP is <$30 per barrel
Efficient execution, competitive scoping and affordable technology
Structural operating cost reductions with further opportunity
Disciplined approach to maximize availability
Up to 70kboe/d production unlocked in 2017
Strong deep water capabilities combined with advantaged portfolio
%
2014 2017Shell Peer group range Availability (RHS)Unit costs
Percentage of capital investment
Peer group range based on Wood Mackenzie data; break-even price is the Brent estimate of the FID forward NPV break-even; direct unit costs exclude feasibility, research & development, decommissioning & restoration and idle rig expense

Royal Dutch Shell November 28-29, 2017 50
Deep water
World class delivery
Progressing to >900 kboe/d by 2020
Maintain production through mid-2020s with discovered volumes & defined projects
Upside growth with exploration
Capital discipline – doing more with less
Accelerating and increasing organic free cash flow by lowering costs & improving production
2019-21: 2016 RT $60 per barrel
Transition from growth priority to cash engine
Thousand boe per day
Production
$ billion
Organic free cash flow
BrazilGulf of Mexico Other
$6-7 billion
0
2016 ~2019-21Eaverage2017E

Royal Dutch Shell November 28-29, 2017 51
Shales
Enhancing competitiveness
$ per boe 2017 YTD
Direct field costs - Permian
$ million 2017 YTD (normalized to 7500’ lateral)
Drill & complete - Permian Capabilities & technology
Reduced direct field operating costs by 33% in past year and 60% in last 2 years
Reduced drill and complete per well by 35% in last 2 years
Canada remote drilling center used for Argentina wells
iShales end-to-end future field development solutionNimble as an independent
& leverage capabilities of a major
Drill Complete
Basinco-ventures ShellBasin
co-ventures ShellRemote drilling center - Canada

Royal Dutch Shell November 28-29, 2017 52
Shales
Building a growth business
2019-21: 2016 RT $60 per barrel
Near-term selective acceleration of Permian & Fox Creek Duvernay
Growth of ~200 kboe/d by 2020
Average break-even price ~$40 per barrel
Accelerating free cash flow break-even versus 2016 Capital Markets Day by 1 year within previous capital guidance
Build a material & sustainable growth business post 2020
Thousand boe per day
Permian 2017 growth
Thousand boe per day
Production 2020 growth
$ billion
Organic free cash flow
Western Canada Gas
Western Canada LTO
Appalachia
Permian
Argentina
Haynesville
Liquids rich
Dry gasFox Creek Duvernay
+75%
Actual Estimate
>200%
Dry gas Permian Fox Creek &Argentina
0
$1-2 billion
2016 2019-20Eaverage2017EJan Dec

Royal Dutch Shell November 28-29, 2017 53
Exploration
Track record & strategy
Resources added 2012 to 2016
Exploration to potential development#
Maximizing value through heartlands
Spend ~$2 billion/year
Focus on heartlands and near field
Build on heartland success to sustain future growth
Targeting emerging opportunities to supplement Heartlands
Value maximized through integration & efficient hydrocarbon maturation
2018 targets
Heartlands
Frontier
Trinidad &Tobago
USA
Tanzania
Nigeria
UKNetherlands
Albania
Oman Egypt
Russia
BruneiMalaysia
2017 Success
Norway
Bolivia Australia
Algeria
Brazil
Myanmar
New ZealandNew Acreage
~4 billion
boe
Conventional oil & gas Integrated gas Deep water Heartland wells drilled Success rate (RHS)
%

Royal Dutch Shell November 28-29, 2017
Reserves (SEC proved)Discovered resources (2P+2C development pending)
Conventionaloil & gas
Deep water Shales
54
Robust development potential
Billion boe
Significant discovered resources pending development
Project costs down dramatically with room for further reduction
Competitive project funnel to develop
Reserves & resources
$ per boe
Deep water unit development costs
-45%
$ per boe
COG operated unit development costs
-45%
Shales break-even price (Permian example)$ per barrel
0
40
20
Net risked well count260013000
<$40 $40-50

Royal Dutch Shell November 28-29, 2017 55
2018-2022
Pre-FID Options
Individual project volumes are Shell’s current estimates of total gross peak production; sum is estimate of Shell share production at peak excluding shales
Potential >750 kboe/d peak
Penguins redevelopment 45 kboe/d Shell 50%
WDDM 9B 60 kboe/d Shell 50%
PDO enhanced recovery & waterflood projects 50 kboe/d Shell 34%
Gumusut-Kakap Ph2 50 kboe/d Shell 30.4%
Tyra future 75 kboe/d Shell 37%
Pegaga 95 kboe/d Shell 20%
Vito 100 kboe/d Shell 63.11%
Libra 1 160 kboe/d Shell 20%
Libra 2+3+4 ~450 kboe/d Shell 20%
Argentinashales options
North America shales options
Bonga South West 175 kboe/d Shell 42.95%
Val D’Agri Ph2 65 kboe/d Shell 39%
Pierce Depressurisation 25 kboe/d Shell 92.52%
HI development 75 kboe/d Shell 40%
Gbaran Ph3 70 kboe/d Shell 30%
Marjoram/Rosmari 60 kboe/d Shell 75%
Bonga main life extension 90 kboe/d Shell 55%
Clair South 60 kboe/d Shell 28%
Ormen Lange recovery 50 kboe/d Shell 18%
Assa North 60 kboe/d Shell 30%
Uzu development 45 kboe/d Shell 30%
Kashagan CC01 100 kboe/d Shell 17%
KGK expansion Ph1 40 kboe/d Shell 29%
Pearls Khazar 40 kboe/d Shell 55%
Kalamkas 55 kboe/d Shell 17%
Jackdaw 40 kboe/d Shell 70%
Troll Ph3 255 kboe/d Shell 8.1%
SK408 72 kboe/d Shell 30%

Royal Dutch Shell November 28-29, 2017 56
Upstream
High-grading position
Operational excellence focus
Driving continuous improvement
Advantaged portfolio
Delivery track record
Continuing to lower costs
Enhance position
Improved competitiveness
Accelerating selective growth
Cash engines Growth priorities Emerging opportunities
Delivering profitable growth
Conventional oil & gas Deep water Shales
$39 billion
1.6 mboe/d
$4-5 billion
Capital employed:
Production:
Capital Investment:
$63 billion
0.7 mboe/d
$5-6 billion
$18 billion
0.3 mboe/d
$2-3 billion
Capital employed:
Production:
Capital Investment:
Capital employed:
Production:
Capital Investment:
Capital employed and production based on Q3 2017; capital investment in period 2018-20; data excludes oil sands
Perdido – USA Gulf of Mexico Permian - USAGbaran Ubie - Nigeria

Royal Dutch Shell November 28-29, 2017
John AbbottDownstream DirectorRoyal Dutch Shell
Bangkok – Thailand

Royal Dutch Shell November 28-29, 2017 58
Downstream Cash engine
Capital employed and volumes based on Q3 2017
Capital investment is in period 2018-2020; Source brand preference: Ipsos – Global Customer Tracker (covering 30+ markets)
Further strengthen our financial performance
Upgrading our portfolio
Returns + free cash flow improvement
Chemicals growth priority
Marketing Refining & Trading Chemicals
Growth priority
Customer offer + brand leverage
Differentiated products
Global #1 Brand
Full integration with trading
Improve retained assets
Reducing refining capacity
Advantaged feedstock
Strong product portfolio
Proprietary technology
$18 billion
6.5 mboe/d
$23 billion
2.6 mboe/d
$15 billion
~17 mtpa
$3-4 billion
Capital employed: Capital employed:
Sales volumes:
Capital Investment:
Refinery processing:
Capital employed:
Sales volumes:
$4-5 billionCapital investment:

Royal Dutch Shell November 28-29, 2017
Marketing
59
Downstream financial performance
Earnings and ROACE on CCS basis, excluding identified items; Source brand preference: Ipsos – Global Customer Tracker (covering 30+ markets)
$ billion
Cash flow
%
Global brand preference
$56 billion at end Q3’17
Capital employed
$ billion
Earnings by sub-segments + ROACE
Strong cash generation
Oil Products: $6 - 7 billion organic FCF by 2020
Competitive returns
%
ROACE (RHS)Refining & Trading
ChemicalsMarketingShell Other majors
$ billion
Working capital movement
CFFO excluding working capital
Free cash flow (RHS) Refining & Trading Chemicals

Royal Dutch Shell November 28-29, 2017
1,050,000 bpd 875,000 bpd 460,000 bpd
Deer Park ( 50%)
Buenos Aires (100%)
Miro (32%)Rheinland (100%)
Schwedt (38%)
Pernis (100%)
Pulau Bukom(100%)
Tabangao (55%)
Fredericia (100%)
Puget Sound(100%)
Martinez (100%)
Scotford (100%)
Sarnia (100%)
Durban (38%)
Karachi (30%)
Al Jubail (50%)
60
Investing in selective growth
Refining and Trading
Shell capacity as at end Q3 2017
Refinery capacity in thousand barrels per day (100%)
Retain competitive sites
Exits 2005–16Announced exitsRetained site 2017
Refineries (barrels per day)
Announced exits
London Rotterdam
Singapore
Dubai
Houston
Convent (100%)Norco (100%)
Trading offices
0 – 100,000101,000 – 200,000201,000+
Calgary
Beijing

Royal Dutch Shell November 28-29, 2017 61
Downstream asset integration:Rhine envelope & Eastern US portfolio
Rhine envelope Integration of Motiva assets to the DS portfolio
P o r t A r t hu rC o n v en t
N o r co
Global trading options Rostock
PCK SchwedtHarburg
SeefeldArnhem
Pernis
Rheinland
Flörsheim
Würzburg
LobauLinz
Salzburg
Zurich
Geneva
BertrangeLudwigshafen
MiRO Karlsruhe
Altmannshofen
Moerdijk
RMR
RRP
Chemical plant
Refinery
Storage depot
Pipeline
100% Shell assets
Joint venture
Shell terminalsShell refineriesShell markets
Motiva
Royal Dutch Shell November 28-29, 2017 62
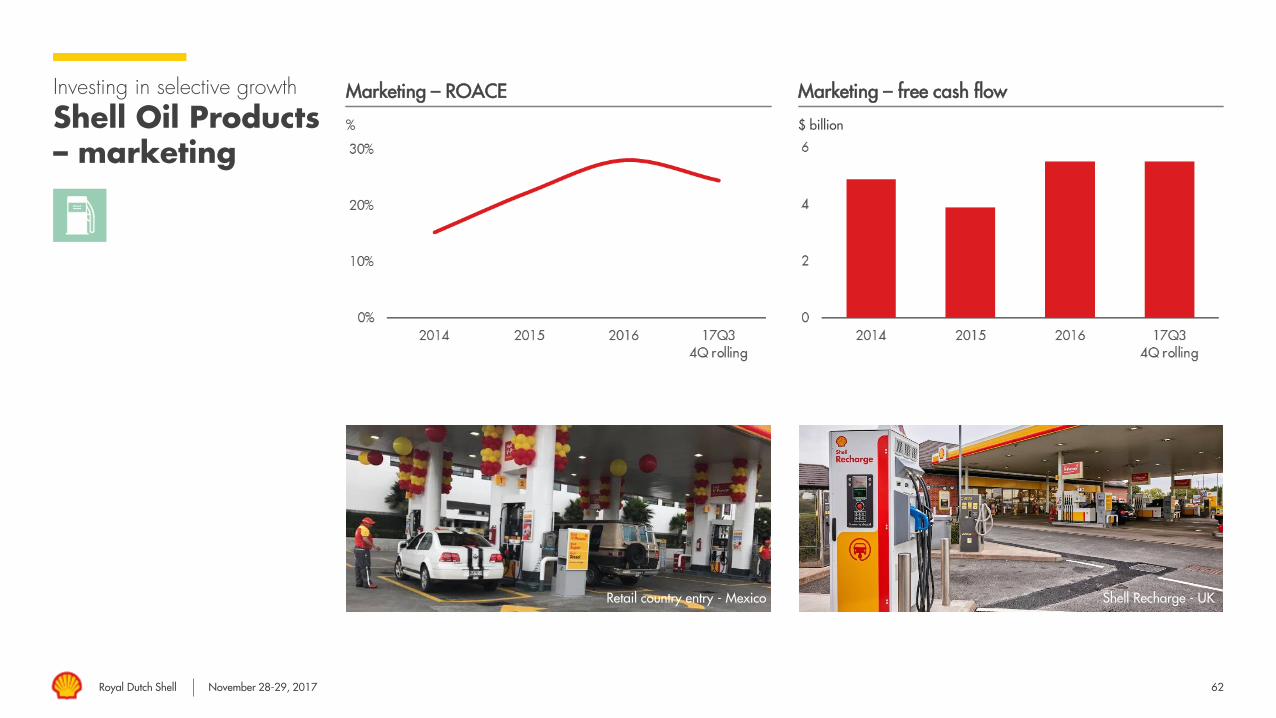
Investing in selective growth
Shell Oil Products – marketing
%
Marketing – ROACE
$ billion
Marketing – free cash flow
Mexico – Retail country entry
Retail country entry - Mexico Shell Recharge - UK

Royal Dutch Shell November 28-29, 2017
Oil ProductsRetail’s 5 ambitions for 2025
63
50%
Increase margin share from non-
fuels retail to 50%
20%
Fuels margin from low-emission
energy solutions
LOWER CARBON
Reduce carbon intensity of our
retail outlets by at least 50%
EVERY CUSTOMER
Treated like a guest on site & in the digital world
100%
Sites committed to local communities unified by a global
social cause
1 2 3 4 5

Royal Dutch Shell November 28-29, 2017
Digitalisation
Jiffy lube is a 100% Shell venture
Connected customer Innovation New business models
Shell App
>3 million downloads
715,000 active users in >35 markets
Quick, easy and personalised
experience
Enhanced payment and loyalty
proposition
Connected car
World’s first in car cashless payment
system
Launched with Jaguar Land Rover
Creates opportunities for new B2B
business models
FitCar powered by Jiffy lube
Provides customers with maintenance
alerts, trip info and more
More new B2C and B2B business
models underway
64

Royal Dutch Shell November 28-29, 2017
Under construction
65
Growth projects
Chemicals Million metric tonnes
Ethylene capacity
Nanhai II
Pennsylvaniachemicals
USGCrestructuring
Nanhai I
Bukom start-up
65
Geismar, USA
Nanhai, China
Pennsylvania, USA
425,000 metric tonnes per annum additional Alpha Olefins capacity
New liquids cracker and derivatives units
Capacity: ~1.2 million metric tonnes ethylene per annum
50/50 JV with CNOOC
Greenfield FID 2016
Capacity: ~1.5 million metrictonnes ethylene per annum and polyethylene derivatives
2006Nanhai
2010 USGC go-light strategy
2010 Singapore
2016+ China + USA
LiquidGas
2022
Feedstock mix
SADAF exit

Royal Dutch Shell November 28-29, 2017 66
Organic growth
Chemicals
Earnings and ROACE on CCS basis, excluding identified items; Shell ROACE calculations for 2012 has been restated for the impact of IAS 19
$ billion
Earnings + ROACE
Targets aspiration per year mid-’20s:
Earnings: ~$3.5 - 4 billion
Cash flow: ~$5 - 6 billion
Base capex: ~$1 - 1.5 billion
Improve base business
Expand current base
portfolio
Adding to portfolio –
growth
%
Earnings ROACE (RHS)

Royal Dutch Shell November 28-29, 2017 67
Downstream Cash engine
Capital employed and volumes based on Q3 2017
Capital investment is in period 2018-2020; Source brand preference: Ipsos – Global Customer Tracker (covering 30+ markets)
Further strengthen our financial performance
Upgrading our portfolio
Returns + free cash flow improvement
Chemicals growth priority
Marketing Refining & Trading Chemicals
Growth priority
Customer offer + brand leverage
Differentiated products
Global #1 Brand
Full integration with trading
Improve retained assets
Reducing refining capacity
Advantaged feedstock
Strong product portfolio
Proprietary technology
$18 billion
6.5 mboe/d
$23 billion
2.6 mboe/d
$15 billion
~17 mtpa
$3-4 billion
Capital employed: Capital employed:
Sales volumes:
Capital Investment:
Refinery processing:
Capital employed:
Sales volumes:
$4-5 billionCapital investment:

Royal Dutch Shell November 28-29, 2017
Maarten WetselaarIntegrated Gas & New Energies DirectorRoyal Dutch Shell

Royal Dutch Shell November 28-29, 2017 69
New Energies
Focus areas:
Biofuels
Hydrogen
Emerging Opportunities
Focus areas:
Trading, marketing and customer access
Low-carbon generation and storage (solar, wind, gas)
Build integrated value chains
Exploit adjacencies to existing businesses
Discipline and commerciality
Not equipment manufacturing
New Fuels Power
Groundbirch, Canada

Royal Dutch Shell November 28-29, 2017 70
New Energies
Market drivers and differentiators
Market development Shell differentiators Energy transition
World needs more and cleaner
energy
Commercial technologies and
policy drive towards
de-carbonization
Growing role of electricity and
renewables
Power markets expected to
grow faster than the overall
energy system
Global transition expected to be
gradual, local transitions may
be significantly faster
Experience, global footprint,
adjacencies
Trading, optimisation, risk
management
Brand and customers
Energy value chain integration

Royal Dutch Shell November 28-29, 2017 71
New Fuels Biofuels Hydrogen
First generation experience through Raízen joint
venture
One of the largest blenders and traders of biofuels
Developing a second generation advanced biofuels
business
Existing sites in Germany, UK, and USA
Working with partners to develop around
400 sites by 2023 in Germany
Demand driven expansion, including the
Netherlands and California, USA Adjacencies to existing downstream businesses
Raízen - Brazil Hamburg -Germany

Royal Dutch Shell November 28-29, 2017
Portfolio resilience through a Power value chain
C U S T O M E R S O P T I M I S AT I O N S U P P LY & G E N E R AT I O N
72
Adjacencies to existing gas businesses
Value chain integrator Demand-driven
development
Secure demand in key markets
Commercial, industrial, and
residential
Optimise intermittent demand
and supply
Trading opportunities
Wind, solar, and selected gas and
storage assets
Selective capacity ownership to
create portfolio flexibility
Leverage portfolio flexibility and arbitrage opportunities
Multiple parties are active on the demand side
Not all products are supplied by Shell; some are purchased from third parties

Royal Dutch Shell November 28-29, 2017 73
New Energies
Capital and returns
New Fuels Power
New Fuels looks for capital light opportunities
Work in partnerships and consortia
Target downstream returns
Investment in customer access
Selective asset ownership
Target returns of 8 – 12%
Selective an opportunity
driven investment
Capital investment: $1 – 2
billion
Organic + inorganic
NoordzeeWind, The NetherlandsWuppertal, Germany

Royal Dutch Shell November 28-29, 2017
Ben van BeurdenChief Executive OfficerRoyal Dutch Shell

Royal Dutch Shell November 28-29, 2017 75
SummaryT R A N S F O R M A T I O N
I N S H E L LC O N T I N U E T O I M P R O V E
O U R M E T R I C S P E R S H A R E
2014-2020 2020+
2014 - 2020 2020+
Growing per share metrics from a stronger basis
Portfolio re-shape
More free cash flow
Higher returns

Royal Dutch Shell November 28-29, 2017 76
Questions & Answers
Ben van BeurdenChief Executive Officer
Jessica UhlChief Financial Officer
Royal Dutch Shell November 28-29, 2017

Royal Dutch Shell November 28-29, 2017
Royal Dutch Shell plcNovember 28-29, 2017
Management DayDelivering a world-class investment case
#makethefuture
Royal Dutch Shell November 28-29, 2017 78
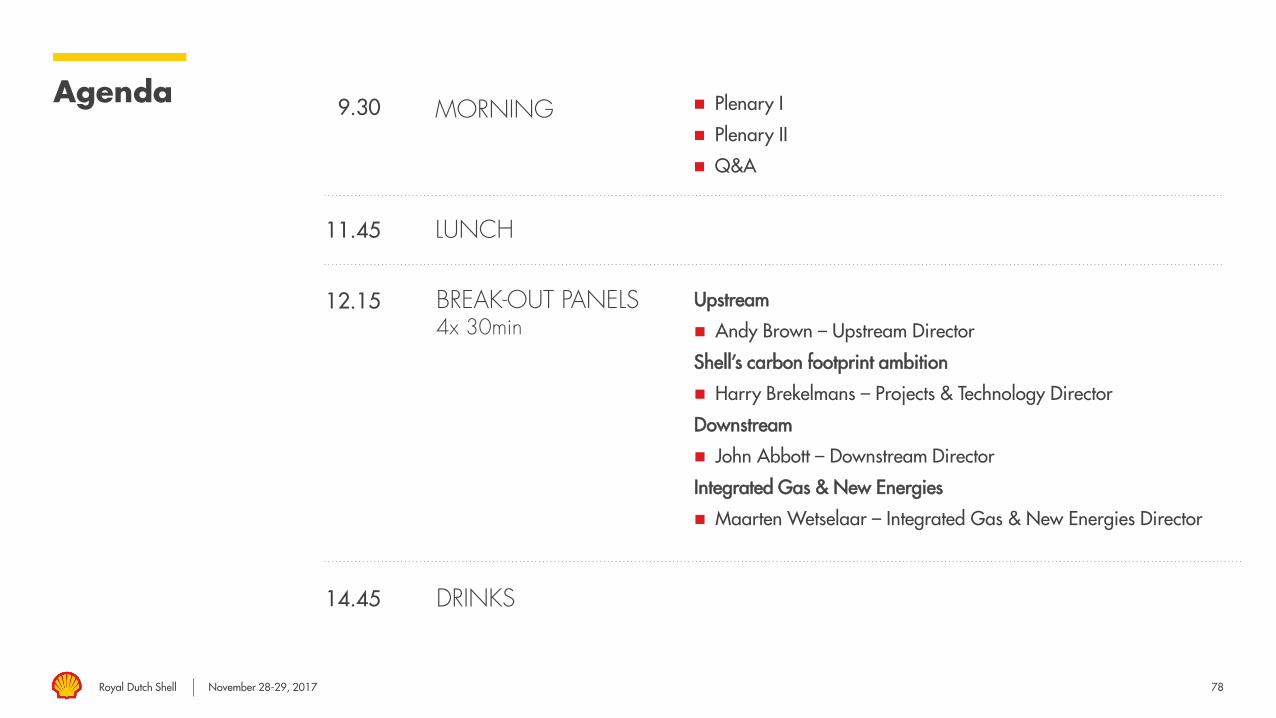
AgendaMORNING Plenary I
Plenary II
Q&A
LUNCH
Upstream
Andy Brown – Upstream Director
Shell’s carbon footprint ambition
Harry Brekelmans – Projects & Technology Director
Downstream
John Abbott – Downstream Director
Integrated Gas & New Energies
Maarten Wetselaar – Integrated Gas & New Energies Director
BREAK-OUT PANELS4x 30min
DRINKS
11.45
9.30
12.15
14.45

Royal Dutch Shell November 28-29, 2017 79
Breakout sessions
Blue lanyard – Baron
Downstream
Shell’s carbon
footprint ambition
Integrated Gas
Upstream
White lanyard – Duke 1
Shell’s carbon
footprint ambition
Integrated Gas
Upstream
Downstream
Green lanyard – Duke 2
Integrated Gas
Upstream
Downstream
Shell’s carbon
footprint ambition
Red lanyard – Mayor 2
Upstream
Downstream
Shell’s carbon
footprint ambition
Integrated Gas