Embed Size (px)
Citation preview

Webcast & Teleconference Information: Friday August 30, 2019 1:00 p.m. Chile - EST Participants dial-in: US toll free: 1 (844) 369 8770 International: 1 (862) 298 0840 Conference ID: CENCOSUD Replay: Toll free: 1-877-481-4010 International: 1-919-882-2331 Replay ID: #51701 Available until September 6, 2019 12:00 a.m. EST Webcast available at: http://investors.cencosud.com/English/investor-
overview/financials/quarterly-reports/default.aspx
Webcast disponible en:
http://investors.cencosud.com/Spanish/inversionist
as/informacion-financiera/reportes-
trimestrales/default.aspx
1
2Q19 Results: Higher Adjusted EBITDA reflects operational improvements in Brazil, Peru
and Colombia, as well as lower expenses due to the adoption of IFRS16. This was partially
offset by the deconsolidation of Financial Services business in Peru.
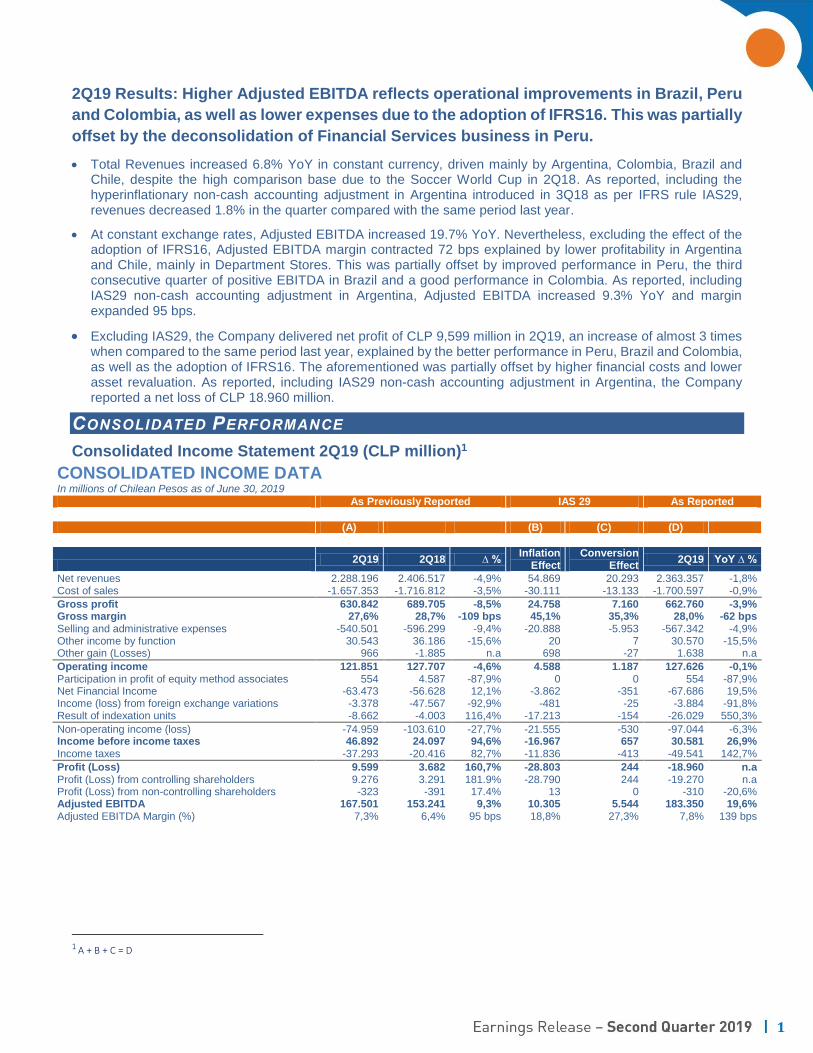
Total Revenues increased 6.8% YoY in constant currency, driven mainly by Argentina, Colombia, Brazil and Chile, despite the high comparison base due to the Soccer World Cup in 2Q18. As reported, including the hyperinflationary non-cash accounting adjustment in Argentina introduced in 3Q18 as per IFRS rule IAS29, revenues decreased 1.8% in the quarter compared with the same period last year.
At constant exchange rates, Adjusted EBITDA increased 19.7% YoY. Nevertheless, excluding the effect of the adoption of IFRS16, Adjusted EBITDA margin contracted 72 bps explained by lower profitability in Argentina and Chile, mainly in Department Stores. This was partially offset by improved performance in Peru, the third consecutive quarter of positive EBITDA in Brazil and a good performance in Colombia. As reported, including IAS29 non-cash accounting adjustment in Argentina, Adjusted EBITDA increased 9.3% YoY and margin expanded 95 bps.
Excluding IAS29, the Company delivered net profit of CLP 9,599 million in 2Q19, an increase of almost 3 times when compared to the same period last year, explained by the better performance in Peru, Brazil and Colombia, as well as the adoption of IFRS16. The aforementioned was partially offset by higher financial costs and lower asset revaluation. As reported, including IAS29 non-cash accounting adjustment in Argentina, the Company reported a net loss of CLP 18.960 million.
CONSOLIDATED PERFORMANCE
Consolidated Income Statement 2Q19 (CLP million)1
CONSOLIDATED INCOME DATA In millions of Chilean Pesos as of June 30, 2019
As Previously Reported IAS 29 As Reported
(A) (B) (C) (D)
1
2Q19 2Q18 ∆ %
Inflation Effect
Conversion Effect
2Q19 YoY ∆ %
Net revenues 2.288.196 2.406.517 -4,9% 54.869 20.293 2.363.357 -1,8% Cost of sales -1.657.353 -1.716.812 -3,5% -30.111 -13.133 -1.700.597 -0,9%
Gross profit 630.842 689.705 -8,5% 24.758 7.160 662.760 -3,9% Gross margin 27,6% 28,7% -109 bps 45,1% 35,3% 28,0% -62 bps Selling and administrative expenses -540.501 -596.299 -9,4% -20.888 -5.953 -567.342 -4,9% Other income by function 30.543 36.186 -15,6% 20 7 30.570 -15,5% Other gain (Losses) 966 -1.885 n.a 698 -27 1.638 n.a
Operating income 121.851 127.707 -4,6% 4.588 1.187 127.626 -0,1% Participation in profit of equity method associates 554 4.587 -87,9% 0 0 554 -87,9% Net Financial Income -63.473 -56.628 12,1% -3.862 -351 -67.686 19,5% Income (loss) from foreign exchange variations -3.378 -47.567 -92,9% -481 -25 -3.884 -91,8% Result of indexation units -8.662 -4.003 116,4% -17.213 -154 -26.029 550,3%
Non-operating income (loss) -74.959 -103.610 -27,7% -21.555 -530 -97.044 -6,3% Income before income taxes 46.892 24.097 94,6% -16.967 657 30.581 26,9% Income taxes -37.293 -20.416 82,7% -11.836 -413 -49.541 142,7%
Profit (Loss) 9.599 3.682 160,7% -28.803 244 -18.960 n.a Profit (Loss) from controlling shareholders 9.276 3.291 181.9% -28.790 244 -19.270 n.a Profit (Loss) from non-controlling shareholders -323 -391 17.4% 13 0 -310 -20,6% Adjusted EBITDA 167.501 153.241 9,3% 10.305 5.544 183.350 19,6% Adjusted EBITDA Margin (%) 7,3% 6,4% 95 bps 18,8% 27,3% 7,8% 139 bps
1 A + B + C = D
2
As Previously Reported IAS 29 As Reported
2Q19 2Q18 ∆ % Inflation Effect
Conversion Effect 2Q19 YoY ∆ %
Asset Revaluation 27.501 32.575 -15,6% - 5 27.506 -15,6% Deferred Income Taxes Asset Revaluation -7.522 -8.782 -14,3% - -7.522
Net Effect from Asset Revaluation 19.980 23.794 -16,0% - 5 19.984 -16,0%
Consolidated Income Statement 6M2019 (CLP million)2
CONSOLIDATED INCOME STATEMENT In millions of Chilean Pesos as of June 30, 2019
As Previously Reported IAS 29 As Reported
(A) (B) (C) (D)
6M19 6M18 ∆ % Inflation
effect Conversion
effect 6M19 Var. a/a (%)
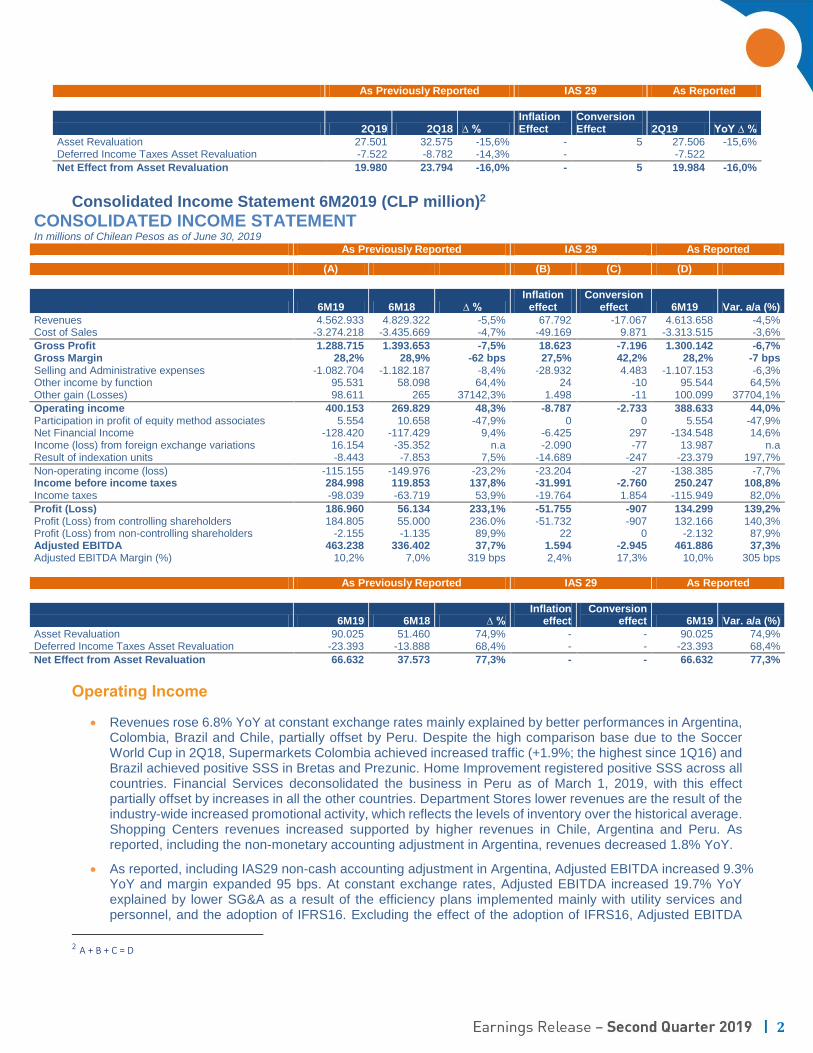
Revenues 4.562.933 4.829.322 -5,5% 67.792 -17.067 4.613.658 -4,5% Cost of Sales -3.274.218 -3.435.669 -4,7% -49.169 9.871 -3.313.515 -3,6%
Gross Profit 1.288.715 1.393.653 -7,5% 18.623 -7.196 1.300.142 -6,7% Gross Margin 28,2% 28,9% -62 bps 27,5% 42,2% 28,2% -7 bps Selling and Administrative expenses -1.082.704 -1.182.187 -8,4% -28.932 4.483 -1.107.153 -6,3% Other income by function 95.531 58.098 64,4% 24 -10 95.544 64,5% Other gain (Losses) 98.611 265 37142,3% 1.498 -11 100.099 37704,1%
Operating income 400.153 269.829 48,3% -8.787 -2.733 388.633 44,0% Participation in profit of equity method associates 5.554 10.658 -47,9% 0 0 5.554 -47,9% Net Financial Income -128.420 -117.429 9,4% -6.425 297 -134.548 14,6% Income (loss) from foreign exchange variations 16.154 -35.352 n.a -2.090 -77 13.987 n.a Result of indexation units -8.443 -7.853 7,5% -14.689 -247 -23.379 197,7%
Non-operating income (loss) -115.155 -149.976 -23,2% -23.204 -27 -138.385 -7,7% Income before income taxes 284.998 119.853 137,8% -31.991 -2.760 250.247 108,8% Income taxes -98.039 -63.719 53,9% -19.764 1.854 -115.949 82,0%
Profit (Loss) 186.960 56.134 233,1% -51.755 -907 134.299 139,2% Profit (Loss) from controlling shareholders 184.805 55.000 236.0% -51.732 -907 132.166 140,3% Profit (Loss) from non-controlling shareholders -2.155 -1.135 89,9% 22 0 -2.132 87,9% Adjusted EBITDA 463.238 336.402 37,7% 1.594 -2.945 461.886 37,3% Adjusted EBITDA Margin (%) 10,2% 7,0% 319 bps 2,4% 17,3% 10,0% 305 bps
As Previously Reported IAS 29 As Reported
IAS 29 As Reported IAS 29
6M19 6M18 ∆ % Inflation
effect Conversion
effect 6M19 Var. a/a (%)
Asset Revaluation 90.025 51.460 74,9% - - 90.025 74,9% Deferred Income Taxes Asset Revaluation -23.393 -13.888 68,4% - - -23.393 68,4%
Net Effect from Asset Revaluation 66.632 37.573 77,3% - - 66.632 77,3%
Operating Income
Revenues rose 6.8% YoY at constant exchange rates mainly explained by better performances in Argentina, Colombia, Brazil and Chile, partially offset by Peru. Despite the high comparison base due to the Soccer World Cup in 2Q18, Supermarkets Colombia achieved increased traffic (+1.9%; the highest since 1Q16) and Brazil achieved positive SSS in Bretas and Prezunic. Home Improvement registered positive SSS across all countries. Financial Services deconsolidated the business in Peru as of March 1, 2019, with this effect partially offset by increases in all the other countries. Department Stores lower revenues are the result of the industry-wide increased promotional activity, which reflects the levels of inventory over the historical average. Shopping Centers revenues increased supported by higher revenues in Chile, Argentina and Peru. As reported, including the non-monetary accounting adjustment in Argentina, revenues decreased 1.8% YoY.
As reported, including IAS29 non-cash accounting adjustment in Argentina, Adjusted EBITDA increased 9.3% YoY and margin expanded 95 bps. At constant exchange rates, Adjusted EBITDA increased 19.7% YoY explained by lower SG&A as a result of the efficiency plans implemented mainly with utility services and personnel, and the adoption of IFRS16. Excluding the effect of the adoption of IFRS16, Adjusted EBITDA
2 A + B + C = D
3
margin contracted 72 bps explained by lower profitability in Argentina and Chile, mainly due to Department Stores. This was partially offset by improved performance in Peru, Brazil which posted positive EBITDA for the third consecutive quarter and Colombia.
Other income by function increased 15.6% due to the lower asset revaluation in Argentina and to a lesser extent in Chile, explained by the higher country risk and the adoption of IFRS16 rule.
Other gains (losses) posted a profit of CLP 1,638 million due the operational exchange difference.
Non-Operational Income
Participation in profit of associates by the equity method decreased 87.9% explained by a new base of risk calculation in the financial services business in Chile associated to the cross-check of information from the databases of the customers shared with two competitors that swift to banking regulations.
Net Financial Expenses increased 19.5% (12.1% excluding IAS29 rule in Argentina) due to adoption of IFRS16, partially offset by lower bank loan expenses.
Exchange differences posted a loss of CLP 3,378 million in 2Q19 in comparison to a loss of CLP 47,567 million in 2Q18. The decrease is explained by devaluation of the CLP against USD, which was 7.9% in 2Q18 against 0.1% in 2Q19.
Results from indexation posted a loss of CLP 8,662 million YoY due to the higher variation of the UF in the 2Q in comparison with the same period last year.
RELEVANT EVENTS
Cencosud Shopping: During the second quarter the Company placed its first bond in the local market for a total amount of UF 10 million. Proceeds were used to reduce debt with the Holding Company, while Cencosud S.A. used proceeds to pay banking liabilities. As of June 27, 2019, the Cencosud Shopping IPO represented largest placement of shares to date on the Santiago Stock Exchange, placing 27% of the total capital of the new Company and raising USD 1,055 million.
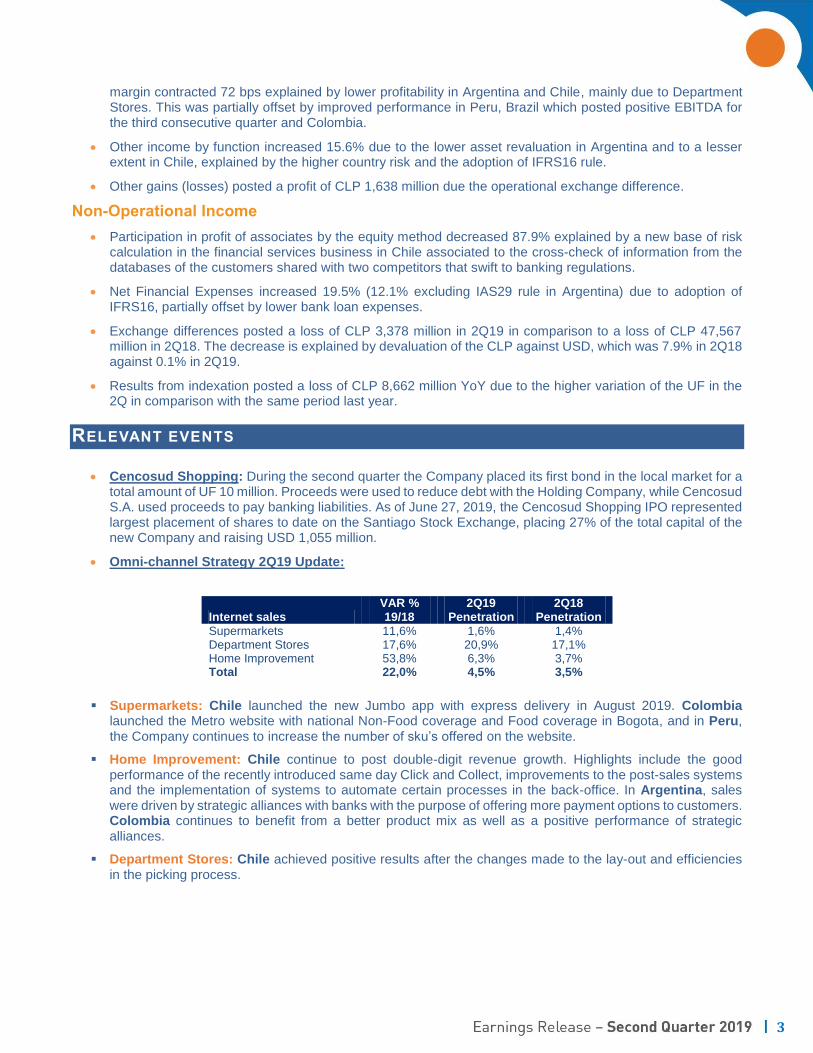
Omni-channel Strategy 2Q19 Update:
Internet sales VAR % 19/18
2Q19 Penetration
2Q18 Penetration
Supermarkets 11,6% 1,6% 1,4% Department Stores 17,6% 20,9% 17,1% Home Improvement 53,8% 6,3% 3,7% Total 22,0% 4,5% 3,5%
Supermarkets: Chile launched the new Jumbo app with express delivery in August 2019. Colombia launched the Metro website with national Non-Food coverage and Food coverage in Bogota, and in Peru, the Company continues to increase the number of sku’s offered on the website.
Home Improvement: Chile continue to post double-digit revenue growth. Highlights include the good performance of the recently introduced same day Click and Collect, improvements to the post-sales systems and the implementation of systems to automate certain processes in the back-office. In Argentina, sales were driven by strategic alliances with banks with the purpose of offering more payment options to customers. Colombia continues to benefit from a better product mix as well as a positive performance of strategic alliances.
Department Stores: Chile achieved positive results after the changes made to the lay-out and efficiencies in the picking process.
4
PERFORMANCE BY COUNTRY3
2Q19 Results: Second Quarter
REVENUES 2019 2018 ∆ % Average
Exchange Rate ∆ % in local
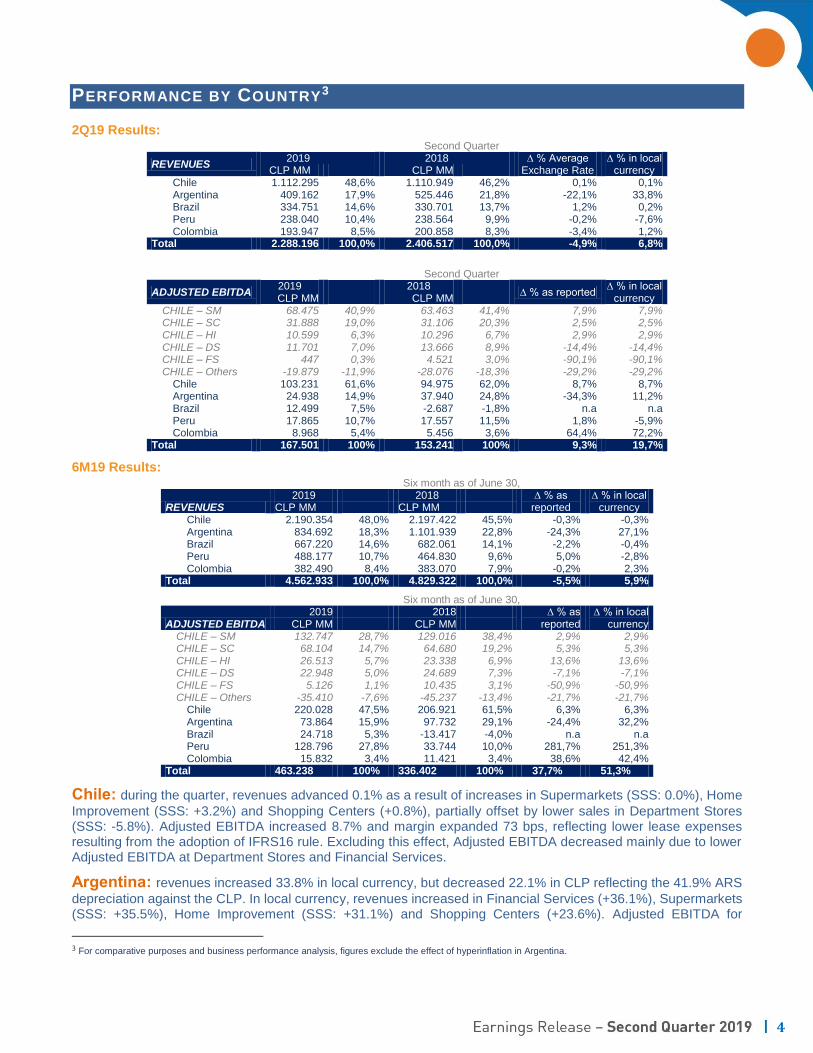
currency CLP MM CLP MM Chile 1.112.295 48,6% 1.110.949 46,2% 0,1% 0,1% Argentina 409.162 17,9% 525.446 21,8% -22,1% 33,8% Brazil 334.751 14,6% 330.701 13,7% 1,2% 0,2% Peru 238.040 10,4% 238.564 9,9% -0,2% -7,6% Colombia 193.947 8,5% 200.858 8,3% -3,4% 1,2%
Total 2.288.196 100,0% 2.406.517 100,0% -4,9% 6,8%
Second Quarter
ADJUSTED EBITDA 2019 2018
∆ % as reported ∆ % in local
currency CLP MM CLP MM CHILE – SM 68.475 40,9% 63.463 41,4% 7,9% 7,9% CHILE – SC 31.888 19,0% 31.106 20,3% 2,5% 2,5% CHILE – HI 10.599 6,3% 10.296 6,7% 2,9% 2,9% CHILE – DS 11.701 7,0% 13.666 8,9% -14,4% -14,4% CHILE – FS 447 0,3% 4.521 3,0% -90,1% -90,1% CHILE – Others -19.879 -11,9% -28.076 -18,3% -29,2% -29,2%
Chile 103.231 61,6% 94.975 62,0% 8,7% 8,7% Argentina 24.938 14,9% 37.940 24,8% -34,3% 11,2% Brazil 12.499 7,5% -2.687 -1,8% n.a n.a Peru 17.865 10,7% 17.557 11,5% 1,8% -5,9% Colombia 8.968 5,4% 5.456 3,6% 64,4% 72,2%
Total 167.501 100% 153.241 100% 9,3% 19,7%
6M19 Results: Six month as of June 30,
REVENUES 2019 2018 ∆ % as
reported ∆ % in local
currency CLP MM CLP MM Chile 2.190.354 48,0% 2.197.422 45,5% -0,3% -0,3% Argentina 834.692 18,3% 1.101.939 22,8% -24,3% 27,1% Brazil 667.220 14,6% 682.061 14,1% -2,2% -0,4% Peru 488.177 10,7% 464.830 9,6% 5,0% -2,8% Colombia 382.490 8,4% 383.070 7,9% -0,2% 2,3%
Total 4.562.933 100,0% 4.829.322 100,0% -5,5% 5,9%
Six month as of June 30,
ADJUSTED EBITDA 2019 2018 ∆ % as
reported ∆ % in local
currency CLP MM CLP MM CHILE – SM 132.747 28,7% 129.016 38,4% 2,9% 2,9% CHILE – SC 68.104 14,7% 64.680 19,2% 5,3% 5,3% CHILE – HI 26.513 5,7% 23.338 6,9% 13,6% 13,6% CHILE – DS 22.948 5,0% 24.689 7,3% -7,1% -7,1% CHILE – FS 5.126 1,1% 10.435 3,1% -50,9% -50,9% CHILE – Others -35.410 -7,6% -45.237 -13,4% -21,7% -21,7%
Chile 220.028 47,5% 206.921 61,5% 6,3% 6,3% Argentina 73.864 15,9% 97.732 29,1% -24,4% 32,2% Brazil 24.718 5,3% -13.417 -4,0% n.a n.a Peru 128.796 27,8% 33.744 10,0% 281,7% 251,3% Colombia 15.832 3,4% 11.421 3,4% 38,6% 42,4%
Total 463.238 100% 336.402 100% 37,7% 51,3%
Chile: during the quarter, revenues advanced 0.1% as a result of increases in Supermarkets (SSS: 0.0%), Home
Improvement (SSS: +3.2%) and Shopping Centers (+0.8%), partially offset by lower sales in Department Stores (SSS: -5.8%). Adjusted EBITDA increased 8.7% and margin expanded 73 bps, reflecting lower lease expenses resulting from the adoption of IFRS16 rule. Excluding this effect, Adjusted EBITDA decreased mainly due to lower Adjusted EBITDA at Department Stores and Financial Services.
Argentina: revenues increased 33.8% in local currency, but decreased 22.1% in CLP reflecting the 41.9% ARS
depreciation against the CLP. In local currency, revenues increased in Financial Services (+36.1%), Supermarkets (SSS: +35.5%), Home Improvement (SSS: +31.1%) and Shopping Centers (+23.6%). Adjusted EBITDA for
3 For comparative purposes and business performance analysis, figures exclude the effect of hyperinflation in Argentina.
5
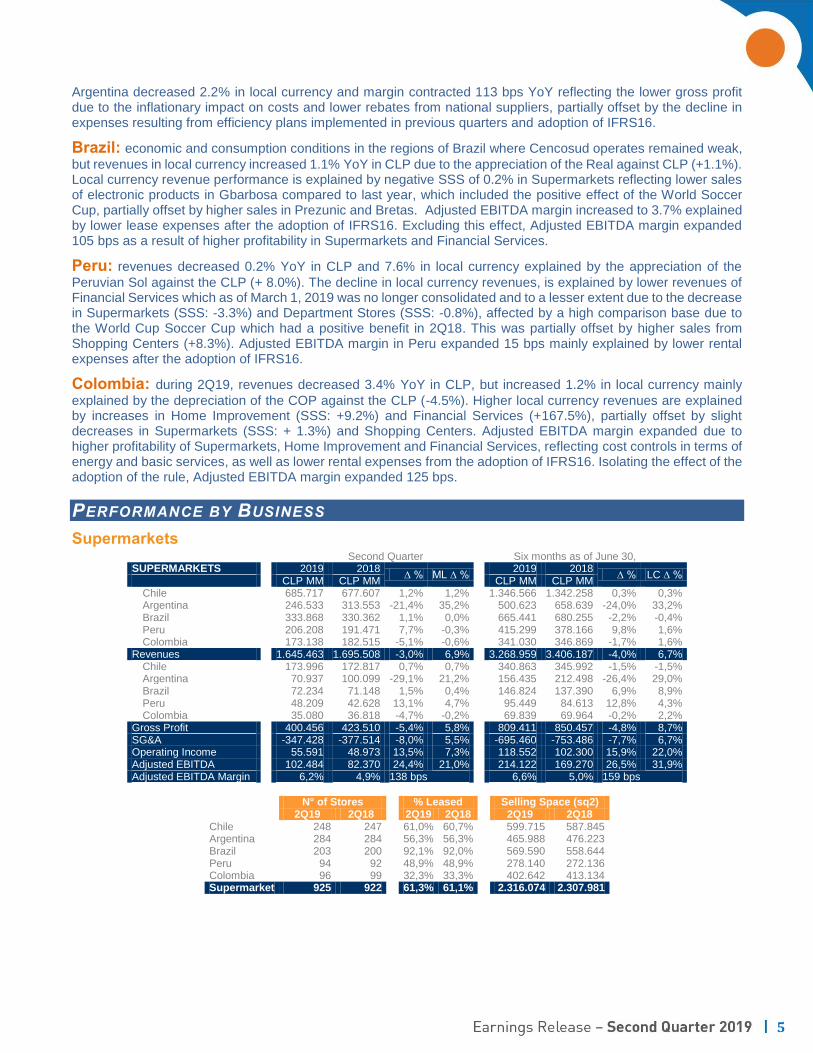
Argentina decreased 2.2% in local currency and margin contracted 113 bps YoY reflecting the lower gross profit due to the inflationary impact on costs and lower rebates from national suppliers, partially offset by the decline in expenses resulting from efficiency plans implemented in previous quarters and adoption of IFRS16.
Brazil: economic and consumption conditions in the regions of Brazil where Cencosud operates remained weak,
but revenues in local currency increased 1.1% YoY in CLP due to the appreciation of the Real against CLP (+1.1%). Local currency revenue performance is explained by negative SSS of 0.2% in Supermarkets reflecting lower sales of electronic products in Gbarbosa compared to last year, which included the positive effect of the World Soccer Cup, partially offset by higher sales in Prezunic and Bretas. Adjusted EBITDA margin increased to 3.7% explained by lower lease expenses after the adoption of IFRS16. Excluding this effect, Adjusted EBITDA margin expanded 105 bps as a result of higher profitability in Supermarkets and Financial Services.
Peru: revenues decreased 0.2% YoY in CLP and 7.6% in local currency explained by the appreciation of the
Peruvian Sol against the CLP (+ 8.0%). The decline in local currency revenues, is explained by lower revenues of Financial Services which as of March 1, 2019 was no longer consolidated and to a lesser extent due to the decrease in Supermarkets (SSS: -3.3%) and Department Stores (SSS: -0.8%), affected by a high comparison base due to the World Cup Soccer Cup which had a positive benefit in 2Q18. This was partially offset by higher sales from Shopping Centers (+8.3%). Adjusted EBITDA margin in Peru expanded 15 bps mainly explained by lower rental expenses after the adoption of IFRS16.
Colombia: during 2Q19, revenues decreased 3.4% YoY in CLP, but increased 1.2% in local currency mainly
explained by the depreciation of the COP against the CLP (-4.5%). Higher local currency revenues are explained by increases in Home Improvement (SSS: +9.2%) and Financial Services (+167.5%), partially offset by slight decreases in Supermarkets (SSS: + 1.3%) and Shopping Centers. Adjusted EBITDA margin expanded due to higher profitability of Supermarkets, Home Improvement and Financial Services, reflecting cost controls in terms of energy and basic services, as well as lower rental expenses from the adoption of IFRS16. Isolating the effect of the adoption of the rule, Adjusted EBITDA margin expanded 125 bps.
PERFORMANCE BY BUSINESS
Supermarkets Second Quarter Six months as of June 30, SUPERMARKETS 2019 2018
∆ % ML ∆ % 2019 2018
∆ % LC ∆ % CLP MM CLP MM CLP MM CLP MM
Chile 685.717 677.607 1,2% 1,2% 1.346.566 1.342.258 0,3% 0,3% Argentina 246.533 313.553 -21,4% 35,2% 500.623 658.639 -24,0% 33,2% Brazil 333.868 330.362 1,1% 0,0% 665.441 680.255 -2,2% -0,4% Peru 206.208 191.471 7,7% -0,3% 415.299 378.166 9,8% 1,6% Colombia 173.138 182.515 -5,1% -0,6% 341.030 346.869 -1,7% 1,6%
Revenues 1.645.463 1.695.508 -3,0% 6,9% 3.268.959 3.406.187 -4,0% 6,7% Chile 173.996 172.817 0,7% 0,7% 340.863 345.992 -1,5% -1,5% Argentina 70.937 100.099 -29,1% 21,2% 156.435 212.498 -26,4% 29,0% Brazil 72.234 71.148 1,5% 0,4% 146.824 137.390 6,9% 8,9% Peru 48.209 42.628 13,1% 4,7% 95.449 84.613 12,8% 4,3% Colombia 35.080 36.818 -4,7% -0,2% 69.839 69.964 -0,2% 2,2%
Gross Profit 400.456 423.510 -5,4% 5,8% 809.411 850.457 -4,8% 8,7% SG&A -347.428 -377.514 -8,0% 5,5% -695.460 -753.486 -7,7% 6,7% Operating Income 55.591 48.973 13,5% 7,3% 118.552 102.300 15,9% 22,0% Adjusted EBITDA 102.484 82.370 24,4% 21,0% 214.122 169.270 26,5% 31,9% Adjusted EBITDA Margin 6,2% 4,9% 138 bps 6,6% 5,0% 159 bps
N° of Stores % Leased Selling Space (sq2) 2Q19 2Q18 2Q19 2Q18 2Q19 2Q18 Chile 248 247 61,0% 60,7% 599.715 587.845 Argentina 284 284 56,3% 56,3% 465.988 476.223 Brazil 203 200 92,1% 92,0% 569.590 558.644 Peru 94 92 48,9% 48,9% 278.140 272.136 Colombia 96 99 32,3% 33,3% 402.642 413.134 Supermarket 925 922 61,3% 61,1% 2.316.074 2.307.981
6
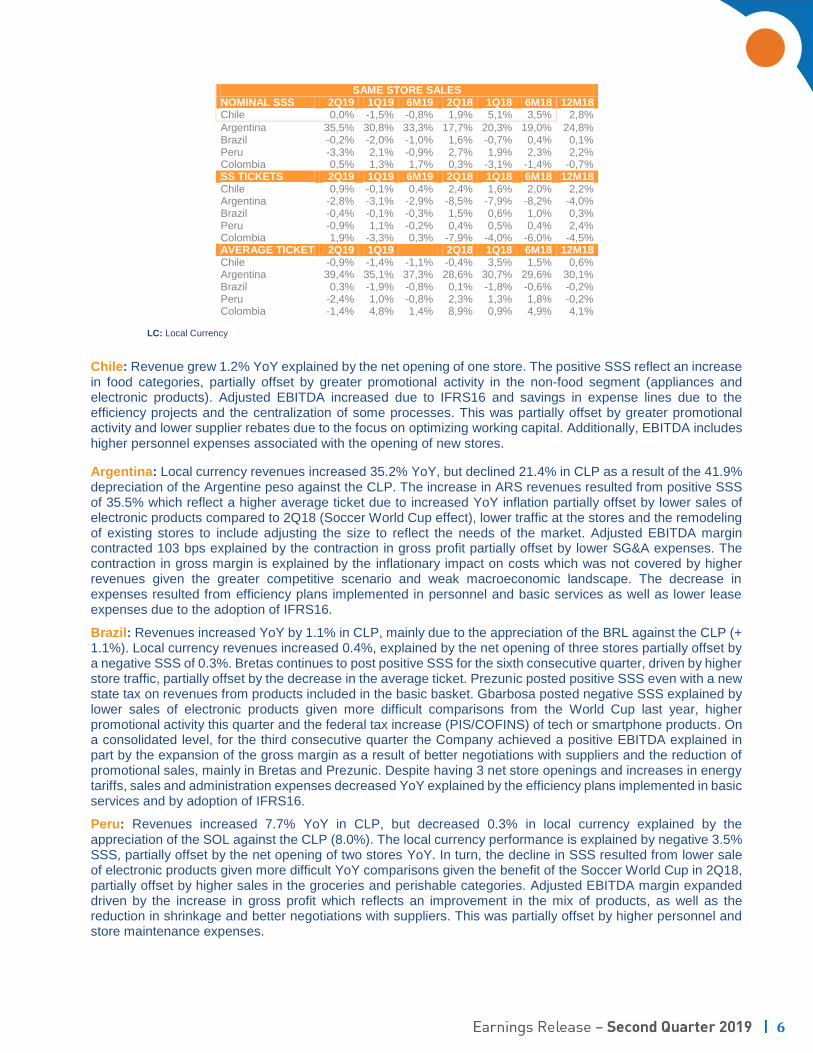
SAME STORE SALES NOMINAL SSS 2Q19 1Q19 6M19 2Q18 1Q18 6M18 12M18 Chile 0,0% -1,5% -0,8% 1,9% 5,1% 3,5% 2,8%
Argentina 35,5% 30,8% 33,3% 17,7% 20,3% 19,0% 24,8% Brazil -0,2% -2,0% -1,0% 1,6% -0,7% 0,4% 0,1% Peru -3,3% 2,1% -0,9% 2,7% 1,9% 2,3% 2,2% Colombia 0,5% 1,3% 1,7% 0,3% -3,1% -1,4% -0,7% SS TICKETS 2Q19 1Q19 6M19 2Q18 1Q18 6M18 12M18 Chile 0,9% -0,1% 0,4% 2,4% 1,6% 2,0% 2,2% Argentina -2,8% -3,1% -2,9% -8,5% -7,9% -8,2% -4,0% Brazil -0,4% -0,1% -0,3% 1,5% 0,6% 1,0% 0,3% Peru -0,9% 1,1% -0,2% 0,4% 0,5% 0,4% 2,4% Colombia 1,9% -3,3% 0,3% -7,9% -4,0% -6,0% -4,5% AVERAGE TICKET 2Q19 1Q19 2Q18 1Q18 6M18 12M18 Chile -0,9% -1,4% -1,1% -0,4% 3,5% 1,5% 0,6% Argentina 39,4% 35,1% 37,3% 28,6% 30,7% 29,6% 30,1% Brazil 0,3% -1,9% -0,8% 0,1% -1,8% -0,6% -0,2% Peru -2,4% 1,0% -0,8% 2,3% 1,3% 1,8% -0,2% Colombia -1,4% 4,8% 1,4% 8,9% 0,9% 4,9% 4,1%
LC: Local Currency
Chile: Revenue grew 1.2% YoY explained by the net opening of one store. The positive SSS reflect an increase in food categories, partially offset by greater promotional activity in the non-food segment (appliances and electronic products). Adjusted EBITDA increased due to IFRS16 and savings in expense lines due to the efficiency projects and the centralization of some processes. This was partially offset by greater promotional activity and lower supplier rebates due to the focus on optimizing working capital. Additionally, EBITDA includes higher personnel expenses associated with the opening of new stores.
Argentina: Local currency revenues increased 35.2% YoY, but declined 21.4% in CLP as a result of the 41.9% depreciation of the Argentine peso against the CLP. The increase in ARS revenues resulted from positive SSS of 35.5% which reflect a higher average ticket due to increased YoY inflation partially offset by lower sales of electronic products compared to 2Q18 (Soccer World Cup effect), lower traffic at the stores and the remodeling of existing stores to include adjusting the size to reflect the needs of the market. Adjusted EBITDA margin contracted 103 bps explained by the contraction in gross profit partially offset by lower SG&A expenses. The contraction in gross margin is explained by the inflationary impact on costs which was not covered by higher revenues given the greater competitive scenario and weak macroeconomic landscape. The decrease in expenses resulted from efficiency plans implemented in personnel and basic services as well as lower lease expenses due to the adoption of IFRS16.
Brazil: Revenues increased YoY by 1.1% in CLP, mainly due to the appreciation of the BRL against the CLP (+ 1.1%). Local currency revenues increased 0.4%, explained by the net opening of three stores partially offset by a negative SSS of 0.3%. Bretas continues to post positive SSS for the sixth consecutive quarter, driven by higher store traffic, partially offset by the decrease in the average ticket. Prezunic posted positive SSS even with a new state tax on revenues from products included in the basic basket. Gbarbosa posted negative SSS explained by lower sales of electronic products given more difficult comparisons from the World Cup last year, higher promotional activity this quarter and the federal tax increase (PIS/COFINS) of tech or smartphone products. On a consolidated level, for the third consecutive quarter the Company achieved a positive EBITDA explained in part by the expansion of the gross margin as a result of better negotiations with suppliers and the reduction of promotional sales, mainly in Bretas and Prezunic. Despite having 3 net store openings and increases in energy tariffs, sales and administration expenses decreased YoY explained by the efficiency plans implemented in basic services and by adoption of IFRS16.
Peru: Revenues increased 7.7% YoY in CLP, but decreased 0.3% in local currency explained by the appreciation of the SOL against the CLP (8.0%). The local currency performance is explained by negative 3.5% SSS, partially offset by the net opening of two stores YoY. In turn, the decline in SSS resulted from lower sale of electronic products given more difficult YoY comparisons given the benefit of the Soccer World Cup in 2Q18, partially offset by higher sales in the groceries and perishable categories. Adjusted EBITDA margin expanded driven by the increase in gross profit which reflects an improvement in the mix of products, as well as the reduction in shrinkage and better negotiations with suppliers. This was partially offset by higher personnel and store maintenance expenses.
7
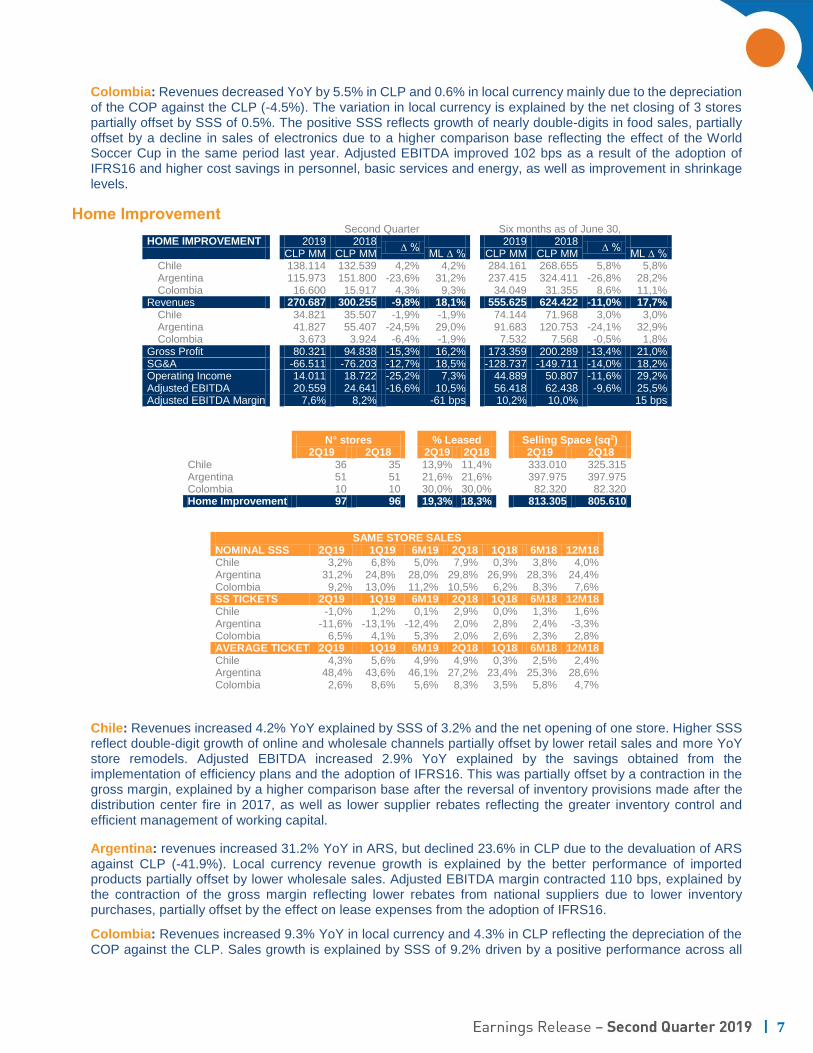
Colombia: Revenues decreased YoY by 5.5% in CLP and 0.6% in local currency mainly due to the depreciation of the COP against the CLP (-4.5%). The variation in local currency is explained by the net closing of 3 stores partially offset by SSS of 0.5%. The positive SSS reflects growth of nearly double-digits in food sales, partially offset by a decline in sales of electronics due to a higher comparison base reflecting the effect of the World Soccer Cup in the same period last year. Adjusted EBITDA improved 102 bps as a result of the adoption of IFRS16 and higher cost savings in personnel, basic services and energy, as well as improvement in shrinkage levels.
Home Improvement Second Quarter Six months as of June 30, HOME IMPROVEMENT 2019 2018
∆ % 2019 2018
∆ %
CLP MM CLP MM ML ∆ % CLP MM CLP MM ML ∆ % Chile 138.114 132.539 4,2% 4,2% 284.161 268.655 5,8% 5,8% Argentina 115.973 151.800 -23,6% 31,2% 237.415 324.411 -26,8% 28,2% Colombia 16.600 15.917 4,3% 9,3% 34.049 31.355 8,6% 11,1%
Revenues 270.687 300.255 -9,8% 18,1% 555.625 624.422 -11,0% 17,7% Chile 34.821 35.507 -1,9% -1,9% 74.144 71.968 3,0% 3,0% Argentina 41.827 55.407 -24,5% 29,0% 91.683 120.753 -24,1% 32,9% Colombia 3.673 3.924 -6,4% -1,9% 7.532 7.568 -0,5% 1,8%
Gross Profit 80.321 94.838 -15,3% 16,2% 173.359 200.289 -13,4% 21,0% SG&A -66.511 -76.203 -12,7% 18,5% -128.737 -149.711 -14,0% 18,2% Operating Income 14.011 18.722 -25,2% 7,3% 44.889 50.807 -11,6% 29,2% Adjusted EBITDA 20.559 24.641 -16,6% 10,5% 56.418 62.438 -9,6% 25,5% Adjusted EBITDA Margin 7,6% 8,2% -61 bps 10,2% 10,0% 15 bps
N° stores % Leased Selling Space (sq2) 2Q19 2Q18 2Q19 2Q18 2Q19 2Q18
Chile 36 35 13,9% 11,4% 333.010 325.315 Argentina 51 51 21,6% 21,6% 397.975 397.975 Colombia 10 10 30,0% 30,0% 82.320 82.320 Home Improvement 97 96 19,3% 18,3% 813.305 805.610
SAME STORE SALES NOMINAL SSS 2Q19 1Q19 6M19 2Q18 1Q18 6M18 12M18 Chile 3,2% 6,8% 5,0% 7,9% 0,3% 3,8% 4,0% Argentina 31,2% 24,8% 28,0% 29,8% 26,9% 28,3% 24,4% Colombia 9,2% 13,0% 11,2% 10,5% 6,2% 8,3% 7,6% SS TICKETS 2Q19 1Q19 6M19 2Q18 1Q18 6M18 12M18 Chile -1,0% 1,2% 0,1% 2,9% 0,0% 1,3% 1,6% Argentina -11,6% -13,1% -12,4% 2,0% 2,8% 2,4% -3,3% Colombia 6,5% 4,1% 5,3% 2,0% 2,6% 2,3% 2,8% AVERAGE TICKET 2Q19 1Q19 6M19 2Q18 1Q18 6M18 12M18 Chile 4,3% 5,6% 4,9% 4,9% 0,3% 2,5% 2,4% Argentina 48,4% 43,6% 46,1% 27,2% 23,4% 25,3% 28,6% Colombia 2,6% 8,6% 5,6% 8,3% 3,5% 5,8% 4,7%
Chile: Revenues increased 4.2% YoY explained by SSS of 3.2% and the net opening of one store. Higher SSS reflect double-digit growth of online and wholesale channels partially offset by lower retail sales and more YoY store remodels. Adjusted EBITDA increased 2.9% YoY explained by the savings obtained from the implementation of efficiency plans and the adoption of IFRS16. This was partially offset by a contraction in the gross margin, explained by a higher comparison base after the reversal of inventory provisions made after the distribution center fire in 2017, as well as lower supplier rebates reflecting the greater inventory control and efficient management of working capital.
Argentina: revenues increased 31.2% YoY in ARS, but declined 23.6% in CLP due to the devaluation of ARS against CLP (-41.9%). Local currency revenue growth is explained by the better performance of imported products partially offset by lower wholesale sales. Adjusted EBITDA margin contracted 110 bps, explained by the contraction of the gross margin reflecting lower rebates from national suppliers due to lower inventory purchases, partially offset by the effect on lease expenses from the adoption of IFRS16.
Colombia: Revenues increased 9.3% YoY in local currency and 4.3% in CLP reflecting the depreciation of the COP against the CLP. Sales growth is explained by SSS of 9.2% driven by a positive performance across all
8
business channels, primarily the double-digit growth in wholesale and e-commerce. The Company achieved a positive Adjusted EBITDA due to expense savings, reflecting lower energy consumption due to the implementation of LED lighting and the commercial changes associated with the loyalty program. This was partially offset by a decrease in gross margin for the liquidation of obsolete inventory as a result of the focus on optimizing working capital.
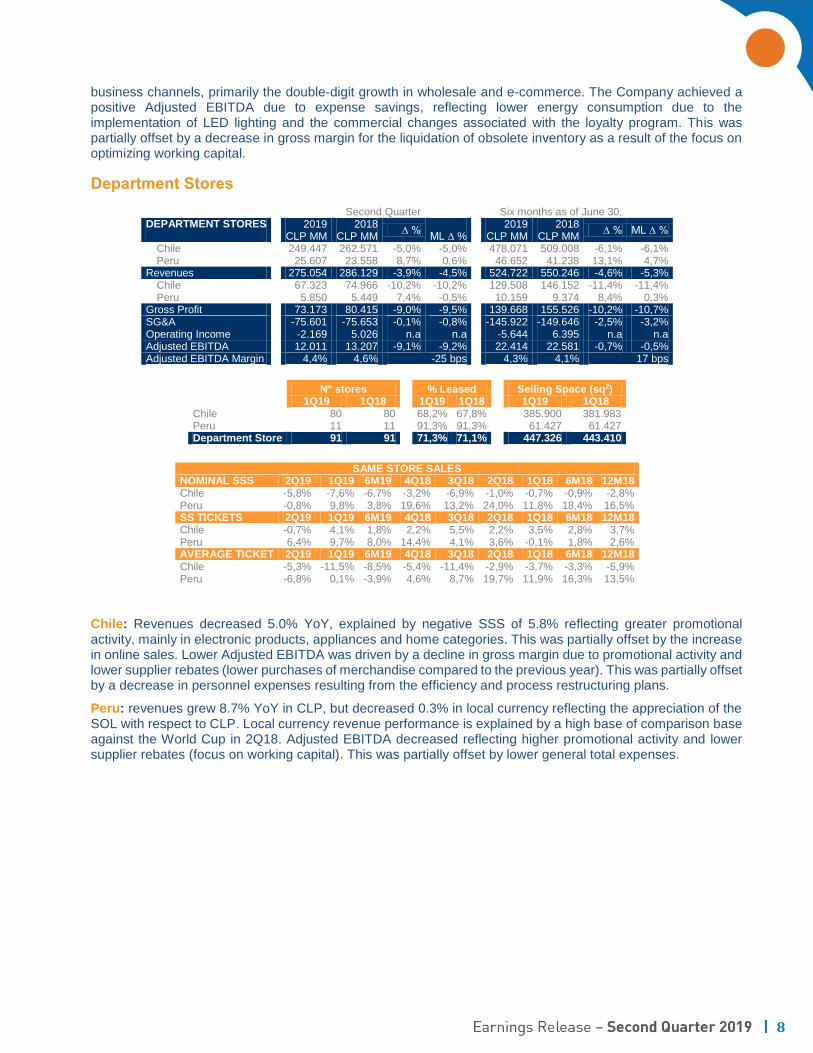
Department Stores
Second Quarter Six months as of June 30, DEPARTMENT STORES 2019 2018
∆ % 2019 2018
∆ % ML ∆ % CLP MM CLP MM ML ∆ % CLP MM CLP MM
Chile 249.447 262.571 -5,0% -5,0% 478.071 509.008 -6,1% -6,1% Peru 25.607 23.558 8,7% 0,6% 46.652 41.238 13,1% 4,7%
Revenues 275.054 286.129 -3,9% -4,5% 524.722 550.246 -4,6% -5,3% Chile 67.323 74.966 -10,2% -10,2% 129.508 146.152 -11,4% -11,4% Peru 5.850 5.449 7,4% -0,5% 10.159 9.374 8,4% 0,3%
Gross Profit 73.173 80.415 -9,0% -9,5% 139.668 155.526 -10,2% -10,7% SG&A -75.601 -75.653 -0,1% -0,8% -145.922 -149.646 -2,5% -3,2% Operating Income -2.169 5.026 n.a n.a -5.644 6.395 n.a n.a Adjusted EBITDA 12.011 13.207 -9,1% -9,2% 22.414 22.581 -0,7% -0,5% Adjusted EBITDA Margin 4,4% 4,6% -25 bps 4,3% 4,1% 17 bps
N° stores % Leased Selling Space (sq2)
1Q19 1Q18 1Q19 1Q18 1Q19 1Q18 Chile 80 80 68,2% 67,8% 385.900 381.983 Peru 11 11 91,3% 91,3% 61.427 61.427 Department Store 91 91 71,3% 71,1% 447.326 443.410
SAME STORE SALES NOMINAL SSS 2Q19 1Q19 6M19 4Q18 3Q18 2Q18 1Q18 6M18 12M18 Chile -5,8% -7,6% -6,7% -3,2% -6,9% -1,0% -0,7% -0,9% -2,8% Peru -0,8% 9,8% 3,8% 19,6% 13,2% 24,0% 11,8% 18,4% 16,5% SS TICKETS 2Q19 1Q19 6M19 4Q18 3Q18 2Q18 1Q18 6M18 12M18 Chile -0,7% 4,1% 1,8% 2,2% 5,5% 2,2% 3,5% 2,8% 3,7% Peru 6,4% 9,7% 8,0% 14,4% 4,1% 3,6% -0,1% 1,8% 2,6% AVERAGE TICKET 2Q19 1Q19 6M19 4Q18 3Q18 2Q18 1Q18 6M18 12M18 Chile -5,3% -11,5% -8,5% -5,4% -11,4% -2,9% -3,7% -3,3% -5,9% Peru -6,8% 0,1% -3,9% 4,6% 8,7% 19,7% 11,9% 16,3% 13,5%
Chile: Revenues decreased 5.0% YoY, explained by negative SSS of 5.8% reflecting greater promotional activity, mainly in electronic products, appliances and home categories. This was partially offset by the increase in online sales. Lower Adjusted EBITDA was driven by a decline in gross margin due to promotional activity and lower supplier rebates (lower purchases of merchandise compared to the previous year). This was partially offset by a decrease in personnel expenses resulting from the efficiency and process restructuring plans.
Peru: revenues grew 8.7% YoY in CLP, but decreased 0.3% in local currency reflecting the appreciation of the SOL with respect to CLP. Local currency revenue performance is explained by a high base of comparison base against the World Cup in 2Q18. Adjusted EBITDA decreased reflecting higher promotional activity and lower supplier rebates (focus on working capital). This was partially offset by lower general total expenses.
9
Shopping Centers4
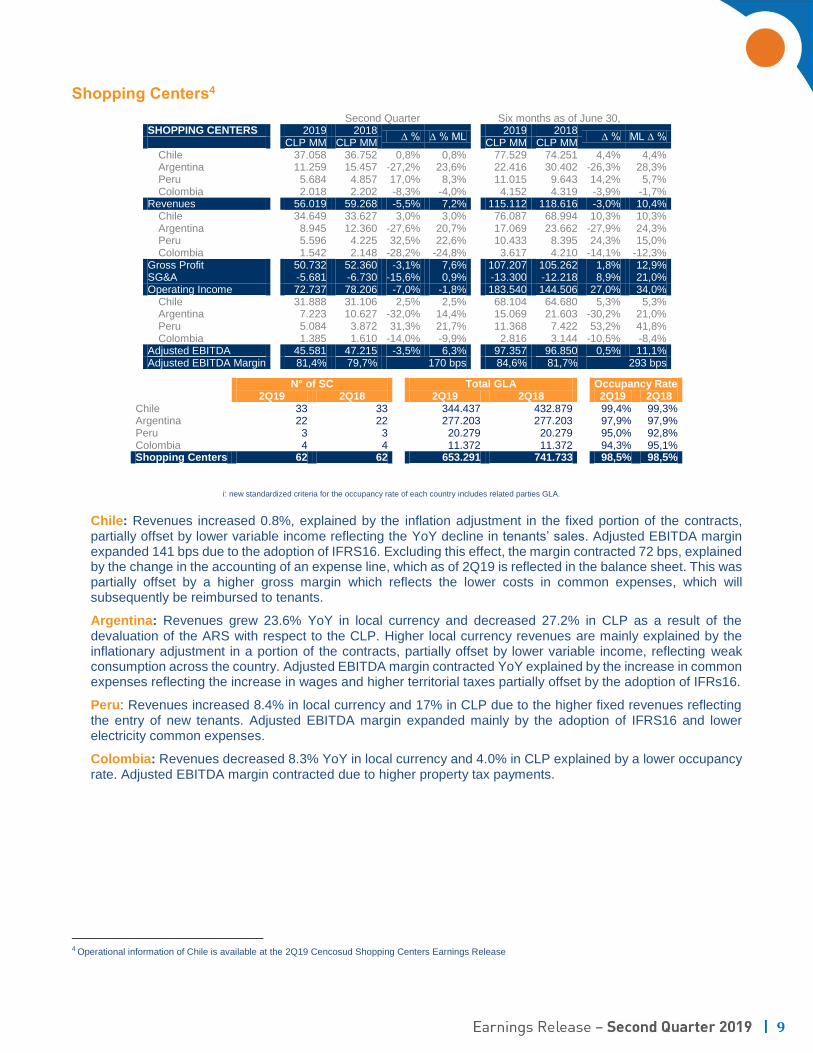
Second Quarter Six months as of June 30, SHOPPING CENTERS 2019 2018
∆ % ∆ % ML 2019 2018
∆ % ML ∆ % CLP MM CLP MM CLP MM CLP MM
Chile 37.058 36.752 0,8% 0,8% 77.529 74.251 4,4% 4,4% Argentina 11.259 15.457 -27,2% 23,6% 22.416 30.402 -26,3% 28,3% Peru 5.684 4.857 17,0% 8,3% 11.015 9.643 14,2% 5,7% Colombia 2.018 2.202 -8,3% -4,0% 4.152 4.319 -3,9% -1,7%
Revenues 56.019 59.268 -5,5% 7,2% 115.112 118.616 -3,0% 10,4% Chile 34.649 33.627 3,0% 3,0% 76.087 68.994 10,3% 10,3% Argentina 8.945 12.360 -27,6% 20,7% 17.069 23.662 -27,9% 24,3% Peru 5.596 4.225 32,5% 22,6% 10.433 8.395 24,3% 15,0% Colombia 1.542 2.148 -28,2% -24,8% 3.617 4.210 -14,1% -12,3%
Gross Profit 50.732 52.360 -3,1% 7,6% 107.207 105.262 1,8% 12,9% SG&A -5.681 -6.730 -15,6% 0,9% -13.300 -12.218 8,9% 21,0% Operating Income 72.737 78.206 -7,0% -1,8% 183.540 144.506 27,0% 34,0%
Chile 31.888 31.106 2,5% 2,5% 68.104 64.680 5,3% 5,3% Argentina 7.223 10.627 -32,0% 14,4% 15.069 21.603 -30,2% 21,0% Peru 5.084 3.872 31,3% 21,7% 11.368 7.422 53,2% 41,8% Colombia 1.385 1.610 -14,0% -9,9% 2.816 3.144 -10,5% -8,4%
Adjusted EBITDA 45.581 47.215 -3,5% 6,3% 97.357 96.850 0,5% 11,1% Adjusted EBITDA Margin 81,4% 79,7% 170 bps 84,6% 81,7% 293 bps
i: new standardized criteria for the occupancy rate of each country includes related parties GLA.
Chile: Revenues increased 0.8%, explained by the inflation adjustment in the fixed portion of the contracts, partially offset by lower variable income reflecting the YoY decline in tenants’ sales. Adjusted EBITDA margin expanded 141 bps due to the adoption of IFRS16. Excluding this effect, the margin contracted 72 bps, explained by the change in the accounting of an expense line, which as of 2Q19 is reflected in the balance sheet. This was partially offset by a higher gross margin which reflects the lower costs in common expenses, which will subsequently be reimbursed to tenants.
Argentina: Revenues grew 23.6% YoY in local currency and decreased 27.2% in CLP as a result of the devaluation of the ARS with respect to the CLP. Higher local currency revenues are mainly explained by the inflationary adjustment in a portion of the contracts, partially offset by lower variable income, reflecting weak consumption across the country. Adjusted EBITDA margin contracted YoY explained by the increase in common expenses reflecting the increase in wages and higher territorial taxes partially offset by the adoption of IFRs16.
Peru: Revenues increased 8.4% in local currency and 17% in CLP due to the higher fixed revenues reflecting the entry of new tenants. Adjusted EBITDA margin expanded mainly by the adoption of IFRS16 and lower electricity common expenses.
Colombia: Revenues decreased 8.3% YoY in local currency and 4.0% in CLP explained by a lower occupancy rate. Adjusted EBITDA margin contracted due to higher property tax payments.
4 Operational information of Chile is available at the 2Q19 Cencosud Shopping Centers Earnings Release
N° of SC Total GLA Occupancy Rate 2Q19 2Q18 2Q19 2Q18 2Q19 2Q18 Chile 33 33 344.437 432.879 99,4% 99,3% Argentina 22 22 277.203 277.203 97,9% 97,9% Peru 3 3 20.279 20.279 95,0% 92,8% Colombia 4 4 11.372 11.372 94,3% 95,1% Shopping Centers 62 62 653.291 741.733 98,5% 98,5%
10
ARGENTINA
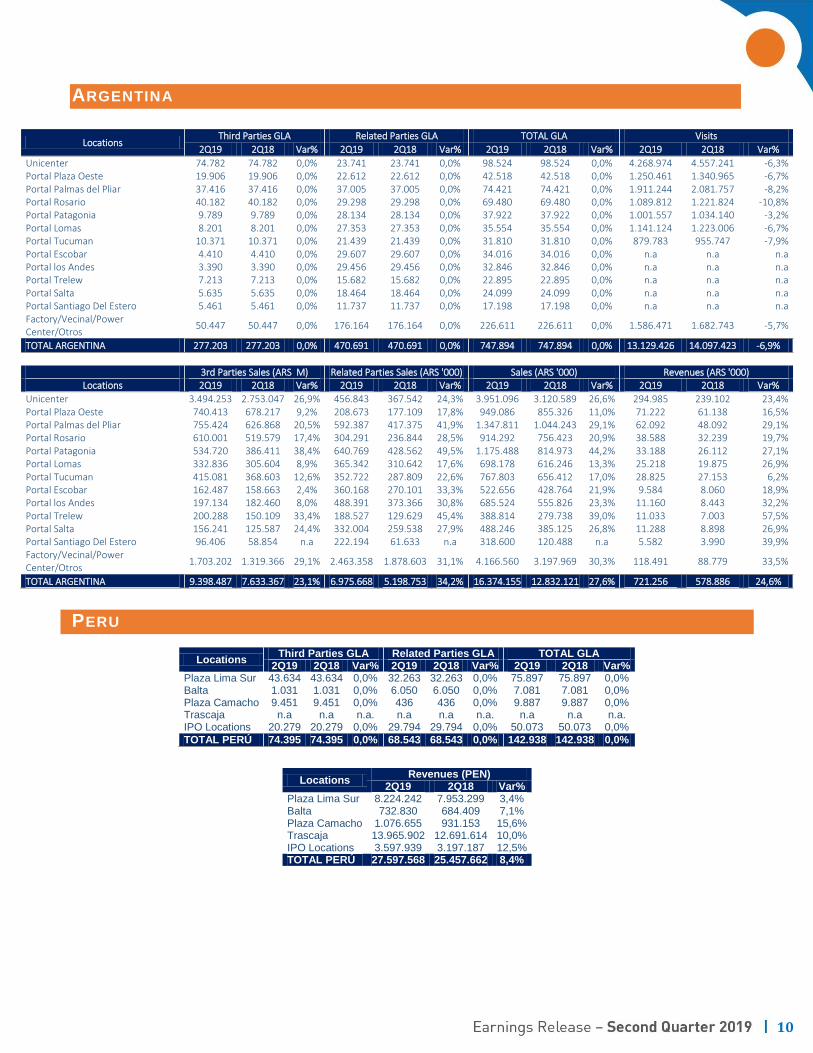
Locations Third Parties GLA Related Parties GLA TOTAL GLA Visits
2Q19 2Q18 Var% 2Q19 2Q18 Var% 2Q19 2Q18 Var% 2Q19 2Q18 Var%
Unicenter 74.782 74.782 0,0% 23.741 23.741 0,0% 98.524 98.524 0,0% 4.268.974 4.557.241 -6,3% Portal Plaza Oeste 19.906 19.906 0,0% 22.612 22.612 0,0% 42.518 42.518 0,0% 1.250.461 1.340.965 -6,7% Portal Palmas del Pliar 37.416 37.416 0,0% 37.005 37.005 0,0% 74.421 74.421 0,0% 1.911.244 2.081.757 -8,2% Portal Rosario 40.182 40.182 0,0% 29.298 29.298 0,0% 69.480 69.480 0,0% 1.089.812 1.221.824 -10,8% Portal Patagonia 9.789 9.789 0,0% 28.134 28.134 0,0% 37.922 37.922 0,0% 1.001.557 1.034.140 -3,2% Portal Lomas 8.201 8.201 0,0% 27.353 27.353 0,0% 35.554 35.554 0,0% 1.141.124 1.223.006 -6,7% Portal Tucuman 10.371 10.371 0,0% 21.439 21.439 0,0% 31.810 31.810 0,0% 879.783 955.747 -7,9% Portal Escobar 4.410 4.410 0,0% 29.607 29.607 0,0% 34.016 34.016 0,0% n.a n.a n.a Portal los Andes 3.390 3.390 0,0% 29.456 29.456 0,0% 32.846 32.846 0,0% n.a n.a n.a Portal Trelew 7.213 7.213 0,0% 15.682 15.682 0,0% 22.895 22.895 0,0% n.a n.a n.a Portal Salta 5.635 5.635 0,0% 18.464 18.464 0,0% 24.099 24.099 0,0% n.a n.a n.a Portal Santiago Del Estero 5.461 5.461 0,0% 11.737 11.737 0,0% 17.198 17.198 0,0% n.a n.a n.a Factory/Vecinal/Power Center/Otros
50.447 50.447 0,0% 176.164 176.164 0,0% 226.611 226.611 0,0% 1.586.471 1.682.743 -5,7%
TOTAL ARGENTINA 277.203 277.203 0,0% 470.691 470.691 0,0% 747.894 747.894 0,0% 13.129.426 14.097.423 -6,9%
3rd Parties Sales (ARS M) Related Parties Sales (ARS '000) Sales (ARS '000) Revenues (ARS '000)
Locations 2Q19 2Q18 Var% 2Q19 2Q18 Var% 2Q19 2Q18 Var% 2Q19 2Q18 Var%
Unicenter 3.494.253 2.753.047 26,9% 456.843 367.542 24,3% 3.951.096 3.120.589 26,6% 294.985 239.102 23,4% Portal Plaza Oeste 740.413 678.217 9,2% 208.673 177.109 17,8% 949.086 855.326 11,0% 71.222 61.138 16,5% Portal Palmas del Pliar 755.424 626.868 20,5% 592.387 417.375 41,9% 1.347.811 1.044.243 29,1% 62.092 48.092 29,1% Portal Rosario 610.001 519.579 17,4% 304.291 236.844 28,5% 914.292 756.423 20,9% 38.588 32.239 19,7% Portal Patagonia 534.720 386.411 38,4% 640.769 428.562 49,5% 1.175.488 814.973 44,2% 33.188 26.112 27,1% Portal Lomas 332.836 305.604 8,9% 365.342 310.642 17,6% 698.178 616.246 13,3% 25.218 19.875 26,9% Portal Tucuman 415.081 368.603 12,6% 352.722 287.809 22,6% 767.803 656.412 17,0% 28.825 27.153 6,2% Portal Escobar 162.487 158.663 2,4% 360.168 270.101 33,3% 522.656 428.764 21,9% 9.584 8.060 18,9% Portal los Andes 197.134 182.460 8,0% 488.391 373.366 30,8% 685.524 555.826 23,3% 11.160 8.443 32,2% Portal Trelew 200.288 150.109 33,4% 188.527 129.629 45,4% 388.814 279.738 39,0% 11.033 7.003 57,5% Portal Salta 156.241 125.587 24,4% 332.004 259.538 27,9% 488.246 385.125 26,8% 11.288 8.898 26,9% Portal Santiago Del Estero 96.406 58.854 n.a 222.194 61.633 n.a 318.600 120.488 n.a 5.582 3.990 39,9% Factory/Vecinal/Power Center/Otros
1.703.202 1.319.366 29,1% 2.463.358 1.878.603 31,1% 4.166.560 3.197.969 30,3% 118.491 88.779 33,5%
TOTAL ARGENTINA 9.398.487 7.633.367 23,1% 6.975.668 5.198.753 34,2% 16.374.155 12.832.121 27,6% 721.256 578.886 24,6%
PERU
Locations Third Parties GLA Related Parties GLA TOTAL GLA
2Q19 2Q18 Var% 2Q19 2Q18 Var% 2Q19 2Q18 Var% Plaza Lima Sur 43.634 43.634 0,0% 32.263 32.263 0,0% 75.897 75.897 0,0% Balta 1.031 1.031 0,0% 6.050 6.050 0,0% 7.081 7.081 0,0% Plaza Camacho 9.451 9.451 0,0% 436 436 0,0% 9.887 9.887 0,0% Trascaja n.a n.a n.a. n.a n.a n.a. n.a n.a n.a. IPO Locations 20.279 20.279 0,0% 29.794 29.794 0,0% 50.073 50.073 0,0%
TOTAL PERÚ 74.395 74.395 0,0% 68.543 68.543 0,0% 142.938 142.938 0,0%
Locations
Revenues (PEN) 2Q19 2Q18 Var%
Plaza Lima Sur 8.224.242 7.953.299 3,4% Balta 732.830 684.409 7,1% Plaza Camacho 1.076.655 931.153 15,6% Trascaja 13.965.902 12.691.614 10,0% IPO Locations 3.597.939 3.197.187 12,5% TOTAL PERÚ 27.597.568 25.457.662 8,4%
11
COLOMBIA
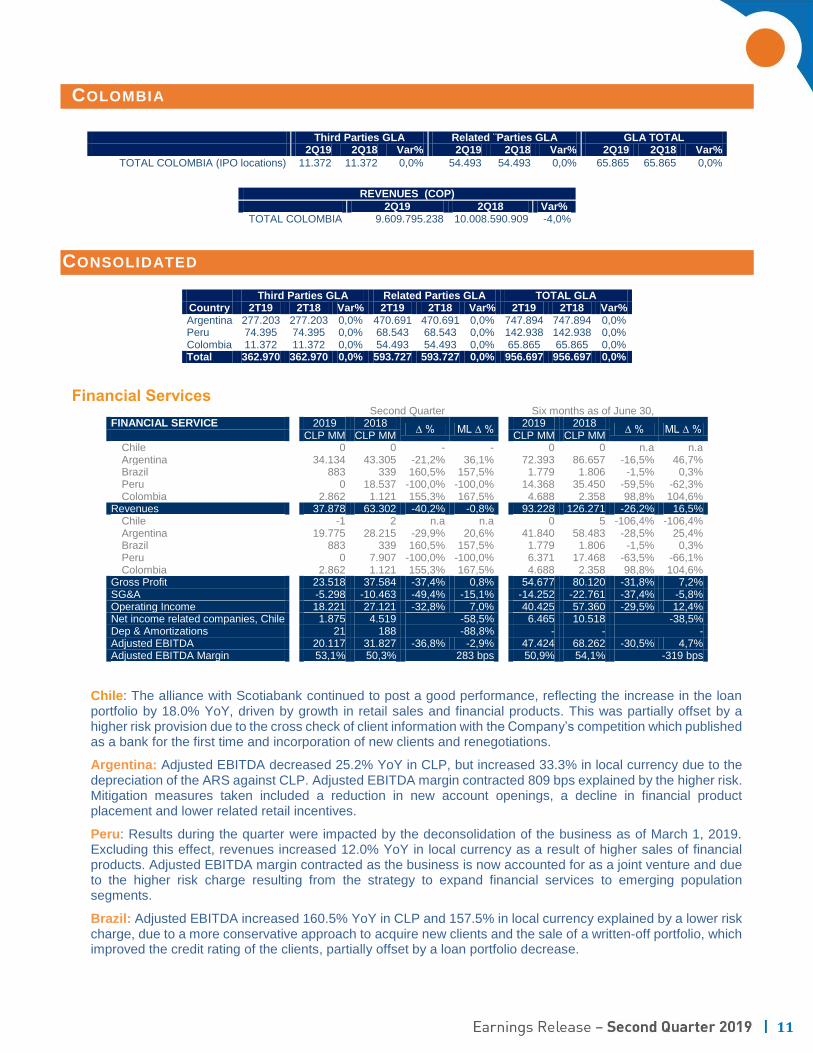
Third Parties GLA Related ¨Parties GLA GLA TOTAL 2Q19 2Q18 Var% 2Q19 2Q18 Var% 2Q19 2Q18 Var%
TOTAL COLOMBIA (IPO locations) 11.372 11.372 0,0% 54.493 54.493 0,0% 65.865 65.865 0,0%
REVENUES (COP)
2Q19 2Q18 Var% TOTAL COLOMBIA 9.609.795.238 10.008.590.909 -4,0%
CONSOLIDATED
Third Parties GLA Related Parties GLA TOTAL GLA Country 2T19 2T18 Var% 2T19 2T18 Var% 2T19 2T18 Var% Argentina 277.203 277.203 0,0% 470.691 470.691 0,0% 747.894 747.894 0,0% Peru 74.395 74.395 0,0% 68.543 68.543 0,0% 142.938 142.938 0,0% Colombia 11.372 11.372 0,0% 54.493 54.493 0,0% 65.865 65.865 0,0% Total 362.970 362.970 0,0% 593.727 593.727 0,0% 956.697 956.697 0,0%
Financial Services Second Quarter Six months as of June 30,
FINANCIAL SERVICE 2019 2018 ∆ % ML ∆ %
2019 2018 ∆ % ML ∆ %
CLP MM CLP MM CLP MM CLP MM Chile 0 0 - - 0 0 n.a n.a Argentina 34.134 43.305 -21,2% 36,1% 72.393 86.657 -16,5% 46,7% Brazil 883 339 160,5% 157,5% 1.779 1.806 -1,5% 0,3% Peru 0 18.537 -100,0% -100,0% 14.368 35.450 -59,5% -62,3% Colombia 2.862 1.121 155,3% 167,5% 4.688 2.358 98,8% 104,6%
Revenues 37.878 63.302 -40,2% -0,8% 93.228 126.271 -26,2% 16,5% Chile -1 2 n.a n.a 0 5 -106,4% -106,4% Argentina 19.775 28.215 -29,9% 20,6% 41.840 58.483 -28,5% 25,4% Brazil 883 339 160,5% 157,5% 1.779 1.806 -1,5% 0,3% Peru 0 7.907 -100,0% -100,0% 6.371 17.468 -63,5% -66,1% Colombia 2.862 1.121 155,3% 167,5% 4.688 2.358 98,8% 104,6%
Gross Profit 23.518 37.584 -37,4% 0,8% 54.677 80.120 -31,8% 7,2% SG&A -5.298 -10.463 -49,4% -15,1% -14.252 -22.761 -37,4% -5,8% Operating Income 18.221 27.121 -32,8% 7,0% 40.425 57.360 -29,5% 12,4% Net income related companies, Chile 1.875 4.519 -58,5% 6.465 10.518 -38,5% Dep & Amortizations 21 188 -88,8% - - - Adjusted EBITDA 20.117 31.827 -36,8% -2,9% 47.424 68.262 -30,5% 4,7% Adjusted EBITDA Margin 53,1% 50,3% 283 bps 50,9% 54,1% -319 bps
Chile: The alliance with Scotiabank continued to post a good performance, reflecting the increase in the loan portfolio by 18.0% YoY, driven by growth in retail sales and financial products. This was partially offset by a higher risk provision due to the cross check of client information with the Company’s competition which published as a bank for the first time and incorporation of new clients and renegotiations.
Argentina: Adjusted EBITDA decreased 25.2% YoY in CLP, but increased 33.3% in local currency due to the depreciation of the ARS against CLP. Adjusted EBITDA margin contracted 809 bps explained by the higher risk. Mitigation measures taken included a reduction in new account openings, a decline in financial product placement and lower related retail incentives.
Peru: Results during the quarter were impacted by the deconsolidation of the business as of March 1, 2019. Excluding this effect, revenues increased 12.0% YoY in local currency as a result of higher sales of financial products. Adjusted EBITDA margin contracted as the business is now accounted for as a joint venture and due to the higher risk charge resulting from the strategy to expand financial services to emerging population segments.
Brazil: Adjusted EBITDA increased 160.5% YoY in CLP and 157.5% in local currency explained by a lower risk charge, due to a more conservative approach to acquire new clients and the sale of a written-off portfolio, which improved the credit rating of the clients, partially offset by a loan portfolio decrease.
12
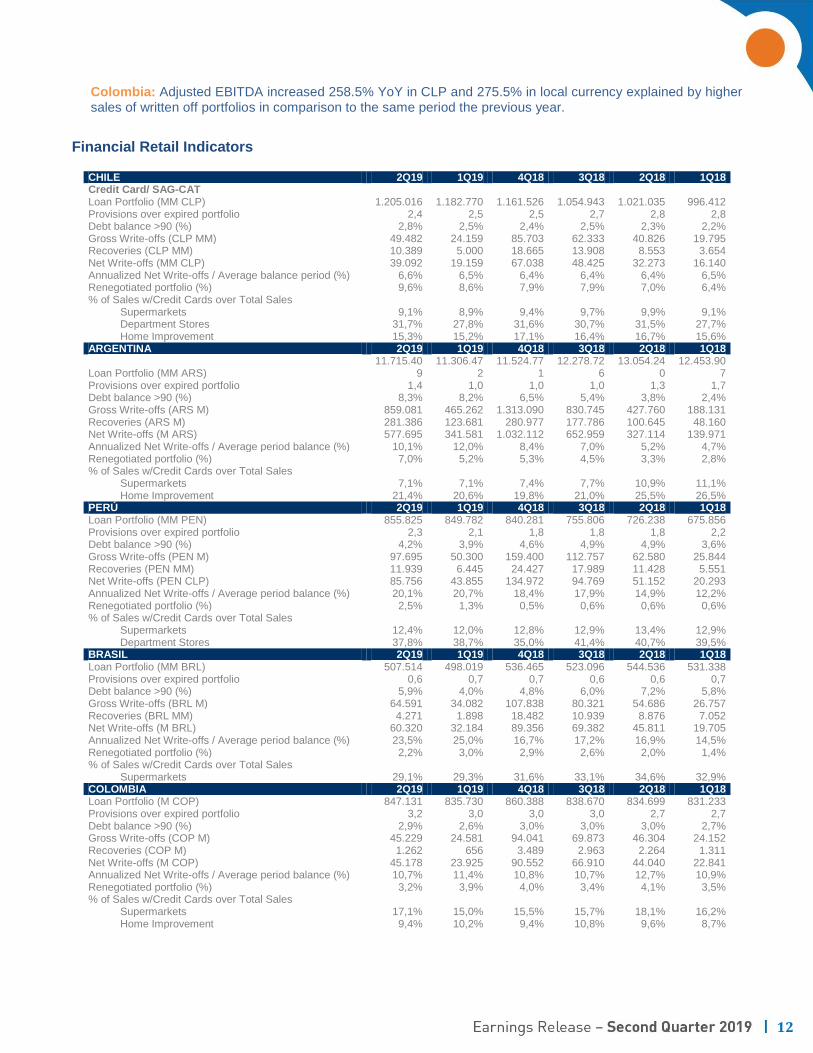
Colombia: Adjusted EBITDA increased 258.5% YoY in CLP and 275.5% in local currency explained by higher sales of written off portfolios in comparison to the same period the previous year.
Financial Retail Indicators
CHILE 2Q19 1Q19 4Q18 3Q18 2Q18 1Q18 Credit Card/ SAG-CAT Loan Portfolio (MM CLP) 1.205.016 1.182.770 1.161.526 1.054.943 1.021.035 996.412 Provisions over expired portfolio 2,4 2,5 2,5 2,7 2,8 2,8 Debt balance >90 (%) 2,8% 2,5% 2,4% 2,5% 2,3% 2,2% Gross Write-offs (CLP MM) 49.482 24.159 85.703 62.333 40.826 19.795 Recoveries (CLP MM) 10.389 5.000 18.665 13.908 8.553 3.654 Net Write-offs (MM CLP) 39.092 19.159 67.038 48.425 32.273 16.140 Annualized Net Write-offs / Average balance period (%) 6,6% 6,5% 6,4% 6,4% 6,4% 6,5% Renegotiated portfolio (%) 9,6% 8,6% 7,9% 7,9% 7,0% 6,4% % of Sales w/Credit Cards over Total Sales
Supermarkets 9,1% 8,9% 9,4% 9,7% 9,9% 9,1% Department Stores 31,7% 27,8% 31,6% 30,7% 31,5% 27,7% Home Improvement 15,3% 15,2% 17,1% 16,4% 16,7% 15,6%
ARGENTINA 2Q19 1Q19 4Q18 3Q18 2Q18 1Q18
Loan Portfolio (MM ARS) 11.715.40
9 11.306.47
2 11.524.77
1 12.278.72
6 13.054.24
0 12.453.90
7 Provisions over expired portfolio 1,4 1,0 1,0 1,0 1,3 1,7 Debt balance >90 (%) 8,3% 8,2% 6,5% 5,4% 3,8% 2,4% Gross Write-offs (ARS M) 859.081 465.262 1.313.090 830.745 427.760 188.131 Recoveries (ARS M) 281.386 123.681 280.977 177.786 100.645 48.160 Net Write-offs (M ARS) 577.695 341.581 1.032.112 652.959 327.114 139.971 Annualized Net Write-offs / Average period balance (%) 10,1% 12,0% 8,4% 7,0% 5,2% 4,7% Renegotiated portfolio (%) 7,0% 5,2% 5,3% 4,5% 3,3% 2,8% % of Sales w/Credit Cards over Total Sales
Supermarkets 7,1% 7,1% 7,4% 7,7% 10,9% 11,1% Home Improvement 21,4% 20,6% 19,8% 21,0% 25,5% 26,5%
PERÚ 2Q19 1Q19 4Q18 3Q18 2Q18 1Q18 Loan Portfolio (MM PEN) 855.825 849.782 840.281 755.806 726.238 675.856 Provisions over expired portfolio 2,3 2,1 1,8 1,8 1,8 2,2 Debt balance >90 (%) 4,2% 3,9% 4,6% 4,9% 4,9% 3,6% Gross Write-offs (PEN M) 97.695 50.300 159.400 112.757 62.580 25.844 Recoveries (PEN MM) 11.939 6.445 24.427 17.989 11.428 5.551 Net Write-offs (PEN CLP) 85.756 43.855 134.972 94.769 51.152 20.293 Annualized Net Write-offs / Average period balance (%) 20,1% 20,7% 18,4% 17,9% 14,9% 12,2% Renegotiated portfolio (%) 2,5% 1,3% 0,5% 0,6% 0,6% 0,6% % of Sales w/Credit Cards over Total Sales
Supermarkets 12,4% 12,0% 12,8% 12,9% 13,4% 12,9% Department Stores 37,8% 38,7% 35,0% 41,4% 40,7% 39,5%
BRASIL 2Q19 1Q19 4Q18 3Q18 2Q18 1Q18 Loan Portfolio (MM BRL) 507.514 498.019 536.465 523.096 544.536 531.338 Provisions over expired portfolio 0,6 0,7 0,7 0,6 0,6 0,7 Debt balance >90 (%) 5,9% 4,0% 4,8% 6,0% 7,2% 5,8% Gross Write-offs (BRL M) 64.591 34.082 107.838 80.321 54.686 26.757 Recoveries (BRL MM) 4.271 1.898 18.482 10.939 8.876 7.052 Net Write-offs (M BRL) 60.320 32.184 89.356 69.382 45.811 19.705 Annualized Net Write-offs / Average period balance (%) 23,5% 25,0% 16,7% 17,2% 16,9% 14,5% Renegotiated portfolio (%) 2,2% 3,0% 2,9% 2,6% 2,0% 1,4% % of Sales w/Credit Cards over Total Sales
Supermarkets 29,1% 29,3% 31,6% 33,1% 34,6% 32,9% COLOMBIA 2Q19 1Q19 4Q18 3Q18 2Q18 1Q18 Loan Portfolio (M COP) 847.131 835.730 860.388 838.670 834.699 831.233 Provisions over expired portfolio 3,2 3,0 3,0 3,0 2,7 2,7 Debt balance >90 (%) 2,9% 2,6% 3,0% 3,0% 3,0% 2,7% Gross Write-offs (COP M) 45.229 24.581 94.041 69.873 46.304 24.152 Recoveries (COP M) 1.262 656 3.489 2.963 2.264 1.311 Net Write-offs (M COP) 45.178 23.925 90.552 66.910 44.040 22.841 Annualized Net Write-offs / Average period balance (%) 10,7% 11,4% 10,8% 10,7% 12,7% 10,9% Renegotiated portfolio (%) 3,2% 3,9% 4,0% 3,4% 4,1% 3,5% % of Sales w/Credit Cards over Total Sales
Supermarkets 17,1% 15,0% 15,5% 15,7% 18,1% 16,2% Home Improvement 9,4% 10,2% 9,4% 10,8% 9,6% 8,7%
13
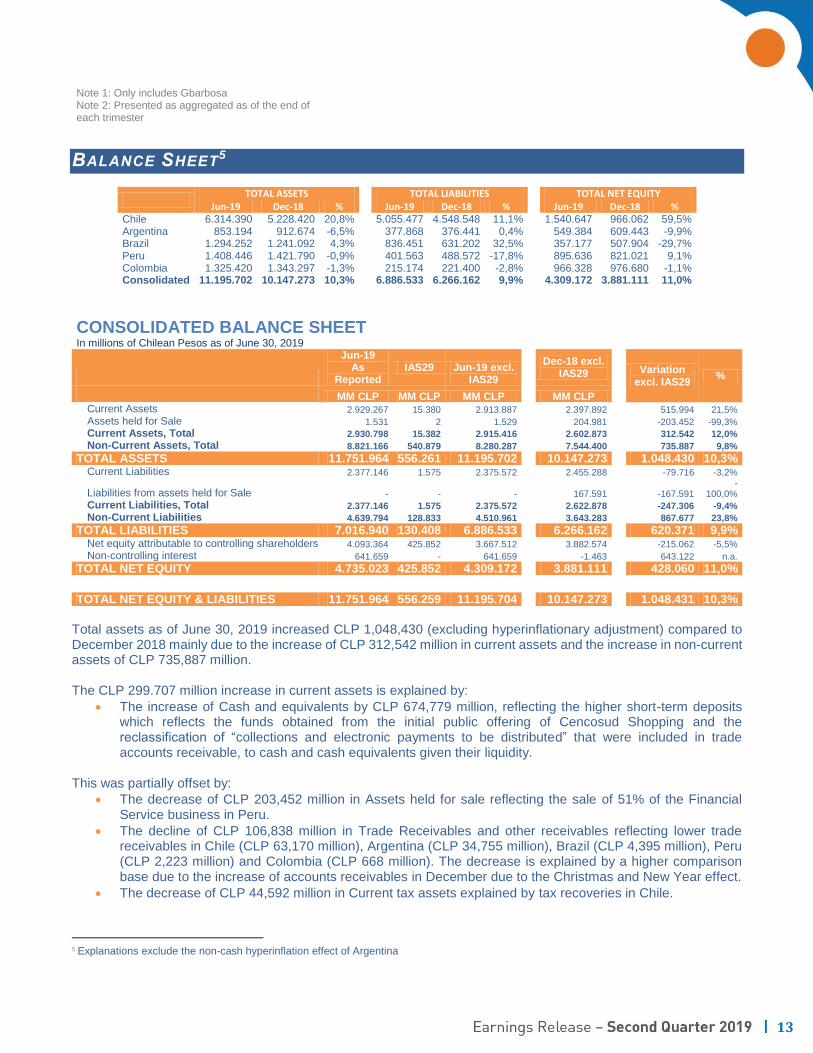
Note 1: Only includes Gbarbosa Note 2: Presented as aggregated as of the end of each trimester
BALANCE SHEET5
TOTAL ASSETS TOTAL LIABILITIES TOTAL NET EQUITY
Jun-19 Dec-18 % Jun-19 Dec-18 % Jun-19 Dec-18 % Chile 6.314.390 5.228.420 20,8% 5.055.477 4.548.548 11,1% 1.540.647 966.062 59,5% Argentina 853.194 912.674 -6,5% 377.868 376.441 0,4% 549.384 609.443 -9,9% Brazil 1.294.252 1.241.092 4,3% 836.451 631.202 32,5% 357.177 507.904 -29,7% Peru 1.408.446 1.421.790 -0,9% 401.563 488.572 -17,8% 895.636 821.021 9,1% Colombia 1.325.420 1.343.297 -1,3% 215.174 221.400 -2,8% 966.328 976.680 -1,1% Consolidated 11.195.702 10.147.273 10,3% 6.886.533 6.266.162 9,9% 4.309.172 3.881.111 11,0%
CONSOLIDATED BALANCE SHEET In millions of Chilean Pesos as of June 30, 2019
Jun-19 As
Reported IAS29 Jun-19 excl.
IAS29
Dec-18 excl. IAS29
Variation excl. IAS29
%
MM CLP MM CLP MM CLP MM CLP Current Assets 2.929.267 15.380 2.913.887 2.397.892 515.994 21,5%
Assets held for Sale 1.531 2 1.529 204.981 -203.452 -99,3%
Current Assets, Total 2.930.798 15.382 2.915.416 2.602.873 312.542 12,0%
Non-Current Assets, Total 8.821.166 540.879 8.280.287 7.544.400 735.887 9,8%
TOTAL ASSETS 11.751.964 556.261 11.195.702 10.147.273 1.048.430 10,3% Current Liabilities 2.377.146 1.575 2.375.572 2.455.288 -79.716 -3,2%
Liabilities from assets held for Sale - - - 167.591 -167.591 -
100,0%
Current Liabilities, Total 2.377.146 1.575 2.375.572 2.622.878 -247.306 -9,4%
Non-Current Liabilities 4.639.794 128.833 4.510.961 3.643.283 867.677 23,8%
TOTAL LIABILITIES 7.016.940 130.408 6.886.533 6.266.162 620.371 9,9% Net equity attributable to controlling shareholders 4.093.364 425.852 3.667.512 3.882.574 -215.062 -5,5%
Non-controlling interest 641.659 - 641.659 -1.463 643.122 n.a.
TOTAL NET EQUITY 4.735.023 425.852 4.309.172 3.881.111 428.060 11,0%
TOTAL NET EQUITY & LIABILITIES 11.751.964 556.259 11.195.704 10.147.273 1.048.431 10,3%
Total assets as of June 30, 2019 increased CLP 1,048,430 (excluding hyperinflationary adjustment) compared to December 2018 mainly due to the increase of CLP 312,542 million in current assets and the increase in non-current assets of CLP 735,887 million. The CLP 299.707 million increase in current assets is explained by:
The increase of Cash and equivalents by CLP 674,779 million, reflecting the higher short-term deposits which reflects the funds obtained from the initial public offering of Cencosud Shopping and the reclassification of “collections and electronic payments to be distributed” that were included in trade accounts receivable, to cash and cash equivalents given their liquidity.
This was partially offset by:
The decrease of CLP 203,452 million in Assets held for sale reflecting the sale of 51% of the Financial Service business in Peru.
The decline of CLP 106,838 million in Trade Receivables and other receivables reflecting lower trade receivables in Chile (CLP 63,170 million), Argentina (CLP 34,755 million), Brazil (CLP 4,395 million), Peru (CLP 2,223 million) and Colombia (CLP 668 million). The decrease is explained by a higher comparison base due to the increase of accounts receivables in December due to the Christmas and New Year effect.
The decrease of CLP 44,592 million in Current tax assets explained by tax recoveries in Chile.
5 Explanations exclude the non-cash hyperinflation effect of Argentina
14
The increase in non-current assets of CLP 735,887 million is explained by:
The increase of CLP 738,356 million in Properties, plants and equipment (PP&E) explained by the adoption of IFRS16 which increases PP&E subject to operating leases as the rule accounts for these as Right of Use assets.
The increase of CLP 146,282 million in Investment Properties (IP) explained by the adoption of IFRS16 which increases IP subject to operating leases as the rule accounts for these as Right of Use assets.
An increase of CLP 107,281 million in deferred income tax assets, due to the adoption of IFRS16.
An increase of CLP 67,693 million in Equity method investment as a result of the incorporation of the 49.0% share in the alliance with Scotiabank in Peru to co-develop de Financial Services business.
The aforementioned was partially offset by the decrease of CLP 275,974 in Goodwill explained by the adoption of IFRS16 and to a lesser extent due to the devaluation of the ARS against CLP and the decrease of CLP 24,808 million in Other financial assets non-current due to the low value of derivatives.
Total liabilities as of June 30, 2019 increased by CLP 620,371 million compared to December 2018 mainly due to the increase in current non-current liabilities of CLP 867,677 million, partially offset by the decrease in current liabilities of CLP 247,306 million, respectively. The decline in current liabilities of CLP 247,306 million is explained by:
The decrease in other current trade payables of CLP 272,657 million explained by lower suppliers’ trade payables due to the lower inventory purchase as the Company focuses on improving working capital management.
The decrease in liabilities held for sale by CLP 167,591 million after the execution of the 51% sale of Banco Cencosud in Peru.
This was partially offset by an increase of CLP 117,312 million in other lease liabilities as a result of the adoption of IFRS16.
The increase in non-current liabilities of CLP 867,677 million is explained by:
The increase of CLP 930,829 million in non-current lease liabilities, explained by the adoption of FRS16.
An increase of CLP 58,570 million in deferred income tax liabilities.
This was partially offset by the decrease of other financial liabilities non-current by CLP 111,097 million explained by the reclassification from non-current to current liabilities.
The CLP 428,060 million increase in equity is explained by the increase of Non-controlling interest by CLP 643,122 million after the IPO of Cencosud Shopping, partially offset by the decrease in retained earnings by CLP 215,062 million reflecting the adoption of IFRS16, the period results and the dividends provision.
INDEBTEDNESS
As of June 30, 2019, net financial debt was CLP 3,029,927 million, compared to CLP 2,870,866 million as of June 30, 2018.
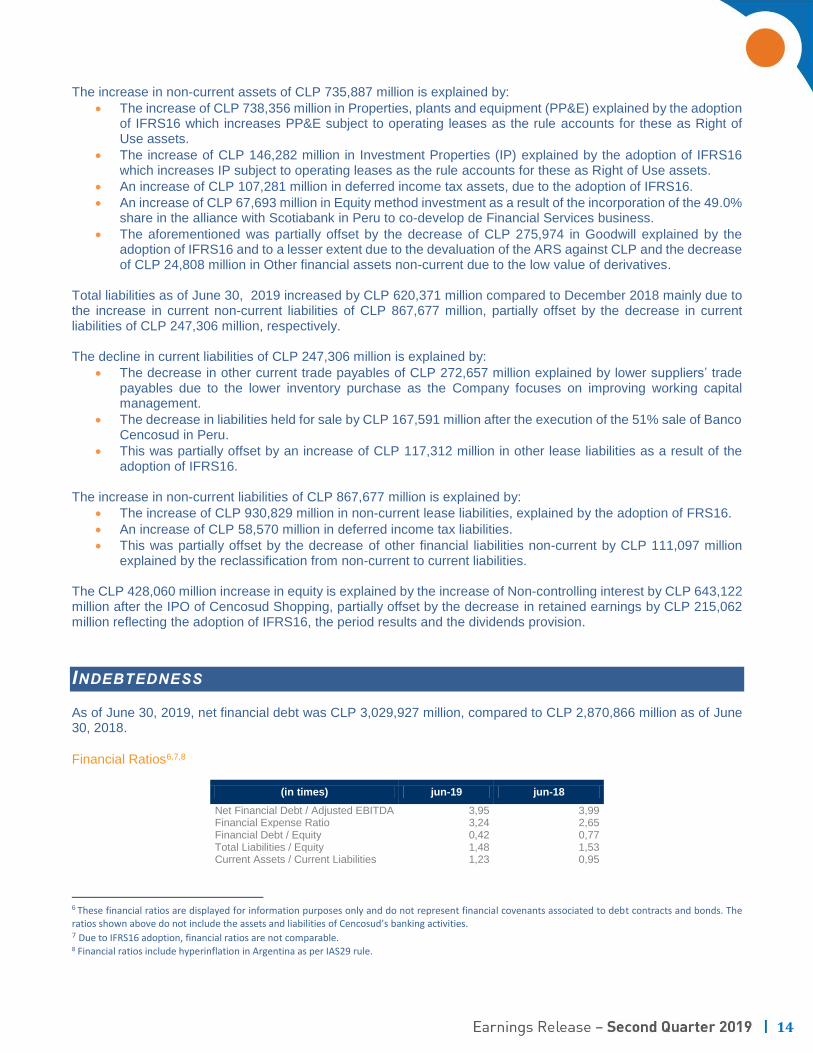
Financial Ratios6,7,8
(in times) jun-19 jun-18
Net Financial Debt / Adjusted EBITDA 3,95 3,99 Financial Expense Ratio 3,24 2,65 Financial Debt / Equity 0,42 0,77 Total Liabilities / Equity 1,48 1,53 Current Assets / Current Liabilities 1,23 0,95
6 These financial ratios are displayed for information purposes only and do not represent financial covenants associated to debt contracts and bonds. The ratios shown above do not include the assets and liabilities of Cencosud’s banking activities. 7 Due to IFRS16 adoption, financial ratios are not comparable. 8 Financial ratios include hyperinflation in Argentina as per IAS29 rule.
15
Interest Rate Risk As of June 30, 2019, including the Cross Currency Swaps, 79.78% of the Company’s financial debt was at fixed interest rates, primarily short-term debt and bonds. The remaining debt was at variable interest rates. Of the variable-rate, 89.61% is indexed to local interest rates (either by its original terms or under derivative arrangements). The Company’s hedging policy also provides for the periodic review of exposure to exchange rate and interest rate risks. Currency Hedges In countries where Cencosud operates, the majority of costs and revenues are denominated in local currencies. The majority of the Company’s debt is denominated or converted through Cross Currency Swaps to Chilean pesos. As of June 30, 2019, approximately 72.94% of consolidated financial debt was denominated in US dollars, of which 71.85% was covered using Cross Currency Swaps or other Exchange Rate Hedges. The Company’s policy is to cover the risk created by variations in exchange rate on the position of net payable liabilities in foreign currency using market instruments. Considering the effect of the Cross Currency Swaps, as of June 30, 2019, the Company’s exposure to the US dollar was 20.53% of its total gross debt.
WORKING CAPITAL RATIOS9
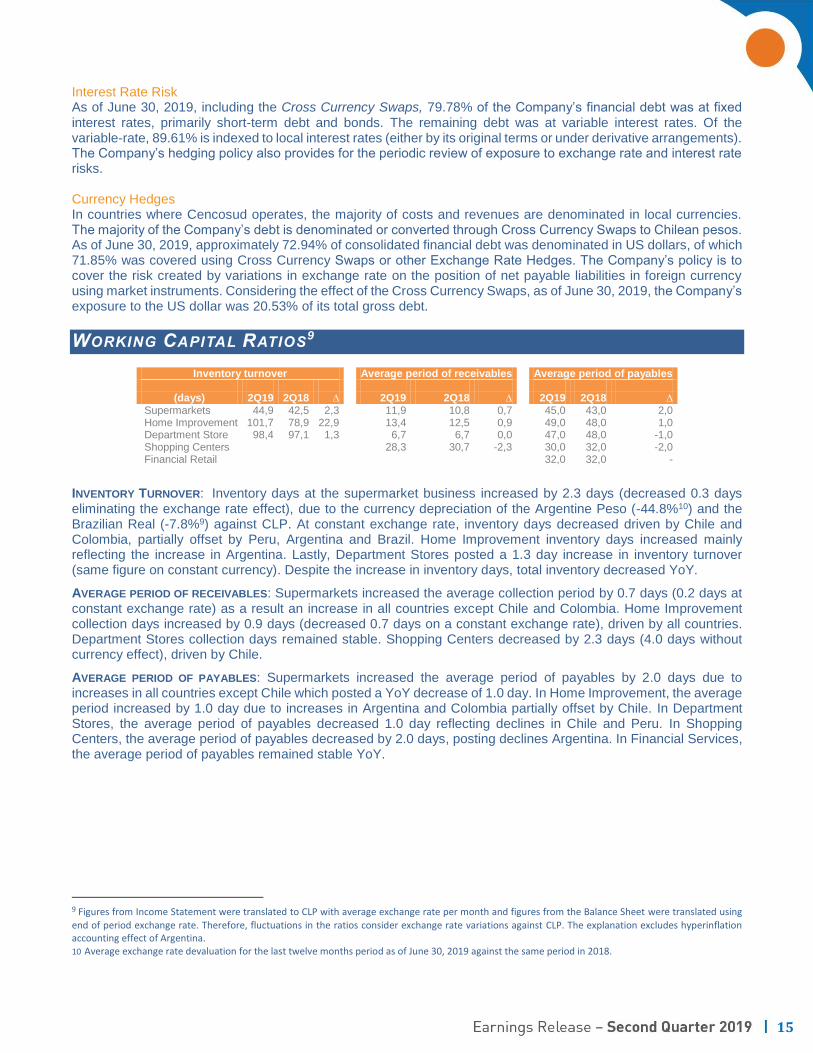
Inventory turnover Average period of receivables Average period of payables
(days) 2Q19 2Q18 ∆ 2Q19 2Q18 ∆ 2Q19 2Q18 ∆ Supermarkets 44,9 42,5 2,3 11,9 10,8 0,7 45,0 43,0 2,0 Home Improvement 101,7 78,9 22,9 13,4 12,5 0,9 49,0 48,0 1,0 Department Store 98,4 97,1 1,3 6,7 6,7 0,0 47,0 48,0 -1,0 Shopping Centers 28,3 30,7 -2,3 30,0 32,0 -2,0 Financial Retail 32,0 32,0 -
INVENTORY TURNOVER: Inventory days at the supermarket business increased by 2.3 days (decreased 0.3 days eliminating the exchange rate effect), due to the currency depreciation of the Argentine Peso (-44.8%10) and the Brazilian Real (-7.8%9) against CLP. At constant exchange rate, inventory days decreased driven by Chile and Colombia, partially offset by Peru, Argentina and Brazil. Home Improvement inventory days increased mainly reflecting the increase in Argentina. Lastly, Department Stores posted a 1.3 day increase in inventory turnover (same figure on constant currency). Despite the increase in inventory days, total inventory decreased YoY.
AVERAGE PERIOD OF RECEIVABLES: Supermarkets increased the average collection period by 0.7 days (0.2 days at constant exchange rate) as a result an increase in all countries except Chile and Colombia. Home Improvement collection days increased by 0.9 days (decreased 0.7 days on a constant exchange rate), driven by all countries. Department Stores collection days remained stable. Shopping Centers decreased by 2.3 days (4.0 days without currency effect), driven by Chile.
AVERAGE PERIOD OF PAYABLES: Supermarkets increased the average period of payables by 2.0 days due to increases in all countries except Chile which posted a YoY decrease of 1.0 day. In Home Improvement, the average period increased by 1.0 day due to increases in Argentina and Colombia partially offset by Chile. In Department Stores, the average period of payables decreased 1.0 day reflecting declines in Chile and Peru. In Shopping Centers, the average period of payables decreased by 2.0 days, posting declines Argentina. In Financial Services, the average period of payables remained stable YoY.
9 Figures from Income Statement were translated to CLP with average exchange rate per month and figures from the Balance Sheet were translated using
end of period exchange rate. Therefore, fluctuations in the ratios consider exchange rate variations against CLP. The explanation excludes hyperinflation accounting effect of Argentina. 10 Average exchange rate devaluation for the last twelve months period as of June 30, 2019 against the same period in 2018.
16
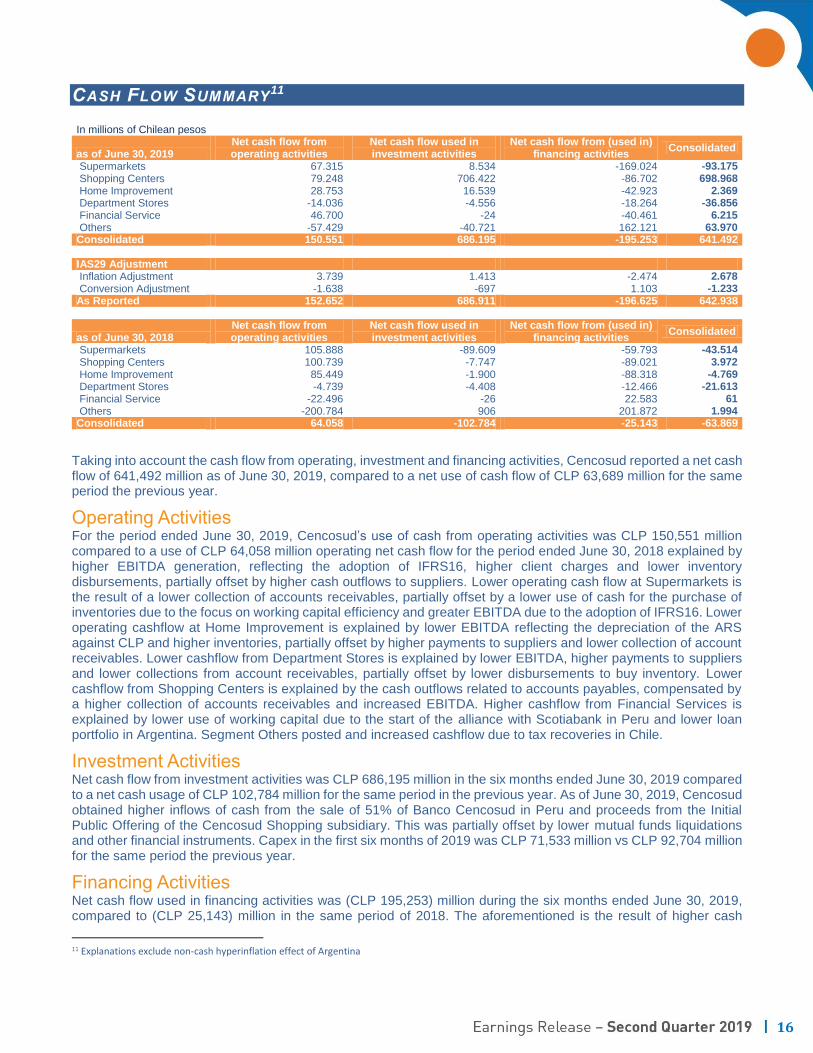
CASH FLOW SUMMARY11
In millions of Chilean pesos
as of June 30, 2019 Net cash flow from operating activities
Net cash flow used in investment activities
Net cash flow from (used in) financing activities
Consolidated
Supermarkets 67.315 8.534 -169.024 -93.175 Shopping Centers 79.248 706.422 -86.702 698.968 Home Improvement 28.753 16.539 -42.923 2.369 Department Stores -14.036 -4.556 -18.264 -36.856 Financial Service 46.700 -24 -40.461 6.215 Others -57.429 -40.721 162.121 63.970 Consolidated 150.551 686.195 -195.253 641.492 IAS29 Adjustment Inflation Adjustment 3.739 1.413 -2.474 2.678 Conversion Adjustment -1.638 -697 1.103 -1.233 As Reported 152.652 686.911 -196.625 642.938
as of June 30, 2018 Net cash flow from operating activities
Net cash flow used in investment activities
Net cash flow from (used in) financing activities
Consolidated
Supermarkets 105.888 -89.609 -59.793 -43.514 Shopping Centers 100.739 -7.747 -89.021 3.972 Home Improvement 85.449 -1.900 -88.318 -4.769 Department Stores -4.739 -4.408 -12.466 -21.613 Financial Service -22.496 -26 22.583 61 Others -200.784 906 201.872 1.994 Consolidated 64.058 -102.784 -25.143 -63.869
Taking into account the cash flow from operating, investment and financing activities, Cencosud reported a net cash flow of 641,492 million as of June 30, 2019, compared to a net use of cash flow of CLP 63,689 million for the same period the previous year.
Operating Activities For the period ended June 30, 2019, Cencosud’s use of cash from operating activities was CLP 150,551 million compared to a use of CLP 64,058 million operating net cash flow for the period ended June 30, 2018 explained by higher EBITDA generation, reflecting the adoption of IFRS16, higher client charges and lower inventory disbursements, partially offset by higher cash outflows to suppliers. Lower operating cash flow at Supermarkets is the result of a lower collection of accounts receivables, partially offset by a lower use of cash for the purchase of inventories due to the focus on working capital efficiency and greater EBITDA due to the adoption of IFRS16. Lower operating cashflow at Home Improvement is explained by lower EBITDA reflecting the depreciation of the ARS against CLP and higher inventories, partially offset by higher payments to suppliers and lower collection of account receivables. Lower cashflow from Department Stores is explained by lower EBITDA, higher payments to suppliers and lower collections from account receivables, partially offset by lower disbursements to buy inventory. Lower cashflow from Shopping Centers is explained by the cash outflows related to accounts payables, compensated by a higher collection of accounts receivables and increased EBITDA. Higher cashflow from Financial Services is explained by lower use of working capital due to the start of the alliance with Scotiabank in Peru and lower loan portfolio in Argentina. Segment Others posted and increased cashflow due to tax recoveries in Chile.
Investment Activities Net cash flow from investment activities was CLP 686,195 million in the six months ended June 30, 2019 compared to a net cash usage of CLP 102,784 million for the same period in the previous year. As of June 30, 2019, Cencosud obtained higher inflows of cash from the sale of 51% of Banco Cencosud in Peru and proceeds from the Initial Public Offering of the Cencosud Shopping subsidiary. This was partially offset by lower mutual funds liquidations and other financial instruments. Capex in the first six months of 2019 was CLP 71,533 million vs CLP 92,704 million for the same period the previous year.
Financing Activities Net cash flow used in financing activities was (CLP 195,253) million during the six months ended June 30, 2019, compared to (CLP 25,143) million in the same period of 2018. The aforementioned is the result of higher cash
11 Explanations exclude non-cash hyperinflation effect of Argentina
17
outflows for payments of lease liabilities (in 2018 it is considered within the operational flow), and higher loan payments, partially offset by higher imported loan after the local bonds issued by Cencosud Shopping subsidiary.
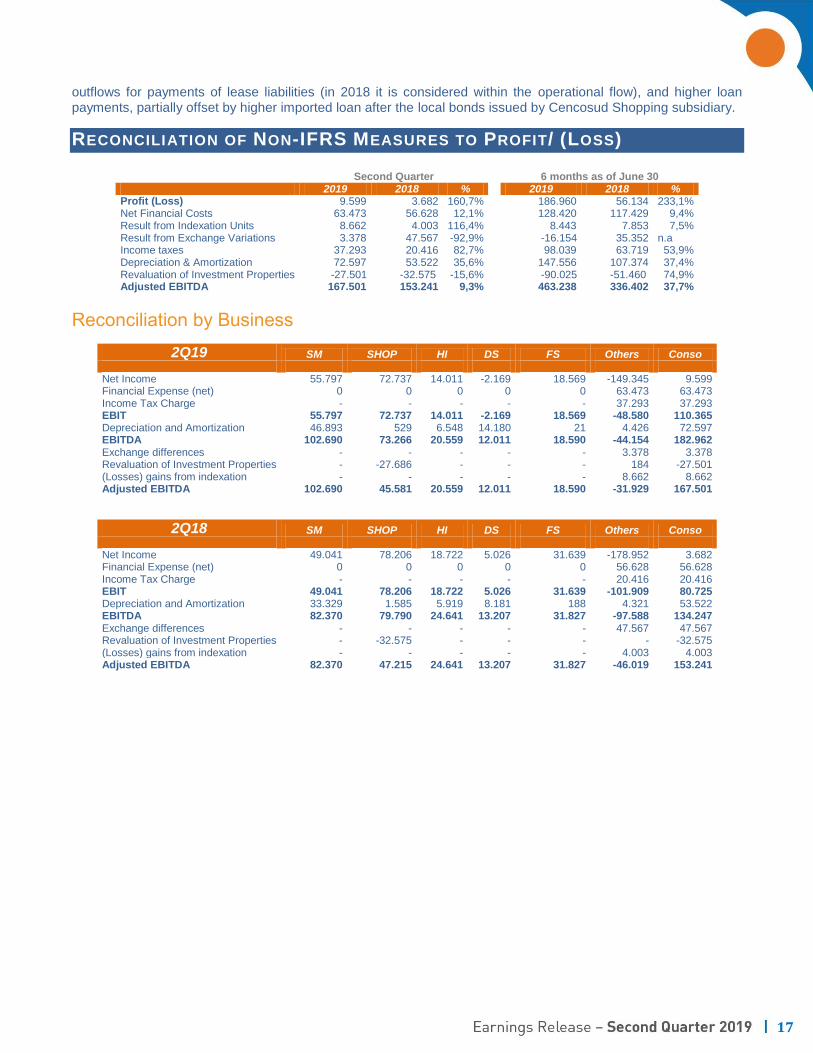
RECONCILIATION OF NON-IFRS MEASURES TO PROFIT/ (LOSS)
Second Quarter 6 months as of June 30 2019 2018 % 2019 2018 %
Profit (Loss) 9.599 3.682 160,7% 186.960 56.134 233,1% Net Financial Costs 63.473 56.628 12,1% 128.420 117.429 9,4% Result from Indexation Units 8.662 4.003 116,4% 8.443 7.853 7,5% Result from Exchange Variations 3.378 47.567 -92,9% -16.154 35.352 n.a Income taxes 37.293 20.416 82,7% 98.039 63.719 53,9% Depreciation & Amortization 72.597 53.522 35,6% 147.556 107.374 37,4% Revaluation of Investment Properties -27.501 -32.575 -15,6% -90.025 -51.460 74,9% Adjusted EBITDA 167.501 153.241 9,3% 463.238 336.402 37,7%
Reconciliation by Business
2Q19 SM SHOP HI DS FS Others Conso Net Income 55.797 72.737 14.011 -2.169 18.569 -149.345 9.599 Financial Expense (net) 0 0 0 0 0 63.473 63.473 Income Tax Charge - - - - - 37.293 37.293 EBIT 55.797 72.737 14.011 -2.169 18.569 -48.580 110.365 Depreciation and Amortization 46.893 529 6.548 14.180 21 4.426 72.597 EBITDA 102.690 73.266 20.559 12.011 18.590 -44.154 182.962 Exchange differences - - - - - 3.378 3.378 Revaluation of Investment Properties - -27.686 - - - 184 -27.501 (Losses) gains from indexation - - - - - 8.662 8.662 Adjusted EBITDA 102.690 45.581 20.559 12.011 18.590 -31.929 167.501
2Q18 SM SHOP HI DS FS Others Conso Net Income 49.041 78.206 18.722 5.026 31.639 -178.952 3.682 Financial Expense (net) 0 0 0 0 0 56.628 56.628 Income Tax Charge - - - - - 20.416 20.416 EBIT 49.041 78.206 18.722 5.026 31.639 -101.909 80.725 Depreciation and Amortization 33.329 1.585 5.919 8.181 188 4.321 53.522 EBITDA 82.370 79.790 24.641 13.207 31.827 -97.588 134.247 Exchange differences - - - - - 47.567 47.567 Revaluation of Investment Properties - -32.575 - - - - -32.575 (Losses) gains from indexation - - - - - 4.003 4.003 Adjusted EBITDA 82.370 47.215 24.641 13.207 31.827 -46.019 153.241
18
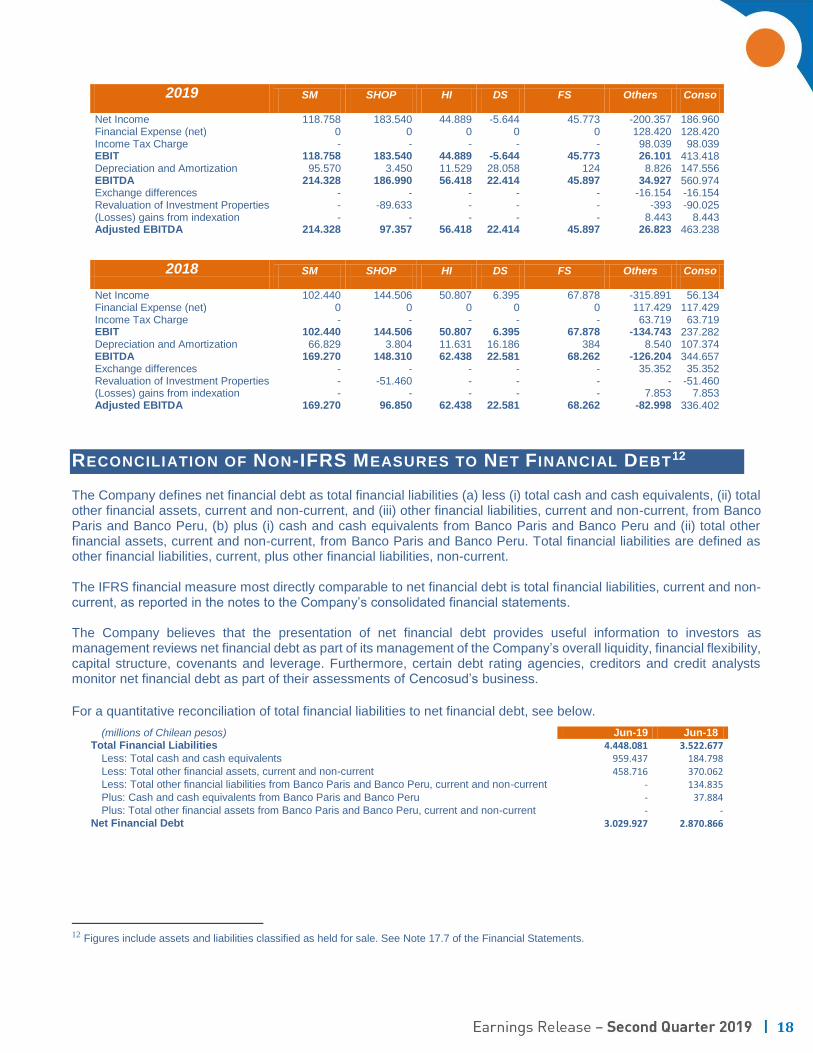
2019 SM SHOP HI DS FS Others Conso Net Income 118.758 183.540 44.889 -5.644 45.773 -200.357 186.960 Financial Expense (net) 0 0 0 0 0 128.420 128.420 Income Tax Charge - - - - - 98.039 98.039 EBIT 118.758 183.540 44.889 -5.644 45.773 26.101 413.418 Depreciation and Amortization 95.570 3.450 11.529 28.058 124 8.826 147.556 EBITDA 214.328 186.990 56.418 22.414 45.897 34.927 560.974 Exchange differences - - - - - -16.154 -16.154 Revaluation of Investment Properties - -89.633 - - - -393 -90.025 (Losses) gains from indexation - - - - - 8.443 8.443 Adjusted EBITDA 214.328 97.357 56.418 22.414 45.897 26.823 463.238
2018 SM SHOP HI DS FS Others Conso Net Income 102.440 144.506 50.807 6.395 67.878 -315.891 56.134 Financial Expense (net) 0 0 0 0 0 117.429 117.429 Income Tax Charge - - - - - 63.719 63.719 EBIT 102.440 144.506 50.807 6.395 67.878 -134.743 237.282 Depreciation and Amortization 66.829 3.804 11.631 16.186 384 8.540 107.374 EBITDA 169.270 148.310 62.438 22.581 68.262 -126.204 344.657 Exchange differences - - - - - 35.352 35.352 Revaluation of Investment Properties - -51.460 - - - - -51.460 (Losses) gains from indexation - - - - - 7.853 7.853 Adjusted EBITDA 169.270 96.850 62.438 22.581 68.262 -82.998 336.402
RECONCILIATION OF NON-IFRS MEASURES TO NET FINANCIAL DEBT12
The Company defines net financial debt as total financial liabilities (a) less (i) total cash and cash equivalents, (ii) total other financial assets, current and non-current, and (iii) other financial liabilities, current and non-current, from Banco Paris and Banco Peru, (b) plus (i) cash and cash equivalents from Banco Paris and Banco Peru and (ii) total other financial assets, current and non-current, from Banco Paris and Banco Peru. Total financial liabilities are defined as other financial liabilities, current, plus other financial liabilities, non-current. The IFRS financial measure most directly comparable to net financial debt is total financial liabilities, current and non-current, as reported in the notes to the Company’s consolidated financial statements. The Company believes that the presentation of net financial debt provides useful information to investors as management reviews net financial debt as part of its management of the Company’s overall liquidity, financial flexibility, capital structure, covenants and leverage. Furthermore, certain debt rating agencies, creditors and credit analysts monitor net financial debt as part of their assessments of Cencosud’s business.
For a quantitative reconciliation of total financial liabilities to net financial debt, see below.
(millions of Chilean pesos) Jun-19 Jun-18
Total Financial Liabilities 4.448.081 3.522.677 Less: Total cash and cash equivalents 959.437 184.798 Less: Total other financial assets, current and non-current 458.716 370.062 Less: Total other financial liabilities from Banco Paris and Banco Peru, current and non-current - 134.835 Plus: Cash and cash equivalents from Banco Paris and Banco Peru - 37.884 Plus: Total other financial assets from Banco Paris and Banco Peru, current and non-current - -
Net Financial Debt 3.029.927 2.870.866
12 Figures include assets and liabilities classified as held for sale. See Note 17.7 of the Financial Statements.
19
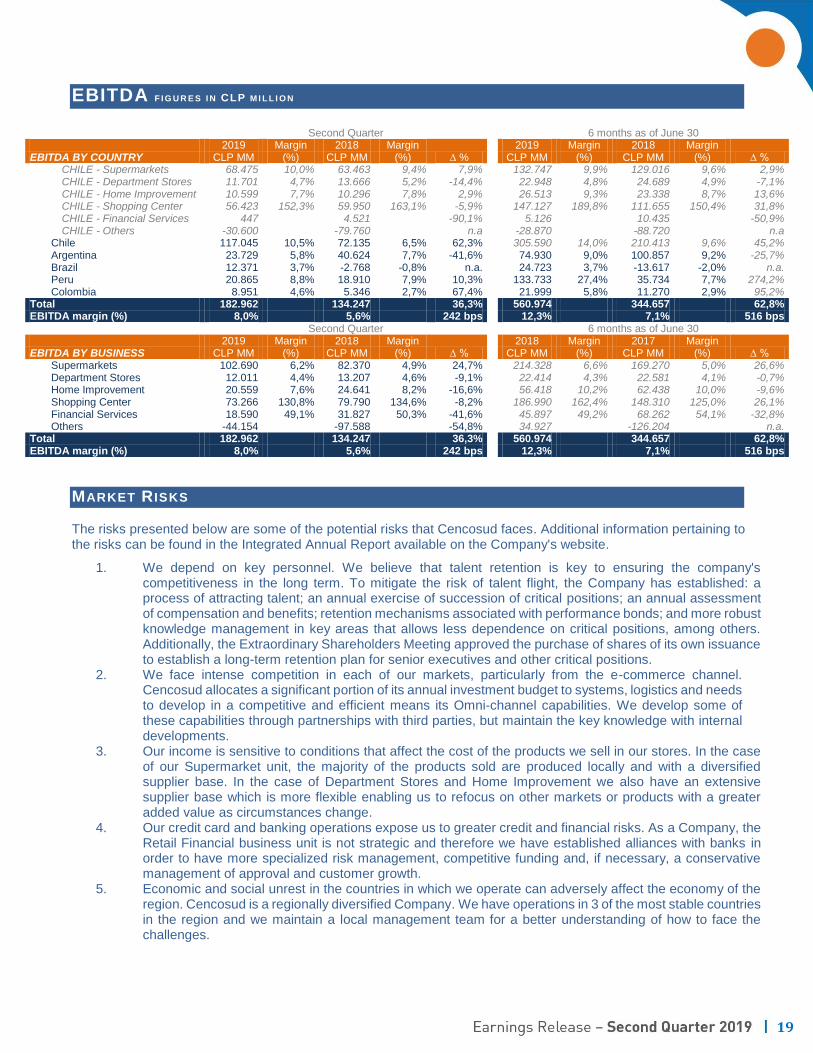
EBITDA F I G U R E S I N CLP M I L L I O N
Second Quarter 6 months as of June 30 2019 Margin 2018 Margin
∆ % 2019 Margin 2018 Margin
∆ % EBITDA BY COUNTRY CLP MM (%) CLP MM (%) CLP MM (%) CLP MM (%) CHILE - Supermarkets 68.475 10,0% 63.463 9,4% 7,9% 132.747 9,9% 129.016 9,6% 2,9% CHILE - Department Stores 11.701 4,7% 13.666 5,2% -14,4% 22.948 4,8% 24.689 4,9% -7,1% CHILE - Home Improvement 10.599 7,7% 10.296 7,8% 2,9% 26.513 9,3% 23.338 8,7% 13,6% CHILE - Shopping Center 56.423 152,3% 59.950 163,1% -5,9% 147.127 189,8% 111.655 150,4% 31,8% CHILE - Financial Services 447 4.521 -90,1% 5.126 10.435 -50,9% CHILE - Others -30.600 -79.760 n.a -28.870 -88.720 n.a
Chile 117.045 10,5% 72.135 6,5% 62,3% 305.590 14,0% 210.413 9,6% 45,2% Argentina 23.729 5,8% 40.624 7,7% -41,6% 74.930 9,0% 100.857 9,2% -25,7% Brazil 12.371 3,7% -2.768 -0,8% n.a. 24.723 3,7% -13.617 -2,0% n.a. Peru 20.865 8,8% 18.910 7,9% 10,3% 133.733 27,4% 35.734 7,7% 274,2% Colombia 8.951 4,6% 5.346 2,7% 67,4% 21.999 5,8% 11.270 2,9% 95,2%
Total 182.962 134.247 36,3% 560.974 344.657 62,8% EBITDA margin (%) 8,0% 5,6% 242 bps 12,3% 7,1% 516 bps Second Quarter 6 months as of June 30 2019 Margin 2018 Margin
∆ % 2018 Margin 2017 Margin
∆ % EBITDA BY BUSINESS CLP MM (%) CLP MM (%) CLP MM (%) CLP MM (%) Supermarkets 102.690 6,2% 82.370 4,9% 24,7% 214.328 6,6% 169.270 5,0% 26,6% Department Stores 12.011 4,4% 13.207 4,6% -9,1% 22.414 4,3% 22.581 4,1% -0,7% Home Improvement 20.559 7,6% 24.641 8,2% -16,6% 56.418 10,2% 62.438 10,0% -9,6% Shopping Center 73.266 130,8% 79.790 134,6% -8,2% 186.990 162,4% 148.310 125,0% 26,1% Financial Services 18.590 49,1% 31.827 50,3% -41,6% 45.897 49,2% 68.262 54,1% -32,8% Others -44.154 -97.588 -54,8% 34.927 -126.204 n.a.
Total 182.962 134.247 36,3% 560.974 344.657 62,8% EBITDA margin (%) 8,0% 5,6% 242 bps 12,3% 7,1% 516 bps
MARKET R ISKS
The risks presented below are some of the potential risks that Cencosud faces. Additional information pertaining to the risks can be found in the Integrated Annual Report available on the Company's website.
1. We depend on key personnel. We believe that talent retention is key to ensuring the company's competitiveness in the long term. To mitigate the risk of talent flight, the Company has established: a process of attracting talent; an annual exercise of succession of critical positions; an annual assessment of compensation and benefits; retention mechanisms associated with performance bonds; and more robust knowledge management in key areas that allows less dependence on critical positions, among others. Additionally, the Extraordinary Shareholders Meeting approved the purchase of shares of its own issuance to establish a long-term retention plan for senior executives and other critical positions.
2. We face intense competition in each of our markets, particularly from the e-commerce channel. Cencosud allocates a significant portion of its annual investment budget to systems, logistics and needs to develop in a competitive and efficient means its Omni-channel capabilities. We develop some of these capabilities through partnerships with third parties, but maintain the key knowledge with internal developments.
3. Our income is sensitive to conditions that affect the cost of the products we sell in our stores. In the case of our Supermarket unit, the majority of the products sold are produced locally and with a diversified supplier base. In the case of Department Stores and Home Improvement we also have an extensive supplier base which is more flexible enabling us to refocus on other markets or products with a greater added value as circumstances change.
4. Our credit card and banking operations expose us to greater credit and financial risks. As a Company, the Retail Financial business unit is not strategic and therefore we have established alliances with banks in order to have more specialized risk management, competitive funding and, if necessary, a conservative management of approval and customer growth.
5. Economic and social unrest in the countries in which we operate can adversely affect the economy of the region. Cencosud is a regionally diversified Company. We have operations in 3 of the most stable countries in the region and we maintain a local management team for a better understanding of how to face the challenges.
20
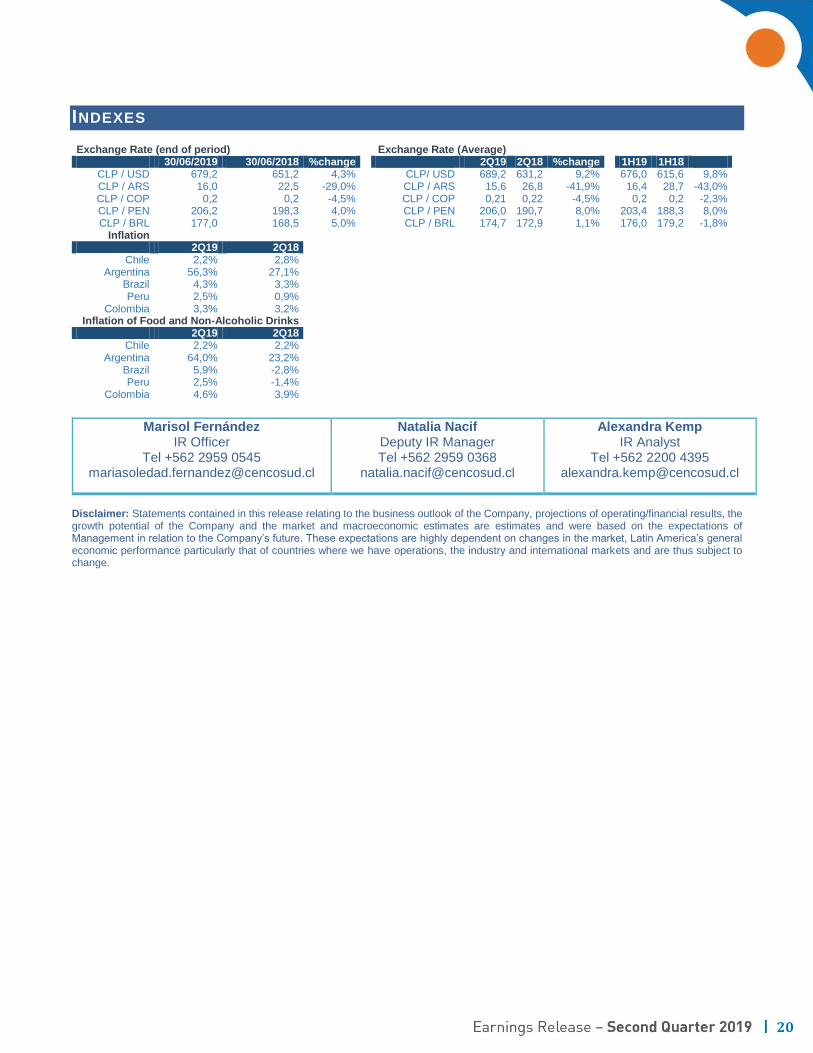
INDEXES
Exchange Rate (end of period) Exchange Rate (Average) 30/06/2019 30/06/2018 %change 2Q19 2Q18 %change 1H19 1H18
CLP / USD 679,2 651,2 4,3% CLP/ USD 689,2 631,2 9,2% 676,0 615,6 9,8% CLP / ARS 16,0 22,5 -29,0% CLP / ARS 15,6 26,8 -41,9% 16,4 28,7 -43,0% CLP / COP 0,2 0,2 -4,5% CLP / COP 0,21 0,22 -4,5% 0,2 0,2 -2,3% CLP / PEN 206,2 198,3 4,0% CLP / PEN 206,0 190,7 8,0% 203,4 188,3 8,0% CLP / BRL 177,0 168,5 5,0% CLP / BRL 174,7 172,9 1,1% 176,0 179,2 -1,8%
Inflation 2Q19 2Q18
Chile 2,2% 2,8% Argentina 56,3% 27,1%
Brazil 4,3% 3,3% Peru 2,5% 0,9%
Colombia 3,3% 3,2% Inflation of Food and Non-Alcoholic Drinks
2Q19 2Q18 Chile 2,2% 2,2%
Argentina 64,0% 23,2% Brazil 5,9% -2,8% Peru 2,5% -1,4%
Colombia 4,6% 3,9%
Disclaimer: Statements contained in this release relating to the business outlook of the Company, projections of operating/financial results, the growth potential of the Company and the market and macroeconomic estimates are estimates and were based on the expectations of Management in relation to the Company’s future. These expectations are highly dependent on changes in the market, Latin America’s general economic performance particularly that of countries where we have operations, the industry and international markets and are thus subject to change.
Marisol Fernández IR Officer
Tel +562 2959 0545 [email protected]
Natalia Nacif Deputy IR Manager Tel +562 2959 0368
Alexandra Kemp IR Analyst
Tel +562 2200 4395 [email protected]
21
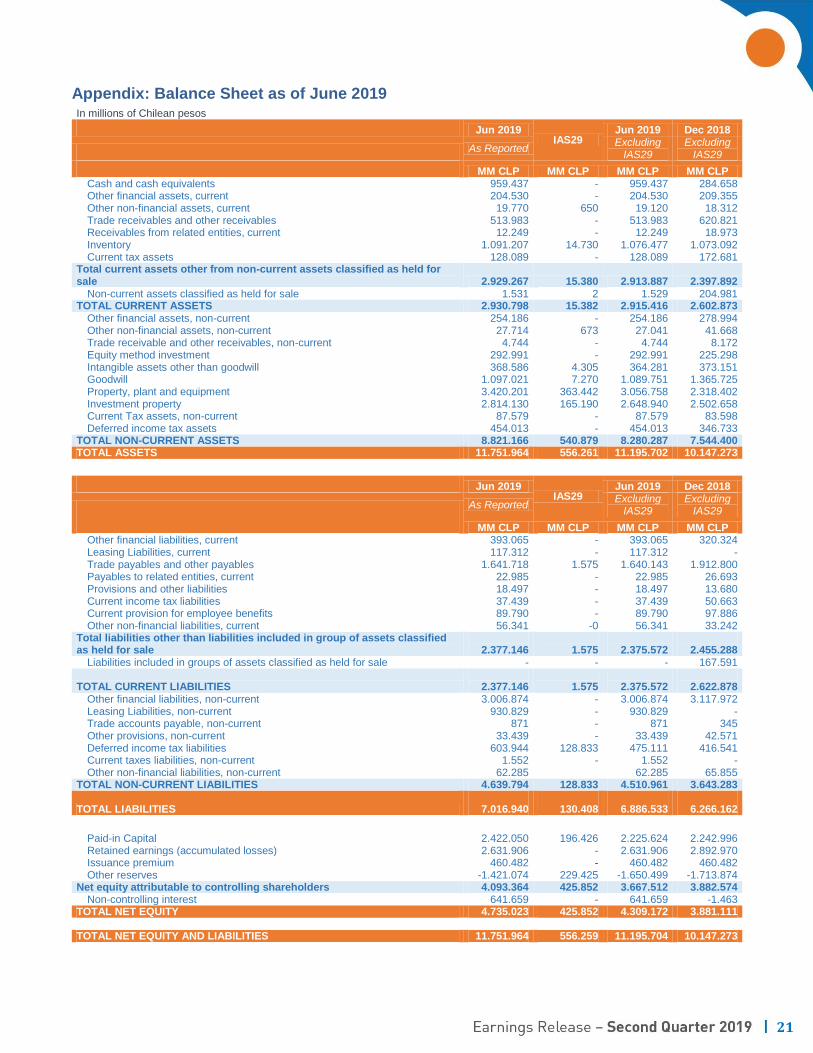
Appendix: Balance Sheet as of June 2019 In millions of Chilean pesos Jun 2019
IAS29 Jun 2019 Dec 2018
As Reported Excluding
IAS29 Excluding
IAS29
MM CLP MM CLP MM CLP MM CLP Cash and cash equivalents 959.437 - 959.437 284.658 Other financial assets, current 204.530 - 204.530 209.355 Other non-financial assets, current 19.770 650 19.120 18.312 Trade receivables and other receivables 513.983 - 513.983 620.821 Receivables from related entities, current 12.249 - 12.249 18.973 Inventory 1.091.207 14.730 1.076.477 1.073.092 Current tax assets 128.089 - 128.089 172.681
Total current assets other from non-current assets classified as held for sale 2.929.267 15.380 2.913.887 2.397.892
Non-current assets classified as held for sale 1.531 2 1.529 204.981 TOTAL CURRENT ASSETS 2.930.798 15.382 2.915.416 2.602.873
Other financial assets, non-current 254.186 - 254.186 278.994 Other non-financial assets, non-current 27.714 673 27.041 41.668 Trade receivable and other receivables, non-current 4.744 - 4.744 8.172 Equity method investment 292.991 - 292.991 225.298 Intangible assets other than goodwill 368.586 4.305 364.281 373.151 Goodwill 1.097.021 7.270 1.089.751 1.365.725 Property, plant and equipment 3.420.201 363.442 3.056.758 2.318.402 Investment property 2.814.130 165.190 2.648.940 2.502.658 Current Tax assets, non-current 87.579 - 87.579 83.598 Deferred income tax assets 454.013 - 454.013 346.733
TOTAL NON-CURRENT ASSETS 8.821.166 540.879 8.280.287 7.544.400 TOTAL ASSETS 11.751.964 556.261 11.195.702 10.147.273
Jun 2019
IAS29 Jun 2019 Dec 2018
As Reported Excluding
IAS29 Excluding
IAS29
MM CLP MM CLP MM CLP MM CLP Other financial liabilities, current 393.065 - 393.065 320.324 Leasing Liabilities, current 117.312 - 117.312 - Trade payables and other payables 1.641.718 1.575 1.640.143 1.912.800 Payables to related entities, current 22.985 - 22.985 26.693 Provisions and other liabilities 18.497 - 18.497 13.680 Current income tax liabilities 37.439 - 37.439 50.663 Current provision for employee benefits 89.790 - 89.790 97.886 Other non-financial liabilities, current 56.341 -0 56.341 33.242
Total liabilities other than liabilities included in group of assets classified as held for sale
2.377.146
1.575
2.375.572
2.455.288
Liabilities included in groups of assets classified as held for sale - - - 167.591
TOTAL CURRENT LIABILITIES
2.377.146
1.575
2.375.572
2.622.878 Other financial liabilities, non-current 3.006.874 - 3.006.874 3.117.972 Leasing Liabilities, non-current 930.829 - 930.829 - Trade accounts payable, non-current 871 - 871 345 Other provisions, non-current 33.439 - 33.439 42.571 Deferred income tax liabilities 603.944 128.833 475.111 416.541 Current taxes liabilities, non-current 1.552 - 1.552 - Other non-financial liabilities, non-current 62.285 62.285 65.855
TOTAL NON-CURRENT LIABILITIES 4.639.794 128.833 4.510.961 3.643.283
TOTAL LIABILITIES
7.016.940
130.408
6.886.533
6.266.162
Paid-in Capital 2.422.050 196.426 2.225.624 2.242.996 Retained earnings (accumulated losses) 2.631.906 - 2.631.906 2.892.970 Issuance premium 460.482 - 460.482 460.482 Other reserves -1.421.074 229.425 -1.650.499 -1.713.874
Net equity attributable to controlling shareholders 4.093.364 425.852 3.667.512 3.882.574 Non-controlling interest 641.659 - 641.659 -1.463
TOTAL NET EQUITY 4.735.023 425.852 4.309.172 3.881.111 TOTAL NET EQUITY AND LIABILITIES 11.751.964 556.259 11.195.704 10.147.273