Embed Size (px)
Citation preview

Produced by Wellesley Information Services, LLC, publisher of SAPinsider. © 2016 Wellesley Information Services. All rights reserved.
Manage by the Numbers: Lessons to Glean Greater Insights into Warehouse Operations
Kyle Sorensen EY
1
In This Session
• Attend this session to learn how to leverage the latest reporting and analytics capabilities
from SAP to measure and monitor the performance of warehouse operations, identify and
resolve potential bottlenecks, and improve productivity
• Delve into the various tools and analytical components available to SAP EWM – from
Warehouse Monitor and Graphical Warehouse Layout, to Shipping Cockpit, Labor
Demand Planning and Smart Business Cockpit – and discern when it makes sense
to use each
• Explore strategies to interpret the data results, identify potential issues, and take
corrective action to reduce the impact on supply chain operations
• Obtain leading practices to develop and maintain a forward-looking warehouse analytics
strategy
2
What We’ll Cover
• Reporting and analytics in EWM
• Interpreting the results and taking action
• Leading practices and trends
• Wrap-up
3
EWM Reporting and Analytics Capabilities
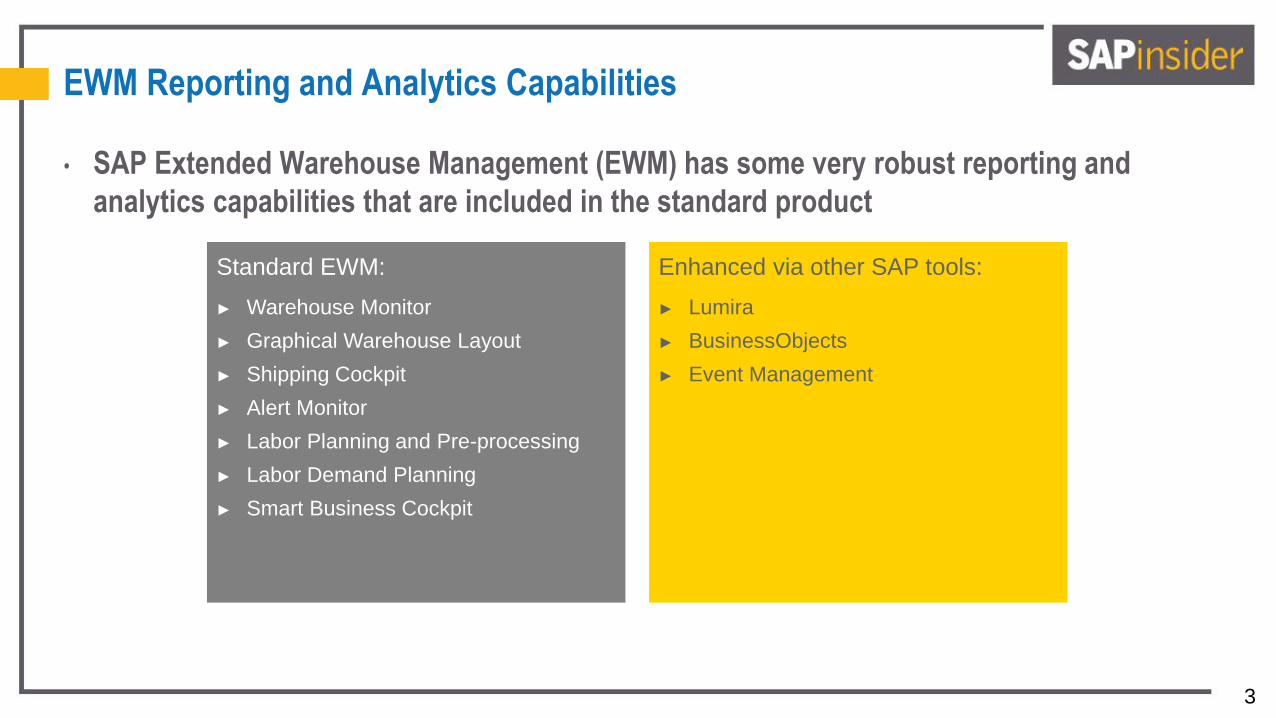
• SAP Extended Warehouse Management (EWM) has some very robust reporting and
analytics capabilities that are included in the standard product
Standard EWM:
► Warehouse Monitor
► Graphical Warehouse Layout
► Shipping Cockpit
► Alert Monitor
► Labor Planning and Pre-processing
► Labor Demand Planning
► Smart Business Cockpit
Enhanced via other SAP tools:
► Lumira
► BusinessObjects
► Event Management
4
Reporting and Analytics in EWM
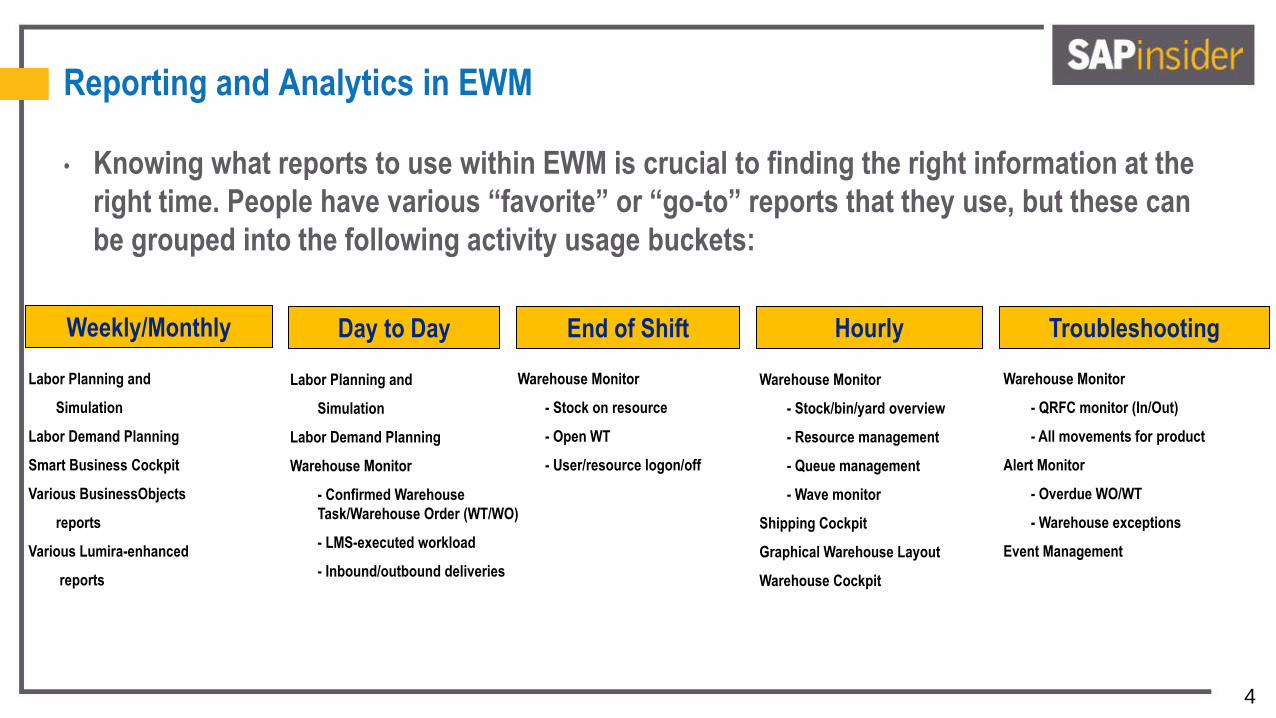
• Knowing what reports to use within EWM is crucial to finding the right information at the
right time. People have various “favorite” or “go-to” reports that they use, but these can
be grouped into the following activity usage buckets:
Labor Planning and
Simulation
Labor Demand Planning
Warehouse Monitor
- Confirmed Warehouse
Task/Warehouse Order (WT/WO)
- LMS-executed workload
- Inbound/outbound deliveries
Warehouse Monitor
- QRFC monitor (In/Out)
- All movements for product
Alert Monitor
- Overdue WO/WT
- Warehouse exceptions
Event Management
Warehouse Monitor
- Stock/bin/yard overview
- Resource management
- Queue management
- Wave monitor
Shipping Cockpit
Graphical Warehouse Layout
Warehouse Cockpit
Day to Day Hourly Troubleshooting
Warehouse Monitor
- Stock on resource
- Open WT
- User/resource logon/off
End of Shift Weekly/Monthly
Labor Planning and
Simulation
Labor Demand Planning
Smart Business Cockpit
Various BusinessObjects
reports
Various Lumira-enhanced
reports
5
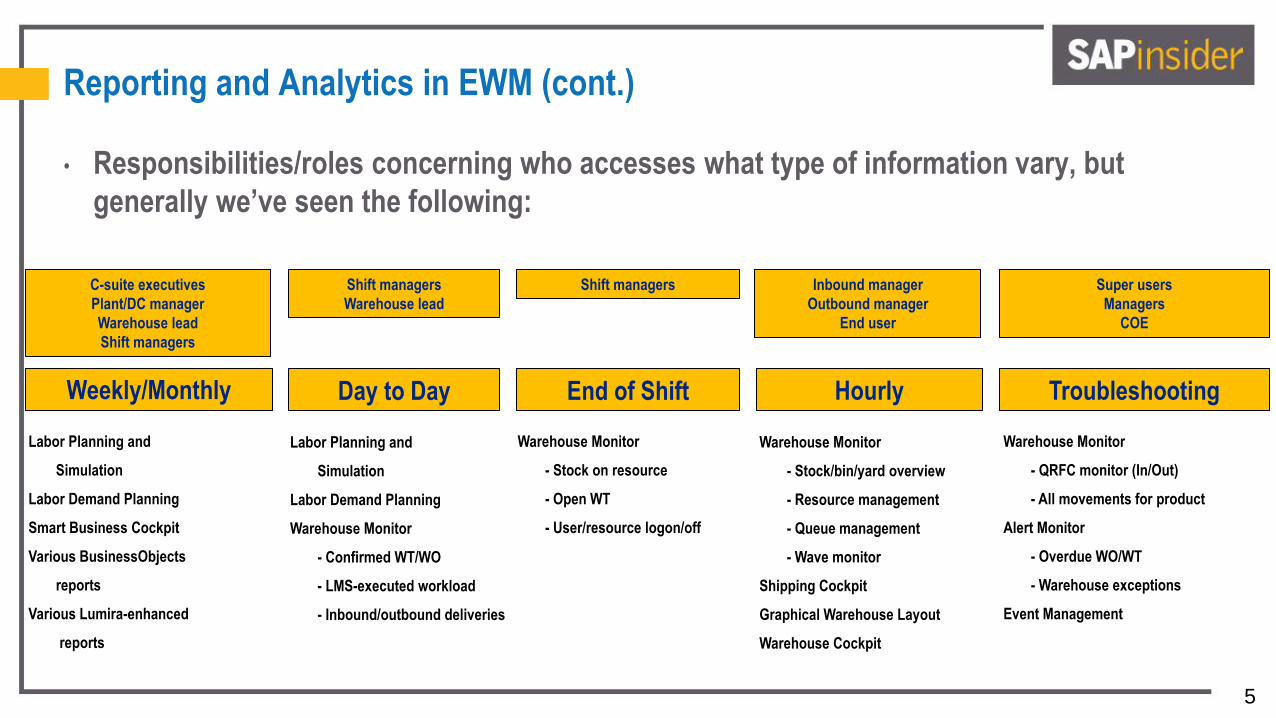
Reporting and Analytics in EWM (cont.)
• Responsibilities/roles concerning who accesses what type of information vary, but
generally we’ve seen the following:
Shift managers
Warehouse lead
Inbound manager
Outbound manager
End user
Shift managers Super users
Managers
COE
C-suite executives
Plant/DC manager
Warehouse lead
Shift managers
Labor Planning and
Simulation
Labor Demand Planning
Warehouse Monitor
- Confirmed WT/WO
- LMS-executed workload
- Inbound/outbound deliveries
Warehouse Monitor
- QRFC monitor (In/Out)
- All movements for product
Alert Monitor
- Overdue WO/WT
- Warehouse exceptions
Event Management
Warehouse Monitor
- Stock/bin/yard overview
- Resource management
- Queue management
- Wave monitor
Shipping Cockpit
Graphical Warehouse Layout
Warehouse Cockpit
Day to Day Hourly Troubleshooting
Warehouse Monitor
- Stock on resource
- Open WT
- User/resource logon/off
End of Shift Weekly/Monthly
Labor Planning and
Simulation
Labor Demand Planning
Smart Business Cockpit
Various BusinessObjects
reports
Various Lumira-enhanced
reports
6
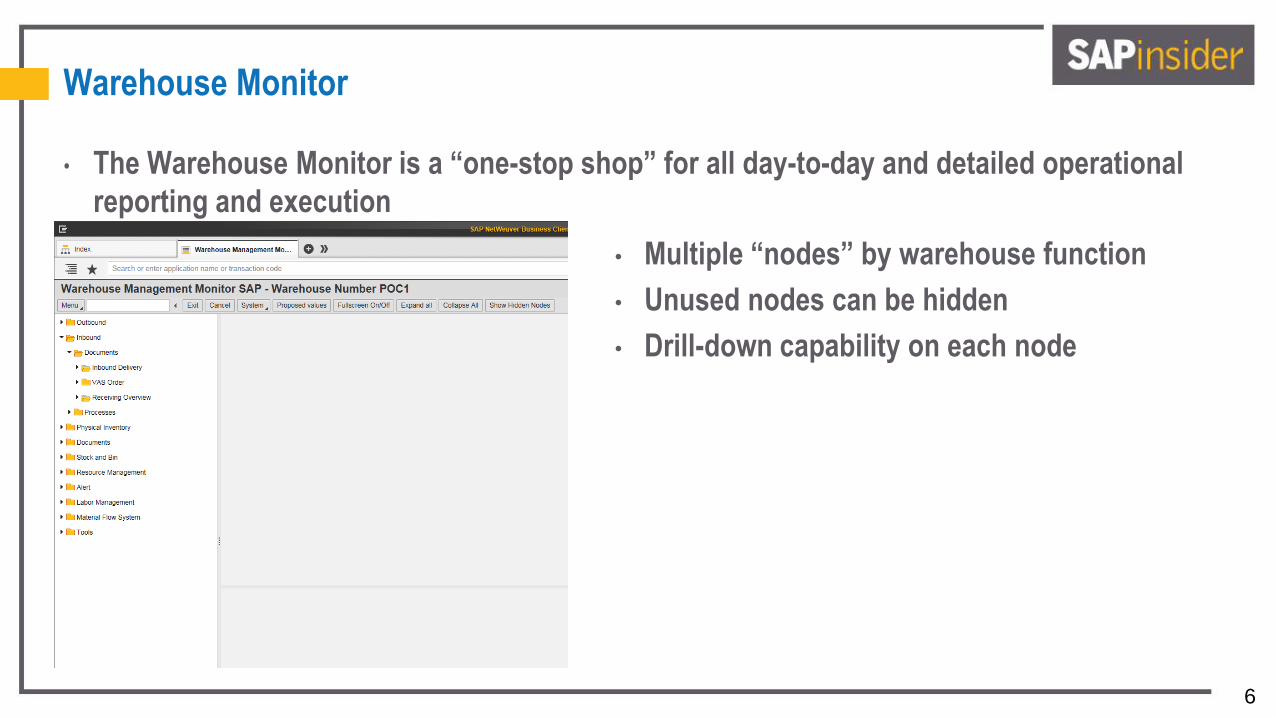
Warehouse Monitor
• The Warehouse Monitor is a “one-stop shop” for all day-to-day and detailed operational
reporting and execution
• Multiple “nodes” by warehouse function
• Unused nodes can be hidden
• Drill-down capability on each node
7
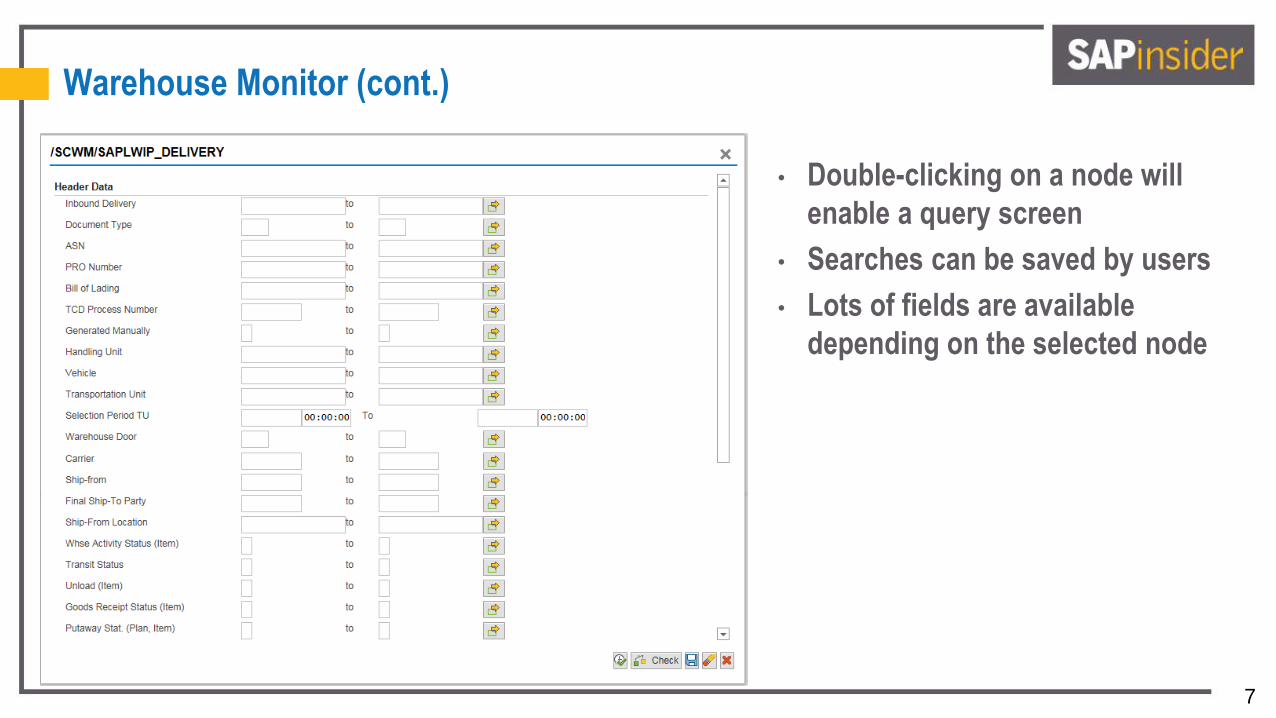
Warehouse Monitor (cont.)
• Double-clicking on a node will
enable a query screen
• Searches can be saved by users
• Lots of fields are available
depending on the selected node
8
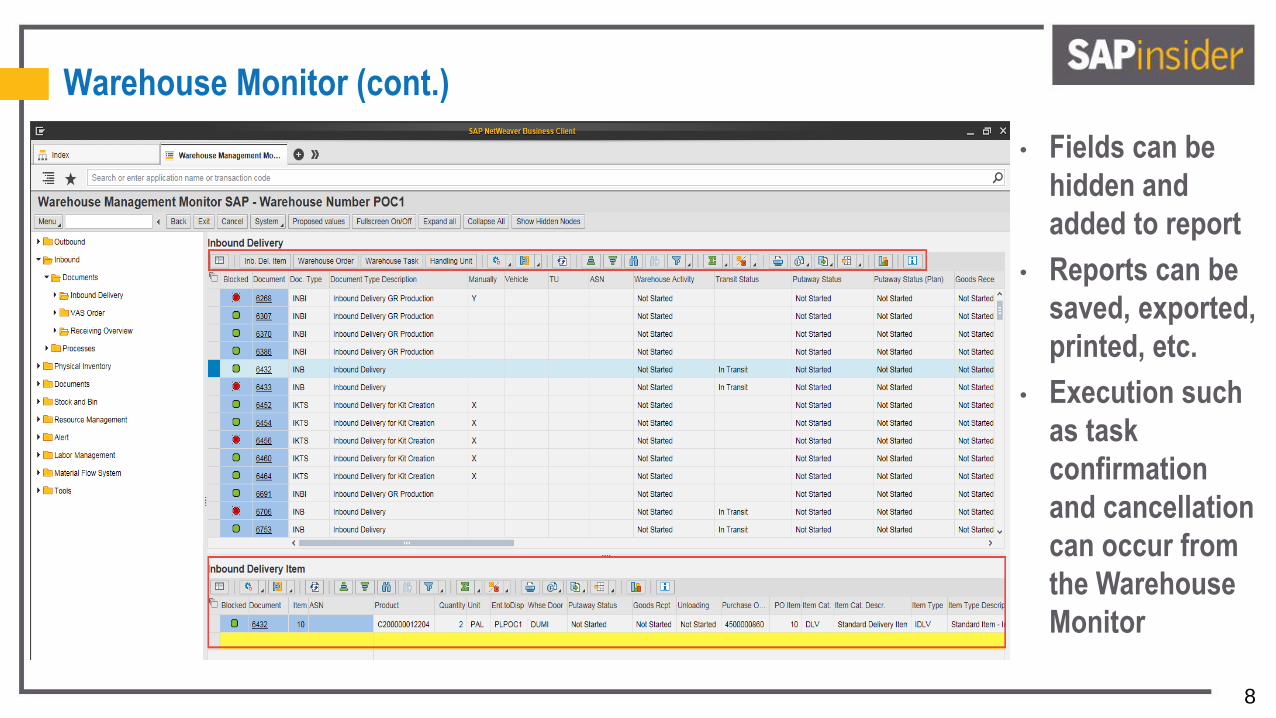
Warehouse Monitor (cont.)
• Fields can be
hidden and
added to report
• Reports can be
saved, exported,
printed, etc.
• Execution such
as task
confirmation
and cancellation
can occur from
the Warehouse
Monitor
9
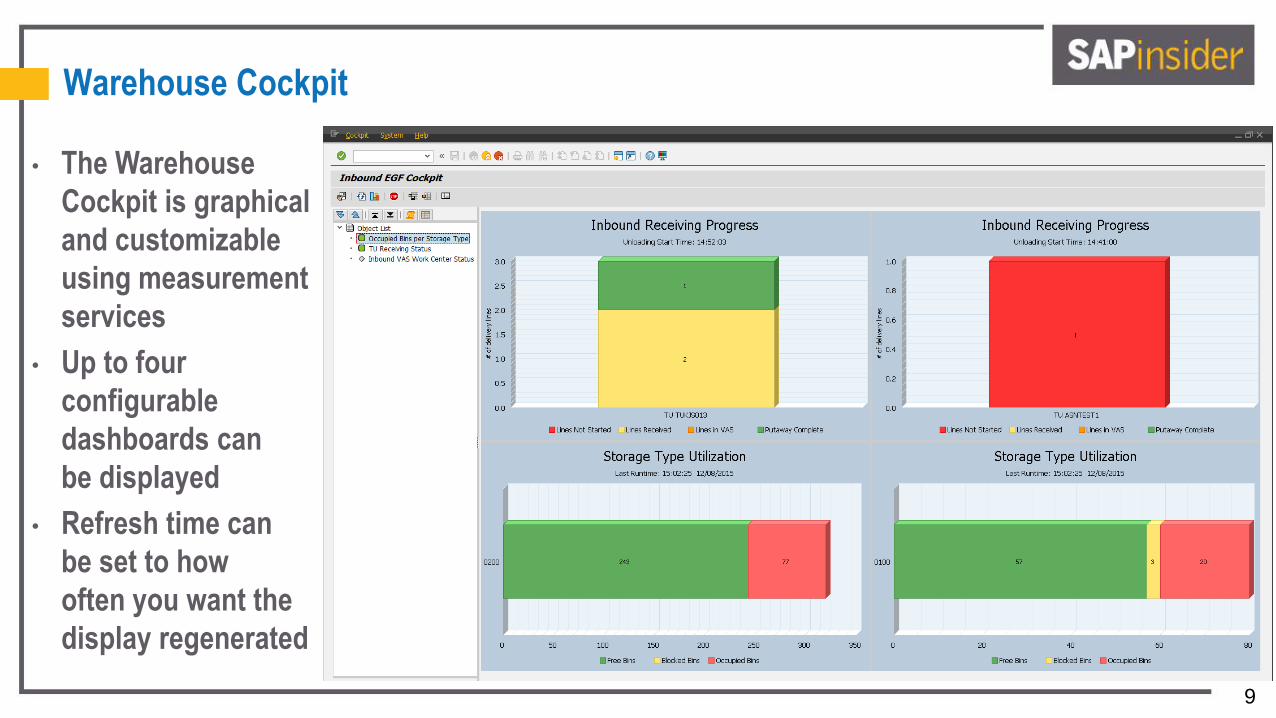
Warehouse Cockpit
• The Warehouse
Cockpit is graphical
and customizable
using measurement
services
• Up to four
configurable
dashboards can
be displayed
• Refresh time can
be set to how
often you want the
display regenerated
10
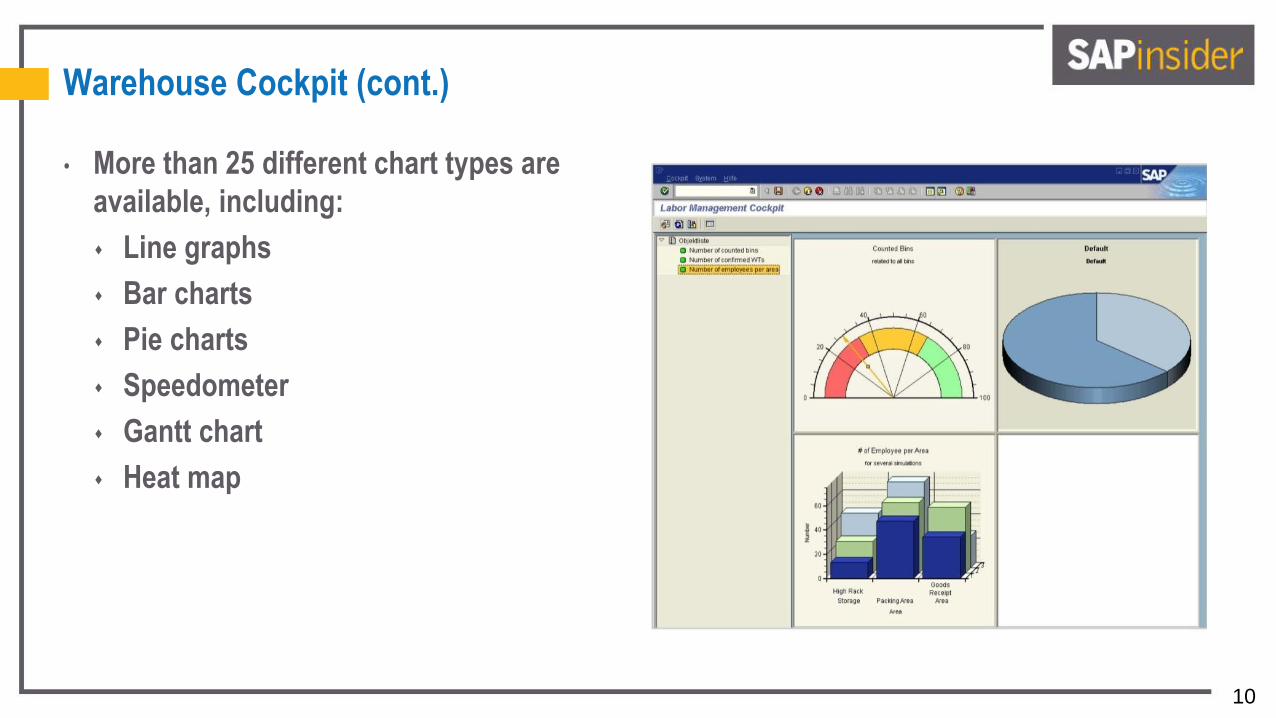
Warehouse Cockpit (cont.)
• More than 25 different chart types are
available, including:
Line graphs
Bar charts
Pie charts
Speedometer
Gantt chart
Heat map
11
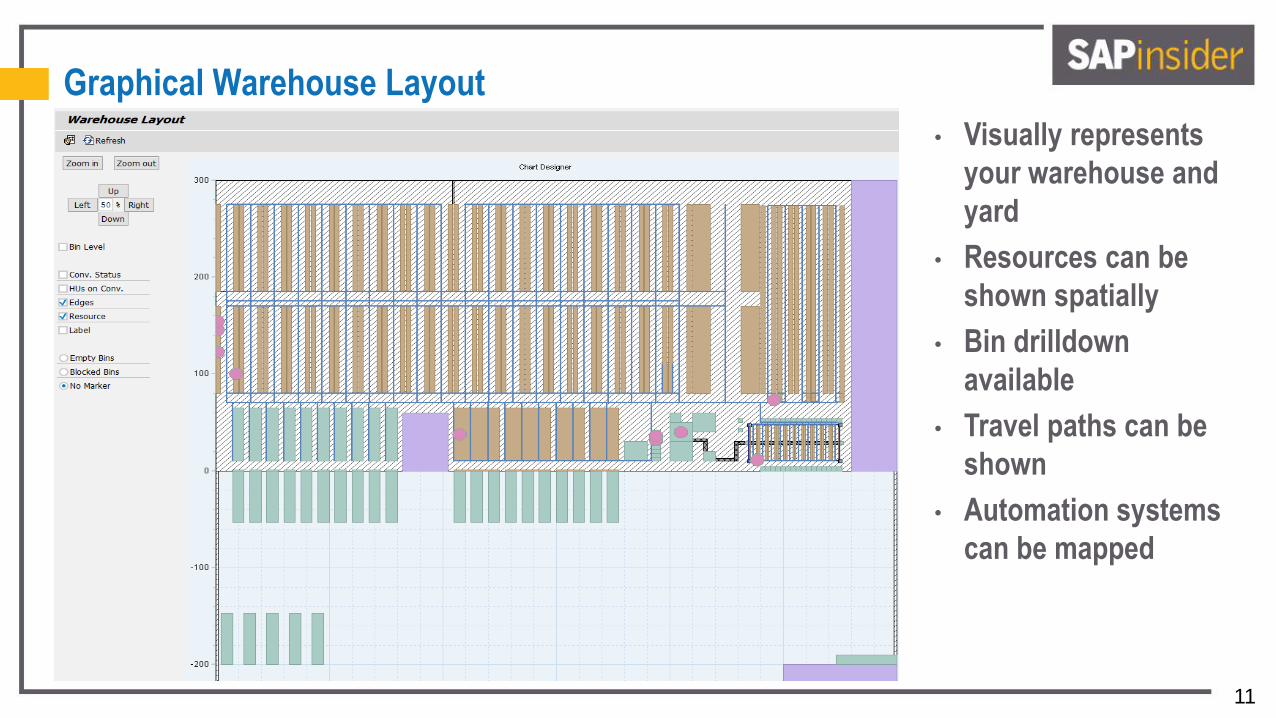
Graphical Warehouse Layout
• Visually represents
your warehouse and
yard
• Resources can be
shown spatially
• Bin drilldown
available
• Travel paths can be
shown
• Automation systems
can be mapped
12
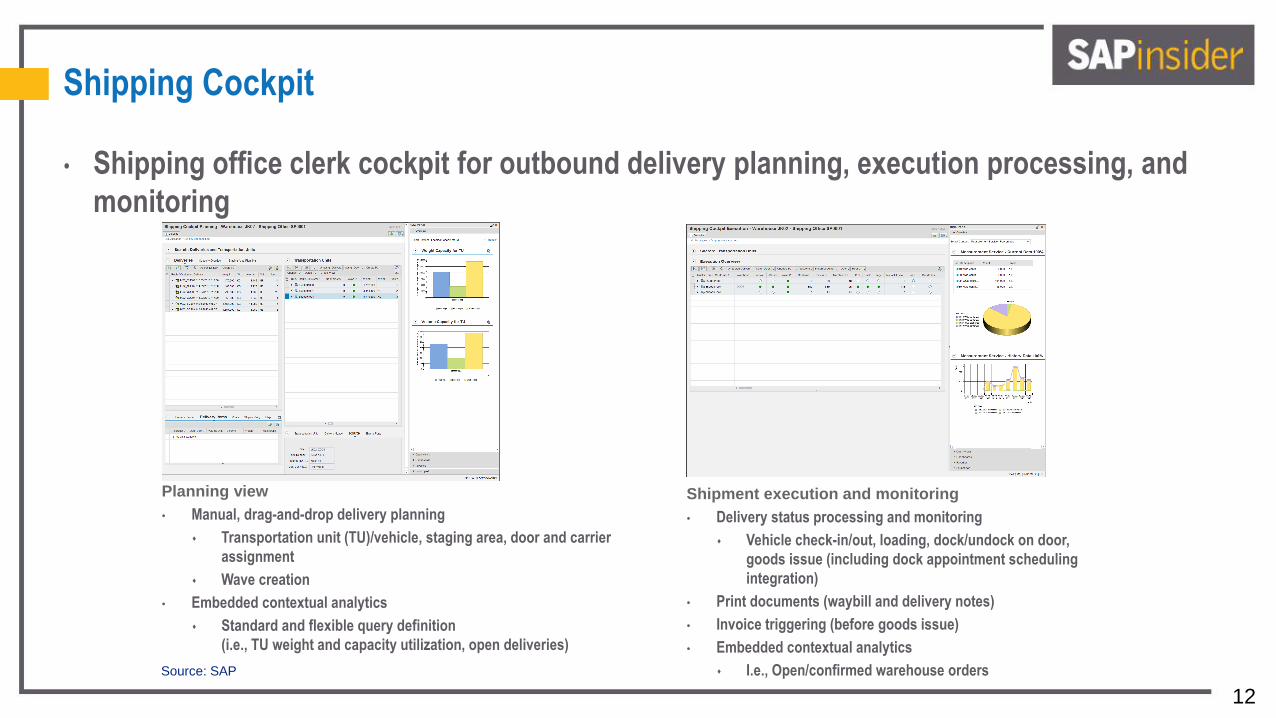
Shipping Cockpit
• Shipping office clerk cockpit for outbound delivery planning, execution processing, and
monitoring
Planning view
• Manual, drag-and-drop delivery planning
Transportation unit (TU)/vehicle, staging area, door and carrier
assignment
Wave creation
• Embedded contextual analytics
Standard and flexible query definition
(i.e., TU weight and capacity utilization, open deliveries)
Shipment execution and monitoring
• Delivery status processing and monitoring
Vehicle check-in/out, loading, dock/undock on door,
goods issue (including dock appointment scheduling
integration)
• Print documents (waybill and delivery notes)
• Invoice triggering (before goods issue)
• Embedded contextual analytics
I.e., Open/confirmed warehouse orders Source: SAP
13
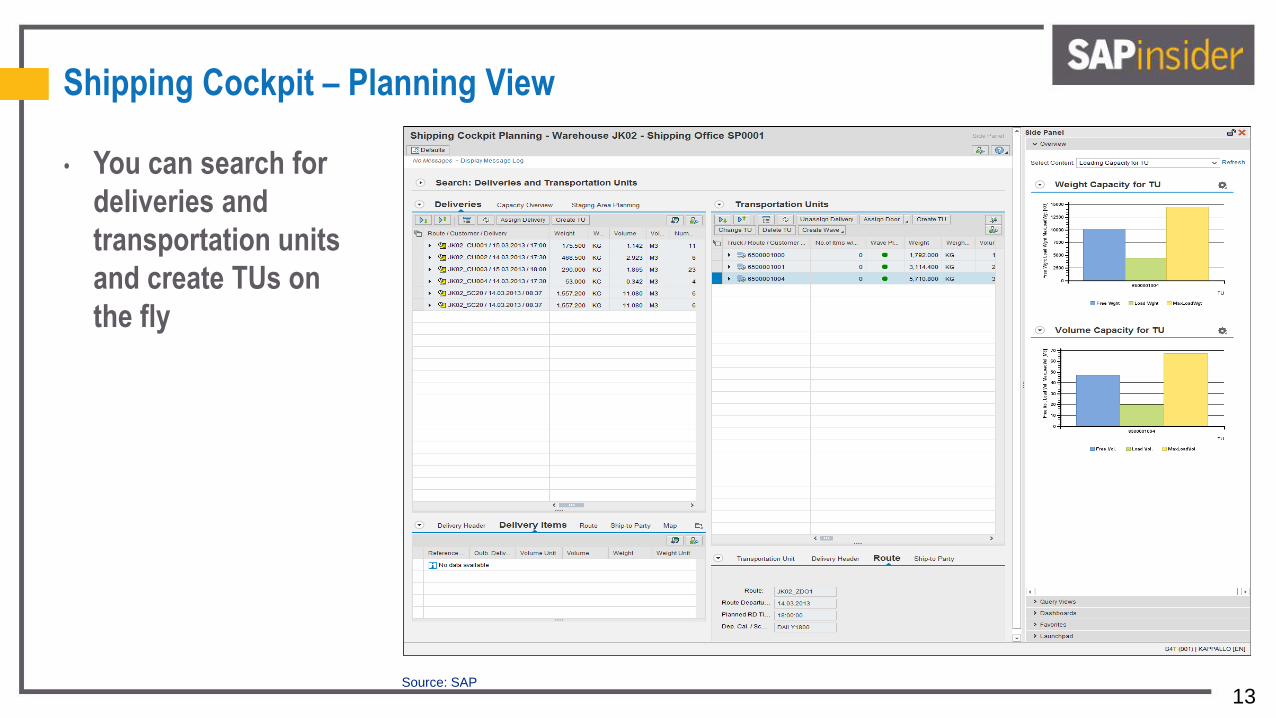
Shipping Cockpit – Planning View
• You can search for
deliveries and
transportation units
and create TUs on
the fly
Source: SAP
14
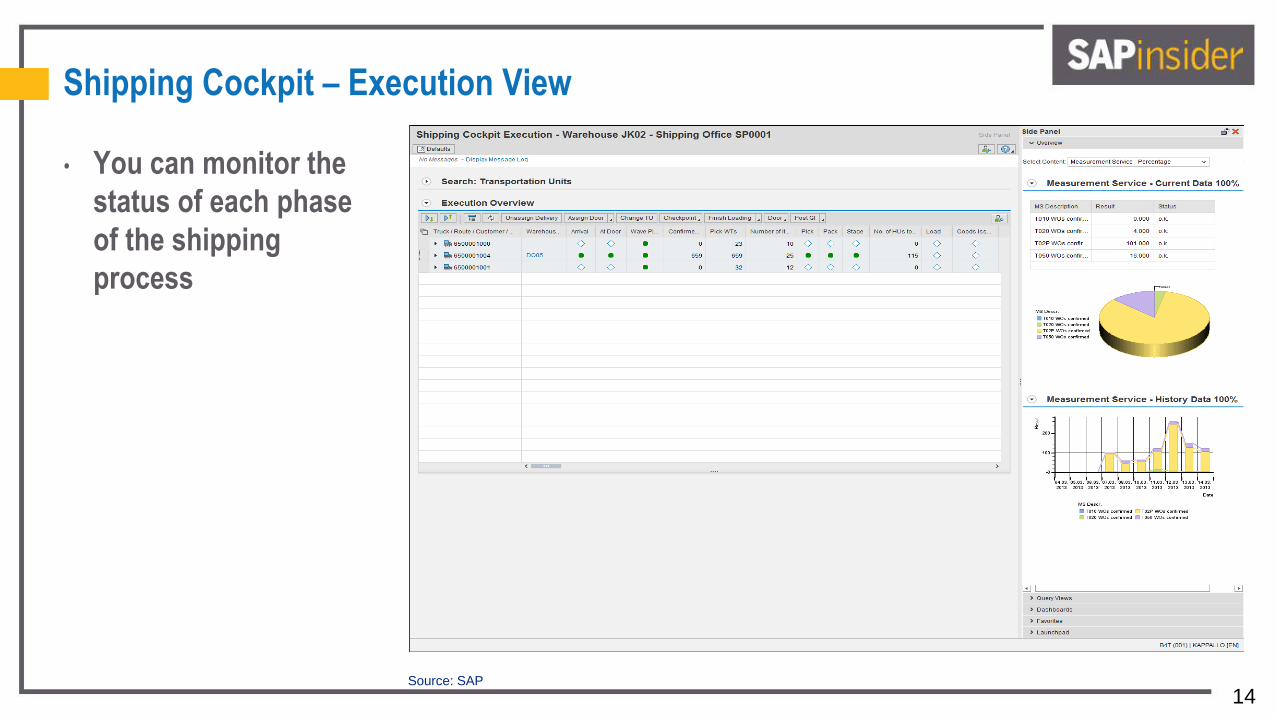
Shipping Cockpit – Execution View
• You can monitor the
status of each phase
of the shipping
process
Source: SAP
15
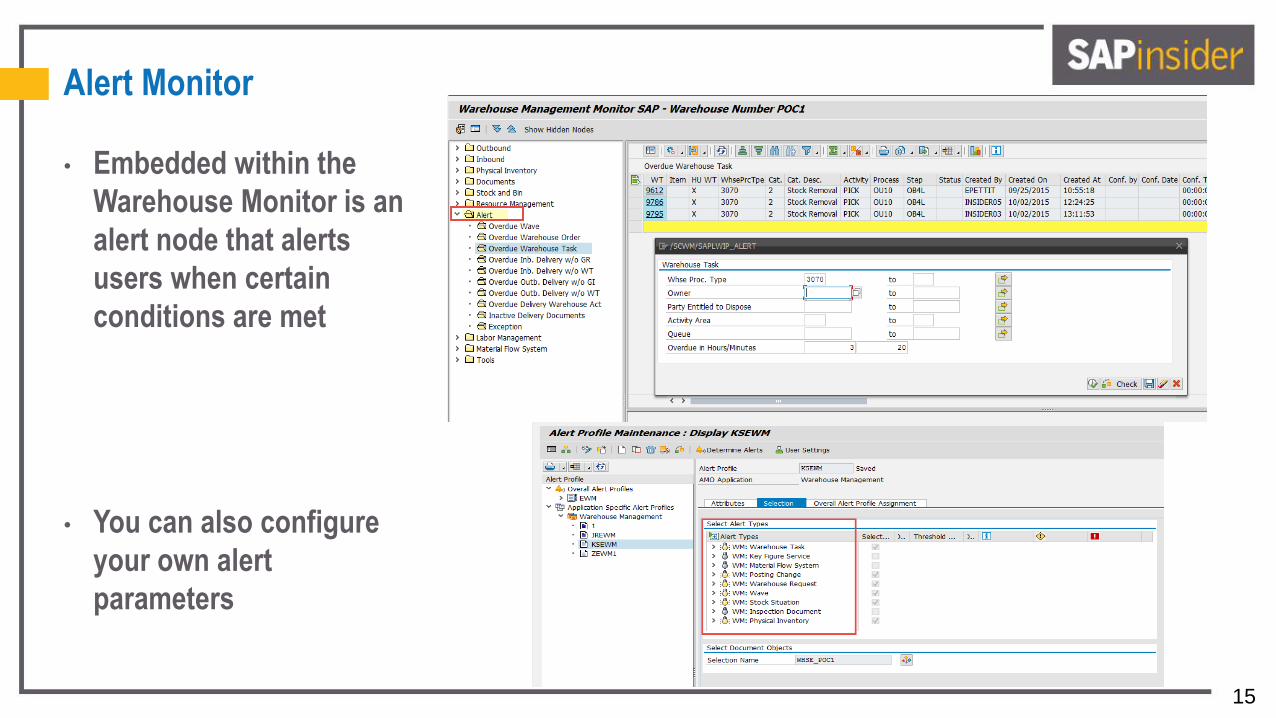
Alert Monitor
• Embedded within the
Warehouse Monitor is an
alert node that alerts
users when certain
conditions are met
• You can also configure
your own alert
parameters
16
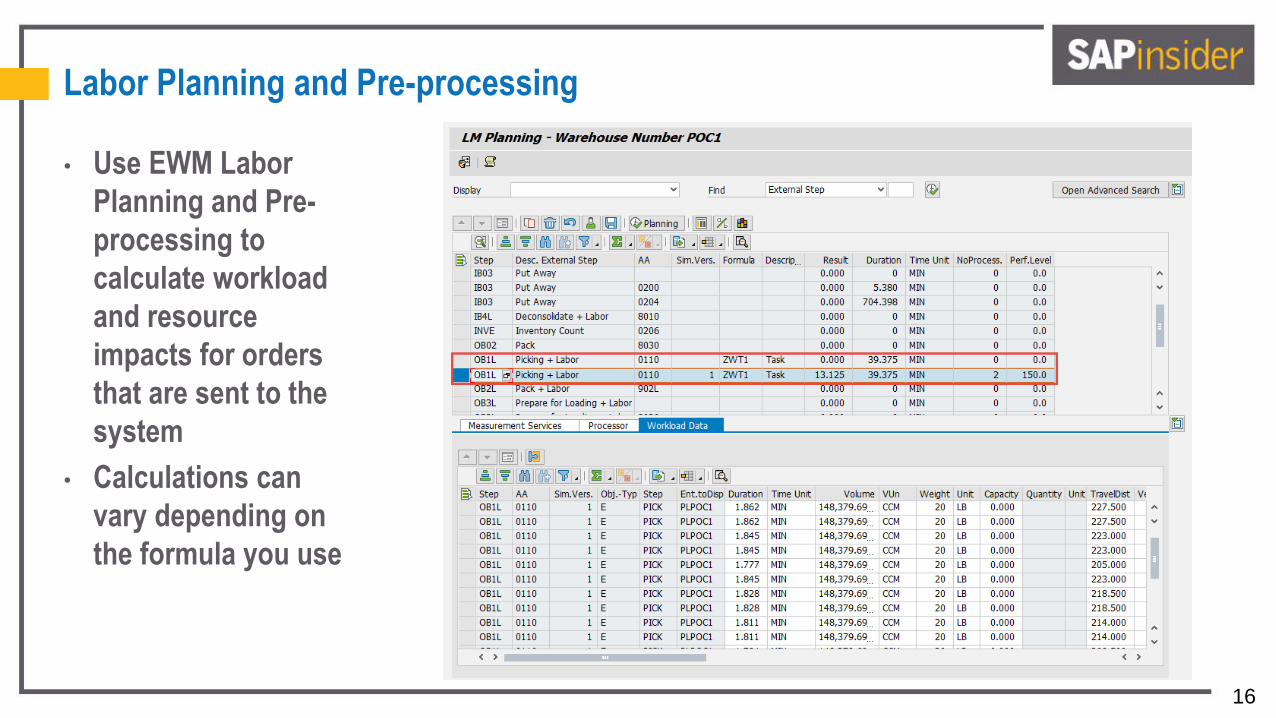
Labor Planning and Pre-processing
• Use EWM Labor
Planning and Pre-
processing to
calculate workload
and resource
impacts for orders
that are sent to the
system
• Calculations can
vary depending on
the formula you use
17
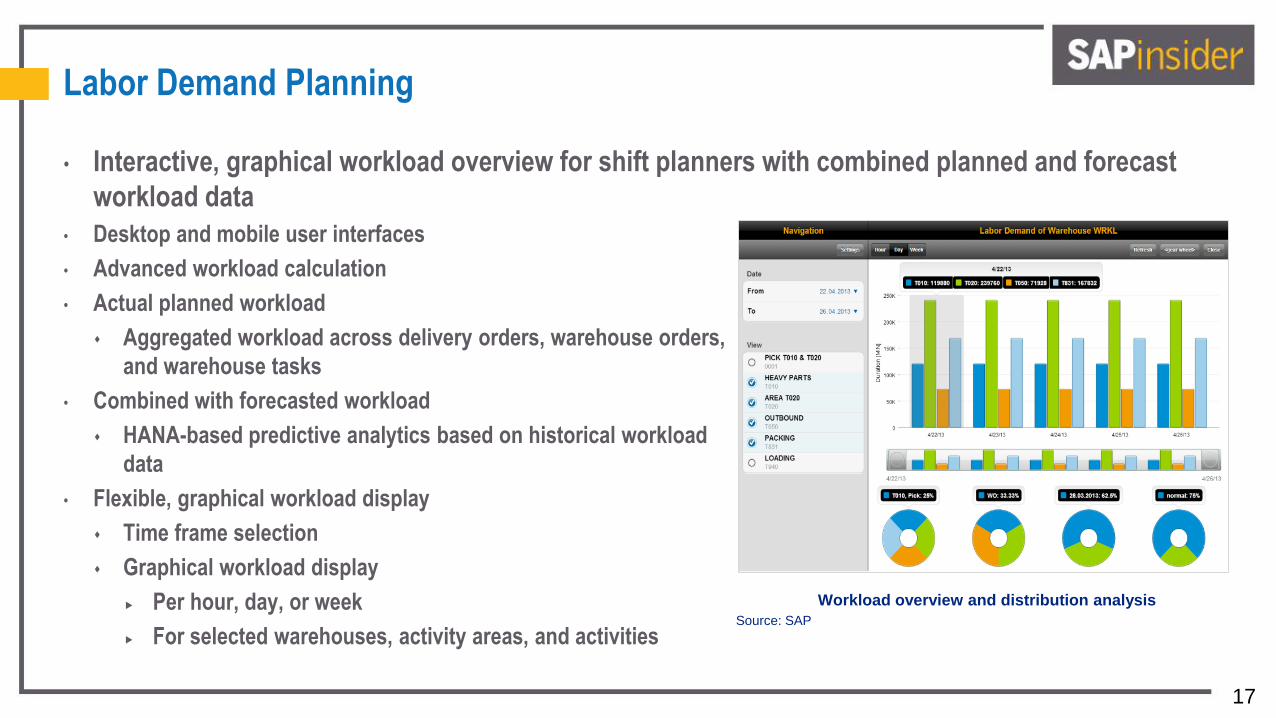
Labor Demand Planning
• Interactive, graphical workload overview for shift planners with combined planned and forecast
workload data
• Desktop and mobile user interfaces
• Advanced workload calculation
• Actual planned workload
Aggregated workload across delivery orders, warehouse orders,
and warehouse tasks
• Combined with forecasted workload
HANA-based predictive analytics based on historical workload
data
• Flexible, graphical workload display
Time frame selection
Graphical workload display
Per hour, day, or week
For selected warehouses, activity areas, and activities
Workload overview and distribution analysis
Source: SAP
18
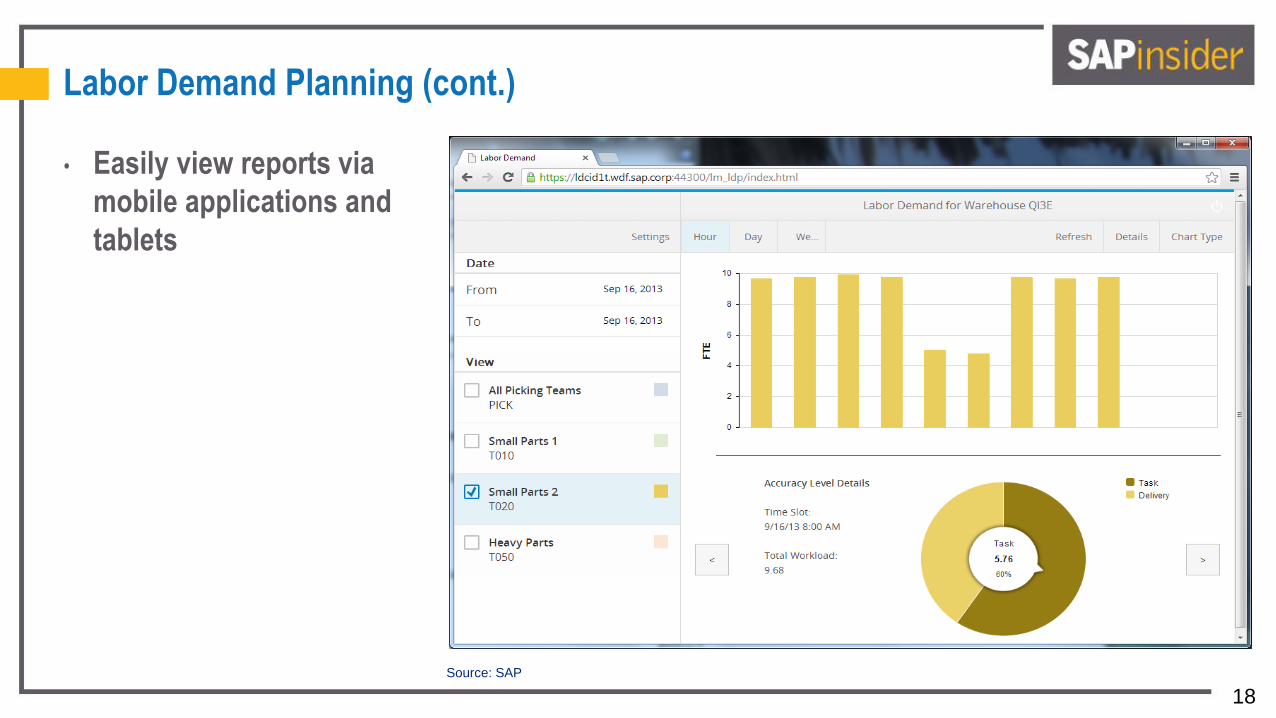
Source: SAP
Labor Demand Planning (cont.)
• Easily view reports via
mobile applications and
tablets
19
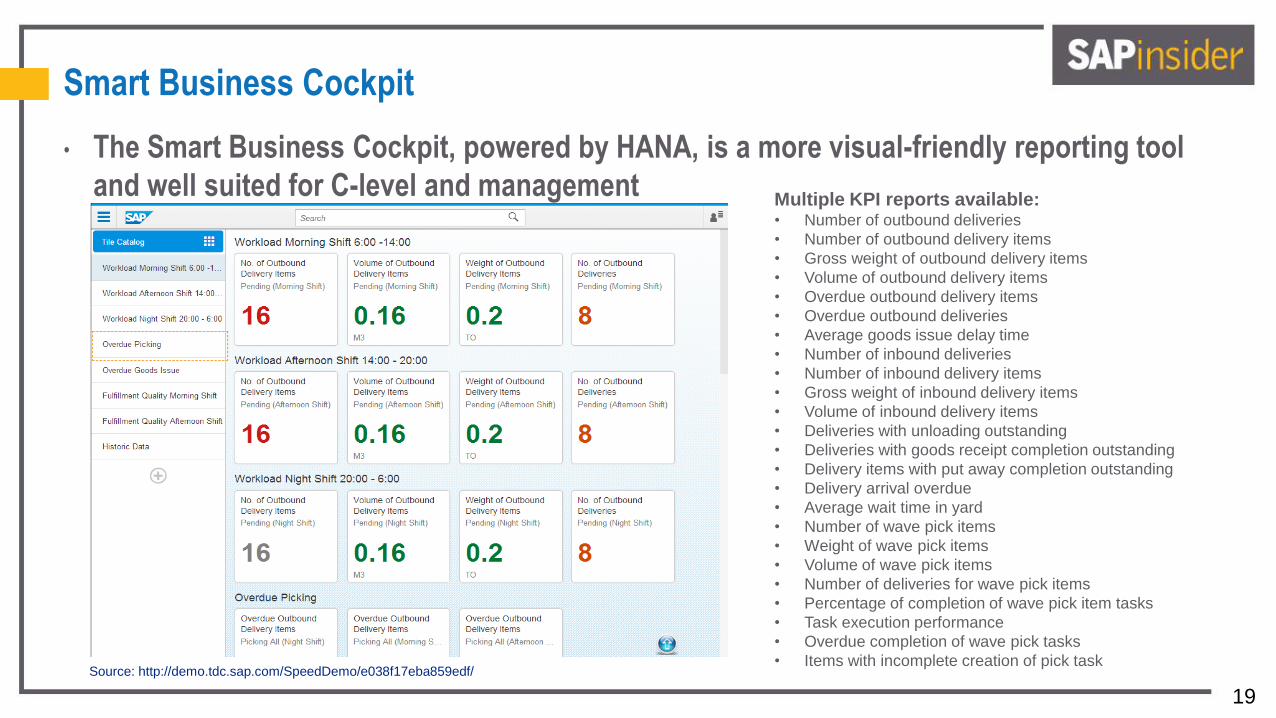
Smart Business Cockpit
• The Smart Business Cockpit, powered by HANA, is a more visual-friendly reporting tool
and well suited for C-level and management
Source: http://demo.tdc.sap.com/SpeedDemo/e038f17eba859edf/
Multiple KPI reports available: • Number of outbound deliveries
• Number of outbound delivery items
• Gross weight of outbound delivery items
• Volume of outbound delivery items
• Overdue outbound delivery items
• Overdue outbound deliveries
• Average goods issue delay time
• Number of inbound deliveries
• Number of inbound delivery items
• Gross weight of inbound delivery items
• Volume of inbound delivery items
• Deliveries with unloading outstanding
• Deliveries with goods receipt completion outstanding
• Delivery items with put away completion outstanding
• Delivery arrival overdue
• Average wait time in yard
• Number of wave pick items
• Weight of wave pick items
• Volume of wave pick items
• Number of deliveries for wave pick items
• Percentage of completion of wave pick item tasks
• Task execution performance
• Overdue completion of wave pick tasks
• Items with incomplete creation of pick task
20
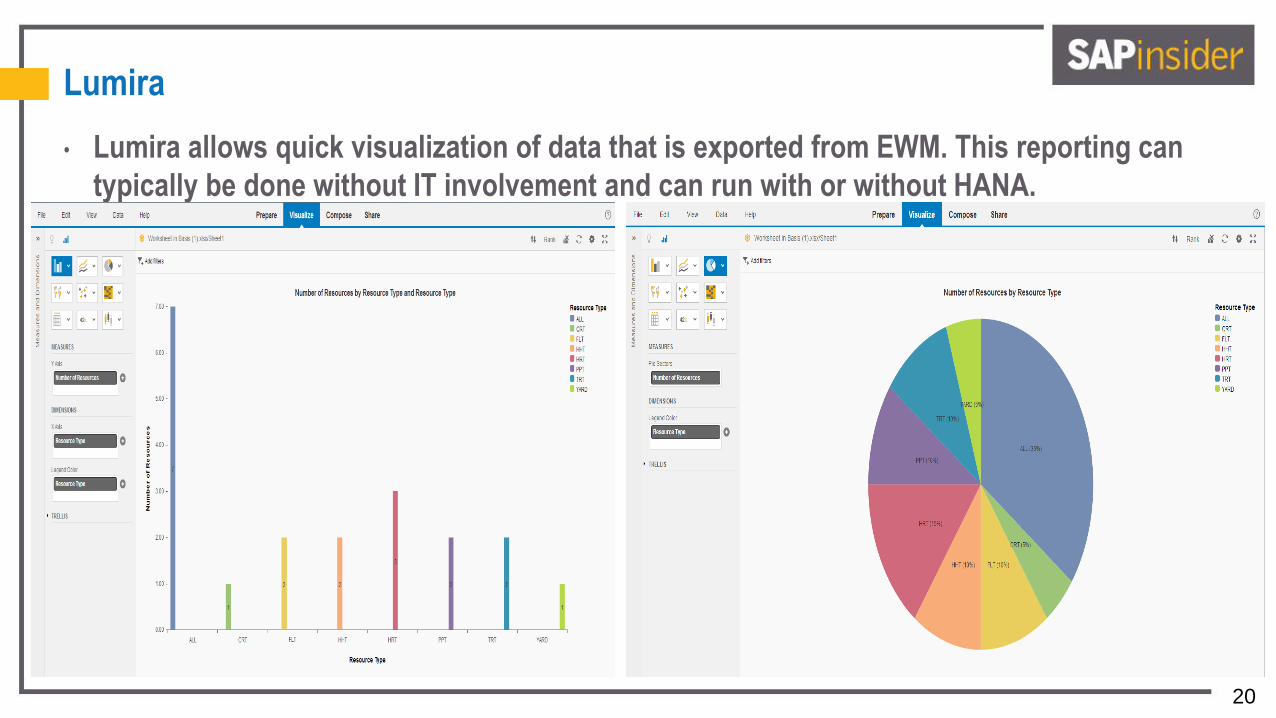
Lumira
• Lumira allows quick visualization of data that is exported from EWM. This reporting can
typically be done without IT involvement and can run with or without HANA.
21
What We’ll Cover
• Reporting and analytics in EWM
• Interpreting the results and taking action
• Leading practices and trends
• Wrap-up
22
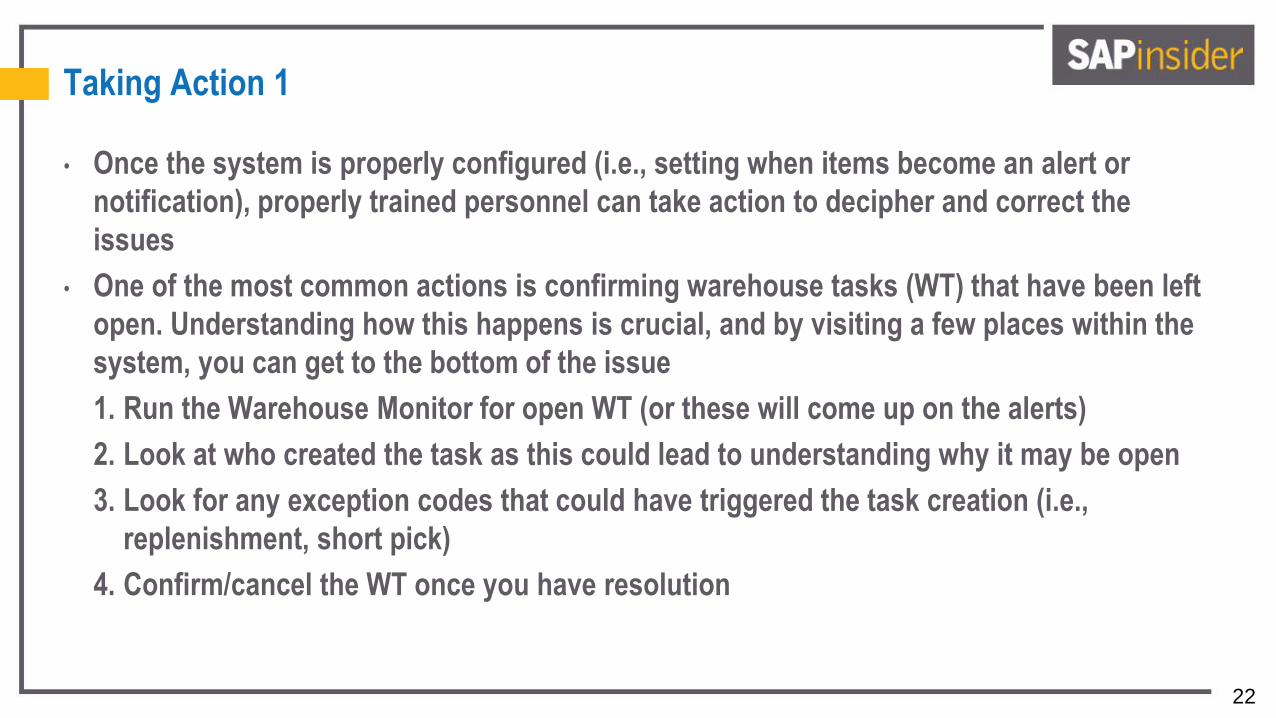
Taking Action 1
• Once the system is properly configured (i.e., setting when items become an alert or
notification), properly trained personnel can take action to decipher and correct the
issues
• One of the most common actions is confirming warehouse tasks (WT) that have been left
open. Understanding how this happens is crucial, and by visiting a few places within the
system, you can get to the bottom of the issue
1. Run the Warehouse Monitor for open WT (or these will come up on the alerts)
2. Look at who created the task as this could lead to understanding why it may be open
3. Look for any exception codes that could have triggered the task creation (i.e.,
replenishment, short pick)
4. Confirm/cancel the WT once you have resolution
23
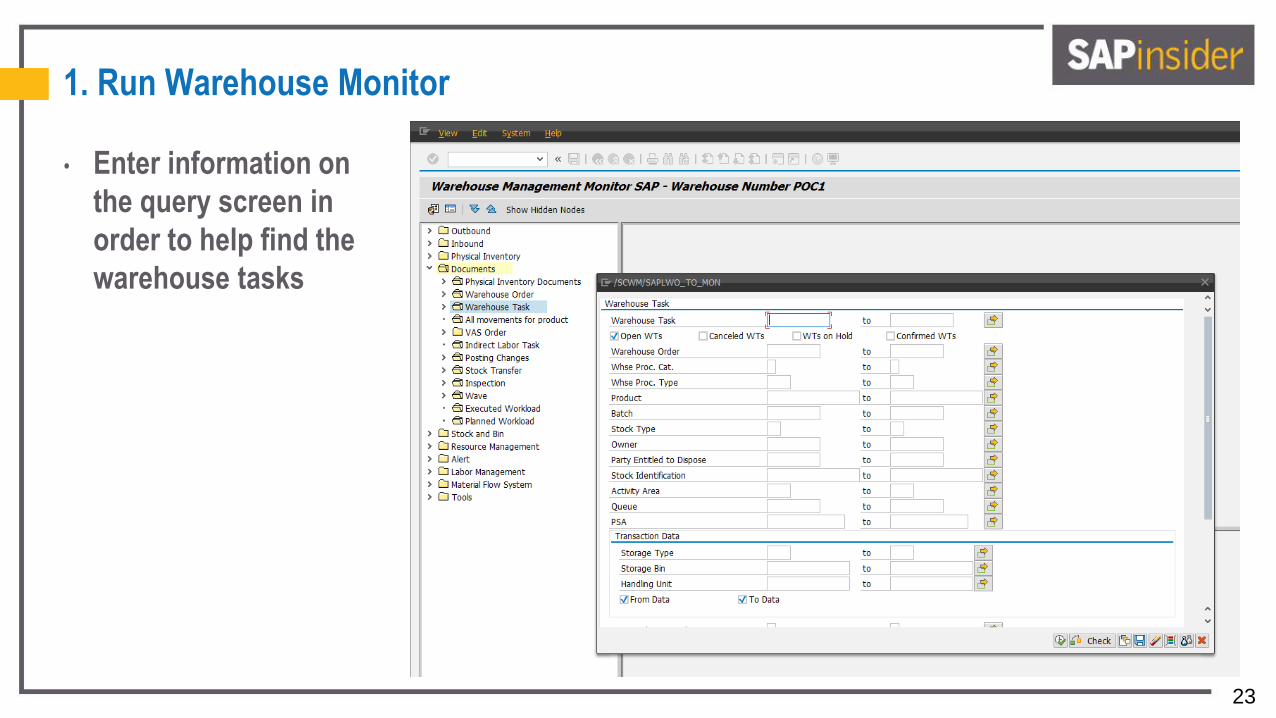
1. Run Warehouse Monitor
• Enter information on
the query screen in
order to help find the
warehouse tasks
24
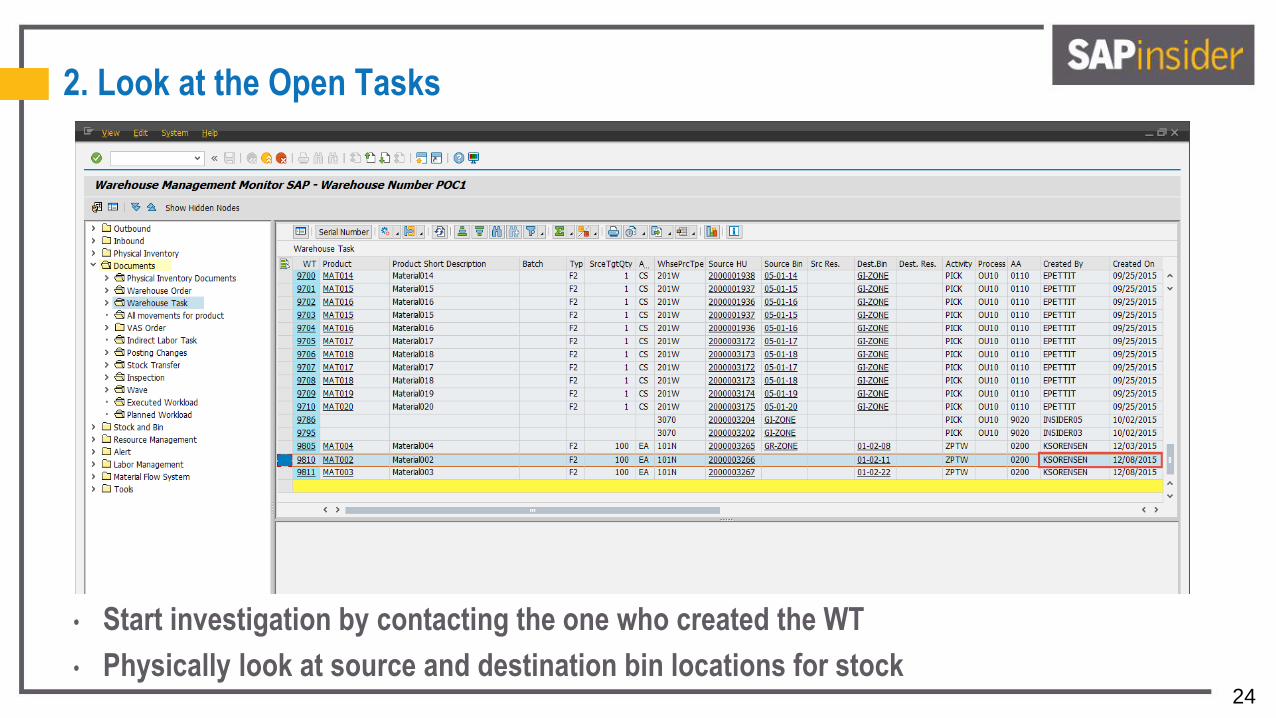
2. Look at the Open Tasks
• Start investigation by contacting the one who created the WT
• Physically look at source and destination bin locations for stock
25
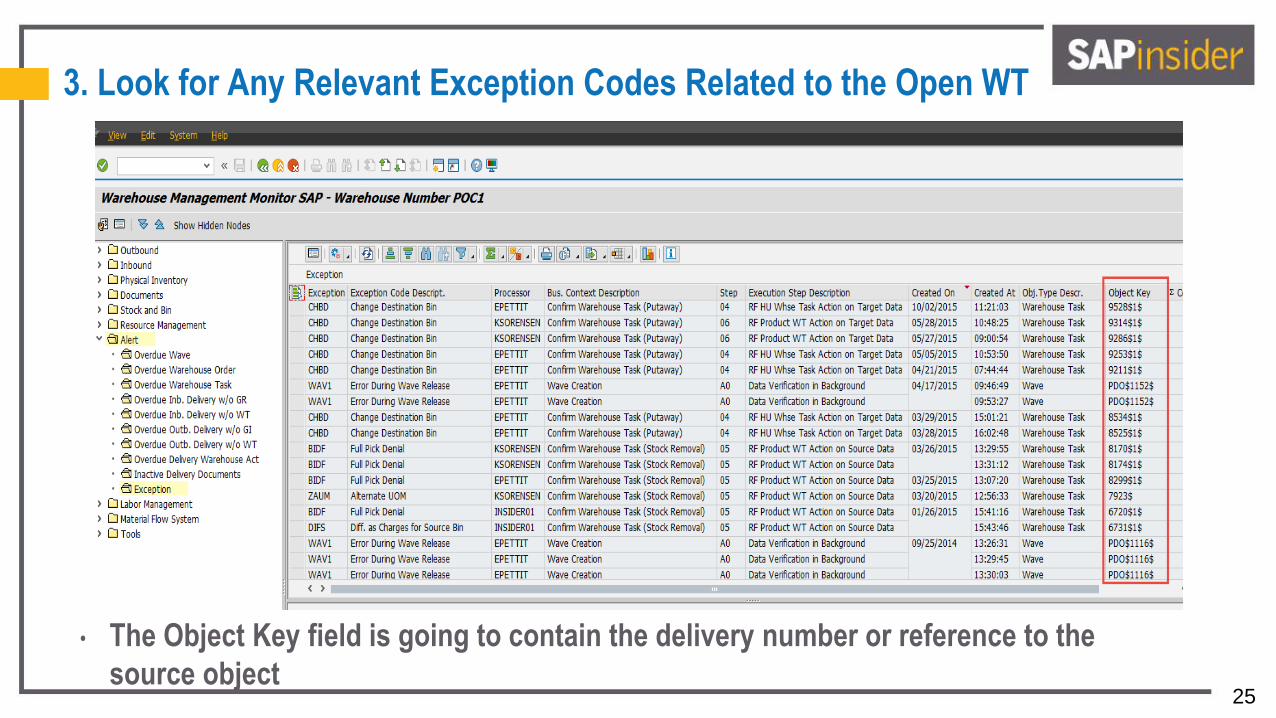
3. Look for Any Relevant Exception Codes Related to the Open WT
• The Object Key field is going to contain the delivery number or reference to the
source object
26
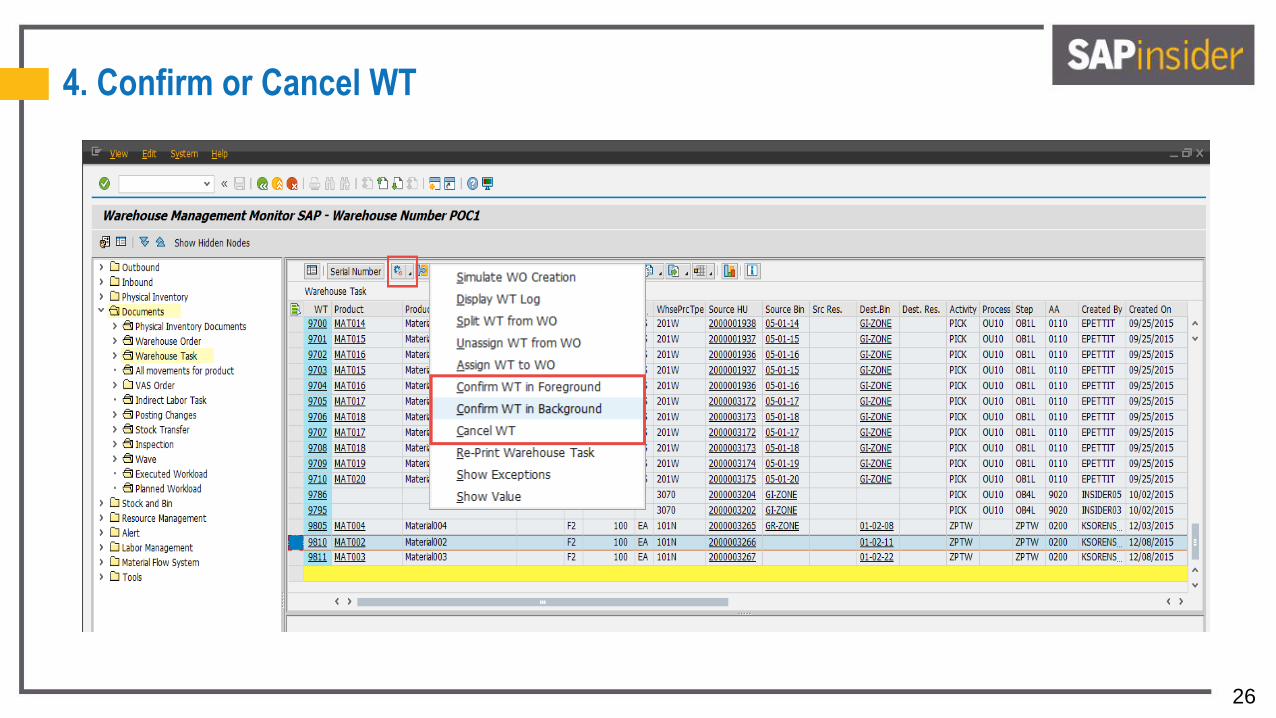
4. Confirm or Cancel WT
27
Interpreting the Results 1
• Many times, you will find that a WT that has been left open could be the result of one of
the following situations:
End user was logged onto a resource that could not process the WT so they just left it
End user was logged into the Radio Frequency (RF) device (queue driven), left for the
day and forgot to send the work back to the “pool”
An exception triggered another task that no other users were logged into to execute or
complete
28
Taking Action 2
• Too many tasks have been released into an area or work queue than can be processed
efficiently by the assigned users/resources. This may happen if a hot or urgent order has
dropped from ERP or if staffing levels were not adjusted properly (via physical staff
attendance or via labor planning).
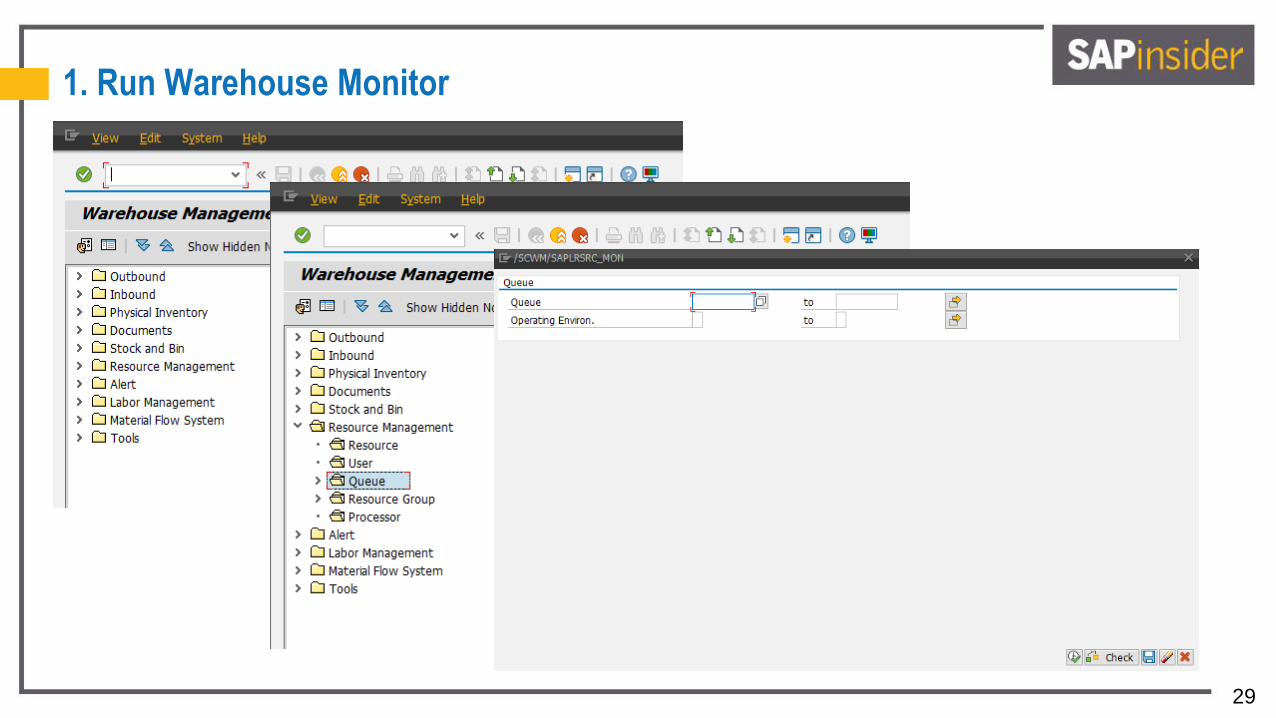
1. Run the warehouse monitor and look at resource management node by queue
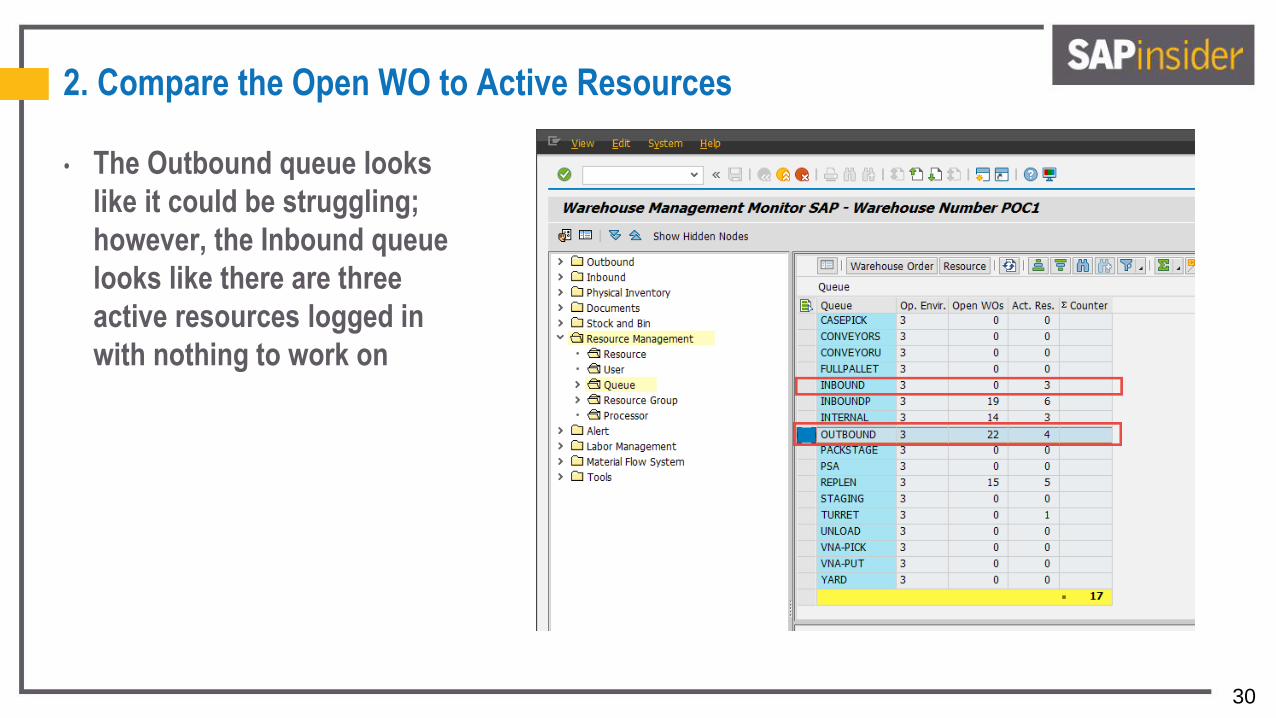
2. Compare columns (Open WOs to Act Res) – this will show how many open warehouse
orders are in the queue compared to how many active (logged on) resources you have
actively working in that queue
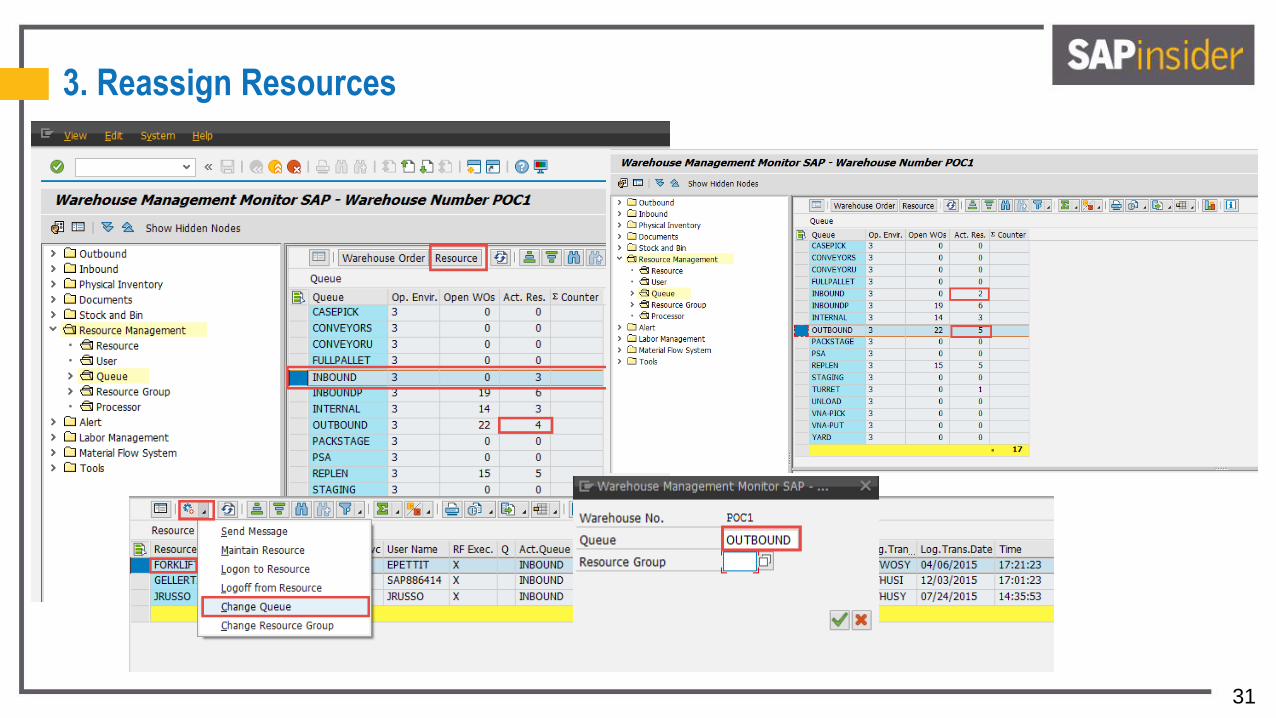
3. Based on what you feel is a good mix within the queue, reassign resources to where
they are needed most
• Once the resource completes the task they are currently working on, they will
automatically be reassigned to the new queue
29
1. Run Warehouse Monitor
30
2. Compare the Open WO to Active Resources
• The Outbound queue looks
like it could be struggling;
however, the Inbound queue
looks like there are three
active resources logged in
with nothing to work on
31
3. Reassign Resources
32
Interpreting the Results 2
• Many times, you will find that there may be too many tasks released into an area or work
queue, which could be because of the following situations:
Labor Planning, Pre-processing or Labor Demand Planning was not taken into account
The size limits of your warehouse orders are too large for any single resource to
complete alone. Look at changing how large a warehouse order can get via
configuration.
Operators are not actively looking for new work or management is not actively looking
at what the operators are working on. Consider full system-guided RF queue
management or more closely monitor resource workload.
A large wave was released that created an overwhelming number of warehouse orders.
Look at the wave template, cutoff times and size limits on your waves.
33
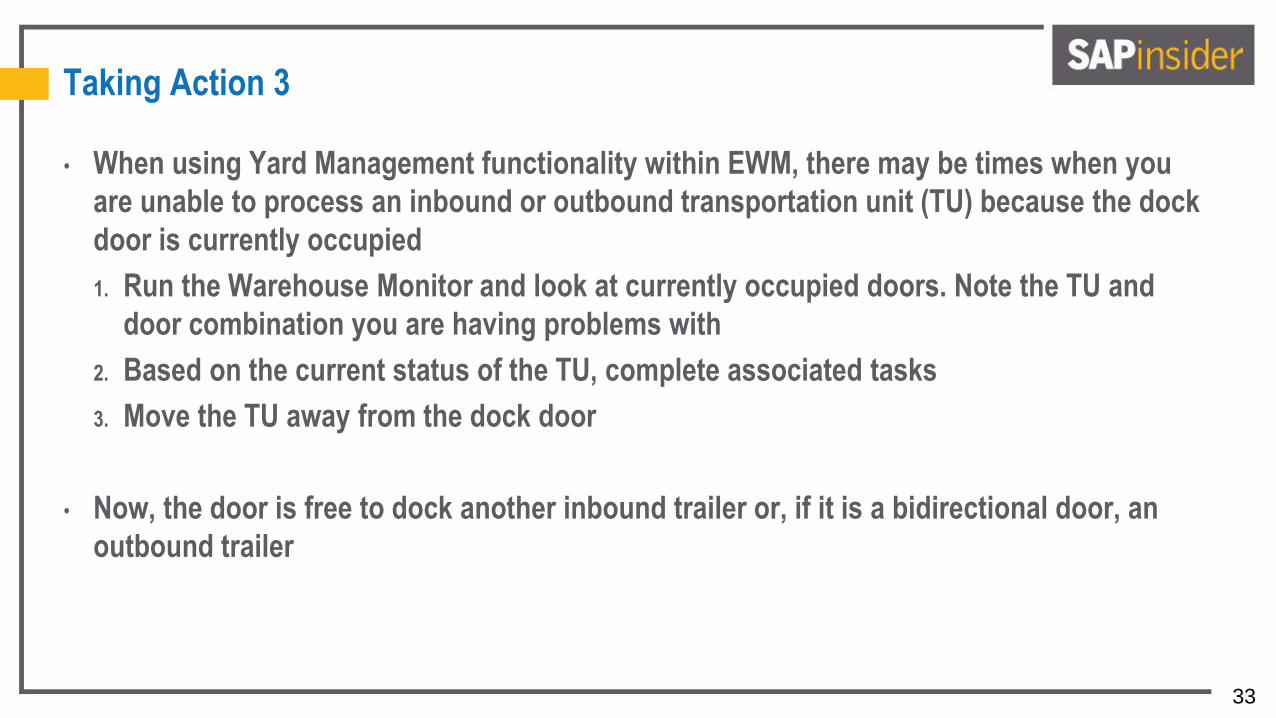
Taking Action 3
• When using Yard Management functionality within EWM, there may be times when you
are unable to process an inbound or outbound transportation unit (TU) because the dock
door is currently occupied
1. Run the Warehouse Monitor and look at currently occupied doors. Note the TU and
door combination you are having problems with
2. Based on the current status of the TU, complete associated tasks
3. Move the TU away from the dock door
• Now, the door is free to dock another inbound trailer or, if it is a bidirectional door, an
outbound trailer
34
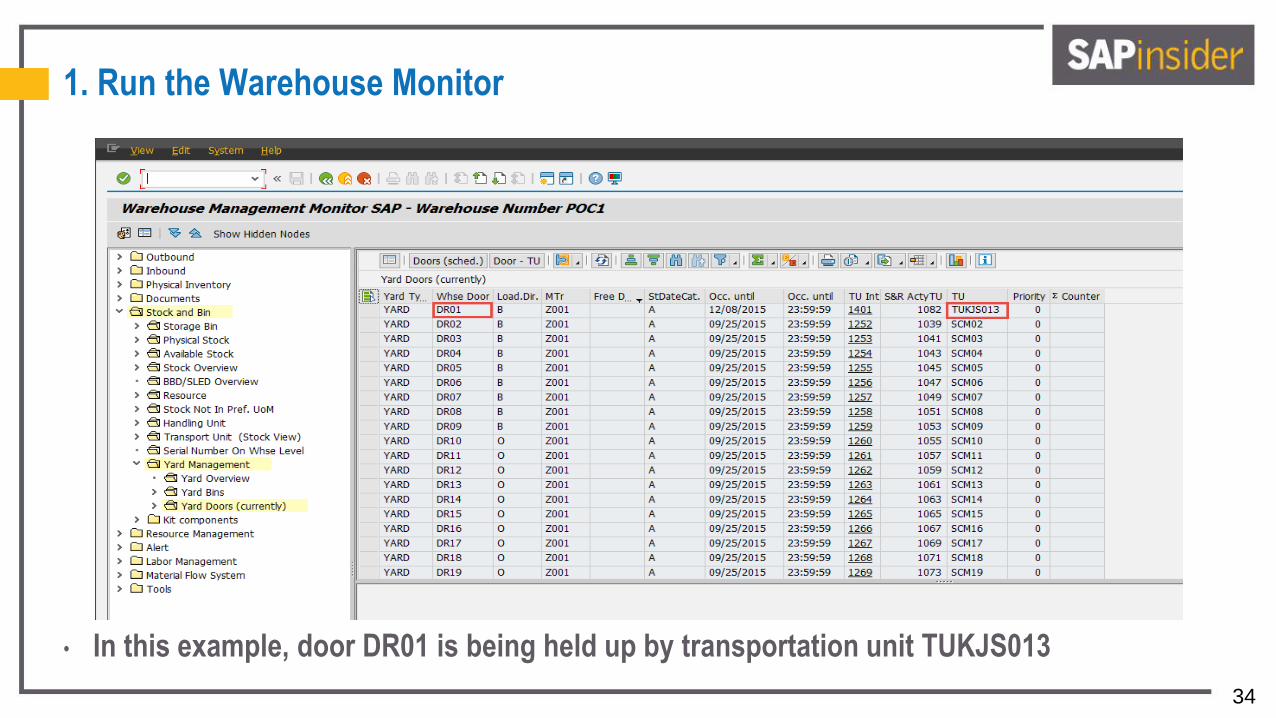
1. Run the Warehouse Monitor
• In this example, door DR01 is being held up by transportation unit TUKJS013
35
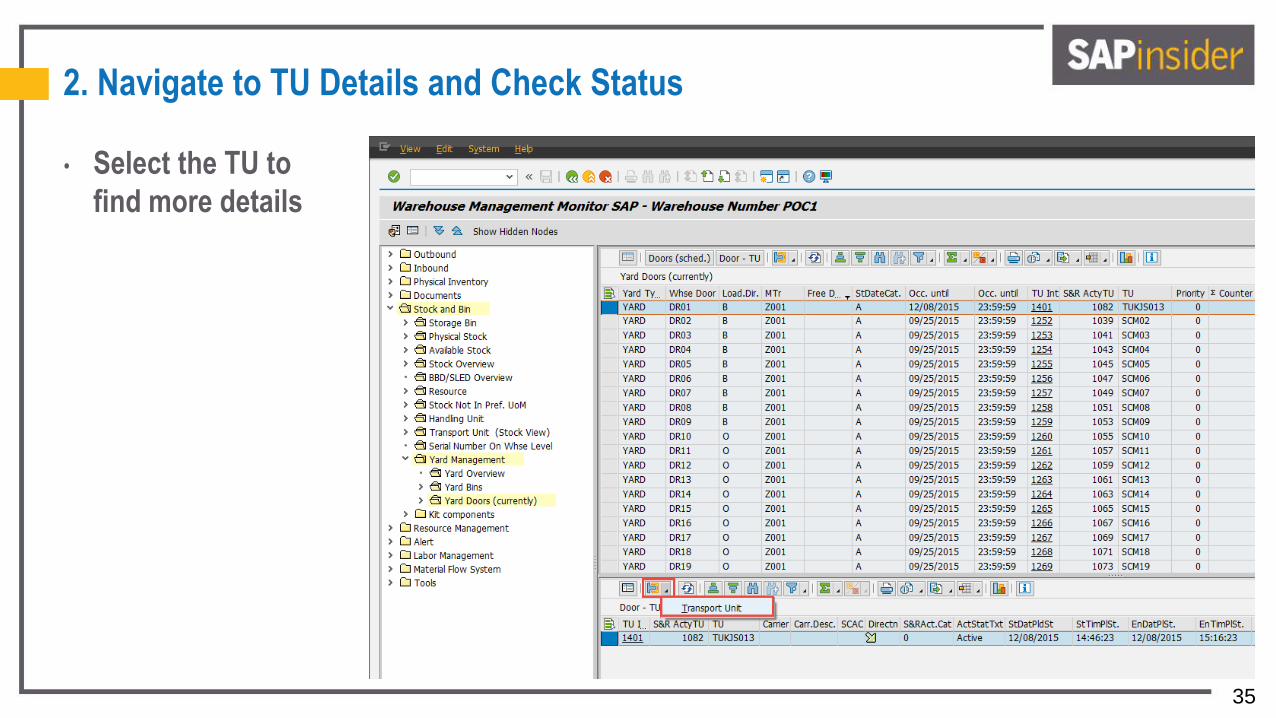
2. Navigate to TU Details and Check Status
• Select the TU to
find more details
36
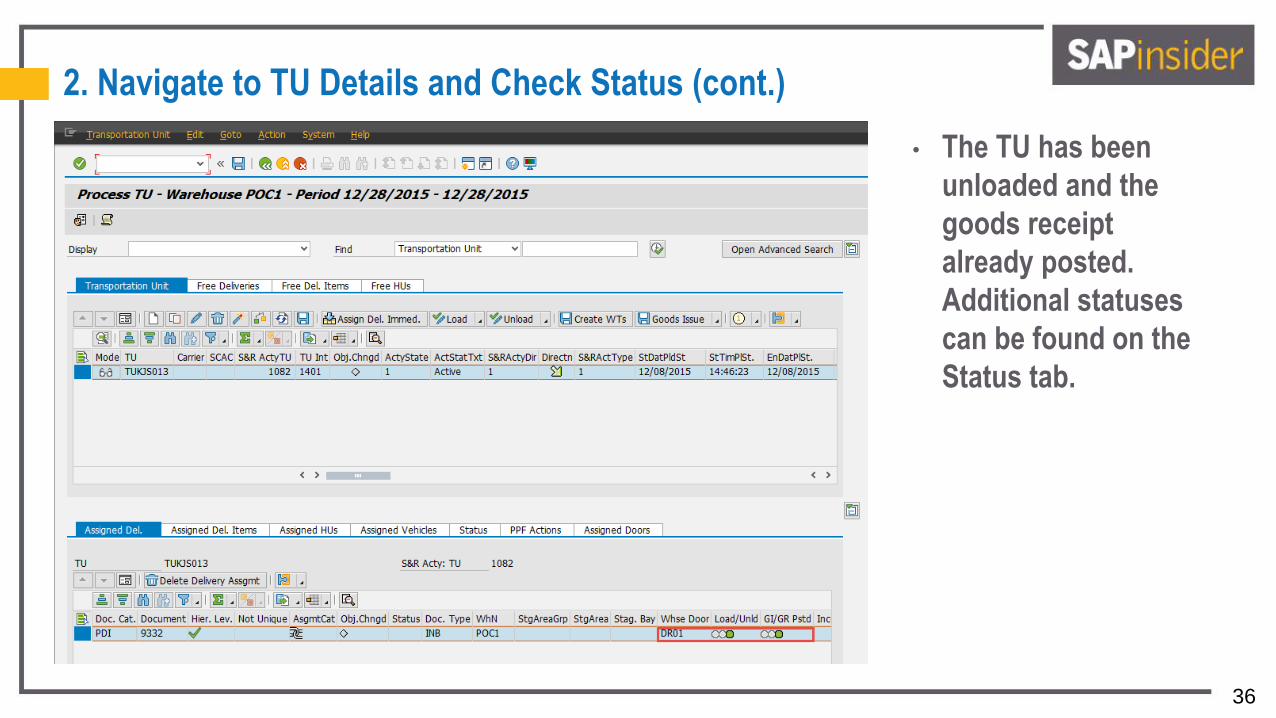
2. Navigate to TU Details and Check Status (cont.)
• The TU has been
unloaded and the
goods receipt
already posted.
Additional statuses
can be found on the
Status tab.
37
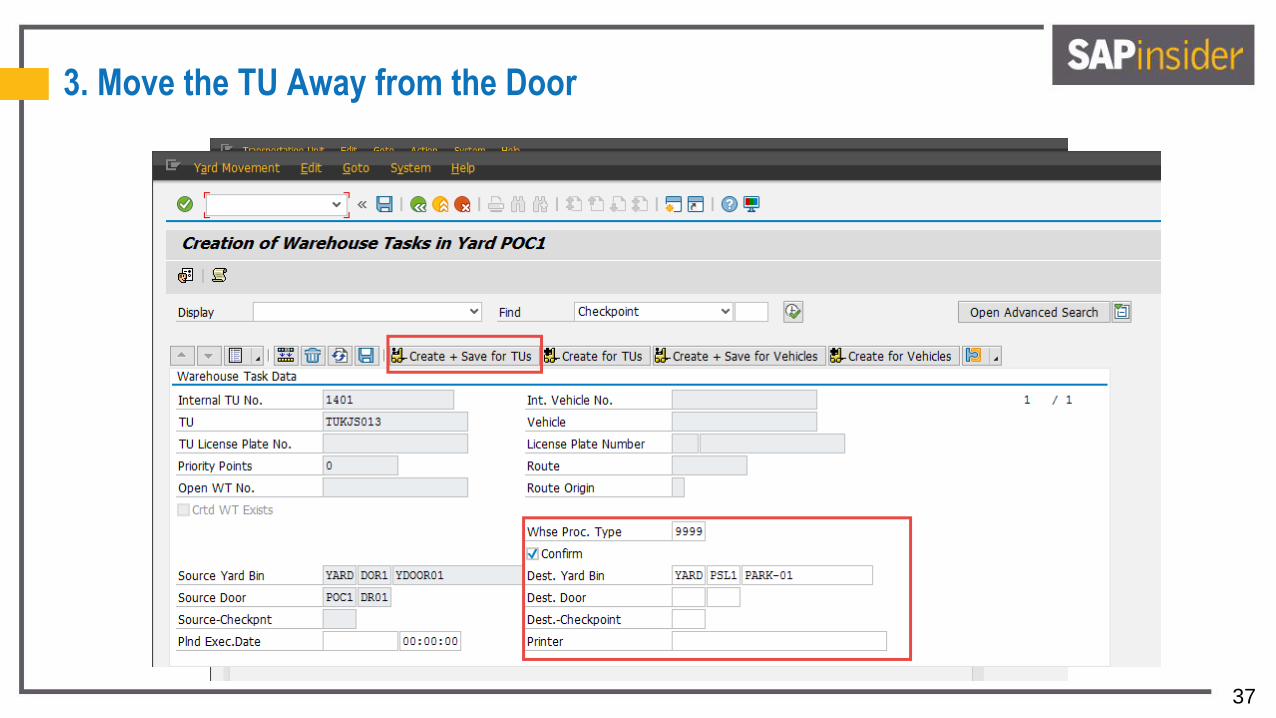
3. Move the TU Away from the Door
38
Interpreting the Results 3
• Many times, you will find that you are unable to process an inbound or outbound
transportation unit (TU) because of the following situations:
Tasks are still pending for the TU that need confirmation
Operator simply forgot to move the TU to a parking space or checkpoint after
completion of necessary warehouse processes
39
What We’ll Cover
• Reporting and analytics in EWM
• Interpreting the results and taking action
• Leading practices and trends
• Wrap-up
40
Leading Practices
• Extend master data appropriately and set up the Core Interface Framework (CIF)
accordingly (separate model for each object)
• Establish an end-of-shift practice that looks at unconfirmed WTs, users that did not log
off resources properly and remaining stock on resources
• Set up QRFC to run in a specified interval to try and reprocess failed queues
• Don’t forget the human element!
Have the correct roles within your organization trained to know how to use the
tool sets
• Stay informed about new tools that are available to give you better reporting
41
Trends
• Data explosion
Dramatic increases in data due to social media, machine sensors, and better tools available to
extract/harvest the data
• Lower storage cost
Costs are lower and continue to fall for storage and processing
• Analytics are at the core
In-memory solutions such as SAP HANA make data more accessible
• Tools are more available and easier to use, and not just for a select few any longer
Mobile devices
Report creation tools are easier to use
• Analytics are topping the C-suite agenda
Companies will continue to strive for a competitive edge and analytics will be pushed from the
top down
42
What We’ll Cover
• Reporting and analytics in EWM
• Interpreting the results and taking action
• Leading practices and trends
• Wrap-up
43
Where to Find More Information
• “Analytics Best Practices: Plan for the Human Factor,” (All Analytics).
www.allanalytics.com/radio.asp?doc_id=278783&gateway_return=true
• M. Brian Carter, Frank-Peter Bauer, Jörg Lange, Tim Dalm, Christoph Persich, SAP
Extended Warehouse Management: Processes, Functionality, and Configuration (SAP
PRESS, 2010).
• SAP Extended Warehouse Management (EWM) 9.3 on the SAP Help Portal
help.sap.com/ewm93?current=ewm
• Heather Clancy, “Why CFOs should play a bigger role in digital strategy,” (Fortune, May
2015).
http://fortune.com/2015/05/22/cfo-digital-strategy/
44
7 Key Points to Take Home
• Multiple tools are available in standard EWM to monitor and make critical decisions
• The Warehouse Monitor is more than a reporting tool, but an execution tool as well
• Remember that measurement services are very powerful in EWM and can be used to
create a variety of measures for different reports in EWM
• Labor Demand Planning requires HANA
• The Shipping Cockpit requires the use of SAP Business Client
• When analyzing EWM labor execution results, look to how to further improve operations
vs. as a disciplinary tool
• Consider other SAP tools such as Lumira and BusinessObjects to further enhance your
supply chain execution reporting tools
45
Your Turn!
How to contact me:
Kyle Sorensen
Email: [email protected]
Please remember to complete your session evaluation.
46
SAP and other SAP products and services mentioned herein as well as their respective logos are trademarks or registered trademarks of SAP SE (or an SAP affiliate company) in Germany and other
countries. All other product and service names mentioned are the trademarks of their respective companies. Wellesley Information Services is neither owned nor controlled by SAP SE.
Disclaimer
EY refers to the global organization and may refer to one or more of the member firms of Ernst & Young Global Limited, each of which is a separate legal entity. Ernst & Young Global Limited, a UK
company limited by guarantee, does not provide services to clients. Ernst & Young LLP is an EY member firm serving clients in the US. For more information about our organization, please visit
ey.com.
© 2016 Ernst & Young LLP.
All Rights Reserved.
1401-118151
This material has been prepared for general informational purposes only and is not intended to be relied upon as accounting, tax, or other professional advice. Please refer to your advisors for specific
advice.

Wellesley Information Services, 20 Carematrix Drive, Dedham, MA 02026 Copyright © 2016 Wellesley Information Services. All rights reserved.