Embed Size (px)
Citation preview
Oracle® Hospitality Reporting and AnalyticsUser Guide
Release 8.5.1
E70169-01
September 2016
Oracle Hospitality Reporting and Analytics User Guide, Release 8.5.1
E70169-01
Copyright © 2000, 2016, Oracle and/or its affiliates. All rights reserved.
This software and related documentation are provided under a license agreement containing restrictions onuse and disclosure and are protected by intellectual property laws. Except as expressly permitted in yourlicense agreement or allowed by law, you may not use, copy, reproduce, translate, broadcast, modify, license,transmit, distribute, exhibit, perform, publish, or display any part, in any form, or by any means. Reverseengineering, disassembly, or decompilation of this software, unless required by law for interoperability, isprohibited.
The information contained herein is subject to change without notice and is not warranted to be error-free. Ifyou find any errors, please report them to us in writing.
If this software or related documentation is delivered to the U.S. Government or anyone licensing it on behalfof the U.S. Government, then the following notice is applicable:
U.S. GOVERNMENT END USERS: Oracle programs, including any operating system, integrated software,any programs installed on the hardware, and/or documentation, delivered to U.S. Government end users are"commercial computer software" pursuant to the applicable Federal Acquisition Regulation and agency-specific supplemental regulations. As such, use, duplication, disclosure, modification, and adaptation of theprograms, including any operating system, integrated software, any programs installed on the hardware,and/or documentation, shall be subject to license terms and license restrictions applicable to the programs.No other rights are granted to the U.S. Government.
This software or hardware is developed for general use in a variety of information management applications.It is not developed or intended for use in any inherently dangerous applications, including applications thatmay create a risk of personal injury. If you use this software or hardware in dangerous applications, then youshall be responsible to take all appropriate fail-safe, backup, redundancy, and other measures to ensure itssafe use. Oracle Corporation and its affiliates disclaim any liability for any damages caused by use of thissoftware or hardware in dangerous applications.
Oracle and Java are registered trademarks of Oracle and/or its affiliates. Other names may be trademarks oftheir respective owners.
Intel and Intel Xeon are trademarks or registered trademarks of Intel Corporation. All SPARC trademarks areused under license and are trademarks or registered trademarks of SPARC International, Inc. AMD, Opteron,the AMD logo, and the AMD Opteron logo are trademarks or registered trademarks of Advanced MicroDevices. UNIX is a registered trademark of The Open Group.
This software or hardware and documentation may provide access to or information about content, products,and services from third parties. Oracle Corporation and its affiliates are not responsible for and expresslydisclaim all warranties of any kind with respect to third-party content, products, and services unlessotherwise set forth in an applicable agreement between you and Oracle. Oracle Corporation and its affiliateswill not be responsible for any loss, costs, or damages incurred due to your access to or use of third-partycontent, products, or services, except as set forth in an applicable agreement between you and Oracle.
Contents
Preface ............................................................................................................................................................... vii
1 Getting Started
Navigation Path Disclaimer .................................................................................................................... 1-1
Choosing a Report Type .......................................................................................................................... 1-1
Configuration Guidelines ........................................................................................................................ 1-2
2 Core Reports
Running Reports ....................................................................................................................................... 2-1
Modifying Reports.................................................................................................................................... 2-1
Exporting Reports..................................................................................................................................... 2-3
3 Custom Reports in Microsoft Excel
Installing iQuery ....................................................................................................................................... 3-1
Building a Custom Report in Microsoft Excel ...................................................................................... 3-2
4 Custom Reports with Interactive Reports
Creating Interactive Reports ................................................................................................................... 4-1
Modifying and Deleting Interactive Reports ........................................................................................ 4-2
Publishing Interactive Reports................................................................................................................ 4-3
5 Scheduled Reports
Scheduling Reports for Email Distribution........................................................................................... 5-1
6 Guest Check Information
Retrieving Information with Check Query ........................................................................................... 6-1
Retrieving Transaction Information with Audit & Analysis.............................................................. 6-2
Exporting Audit & Analysis Queries..................................................................................................... 6-4
7 Charts
Viewing Charts.......................................................................................................................................... 7-1
iii
8 Manager Communication
Configuring Manager Log Entry Categories ........................................................................................ 8-1
Adding an Entry to the Manager Log.................................................................................................... 8-1
Updating and Closing an Entry.............................................................................................................. 8-2
Adding a Note to the Manager Log ....................................................................................................... 8-2
Searching the Manager Log..................................................................................................................... 8-2
9 User Settings
myPage ....................................................................................................................................................... 9-1
Configuring myPage Content ................................................................................................................. 9-1
Configuring User Preferences................................................................................................................. 9-2
10 Organizational Hierarchies
Revenue Centers ..................................................................................................................................... 10-2
Creating Levels........................................................................................................................................ 10-2
Adding Locations.................................................................................................................................... 10-2
Establishing Relationships Between Levels and Locations .............................................................. 10-3
11 Currency and Exchange Rate
Adding a Currency Type....................................................................................................................... 11-1
Setting the Base Currency...................................................................................................................... 11-1
Adding and Updating Exchange Rates ............................................................................................... 11-2
12 Users and Roles
Creating Roles ......................................................................................................................................... 12-1
Adding Users........................................................................................................................................... 12-3
13 End User Access to Content
Creating Portlets ..................................................................................................................................... 13-1
Assigning Portlets to Roles.................................................................................................................... 13-2
Assigning Side Menus to Roles ............................................................................................................ 13-2
Assigning Reports to Roles ................................................................................................................... 13-3
Installing Remote Transfer Agent (RTA) at a Location..................................................................... 13-3
Outage Alerts........................................................................................................................................... 13-4
Setting Outage Alert Recipients............................................................................................................ 13-4
14 Fiscal and Business Time Intervals
Setting Up a Financial Calendar ........................................................................................................... 14-1
Creating a Financial Year....................................................................................................................... 14-2
Creating Day Parts.................................................................................................................................. 14-3
Overriding Day Parts ............................................................................................................................. 14-3
iv
15 Reason Codes
Creating Reason Codes .......................................................................................................................... 15-1
16 Reporting Hierarchies
Creating Reporting Hierarchies............................................................................................................ 16-1
17 Item Alignment
Alignment Rules ..................................................................................................................................... 17-2
Creating Alignment Rules ..................................................................................................................... 17-2
Setting a Master Store............................................................................................................................. 17-3
Manually Aligning Items....................................................................................................................... 17-4
Setting Item Alignment.......................................................................................................................... 17-4
Changing the Alignment of an Item .................................................................................................... 17-5
Unaligning an Item................................................................................................................................. 17-5
Merging Master Items ............................................................................................................................ 17-5
Designating an Unaligned Item as a New Master Item .................................................................... 17-5
Configuring Alignment Rules............................................................................................................... 17-5
Menu Item Alignment with Multiple Master Stores ......................................................................... 17-6
18 Category Groups
Creating Category Groups .................................................................................................................... 18-1
Creating Category Group Hierarchies................................................................................................. 18-1
19 Cost Tiers
Creating Cost Tiers ................................................................................................................................. 19-1
Assigning Menu Items to Cost Tiers.................................................................................................... 19-1
20 Standard Export
General Ledger Export Files.................................................................................................................. 20-2
Payroll Export Files ................................................................................................................................ 20-3
General Ledger (GLD)............................................................................................................................ 20-3
Summary (SUM) ..................................................................................................................................... 20-4
Discount Records (DSC) ........................................................................................................................ 20-5
Service Charge Records (SVC) .............................................................................................................. 20-5
Tender Records (TND)........................................................................................................................... 20-6
Tax Records (TAX).................................................................................................................................. 20-6
Order Type Records (OT) ...................................................................................................................... 20-7
General Ledger Custom Records (GLC).............................................................................................. 20-7
Paid In/Paid Out Detail Records (PIO)............................................................................................... 20-8
Menu Item Sales Records (MI).............................................................................................................. 20-8
Menu Item Price Records (MNPR)....................................................................................................... 20-9
Check Header (CHDR) ........................................................................................................................ 20-10
v

Check Detail (CDTL) ............................................................................................................................ 20-11
Financial Forms Detail Records (FFD)............................................................................................... 20-12
Financial Forms Ledger Records (FFL).............................................................................................. 20-13
Cash Management Records (CASH).................................................................................................. 20-13
Pay Information (PAY)......................................................................................................................... 20-14
Payroll Identification (PAYID)............................................................................................................ 20-16
vi
Preface
Audience
This document is intended for Reporting and Analytics end users such as restaurantmanagers and advanced-level users such as administrators.
Customer Support
To contact Oracle Customer Support, access My Oracle Support at the following URL:
https://support.oracle.com
When contacting Customer Support, please provide the following:
• Product version and program/module name
• Functional and technical description of the problem (include business impact)
• Detailed step-by-step instructions to re-create
• Exact error message received
• Screen shots of each step you take
Documentation
Oracle Hospitality product documentation is available on the Oracle Help Center at http://docs.oracle.com/en/industries/hospitality/
Revision History
Date Description of Change
August 2016 Initial publication
September 2016 Added information regarding the StandardExport.
vii

1Getting Started
Oracle Hospitality Reporting and Analytics is a web-based application thatconsolidates food and beverage information in the cloud. Reporting and Analyticscentralizes point-of-sale (POS) data to provide operational and analytical insights intobusiness operations, and to improve efficiency by delivering information to all roleswithin an organization.
After you log in, the application shows a navigation pane and content in the myPagearea. The navigation pane contains menus that categorize links to functionality andinformation in the system. For example, a Reports menu can contain links to reportsthat are specific to your role within your organization. You can customize the myPageand its layout. In the application preferences, you can set personal configurations suchas language and time zone.
The content you can access from menus depends on your role. For example, if yourorganization has a District Manager role and you are a member of the role, you haveaccess to the content associated with the role. If you are a member of the systemadministrator role, you have access to administrator-level content such as addingusers and adding roles.
Navigation Path Disclaimer
Choosing a Report Type
Configuration Guidelines
Navigation Path DisclaimerThe navigation instructions throughout the documentation may not accurately depictthe menu layout for your Oracle Hospitality Enterprise Back Office deploymentbecause administrators can customize the name and organization of the groups andlinks in the sidebar menu. Use the navigation instructions provided as a guideline forlocating the links in your deployment, or contact an administrator for assistance.
Choosing a Report TypePoint-of-Sale (POS) applications post data to the Enterprise Back Office database, andReporting and Analytics applies business intelligence and analytics to the data toproduce reports for analysis and interpretation.
The reports generated by Reporting and Analytics include child reports, or drill-downreports, which inherit scope and properties from the parent report to display moreextensive and detailed information about the user selection. For example, if you arelooking at a sales report that includes a breakdown of sales by menu item, you canselect a menu item to view a drill-down report containing sales, tax, and servicecharge details specific to the selected menu item.
Reporting and Analytics allows you to leverage the following types of reports:
Getting Started 1-1
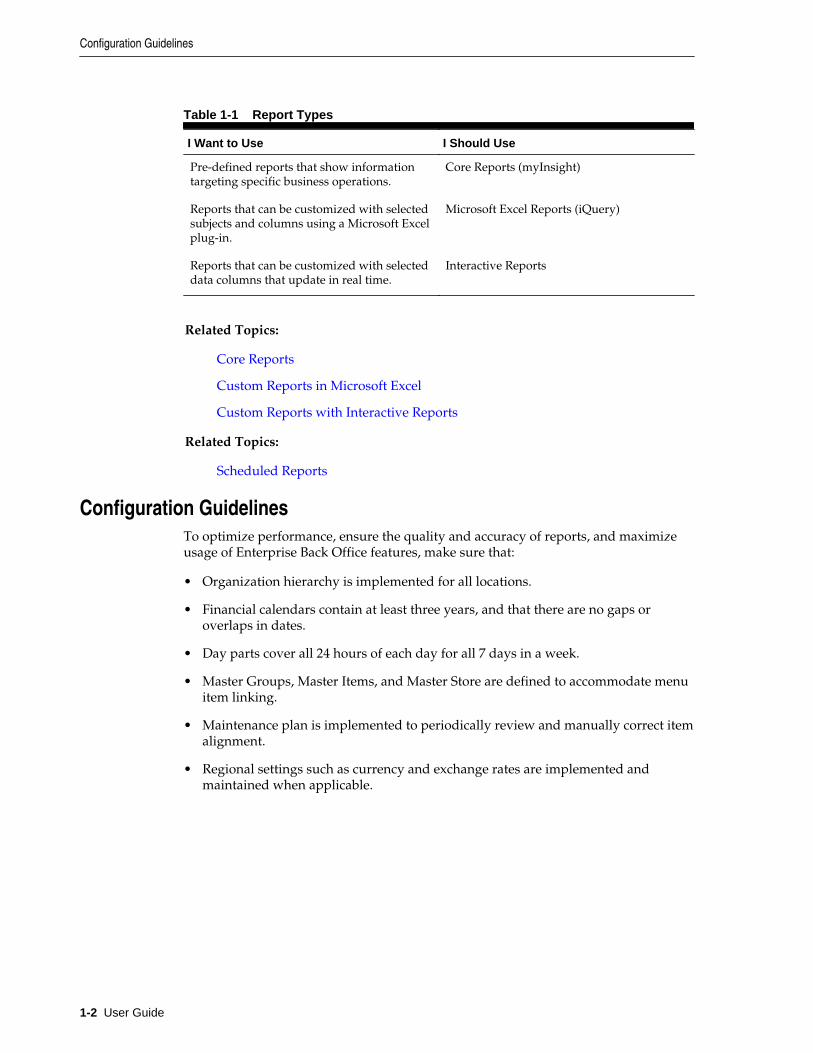
Table 1-1 Report Types
I Want to Use I Should Use
Pre-defined reports that show informationtargeting specific business operations.
Core Reports (myInsight)
Reports that can be customized with selectedsubjects and columns using a Microsoft Excelplug-in.
Microsoft Excel Reports (iQuery)
Reports that can be customized with selecteddata columns that update in real time.
Interactive Reports
Related Topics:
Core Reports
Custom Reports in Microsoft Excel
Custom Reports with Interactive Reports
Related Topics:
Scheduled Reports
Configuration GuidelinesTo optimize performance, ensure the quality and accuracy of reports, and maximizeusage of Enterprise Back Office features, make sure that:
• Organization hierarchy is implemented for all locations.
• Financial calendars contain at least three years, and that there are no gaps oroverlaps in dates.
• Day parts cover all 24 hours of each day for all 7 days in a week.
• Master Groups, Master Items, and Master Store are defined to accommodate menuitem linking.
• Maintenance plan is implemented to periodically review and manually correct itemalignment.
• Regional settings such as currency and exchange rates are implemented andmaintained when applicable.
Configuration Guidelines
1-2 User Guide
2Core Reports
Reporting and Analytics installs core reports, which are pre-defined reports that showinformation targeting specific business operations. The core reports do not includecore reports from other regions such as EMEA, customized reports, and reportsinstalled by other Enterprise Back Office products. You can configure the core reportsto handle information from within a certain date range or from data that applies to acertain organizational level, such as a revenue center or a location.
For example, you can use the Daily Operations Summary report as part of your start-of-day process to review high-level operations data for the previous business day at aspecific store. You can then run the report for all locations and compare the store tothe whole enterprise.
Running Reports
Modifying Reports
Exporting Reports
Related Topics:
Choosing a Report Type
Related Topics:
Scheduled Reports
Running Reports
1. In Reporting and Analytics, click Reports and then click More Reports.
2. In the Reports list, click the report name and then click the specific report.
3. Click Run Report.
Related Topics:
Navigation Path Disclaimer
Modifying Reports
1. In Reporting and Analytics, click Reports and then click More Reports.
2. In the Reports list, click the report name and then click the specific report.
3. On the Modify Report tab, modify the report as described in the following table:
Core Reports 2-1
Setting Description
Business Dates Select business dates for the report byperforming one of the following:• Select the range of dates for the report
from the drop-down list.• Click Business Dates to open the
calendar view.You can select dates in the calendar viewusing the following methods:• Click a single day.• Click the month name to select all the
days in the month.• Click the day column header to select all
those days in the month.• Click the numbered week to select all
the days in that week.• Press and hold the Ctrl key to select
multiple days.
Locations Select the locations for which the reportreturns data.
Revenue Centers Select the revenue centers for which thereport returns data.
Order Types Select the order types for which the reportreturns data.
4. On the Preferences tab, specify how Reporting and Analytics saves reports asdescribed in the following table:
Option Description
Save When you select the report from theReporting and Analytics home page sidemenu, the report runs with the settings youselected in step 3.
For example, if you configure the DailyOperations report to search by the locationMaryland, USA and then click Save, allusers running the Daily Summary reportgenerate a report for the locationMaryland, USA unless they change thesearch settings.
Restore defaults Restores the factory defaults for the report.
Modifying Reports
2-2 User Guide
Option Description
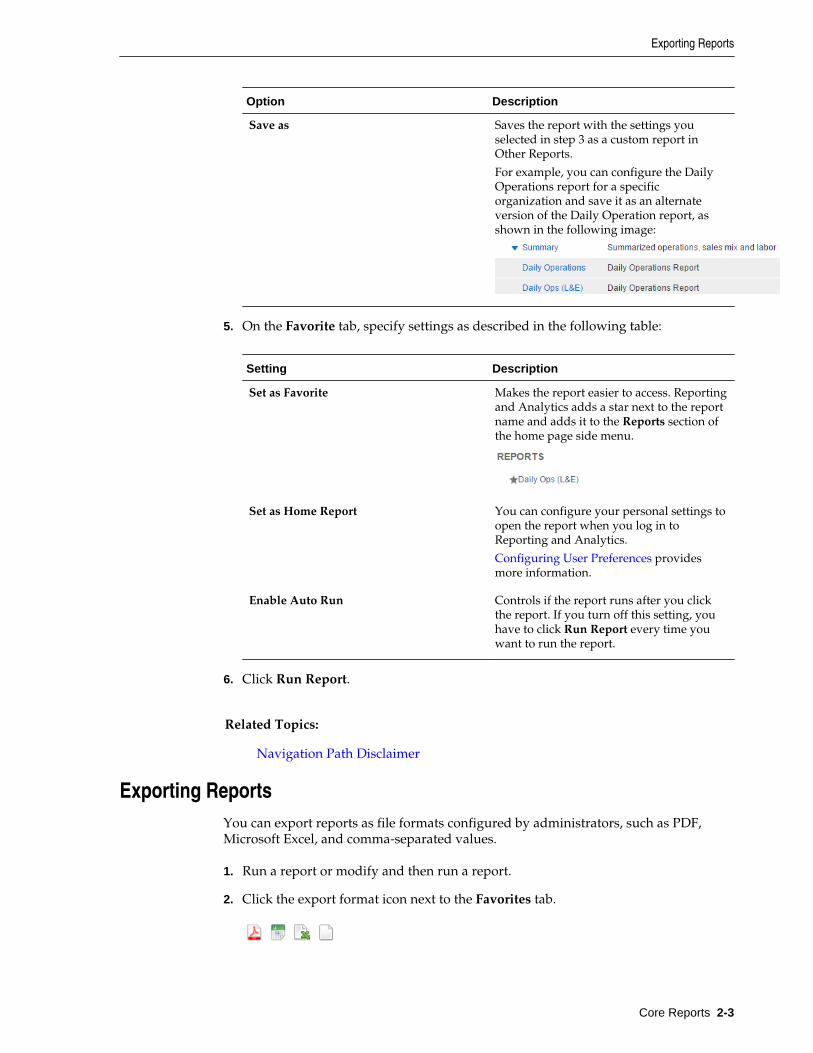
Save as Saves the report with the settings youselected in step 3 as a custom report inOther Reports.
For example, you can configure the DailyOperations report for a specificorganization and save it as an alternateversion of the Daily Operation report, asshown in the following image:
5. On the Favorite tab, specify settings as described in the following table:
Setting Description
Set as Favorite Makes the report easier to access. Reportingand Analytics adds a star next to the reportname and adds it to the Reports section ofthe home page side menu.
Set as Home Report You can configure your personal settings toopen the report when you log in toReporting and Analytics.
Configuring User Preferences providesmore information.
Enable Auto Run Controls if the report runs after you clickthe report. If you turn off this setting, youhave to click Run Report every time youwant to run the report.
6. Click Run Report.
Related Topics:
Navigation Path Disclaimer
Exporting ReportsYou can export reports as file formats configured by administrators, such as PDF,Microsoft Excel, and comma-separated values.
1. Run a report or modify and then run a report.
2. Click the export format icon next to the Favorites tab.
Exporting Reports
Core Reports 2-3
3. Save the exported file.
Related Topics:
Navigation Path Disclaimer
Exporting Reports
2-4 User Guide
3Custom Reports in Microsoft Excel
iQuery is a Microsoft Excel plug-in that enables you to create reports using selectedsubjects and columns.
For example, if you want a start-of-day report that replaces the Operating Metricssection of the Daily Operations Summary report with information about the three best-selling items for that day and some labor performance and efficiency analysis, you cancreate a report with the fields you want to see. You can then save the custom reportinto Reporting and Analytics so you can launch the report from the sidebar.
Installing iQuery
Building a Custom Report in Microsoft Excel
Related Topics:
Choosing a Report Type
Related Topics:
Scheduled Reports
Installing iQuery
1. Close Microsoft Excel if it is open.
2. In Reporting and Analytics, click LINKS and then click iQuery.
3. Click Install MICROS iQuery - Office 2007+ and then save iQuerySetup.exe toa temporary location on your computer.
4. Double-click the iQuerySetup.exe file and then follow the prompts to install thesoftware.
5. Validate the installation:
a. Open Microsoft Excel.
b. Locate the iQuery plug-in, and then open iQuery.
The location varies depending on the version of Microsoft Excel. For example, inMicrosoft Excel 2013, access iQuery from the ADD-INS ribbon.
c. Log in to iQuery.
Related Topics:
Navigation Path Disclaimer
Custom Reports in Microsoft Excel 3-1
Building a Custom Report in Microsoft Excel
1. Select a query subject.
2. Select the column data that appears in the spreadsheet when you run the query.
Use the up and down arrows to adjust the order of the columns in the spreadsheet.For example, if you move a column to the top of the list, that column is the firstcolumn in the spreadsheet.
3. To apply a mathematical operation to column data, select it from the Operationdrop-down list.
4. Specify filters to refine query results:
a. Select a business date or date range.
b. Select locations.
c. Select revenue centers for the locations.
d. Select other filters.
5. Define the order in which iQuery sorts the data.
6. Click Preview to verify that the query returns the correct results.
If the preview does not return results or returns too many rows, change querysettings and the preview the query again.
7. Click Run to show the results in Microsoft Excel.
8. Save the query.
To save the query on your computer so you can run it at a later time from MicrosoftExcel, click Query. iQuery does not save the business date because you change thedate each time you run the query.
To save the query as a report, click Report. Users assigned to the role for accessingcustom reports can run the report from Reporting and Analytics.
Related Topics:
Navigation Path Disclaimer
Building a Custom Report in Microsoft Excel
3-2 User Guide
4Custom Reports with Interactive Reports
Interactive Reports enable you to build custom reports and view them in real time.The report updates as you drag and drop data fields onto the canvas. You can saveand publish Interactive Reports and you can configure Reporting and Analytics tosend them in report emails.
Creating Interactive Reports
Modifying and Deleting Interactive Reports
Publishing Interactive Reports
Related Topics:
Choosing a Report Type
Related Topics:
Scheduled Reports
Creating Interactive Reports
1. In Reporting and Analytics, click Interactive Report.
2. Click Create New Interactive Report and then click the report type.
3. Double-click Untitled and then type a report name.
4. Drag data fields to the canvas.
To add a data field as a column header, drag the field to the column bar. A verticalline appears to indicate you are creating a column header.
To add a data field as a group header, drag the field above the column bar. Ahorizontal line appears to indicate you are creating a group header.
To reorganize fields, drag them to their new location on the canvas or click andthen drag them to their new location in the Columns field.
To rename a field, double-click it on the canvas and then type the new name.
To remove a data field, click it and then drag it to the trash can.
5. To format data fields, click the Formatting tab and then specify format settings.
The options that appear vary by field type. Press and hold the Ctrl key to select andformat multiple fields.
6. To change general preferences such as the report template and page setup, click theGeneral tab and then specify the settings.
Custom Reports with Interactive Reports 4-1
7. To define filters that limit data in the report:
a. Click the filter icon ( ) on the tool bar, and then drag a field from the canvasto the Filters box.
b. Specify filter conditions and parameters and then click OK.
To remove a filter, click the filter icon and then click .
To edit a filter, click the filter icon and then click .
8. To sort report data:
• For group headers, under Group Sorting on the Data tab, click the drop-downlist for that header, and then select Ascending or Descending.
• For column headers, right-click on a column, select Sort, and then selectAscending , Descending, or None. Selecting None removes the previous sortoption.
9. Click Save, enter the report name, and then click OK.
10. To generate the report, click the Export icon ( ) on the tool bar, and then selectthe output type.
Related Topics:
Navigation Path Disclaimer
Modifying and Deleting Interactive Reports
1. In Reporting and Analytics, click Reports, and then click Interactive Reporting.
2. Select Modify/Delete Interactive Reports.
3. To find a report:
• Click Find All to show all saved Interactive Reports.
• Enter the search criteria for a specific report, and then click Find.
4. Click Next and Previous to navigate through the search results, if applicable.
5. Click the report.
6. To modify a report, click Edit. See Creating Interactive Reports for details onmodifying the report’s data fields.
7. To delete a report, click Delete, and then click OK twice.
Related Topics:
Navigation Path Disclaimer
Modifying and Deleting Interactive Reports
4-2 User Guide
Publishing Interactive Reports
1. In Reporting and Analytics, click Reports, and then click Interactive Reporting.
2. Click Publish Interactive Reports.
3. To find a report:
• Click Find All to show all saved Interactive Reports.
• Enter the search criteria for a specific report, and then click Find.
4. Click Next and Previous to navigate the search results, if applicable.
5. Click the report.
6. To view the list of roles and users assigned to the report, click Publish To.
7. Click Publish at the top of the screen.
8. Enter a new Name for the report, if applicable.
9. Enter a Description for the report.
10. Click By Role or By User.
11. Select the role or user, and then click >> to move the selection to the panel.
12. Click Save, and then click OK.
Related Topics:
Navigation Path Disclaimer
Publishing Interactive Reports
Custom Reports with Interactive Reports 4-3

Publishing Interactive Reports
4-4 User Guide
5Scheduled Reports
You can use Report Mail to schedule reports to run at a specified date and time, and todistribute the report by email to a user or role.
For example, you can configure Report Mail to generate and send an inventory reportevery morning so that you can check on re-stocks or pre-prepared food.
Scheduling Reports for Email Distribution
Related Topics:
Choosing a Report Type
Core Reports
Custom Reports in Microsoft Excel
Custom Reports with Interactive Reports
Scheduling Reports for Email Distribution
1. In Reporting and Analytics, click LINKS and then click Report Mail.
2. On the Report Mail Administration Menu page, click Report Mail.
3. Click Add.
4. On the Content tab, specify email content as described in the following table:
Setting Description
Type Select the report type.
Report Selection Select the report. For long lists of reports,specify search criteria to locate the report.
Scheduled Reports 5-1
Setting Description
Preferences Specify delivery preferences. The reportyou select determines the preferences thatappear.
If you select multiple locations, Reportingand Analytics sends one report for eachlocation.
If you select Consolidated, Reporting andAnalytics sends aggregate report data forall locations in one email.
Reporting and Analytics sends each reportin a separate email. If you select Zipmultiple files, Reporting and Analyticssends one mail with a ZIP file containingthe report files.
5. On the Name tab, specify email settings as described in the following table:
Setting Description
Name Type the name of the report email. Thename identifies the report email in theReporting and Analytics web application.
Description Type a description of the report email. Thedescription appears in the Reporting andAnalytics web application.
Subject Type a subject for the report email. Thevalue appears in the subject line of theemail sent to recipients.
Active Clear the option to deactivate the reportemail. Reporting and Analytics saves thereport email settings but does not sendreport emails.
Email When Error Select to notify the system administrator ofreport email errors.
6. On the Recipients tab, select the email recipients.
If you select a specific user, and you want to send the email to more users, selectAdditional recipient(s) emails and then type the email addresses.
7. On the Frequency tab, specify the intervals Reporting and Analytics uses to sendreport emails.
Depending on your system configuration, Reporting and Analytics can runscheduled reports and send report emails after a service outage. Reports scheduledto run more than once during the interval only run once with the last set ofinformation. If the business date changed during the service outage, all reports arerun as if they were scheduled to run on the current day. They do not run for theday they were scheduled. As a result, reports scheduled to show:
Scheduling Reports for Email Distribution
5-2 User Guide
• Daily information, such as the Daily Operations report, show information forthe previous business day instead of retrieving information from two daysprior.
• Up-to-date information, such as the Today’s Operations report, showinformation for the current business day instead of retrieving information forthe previous business day.
Related Topics:
Navigation Path Disclaimer
Scheduling Reports for Email Distribution
Scheduled Reports 5-3

Scheduling Reports for Email Distribution
5-4 User Guide
6Guest Check Information
Oracle Hospitality Reporting and Analytics enables you to retrieve high-level guestcheck information and transaction-level information from the system.
To retrieve high-level information, use Check Query to retrieve basic checkinformation. For example, you can search for check totals less than $10.00 for a daterange from a specific location.
To retrieve transaction-level information, use Audit & Analysis to query the system.Audit & Analysis enables you to build custom queries by applying filters. You can usethe query results to identify trends that require research, such as a high number oferror corrections or voided transactions. The following table describes the Audit &Analysis queries you can create. Your role or user type determines the queries you cancreate.
Type Description
Transaction Detail Retrieves transaction-level data. For example,you can query transactions for specific menuitem purchases at a location.
Transaction Summary Retrieves summary-level data. For example,you can query transactions for a tender mediatype such as credit card purchases for acustomer.
Non-Check Transaction Retrieves data for non-check transactions. Forexample, you can query training transactionsfor workstations at a location.
Authorization Retrieves data for transactions that requireauthorization. For example, you can queryvoided service charges from a round for arevenue center.
Retrieving Information with Check Query
Retrieving Transaction Information with Audit & Analysis
Exporting Audit & Analysis Queries
Retrieving Information with Check Query
1. In Reporting and Analytics, click Check Query.
2. Specify the search criteria.
3. Click Search.
Guest Check Information 6-1
Retrieving Transaction Information with Audit & Analysis
Exporting Audit & Analysis Queries
Related Topics:
Navigation Path Disclaimer
Retrieving Transaction Information with Audit & Analysis
1. In the Reports section, click Audit & Analysis.
2. In the Create New Queries section, click the query type.
For example, click Transaction Detail to build a query based on specific transactiondetails such as menu items. Your role and user type determines the queries you cancreate.
3. Click Locations at the top of the page and then select the location.
4. Click Business Dates and then select dates:
a. To use a fiscal calendar, select Financial. Contact your system administrator toverify your organization uses a fiscal calendar.
b. To use a pre-defined date or date range, select it from the Quick Select drop-down list.
c. Select the year.
d. To select dates from the calendar grid:
• Click a single day.
• Click the month name to select all the days in the month.
• Click the day column header to select all those days in the month.
• Click the numbered week to select all the days in that week.
• Press and hold the Ctrl key to select multiple days.
5. Click Filters and then specify criteria to limit the query to a useful set of results, asdescribed in the following table:
Filter Description
Item Types Filters by discounts, menu items(Transaction Detail only), service charges(Transaction Detail only), and tender mediaassociated with the check.
General Filters by general transaction information.The query type determines the generalcriteria you can define.
Workstation (Transaction Detail only) Filters results by checks generated fromworkstations at locations.
Retrieving Transaction Information with Audit & Analysis
6-2 User Guide
Filter Description
Day Parts Filters by checks generated during parts ofa day configured for your organization.Examples of day parts include breakfast,lunch, dinner, and late night. You can alsoselect 15-minute intervals within an hour.
Order Types Filters by order types configured for yourorganization.
Revenue Centers Filters by revenue center. For example, youcan filter on guest check transactions fromthe bar or restaurant.
Customer (Transaction Summary only) Filters by customer information associatedwith transactions. For example, you canfilter by the name on the credit card acustomer used for the transaction.
Employee Filters by employee information associatedwith transactions. For example, you canfilter by all transactions for check employeeBrian Smith.
Tax (Transaction Summary only) Filter by tax information associated withtransactions.
6. Click Format and define query output settings:
a. Select the output type.
b. To show location-specific names of menu items, tender and media, discounts,and service charges in the query, select Use location names rather than masternames.
Clearing this option shows the names from the master definition table.
c. Select the columns that appear in the query and then define how the columndata appears in the query.
For example, you can group data by revenue center in ascending order. Toapply a mathematical operation, select the operation from the Function column.
7. Click Run to run the query.
8. Click Publish to save the query and make it available to other users:
a. Type a name and description for the query.
b. On the Publish To tab, specify if the members of a role or specific users can runthe query.
c. On the Prompted Filters tab, select the filters that other users can set whenrunning the published query.
d. Click Save.
The query appears in the Public Queries section on the Audit & Analysis page.
Retrieving Transaction Information with Audit & Analysis
Guest Check Information 6-3
Retrieving Information with Check Query
Exporting Audit & Analysis Queries
Related Topics:
Navigation Path Disclaimer
Exporting Audit & Analysis Queries
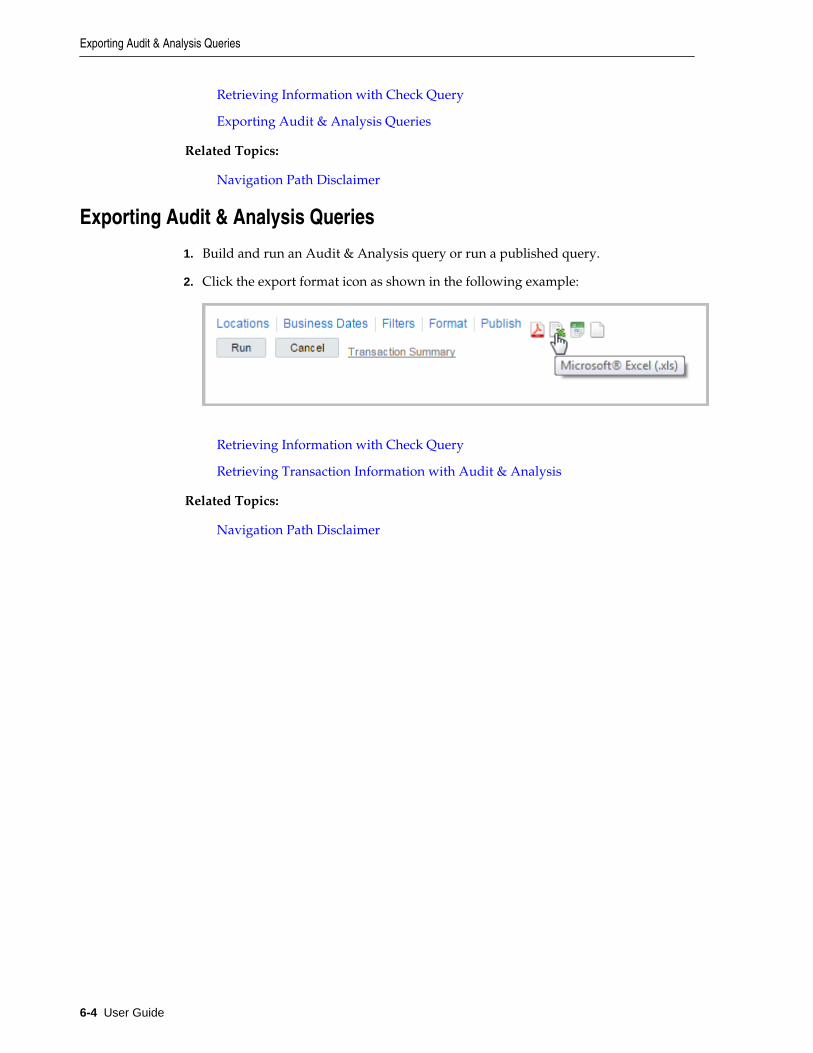
1. Build and run an Audit & Analysis query or run a published query.
2. Click the export format icon as shown in the following example:
Retrieving Information with Check Query
Retrieving Transaction Information with Audit & Analysis
Related Topics:
Navigation Path Disclaimer
Exporting Audit & Analysis Queries
6-4 User Guide
7Charts
Reporting and Analytics charts show graphical representations of sales and labor data.Reporting and Analytics provides the following standard charts:
• Adjustments
• Labor
• Operations
• Order Types
• Sales
• Dining Time
• Posting Performance
Your system administrator determines the charts you can access.
Viewing Charts
Viewing Charts
1. In Reporting and Analytics, click Charts.
The name of the menu that contains the chart varies depending on your Reportingand Analytics configuration. Contact your system administrator if you cannot findthe chart.
2. Click the chart.
3. To change chart settings:
a. Click Change Measures.
b. On the Select Dimensions and Measures page, change the settings.
c. To apply the settings to the current chart instance, click OK. After you close thechart, Reporting and Analytics restores the default chart settings.
d. To save the settings for future chart instances, click Save Preferences.
Related Topics:
Navigation Path Disclaimer
Charts 7-1

Viewing Charts
7-2 User Guide
8Manager Communication
The Reporting and Analytics Manager Log is a searchable electronic logbook thatenables you to communicate with other managers across shifts and revenue centers.Use the log to:
• Add an Entry with priority levels, categorization, tasks, and action items.
• Add a Note containing a daily operations note for information purposes.
• Update and track the status of tasks in an entry.
• View and search a history of entries and notes.
Configuring Manager Log Entry Categories
Adding an Entry to the Manager Log
Updating and Closing an Entry
Adding a Note to the Manager Log
Searching the Manager Log
Configuring Manager Log Entry Categories
1. In Reporting and Analytics, click Admin, click Warehouse, click Miscellaneous,and click Manager Log Config.
2. Configure the name, column label, and description for each category, and clickSave.
Related Topics:
Navigation Path Disclaimer
Adding an Entry to the Manager Log
1. In Reporting and Analytics, navigate to the Manager Log.
2. Click Add Entry, fill out the form, and click Add.
Administrators can configure the list of Categories.
Related Topics:
Navigation Path Disclaimer
Manager Communication 8-1
Updating and Closing an Entry
1. In Reporting and Analytics, navigate to the Manager Log.
2. Click the entry you want to update, click Update Entry, and then make changes tothe form.
3. Click Update to finalize the changes to the entry, or click Mark Completed tochange the status of the entry to Complete.
Related Topics:
Navigation Path Disclaimer
Adding a Note to the Manager Log
1. In Reporting and Analytics, navigate to the Manager Log.
2. Click Add Note, fill out the form, and then click Save.
Related Topics:
Navigation Path Disclaimer
Searching the Manager Log
1. In Reporting and Analytics, navigate to the Manager Log.
2. Click View History, configure the search filters, and then click View.
The Manager Log search does not include notes in the search results.
3. On the results page, click Select Again to perform another search.
Related Topics:
Navigation Path Disclaimer
Updating and Closing an Entry
8-2 User Guide
9User Settings
You can configure the content and layout of myPage and change personal applicationsettings.
myPage
Configuring myPage Content
Configuring User Preferences
myPageThe myPage screen appears after you log in to Reporting and Analytics. You canperform the following configurations:
• Add or remove charts or reports to run upon login.
• Change the color scheme.
• Resize windows on the screen.
You can configure up to three myPage screens. Reporting and Analytics shows yourfirst myPage screen after you log in.
Related Topics:
Configuring myPage Content
Configuring User Preferences
Configuring myPage Content
1. To add or remove content:
a. From the myPage menu, click Content.
b. Select or deselect the information you want show on myPage. The systemadministrator manages the content available in this list.
2. To move or resize content:
a. From the myPage menu, click Layout and then click OK.
b. Drag the center of the content to move it.
c. Drag the corner of the content to change its size.
User Settings 9-1
Related Topics:
myPage
Related Topics:
Navigation Path Disclaimer
Configuring User Preferences
1. Click Preferences on the menu bar.
2. Configure your preferences as described in the following table:
Field Description
Language Select the default language for yourmyPage.
If your myPage does not use this setting,your environment does not have therequired browser configurations orlanguage files.
Time Zone Select the time zone for your myPage.
Style Select your color scheme.
Remember Port Selections Select this option to configure Reportingand Analytics to save your filter selectionsfor each report.
First login of the day Select to see your myPage or the report youset as the Home Report when you log in toReporting and Analytics for the first time ina new business day.
Subsequent logins Select to see your myPage or the report youset as the Home Report when you log in toReporting and Analytics for the secondtime and in a business day.
Current Home Report Shows the report that you set as the HomeReport. If you have not set a Home Report,this field shows None.
Related Topics:
myPage
Configuring User Preferences
9-2 User Guide

Related Topics:
Navigation Path Disclaimer
Configuring User Preferences
User Settings 9-3

Configuring User Preferences
9-4 User Guide
10Organizational Hierarchies
An organizational hierarchy provides the structure to an enterprise and its restaurants.The enterprise has only one organizational hierarchy. The hierarchy ensures totalsfrom all locations are available for reports and controls how charts show informationin Reporting and Analytics.
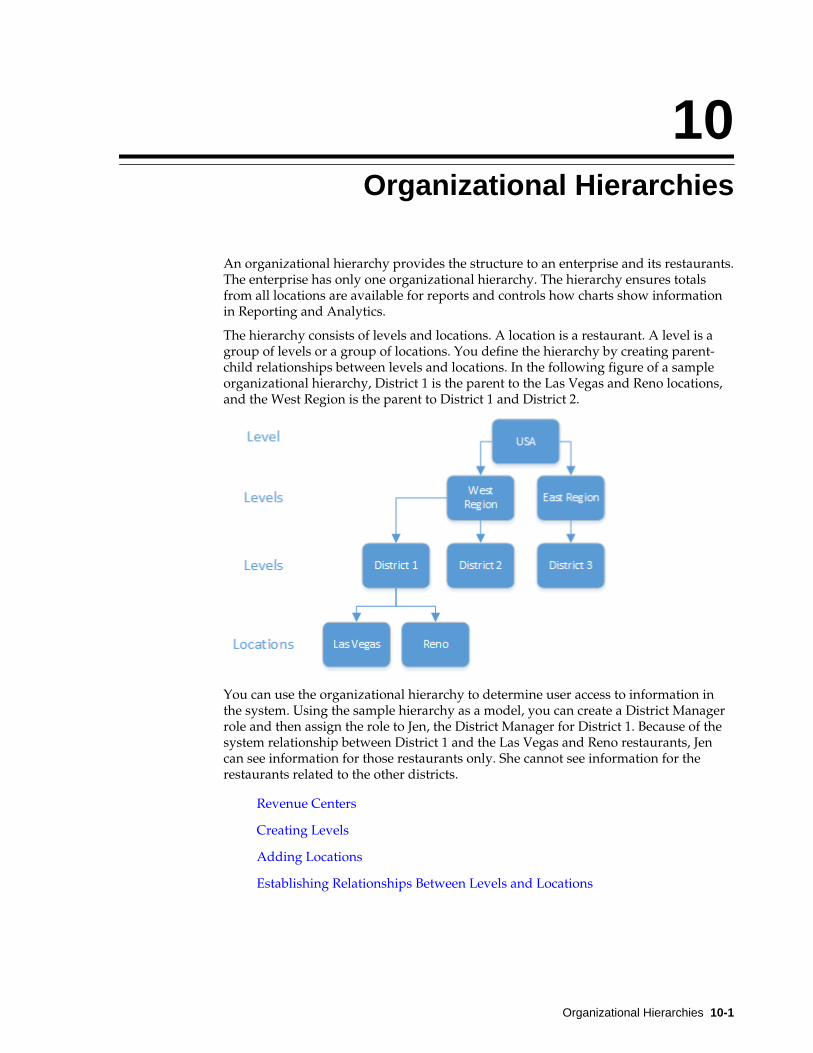
The hierarchy consists of levels and locations. A location is a restaurant. A level is agroup of levels or a group of locations. You define the hierarchy by creating parent-child relationships between levels and locations. In the following figure of a sampleorganizational hierarchy, District 1 is the parent to the Las Vegas and Reno locations,and the West Region is the parent to District 1 and District 2.
You can use the organizational hierarchy to determine user access to information inthe system. Using the sample hierarchy as a model, you can create a District Managerrole and then assign the role to Jen, the District Manager for District 1. Because of thesystem relationship between District 1 and the Las Vegas and Reno restaurants, Jencan see information for those restaurants only. She cannot see information for therestaurants related to the other districts.
Revenue Centers
Creating Levels
Adding Locations
Establishing Relationships Between Levels and Locations
Organizational Hierarchies 10-1
Revenue CentersRevenue centers enable organizations to categorize revenue data by functions within alocation. At a fast food restaurant, each register and the drive-thru are examples ofcost centers. At a table service restaurant, the bar and dining area are examples of costcenters. If your organization is configured for revenue centers, Reporting andAnalytics enables you to filter by revenue center when you modify and run standardreports. You can also filter by revenue center when you use iQuery to work withreporting data in Microsoft Excel.
Creating Levels
1. In Reporting and Analytics, click Portal, click Organizational Structure, and thenclick Levels.
2. Click Add.
3. Type a level name.
For example, type District 1 for a district level or type East to for a regionlevel.
4. Type a level reference to indicate the level position within the organizationalhierarchy.
Use a value of 0 if the level is the highest corporate level in the organization. Usetext or numbers when adding lower levels to the organization. For example, youcan use 10 for one district and 20 for another district.
5. Select the financial calendar for the level.
For example, if the organization uses a financial calendar based on a fiscal year,select the corresponding calendar.
6. Specify values for basic level settings on the form, such as address and postal code,and then click Save.
Related Topics:
Navigation Path Disclaimer
Adding Locations
1. In Reporting and Analytics, click Admin, click Portal, click OrganizationalStructure, and then click Locations.
2. Click Add.
3. In the Name field, type a unique name for the location.
For example, type Columbia for a restaurant location in Columbia, Maryland.
4. In the Location Reference field, type a value to indicate the location positionwithin the organizational hierarchy.
Revenue Centers
10-2 User Guide
You can use a number to indicate the position. For example, if the location is thefourth location in a district level, you can use a value of 4. You can also use text toindicate the position. For example, you can use East for a location on the Easternside of a district level.
5. If the location uses a financial calendar different than the parent level or theorganization, select it from the Financial Calendar drop-down list.
6. Specify values for the remaining settings on the form and then click Save.
Related Topics:
Navigation Path Disclaimer
Establishing Relationships Between Levels and Locations
1. In Reporting and Analytics, click Admin, click Portal, click OrganizationalStructure, and then click Relationships.
2. Select the highest level in the organization, and then click Edit.
3. Select No Parent from the Parent Name drop-down list.
Select No Parent if there is only one level in the organization.
4. Click Save.
5. Select a location and then click Edit.
6. Select the parent level for the location and then click Save.
7. Repeat steps 5 and 6 to establish relationships for the remaining locations.
Related Topics:
Navigation Path Disclaimer
Establishing Relationships Between Levels and Locations
Organizational Hierarchies 10-3

Establishing Relationships Between Levels and Locations
10-4 User Guide
11Currency and Exchange Rate
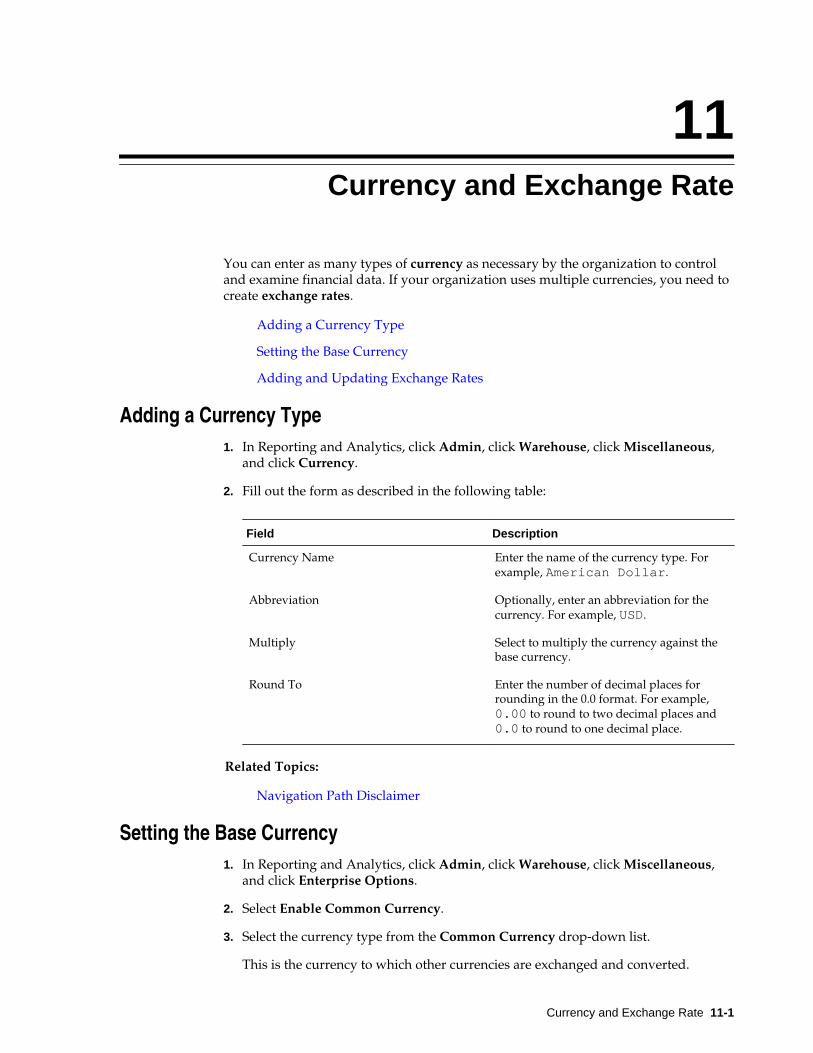
You can enter as many types of currency as necessary by the organization to controland examine financial data. If your organization uses multiple currencies, you need tocreate exchange rates.
Adding a Currency Type
Setting the Base Currency
Adding and Updating Exchange Rates
Adding a Currency Type1. In Reporting and Analytics, click Admin, click Warehouse, click Miscellaneous,
and click Currency.
2. Fill out the form as described in the following table:
Field Description
Currency Name Enter the name of the currency type. Forexample, American Dollar.
Abbreviation Optionally, enter an abbreviation for thecurrency. For example, USD.
Multiply Select to multiply the currency against thebase currency.
Round To Enter the number of decimal places forrounding in the 0.0 format. For example,0.00 to round to two decimal places and0.0 to round to one decimal place.
Related Topics:
Navigation Path Disclaimer
Setting the Base Currency1. In Reporting and Analytics, click Admin, click Warehouse, click Miscellaneous,
and click Enterprise Options.
2. Select Enable Common Currency.
3. Select the currency type from the Common Currency drop-down list.
This is the currency to which other currencies are exchanged and converted.
Currency and Exchange Rate 11-1
Related Topics:
Navigation Path Disclaimer
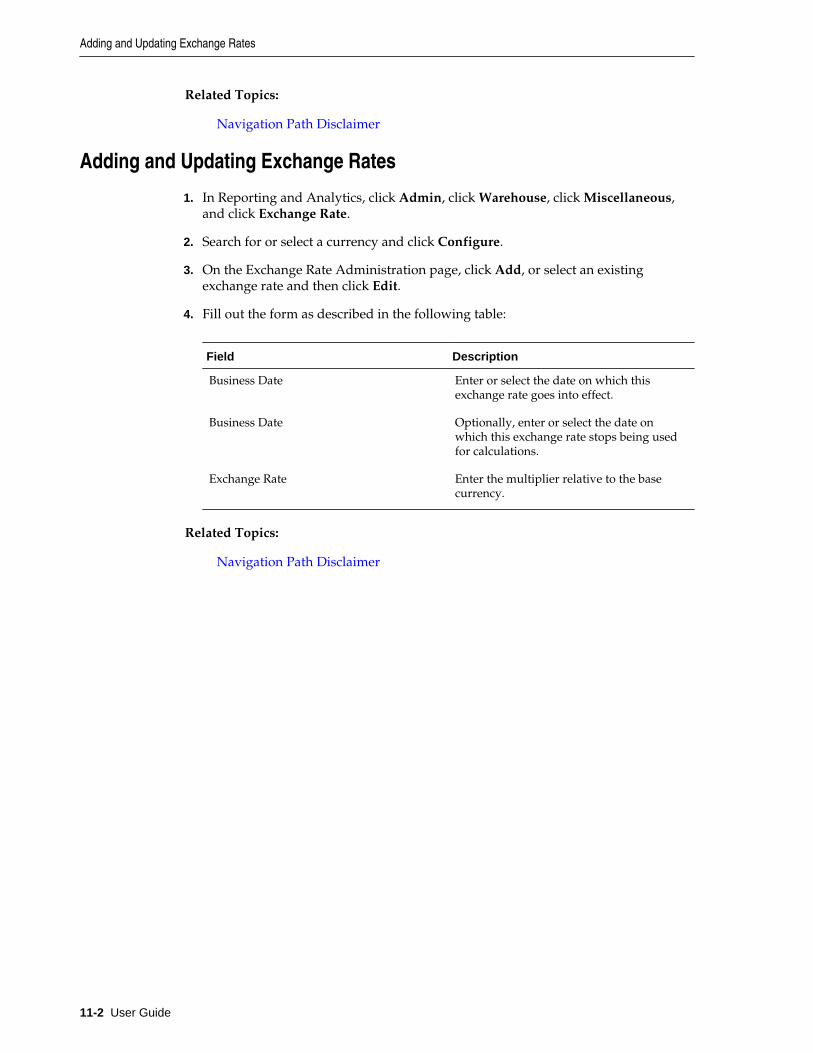
Adding and Updating Exchange Rates
1. In Reporting and Analytics, click Admin, click Warehouse, click Miscellaneous,and click Exchange Rate.
2. Search for or select a currency and click Configure.
3. On the Exchange Rate Administration page, click Add, or select an existingexchange rate and then click Edit.
4. Fill out the form as described in the following table:
Field Description
Business Date Enter or select the date on which thisexchange rate goes into effect.
Business Date Optionally, enter or select the date onwhich this exchange rate stops being usedfor calculations.
Exchange Rate Enter the multiplier relative to the basecurrency.
Related Topics:
Navigation Path Disclaimer
Adding and Updating Exchange Rates
11-2 User Guide
12Users and Roles
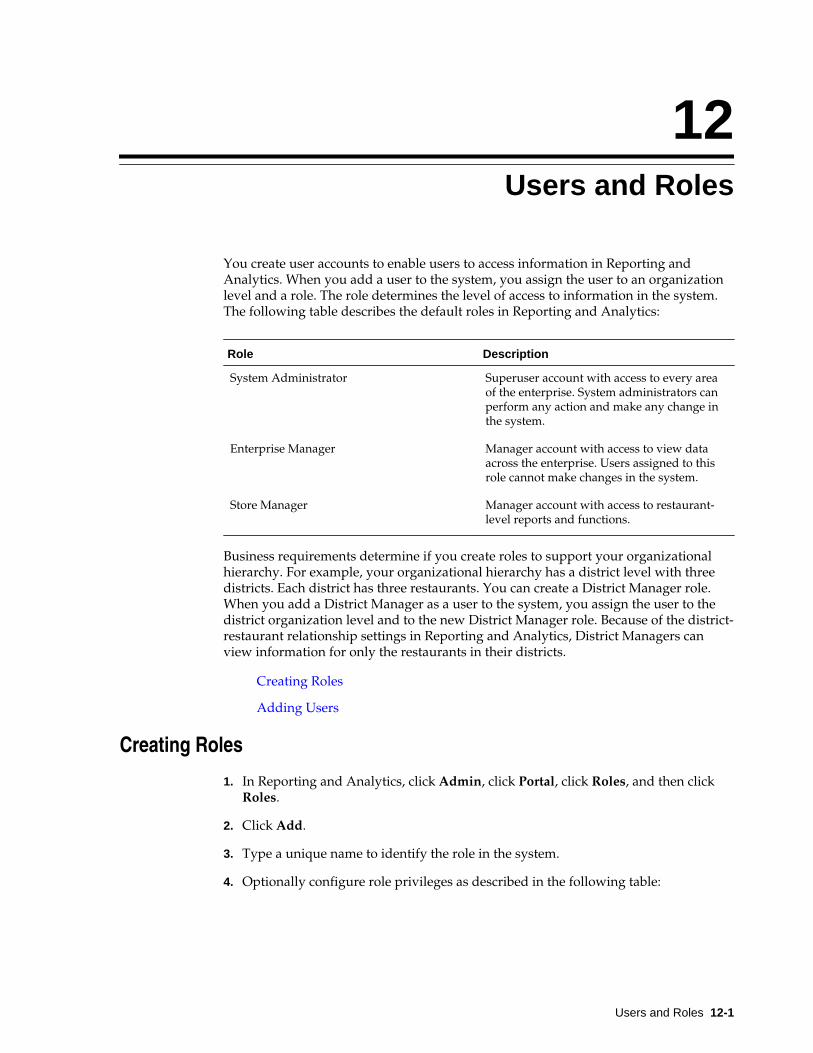
You create user accounts to enable users to access information in Reporting andAnalytics. When you add a user to the system, you assign the user to an organizationlevel and a role. The role determines the level of access to information in the system.The following table describes the default roles in Reporting and Analytics:
Role Description
System Administrator Superuser account with access to every areaof the enterprise. System administrators canperform any action and make any change inthe system.
Enterprise Manager Manager account with access to view dataacross the enterprise. Users assigned to thisrole cannot make changes in the system.
Store Manager Manager account with access to restaurant-level reports and functions.
Business requirements determine if you create roles to support your organizationalhierarchy. For example, your organizational hierarchy has a district level with threedistricts. Each district has three restaurants. You can create a District Manager role.When you add a District Manager as a user to the system, you assign the user to thedistrict organization level and to the new District Manager role. Because of the district-restaurant relationship settings in Reporting and Analytics, District Managers canview information for only the restaurants in their districts.
Creating Roles
Adding Users
Creating Roles
1. In Reporting and Analytics, click Admin, click Portal, click Roles, and then clickRoles.
2. Click Add.
3. Type a unique name to identify the role in the system.
4. Optionally configure role privileges as described in the following table:
Users and Roles 12-1
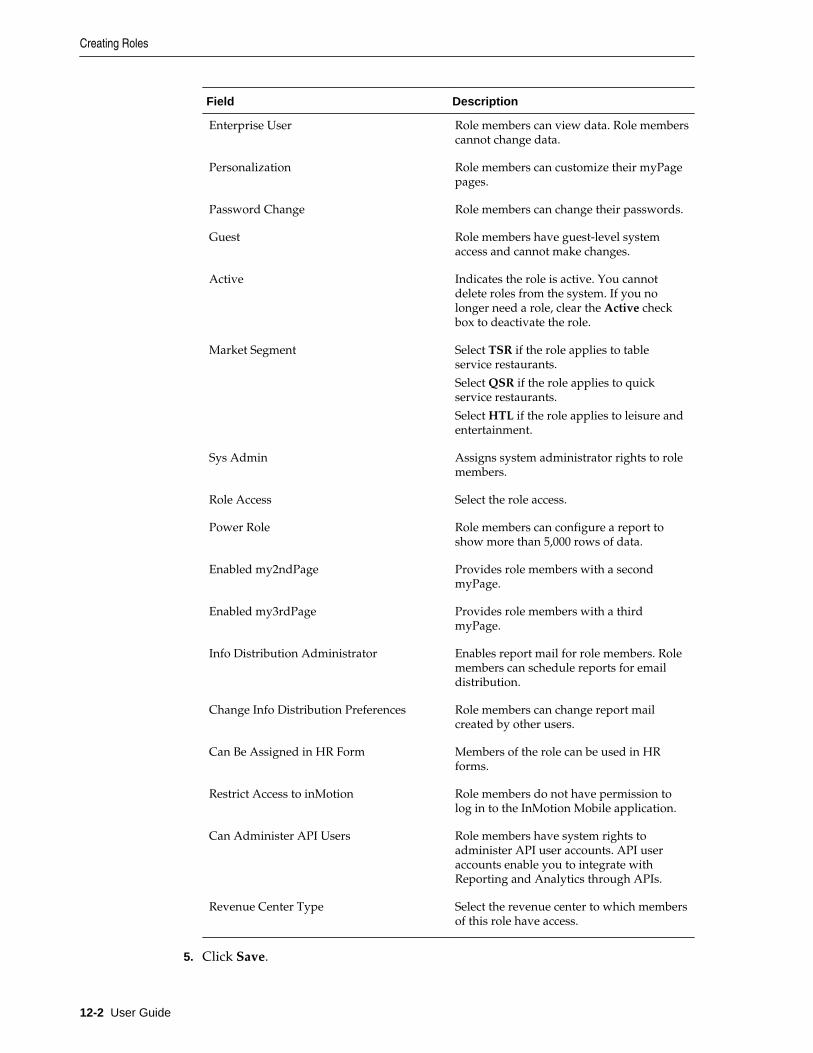
Field Description
Enterprise User Role members can view data. Role memberscannot change data.
Personalization Role members can customize their myPagepages.
Password Change Role members can change their passwords.
Guest Role members have guest-level systemaccess and cannot make changes.
Active Indicates the role is active. You cannotdelete roles from the system. If you nolonger need a role, clear the Active checkbox to deactivate the role.
Market Segment Select TSR if the role applies to tableservice restaurants.
Select QSR if the role applies to quickservice restaurants.
Select HTL if the role applies to leisure andentertainment.
Sys Admin Assigns system administrator rights to rolemembers.
Role Access Select the role access.
Power Role Role members can configure a report toshow more than 5,000 rows of data.
Enabled my2ndPage Provides role members with a secondmyPage.
Enabled my3rdPage Provides role members with a thirdmyPage.
Info Distribution Administrator Enables report mail for role members. Rolemembers can schedule reports for emaildistribution.
Change Info Distribution Preferences Role members can change report mailcreated by other users.
Can Be Assigned in HR Form Members of the role can be used in HRforms.
Restrict Access to inMotion Role members do not have permission tolog in to the InMotion Mobile application.
Can Administer API Users Role members have system rights toadminister API user accounts. API useraccounts enable you to integrate withReporting and Analytics through APIs.
Revenue Center Type Select the revenue center to which membersof this role have access.
5. Click Save.
Creating Roles
12-2 User Guide
Related Topics:
Navigation Path Disclaimer
Adding Users
1. In Reporting and Analytics, click Admin, click Portal, click Users, and then clickUsers.
2. Click Add and then specify basic user information on the form, such as the logonname and password.
3. Select the user role from the Role drop-down list.
The user inherits the system privileges associated with the role.
4. Select the organization level from the Org Level drop-down list.
The level you select determines the level of access to information in the system. Forexample, if you are adding a District Manager, the District Manager can accessinformation for all the locations related to the level. If you are adding a storemanager and you want to restrict access to a specific store, select the store from thedrop-down list.
5. To use the account to integrate with Reporting and Analytics through APIs, selectAPI User, and then click Save.
Related Topics:
Navigation Path Disclaimer
Adding Users
Users and Roles 12-3

Adding Users
12-4 User Guide
13End User Access to Content
Reporting and Analytics uses portlets to control user access to functionality andinformation in the system. End users access portlets from side menus on the Reportingand Analytics home page. A report is an example of a portlet. After you create thereport portlet, you assign it to a role so users who belong to the role can access thereport from the side menu.
Creating Portlets
Assigning Portlets to Roles
Assigning Side Menus to Roles
Assigning Reports to Roles
Installing Remote Transfer Agent (RTA) at a Location
Outage Alerts
Setting Outage Alert Recipients
Creating Portlets
1. In Reporting and Analytics, click Admin, click Portal, click Portlets, and then clickPortlets.
2. Click Add.
3. Configure the portlet as described in the following table:
Field Description
Name Type a unique name for the portlet. Forexample, when creating a report portlet,type the report name that appears in theReporting and Analytics side menu.
Type Select the portlet type. For example, selectReport to create a report portlet.
URL Type or select the portlet URL.
The portlet type you select determines thevalues that appear in the URL drop-downlist. For example, if you select Report fromthe Type drop-down list, system reportsappear in the URL drop-down list.
Description Type a description of the portlet.
End User Access to Content 13-1
Field Description
myPage Title Type the title for the portlet that appears onthe user myPage.
Effective Dates Select a start date for the portlet.
to Select an end date for the portlet. Theportlet expires on the date you select.
Related Topics:
Navigation Path Disclaimer
Assigning Portlets to Roles
1. In Reporting and Analytics, click Admin, click Portal, click Roles, and then clickPortlets.
2. Select the role, and then click Configure.
3. Click Add.
4. Configure settings as described in the following table:
Field Description
Portlet Select the portlet.
Side Menu Title Select the side menu in which the portletappears on the Reporting and Analyticshome page.
Sort Order Specify the order in which the portletappears in the side menu. For example, ifyou type 1, the portlet is the first portletlisted in the side menu.
Hide Hides the portlet in the side menu.
Enable myPage Enables users to add the portlet when theycustomize their myPage.
5. Click Save.
Related Topics:
Navigation Path Disclaimer
Assigning Side Menus to Roles
1. In Reporting and Analytics, click Admin, click Portal, click Roles, and then clickSide Menus.
2. Select the role, and then click Configure.
Assigning Portlets to Roles
13-2 User Guide
3. Click Add.
4. Type a side menu title.
5. Type a side menu number.
The number determines the order in which the menu appears in the Reporting andAnalytics navigation pane. For example, if you type 1, the menu is the first menulisted in the navigation pane on the Reporting and Analytics home page.
6. Click Save.
Related Topics:
Navigation Path Disclaimer
Assigning Reports to Roles
1. In Reporting and Analytics, click Admin, click Warehouse, click Reports, and thenclick Report Roles.
2. Select the role, and then click Select.
3. Click Add.
4. Select the report, and then click Save.
Related Topics:
Navigation Path Disclaimer
Installing Remote Transfer Agent (RTA) at a Location
1. Make sure you know the your location ID and download password:
a. In Reporting and Analytics, click Reports, click More Reports, click AdminReports, and then click Download Report.
b. Make a note of the Restaurant ID for your location.
c. Navigate to .Connect Admin or RTA Admin depending on your systemconfigurations, select your location, and select Display Password.
If .Connect Admin or RTA Admin do not populate a list of locations, you donot have the Can View Download passwords portlet permission enabled foryour role.
d. Make a note of the Download Password.
2. Download and install the Remote Transfer Agent (RTA) for your location:
a. In Reporting and Analytics, click Admin, and then click Store Download.
b. Enter the Restaurant ID and the Download Password, and then click Next.
If the installation fails, Reporting and Analytics shows the error log in a texteditor.
Assigning Reports to Roles
End User Access to Content 13-3
Related Topics:
Navigation Path Disclaimer
Outage AlertsSystem administrators can configure Reporting and Analytics to send an email whencommunication with the hosting center fails. If there is no communication outage,Reporting and Analytics sends an email every two hours with the status All OK.
Setting Outage Alert Recipients
1. In Reporting and Analytics, click Admin, click Portal, click Alerts, and then clickOutage Alerts.
2. Enter up to four recipient email addresses and then click Save.
Related Topics:
Navigation Path Disclaimer
Outage Alerts
13-4 User Guide
14Fiscal and Business Time Intervals
You can define the following time intervals for the Reporting and Analytics financialcalendar and reports:
• Financial Calendars: you can create and configure a container to hold settings forfiscal years and periods.
• Financial Periods or Accounting Periods: you can create and add financial years toa calendar, and you can configure the quarters, parts, and weeks in each year.
• Day Parts: you can configure the hourly breakdown of each business day. DayParts typically are comprised of periods of time such as lunch and brunch, mustspan the whole 24-hour period, must account for all days in a week, and cannotoverlap.
For example, if a restaurant designates 11:00 AM to 4:00 PM as the lunch periodevery day, but designates 10:00 AM to 2:00 PM as the brunch period on Sundays,you must create a day part from 10:00 AM to 1:59 PM for the Sunday brunch periodand a 2:00 PM to 3:59 PM day part for the Sunday lunch period.
You can define and align calculations with your organization’s fiscal year and fiscalperiods using financial calenders, or calenders partitioned for accounting purposes.Each calender contains a set of fiscal years, with each year broken up into financialperiods and business weeks.
All levels and locations in the organizations are assigned to a default financialcalendar and can be configured to adhere to customized financial calenders.
Setting Up a Financial Calendar
Creating a Financial Year
Creating Day Parts
Overriding Day Parts
Setting Up a Financial Calendar
1. Create the Financial Calendar for your organization or location:
a. In Reporting and Analytics, click Admin, click Warehouse, click Miscellaneous,and then click Financial Calendars.
b. Click Add, enter a Name for the calendar, and then click Save.
2. Add a financial year to the calendar:
a. In Reporting and Analytics, click Admin, click Warehouse, click Miscellaneous,and then click Financial Periods.
Fiscal and Business Time Intervals 14-1
b. Select the financial calendar and click Configure.
c. Click Add Year Automatically to use the creation wizard, or click Add YearManually to manually enter all financial year.
3. Set the Financial Calendar field for locations and levels in the organization.
Locations inherit the financial calendar setting for the level to which they belong.You can set an overriding financial calendar directly for the location.
Related Topics:
Navigation Path Disclaimer
Creating a Financial Year
1. In Reporting and Analytics, click Admin, click Warehouse, click Miscellaneous,and then click Financial Period.
2. Select the calendar for which you want to define the financial periods and thenclick Configure.
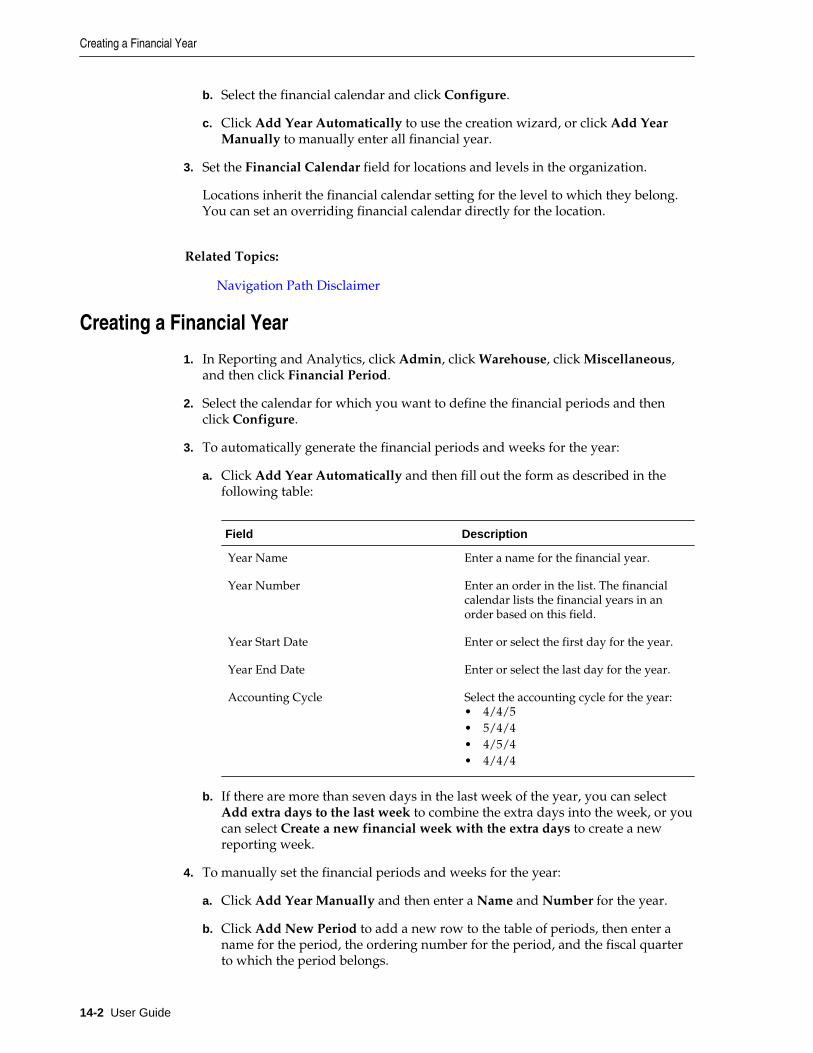
3. To automatically generate the financial periods and weeks for the year:
a. Click Add Year Automatically and then fill out the form as described in thefollowing table:
Field Description
Year Name Enter a name for the financial year.
Year Number Enter an order in the list. The financialcalendar lists the financial years in anorder based on this field.
Year Start Date Enter or select the first day for the year.
Year End Date Enter or select the last day for the year.
Accounting Cycle Select the accounting cycle for the year:• 4/4/5• 5/4/4• 4/5/4• 4/4/4
b. If there are more than seven days in the last week of the year, you can selectAdd extra days to the last week to combine the extra days into the week, or youcan select Create a new financial week with the extra days to create a newreporting week.
4. To manually set the financial periods and weeks for the year:
a. Click Add Year Manually and then enter a Name and Number for the year.
b. Click Add New Period to add a new row to the table of periods, then enter aname for the period, the ordering number for the period, and the fiscal quarterto which the period belongs.
Creating a Financial Year
14-2 User Guide
c. Click Add New Week to add a new row to the table of weeks, then enter a namefor the week, the ordering number for the week, the period to which the weekbelongs, the starting date of the week, and the ending date of the week.
Related Topics:
Navigation Path Disclaimer
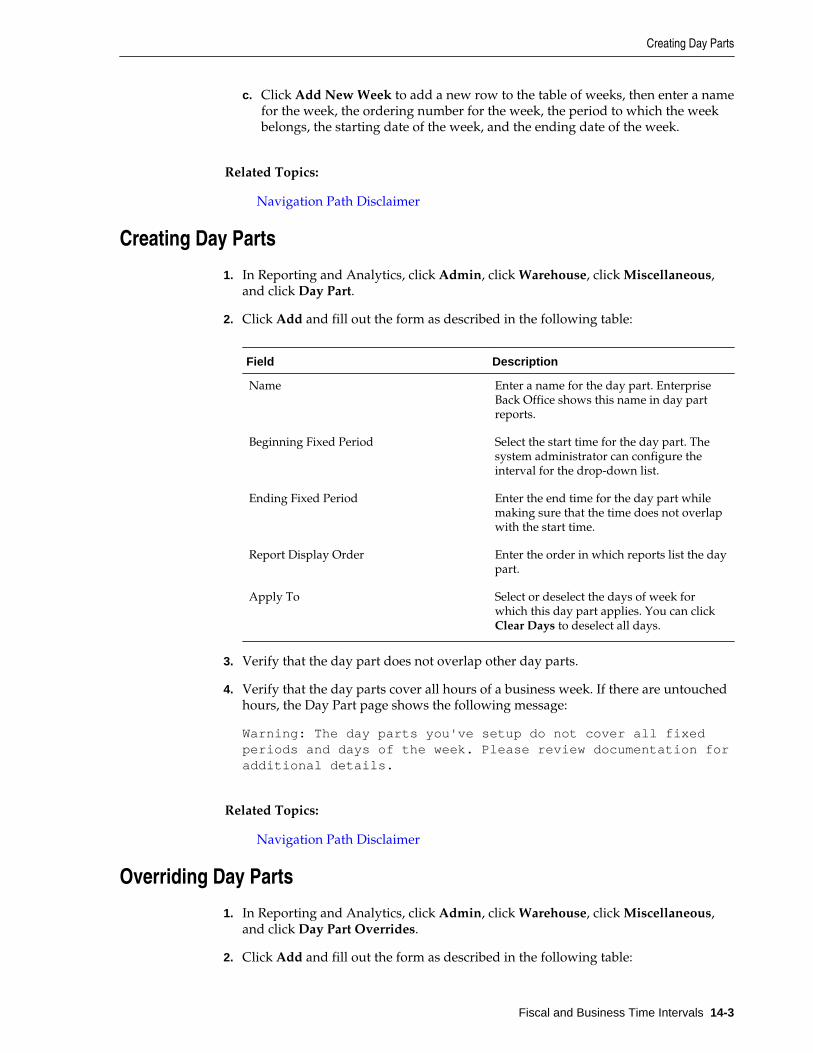
Creating Day Parts
1. In Reporting and Analytics, click Admin, click Warehouse, click Miscellaneous,and click Day Part.
2. Click Add and fill out the form as described in the following table:
Field Description
Name Enter a name for the day part. EnterpriseBack Office shows this name in day partreports.
Beginning Fixed Period Select the start time for the day part. Thesystem administrator can configure theinterval for the drop-down list.
Ending Fixed Period Enter the end time for the day part whilemaking sure that the time does not overlapwith the start time.
Report Display Order Enter the order in which reports list the daypart.
Apply To Select or deselect the days of week forwhich this day part applies. You can clickClear Days to deselect all days.
3. Verify that the day part does not overlap other day parts.
4. Verify that the day parts cover all hours of a business week. If there are untouchedhours, the Day Part page shows the following message:
Warning: The day parts you've setup do not cover all fixedperiods and days of the week. Please review documentation foradditional details.
Related Topics:
Navigation Path Disclaimer
Overriding Day Parts
1. In Reporting and Analytics, click Admin, click Warehouse, click Miscellaneous,and click Day Part Overrides.
2. Click Add and fill out the form as described in the following table:
Creating Day Parts
Fiscal and Business Time Intervals 14-3
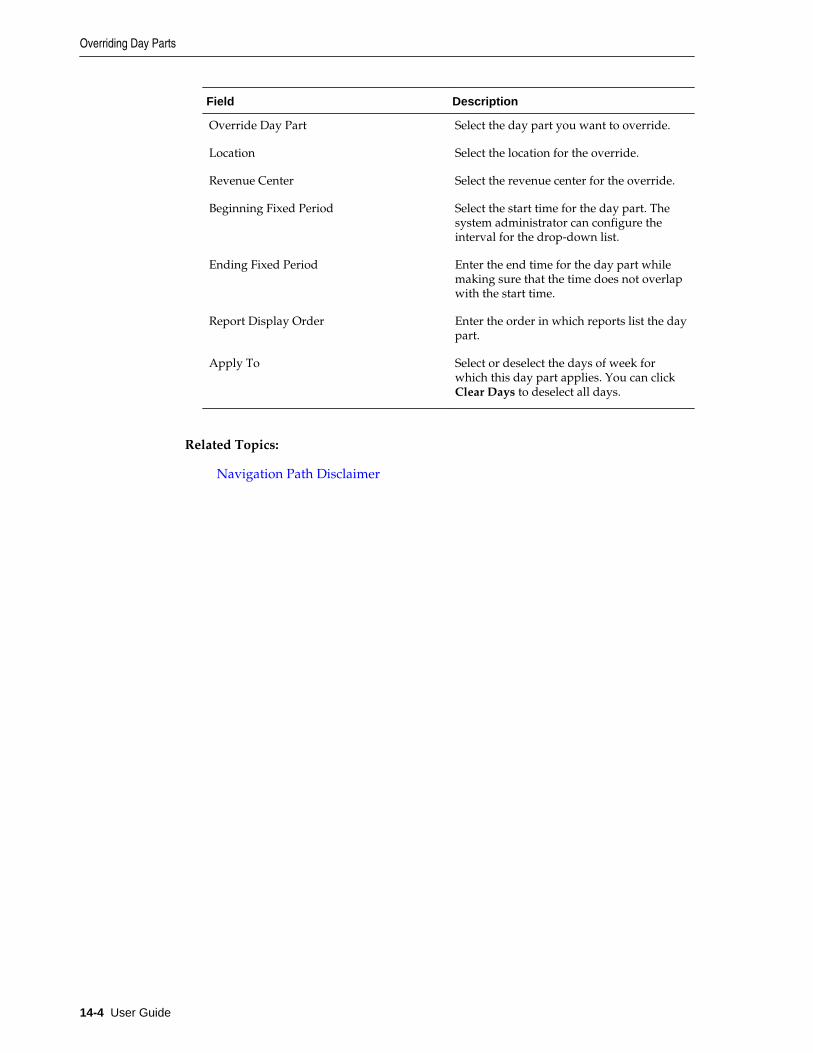
Field Description
Override Day Part Select the day part you want to override.
Location Select the location for the override.
Revenue Center Select the revenue center for the override.
Beginning Fixed Period Select the start time for the day part. Thesystem administrator can configure theinterval for the drop-down list.
Ending Fixed Period Enter the end time for the day part whilemaking sure that the time does not overlapwith the start time.
Report Display Order Enter the order in which reports list the daypart.
Apply To Select or deselect the days of week forwhich this day part applies. You can clickClear Days to deselect all days.
Related Topics:
Navigation Path Disclaimer
Overriding Day Parts
14-4 User Guide
15Reason Codes
Point-of-Sale operations such as voids, returns, time card adjustments, pay ratechanges, and leaves of absence typically require the manager or employee to enter areason. You can use Enterprise Reason Codes to define and configure types of reasonsand to define the available predefined reasons that managers and employees canselect.
Creating Reason Codes
Creating Reason Codes
1. In Reporting and Analytics, click Admin, click Warehouse, click Miscellaneous,and click Enterprise Reason Codes.
2. Select the action and then click Select. For example, you can select Time CardAdjustments to configure the list of reasons available to managers when theyjustify changes to a time card.
3. Click Add, or select an existing reason and click Edit to open the reasonconfiguration form.
4. Enter the reason in the Reason Code field.
5. To set the code as the default for the action, select Default and then click Save.
Related Topics:
Navigation Path Disclaimer
Reason Codes 15-1

Creating Reason Codes
15-2 User Guide
16Reporting Hierarchies
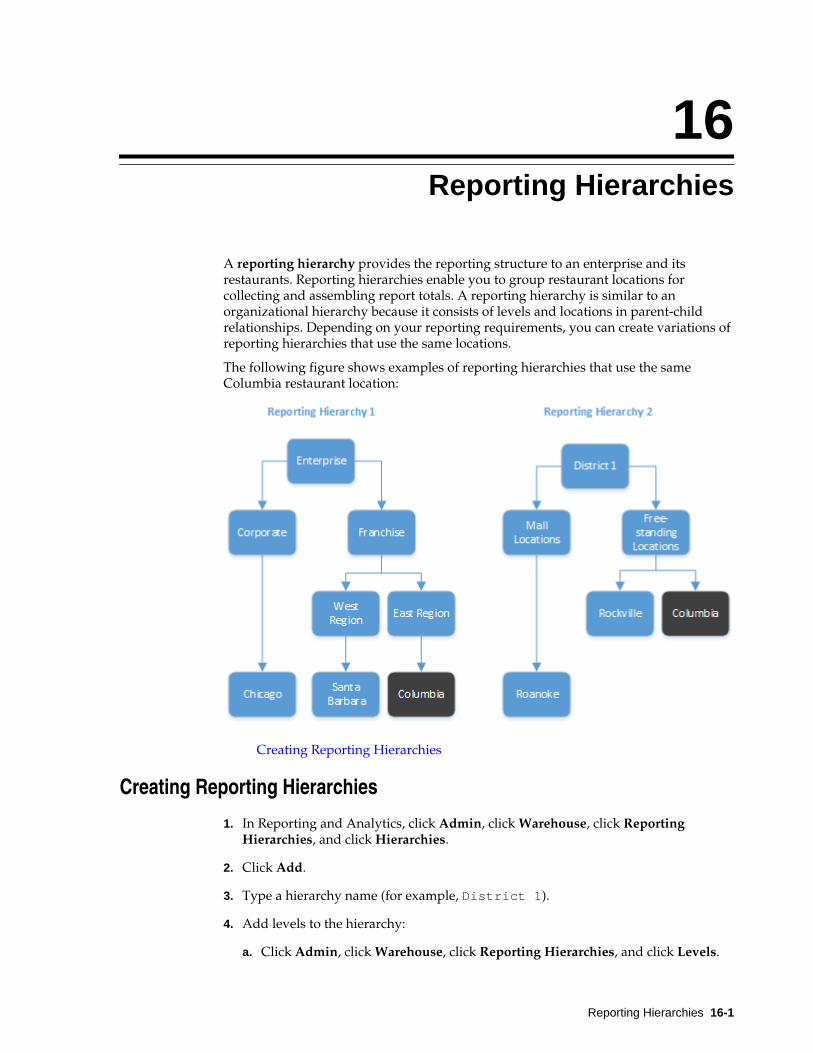
A reporting hierarchy provides the reporting structure to an enterprise and itsrestaurants. Reporting hierarchies enable you to group restaurant locations forcollecting and assembling report totals. A reporting hierarchy is similar to anorganizational hierarchy because it consists of levels and locations in parent-childrelationships. Depending on your reporting requirements, you can create variations ofreporting hierarchies that use the same locations.
The following figure shows examples of reporting hierarchies that use the sameColumbia restaurant location:
Creating Reporting Hierarchies
Creating Reporting Hierarchies
1. In Reporting and Analytics, click Admin, click Warehouse, click ReportingHierarchies, and click Hierarchies.
2. Click Add.
3. Type a hierarchy name (for example, District 1).
4. Add levels to the hierarchy:
a. Click Admin, click Warehouse, click Reporting Hierarchies, and click Levels.
Reporting Hierarchies 16-1
b. Click Add.
c. Type a reporting level name (for example, Free-standing).
d. Click Save.
e. Repeat these substeps to add more levels.
5. Establish relationships between levels:
a. Click Admin, click Warehouse, click Reporting Hierarchies, and clickRelationships.
b. Select the reporting hierarchy name and then click Select.
c. Click Assign Level.
d. Select the level (for example, Free-standing).
e. Select the parent level. If the level you are assigning is the first level, select NoParent from the Parent Level Name drop-down list.
f. Click Assign Level.
g. Repeat these substeps to assign more levels.
6. Establish relationships between levels and locations:
a. Click Assign Location.
b. Select the location (for example, Columbia).
c. Select the parent level for the location (for example, Free-standing).
d. Click Assign Location.
e. Repeat these substeps to establish remaining level-location relationships.
Related Topics:
Navigation Path Disclaimer
Creating Reporting Hierarchies
16-2 User Guide
17Item Alignment
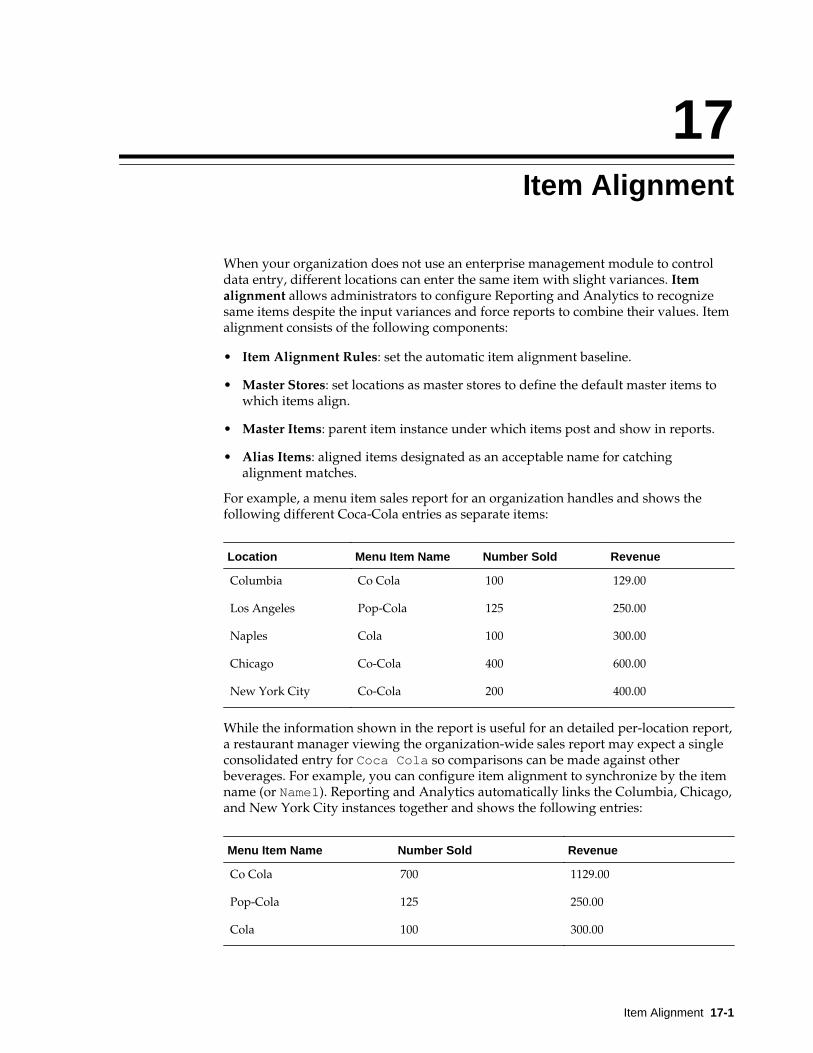
When your organization does not use an enterprise management module to controldata entry, different locations can enter the same item with slight variances. Itemalignment allows administrators to configure Reporting and Analytics to recognizesame items despite the input variances and force reports to combine their values. Itemalignment consists of the following components:
• Item Alignment Rules: set the automatic item alignment baseline.
• Master Stores: set locations as master stores to define the default master items towhich items align.
• Master Items: parent item instance under which items post and show in reports.
• Alias Items: aligned items designated as an acceptable name for catchingalignment matches.
For example, a menu item sales report for an organization handles and shows thefollowing different Coca-Cola entries as separate items:
Location Menu Item Name Number Sold Revenue
Columbia Co Cola 100 129.00
Los Angeles Pop-Cola 125 250.00
Naples Cola 100 300.00
Chicago Co-Cola 400 600.00
New York City Co-Cola 200 400.00
While the information shown in the report is useful for an detailed per-location report,a restaurant manager viewing the organization-wide sales report may expect a singleconsolidated entry for Coca Cola so comparisons can be made against otherbeverages. For example, you can configure item alignment to synchronize by the itemname (or Name1). Reporting and Analytics automatically links the Columbia, Chicago,and New York City instances together and shows the following entries:
Menu Item Name Number Sold Revenue
Co Cola 700 1129.00
Pop-Cola 125 250.00
Cola 100 300.00
Item Alignment 17-1
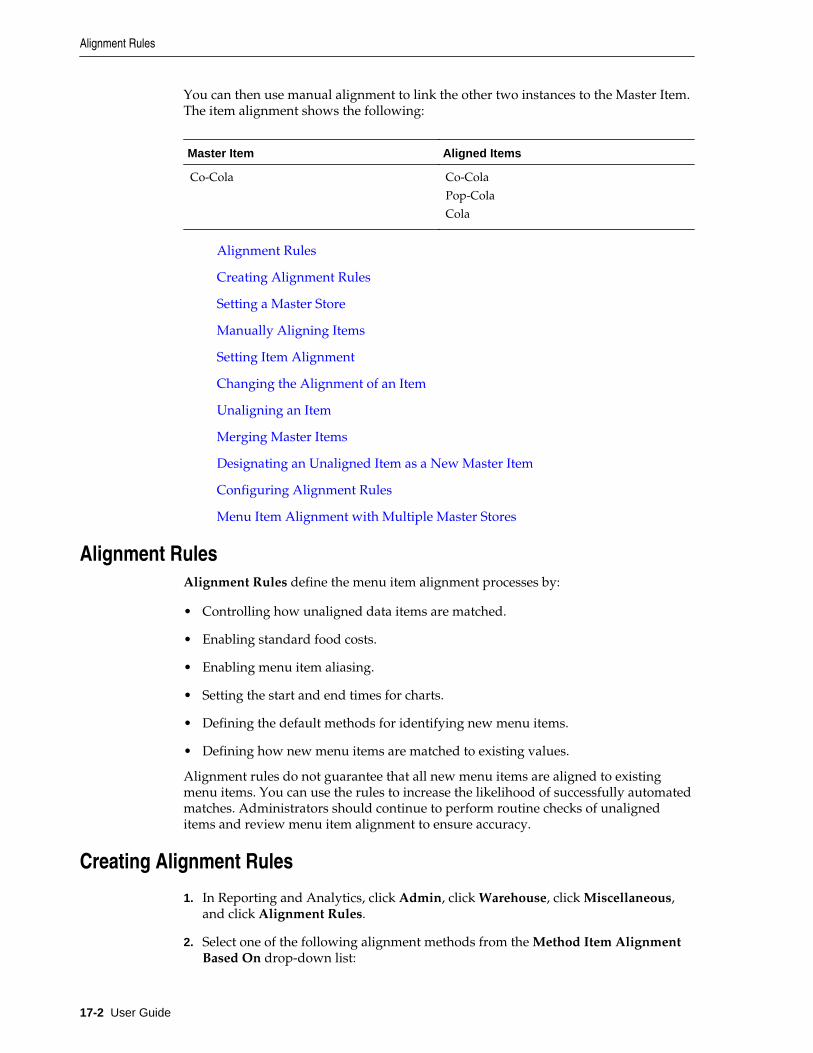
You can then use manual alignment to link the other two instances to the Master Item.The item alignment shows the following:
Master Item Aligned Items
Co-Cola Co-Cola
Pop-Cola
Cola
Alignment Rules
Creating Alignment Rules
Setting a Master Store
Manually Aligning Items
Setting Item Alignment
Changing the Alignment of an Item
Unaligning an Item
Merging Master Items
Designating an Unaligned Item as a New Master Item
Configuring Alignment Rules
Menu Item Alignment with Multiple Master Stores
Alignment RulesAlignment Rules define the menu item alignment processes by:
• Controlling how unaligned data items are matched.
• Enabling standard food costs.
• Enabling menu item aliasing.
• Setting the start and end times for charts.
• Defining the default methods for identifying new menu items.
• Defining how new menu items are matched to existing values.
Alignment rules do not guarantee that all new menu items are aligned to existingmenu items. You can use the rules to increase the likelihood of successfully automatedmatches. Administrators should continue to perform routine checks of unaligneditems and review menu item alignment to ensure accuracy.
Creating Alignment Rules
1. In Reporting and Analytics, click Admin, click Warehouse, click Miscellaneous,and click Alignment Rules.
2. Select one of the following alignment methods from the Method Item AlignmentBased On drop-down list:
Alignment Rules
17-2 User Guide
• POS Number
• Name 1
• Name 2
• Name 1 and POS Number
3. Select one of the following general alignment methods from the GeneralAlignment Type drop-down list:
• POS Item Number Only
• POS Name Only
• POS Item Number and Name
4. Select one of the following back-of-house alignment methods from the BOH AlignType drop-down list:
• POS Item Number Only
• POS Name Only
• POS Item Number and Name
5. Enter the start and end time for all charts in the portal using the 24-hour format.
6. Enter the default food cost percentage for when a percentage is not included in theMaster table or the data posted from the POS.
7. Select how the system handles new menu items from the Menu Item NameChange drop-down list:
• Replace an Old Name
• Create a New Menu Item
8. Enter the Number of Attempts to be made to align each menu item.
9. Select Enable Menu Item Aliasing to allow one menu item to link to multiplepossible names.
10. Select Enable Other Table Aliasing to allow unaligned menu items to alias withitems found in other database tables.
Related Topics:
Navigation Path Disclaimer
Setting a Master Store
1. In Reporting and Analytics, click Admin, click Warehouse, click Miscellaneous,and click Store Master.
2. Click Add, fill out the form, and then click Save.
Setting a Master Store
Item Alignment 17-3
3. When configuring more than one Master Store, enter the Beginning Menu ItemNumber and Ending Menu Item Number to define the range of menu itemsgoverned by the current Master Store.
4. Click All Subject Areas if you want the Master Store to define Master Items for allitem types, such as discounts and order types.
5. Click BOH Tables Flag to enable product management.
Related Topics:
Navigation Path Disclaimer
Manually Aligning Items
1. In Reporting and Analytics, click Admin, click Warehouse, click Alignment, andclick the type of database item. In the alignment window, you can:
• Hold the Shift key to select multiple items.
• Click Options and filter the list of master items.
• Click Options and configure the columns shown in the Unaligned Items andAligned Items tabs.
• Click Run Alignment to run the alignment process immediately.
2. Perform the following actions:
• Setting Item Alignment
• Changing the Alignment of an Item
• Unaligning an Item
• Merging Master Items
• Designating an Unaligned Item as a New Master Item
• Configuring Alignment Rules
Related Topics:
Navigation Path Disclaimer
Setting Item Alignment
1. Click the master item from the Master Items list.
2. Click the unaligned item from the Unaligned Items tab and then click Align.
Related Topics:
Navigation Path Disclaimer
Manually Aligning Items
17-4 User Guide
Changing the Alignment of an Item
1. Click the master item from the Master Items list.
2. Click the item from the Aligned Items tab and then click Transfer.
3. In the Select destination master item window, click the destination master item,and then click OK.
Related Topics:
Navigation Path Disclaimer
Unaligning an Item
1. Click the master item from the Master Items list.
2. Click the item from the Aligned Items tab and then click Unalign.
Related Topics:
Navigation Path Disclaimer
Merging Master Items
1. Click the master items from the Master Items list and then click Merge.
2. In the Select master item dialog box, click the master item you want to keep, andthen click OK.
Related Topics:
Navigation Path Disclaimer
Designating an Unaligned Item as a New Master Item
1. Click an item from the Unaligned Items tab and then click Create Master.
2. Fill out the Create Master form to define the Master Item and then click OK.
Related Topics:
Navigation Path Disclaimer
Configuring Alignment Rules
1. Click Modify Rules.
2. Fill out the form and then click Create.
Changing the Alignment of an Item
Item Alignment 17-5
You can enter the characters to remove or ignore during the alignment process,such as slashes (/) and apostrophes (‘).
Related Topics:
Navigation Path Disclaimer
Menu Item Alignment with Multiple Master StoresWhen your organization does not present a uniform menu across all locations,designating a single Master Store may not account for all available menu itemsthroughout the organization. For example:
• The Washington D.C. location, set as the Master Store, serves hamburgers, seafood,and soft drinks.
• The New York location serves hamburgers, seafood, soft drinks, and alcoholicbeverages.
• The Michigan location serves hamburgers, meat loaf, soft drinks, and alcoholicbeverages.
In this scenario, the Washington D.C. location does not provide a Master Item for thealcoholic beverages nor meat loaf. Instead of using the Menu Item Alignment portletto create Master Items, you can assign the New York location to function as the MasterStore for alcoholic beverages, and likewise the Michigan location to function as theMaster Store for meat loaf.
Menu Item Alignment with Multiple Master Stores
17-6 User Guide
18Category Groups
Category Groups organize database items to control the scope of reports. For example,Reporting and Analytics considers the Major menu item groups and Family menuitem groups used in many Point-of-Sale applications as category groups and allowsusers to run reports against one or both groups. Reporting and Analytics does notlimit the number of category groups that you can use and allows you to organize thecategory groups in Category Group Hierarchies so you can run reports againstmultiple category groups.
For example, one location combines beer, wine, and liquor into the Alcohol group.Another location has a combined group named Beverages but also organizes eachbeverage by type, so they have a Beer group consisting of domestic, import, anddraft. You can use category groups to create a unified set of groups and hierarchies toconsolidate information from different systems and produce accurate reports.
Creating Category Groups
Creating Category Group Hierarchies
Creating Category Groups
1. In Reporting and Analytics, click Admin, click Warehouse, click Category Groups,and click Category Groups.
2. Enter a name for the category group and then click Save.
Related Topics:
Navigation Path Disclaimer
Creating Category Group Hierarchies
1. To create a category group hierarchy:
a. In Reporting and Analytics, click Admin, click Warehouse, click CategoryGroups, and click Hierarchies.
b. Click Add and then enter a name for the hierarchy.
c. Select the category type from the drop-down list and then click Save.
2. To add category groups to the hierarchy and to configure parent-childrelationships:
a. In Reporting and Analytics, click Admin, click Warehouse, click CategoryGroups, and click Relationships.
Category Groups 18-1
b. Select the hierarchy and then click Select.
c. To add a category group to the hierarchy, click Assign Group, select the groupand the parent, and click Save.
d. To change the parent-child relationship of a group, select the child group, clickEdit, change the parent group, and click Save.
Related Topics:
Navigation Path Disclaimer
Creating Category Group Hierarchies
18-2 User Guide
19Cost Tiers
A cost tier is a saved set of menu items typically associated with a vendor or source.For example, you can create a cost tier for four different produce suppliers and thenassign the menu item Lettuce to each cost tier.
Creating Cost Tiers
Assigning Menu Items to Cost Tiers
Creating Cost Tiers
1. In Reporting and Analytics, click Admin, click Warehouse, click Miscellaneous,and click Cost Tier.
2. Click Add, fill out the form, and click Save.
3. You can enter an external database reference link for custom development.
Related Topics:
Navigation Path Disclaimer
Assigning Menu Items to Cost Tiers
1. In Reporting and Analytics, click Admin, click Warehouse, click Miscellaneous,and click Menu Item Cost Tier.
2. Select the Point-of-Sale Major Group, Family Group, or an applicable Reportingand Analytics Category Group.
3. Select the group or category from the drop-down list.
4. Select the menu item and then click Select.
5. Click Add, select the Cost Tier from the drop-down list, fill out the form, and clickSave.
Related Topics:
Navigation Path Disclaimer
Cost Tiers 19-1

Assigning Menu Items to Cost Tiers
19-2 User Guide
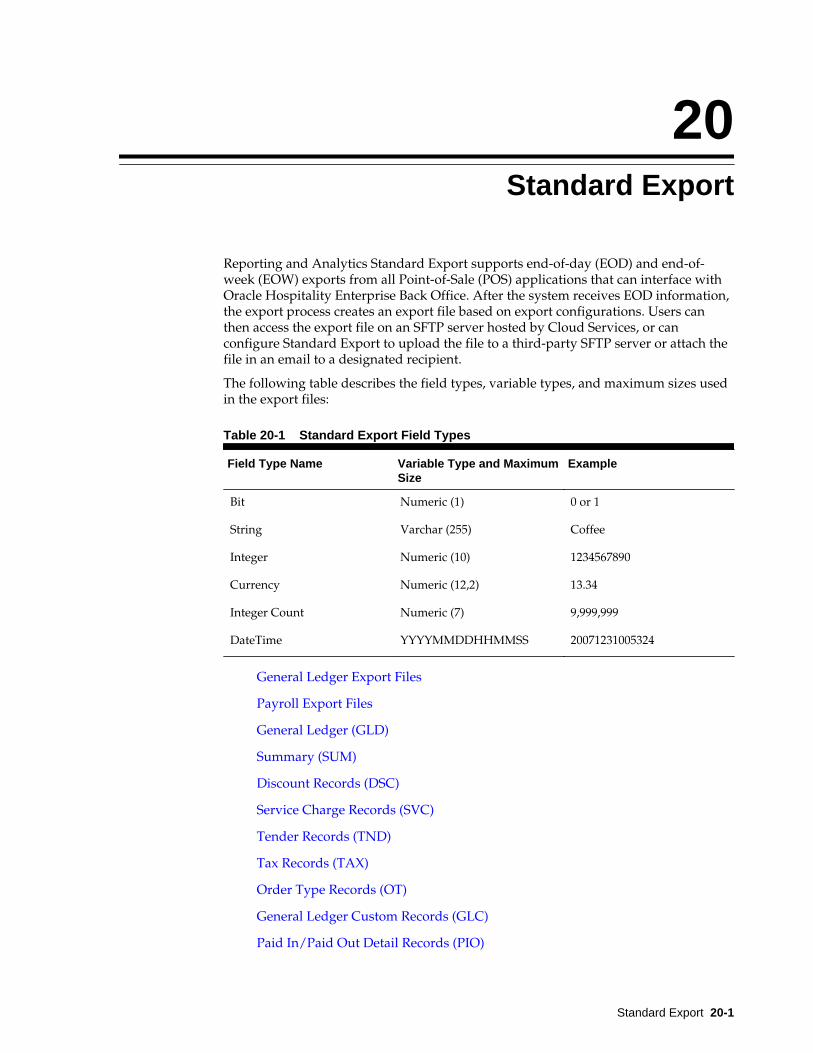
20Standard Export
Reporting and Analytics Standard Export supports end-of-day (EOD) and end-of-week (EOW) exports from all Point-of-Sale (POS) applications that can interface withOracle Hospitality Enterprise Back Office. After the system receives EOD information,the export process creates an export file based on export configurations. Users canthen access the export file on an SFTP server hosted by Cloud Services, or canconfigure Standard Export to upload the file to a third-party SFTP server or attach thefile in an email to a designated recipient.
The following table describes the field types, variable types, and maximum sizes usedin the export files:
Table 20-1 Standard Export Field Types
Field Type Name Variable Type and MaximumSize
Example
Bit Numeric (1) 0 or 1
String Varchar (255) Coffee
Integer Numeric (10) 1234567890
Currency Numeric (12,2) 13.34
Integer Count Numeric (7) 9,999,999
DateTime YYYYMMDDHHMMSS 20071231005324
General Ledger Export Files
Payroll Export Files
General Ledger (GLD)
Summary (SUM)
Discount Records (DSC)
Service Charge Records (SVC)
Tender Records (TND)
Tax Records (TAX)
Order Type Records (OT)
General Ledger Custom Records (GLC)
Paid In/Paid Out Detail Records (PIO)
Standard Export 20-1
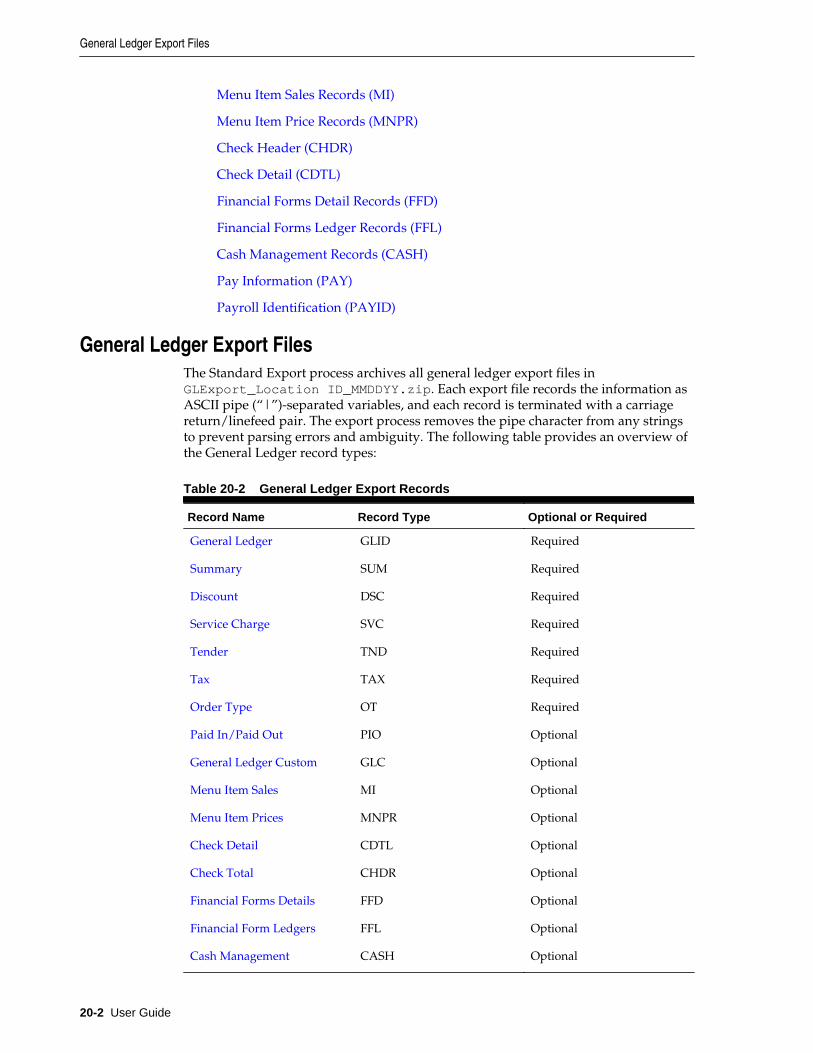
Menu Item Sales Records (MI)
Menu Item Price Records (MNPR)
Check Header (CHDR)
Check Detail (CDTL)
Financial Forms Detail Records (FFD)
Financial Forms Ledger Records (FFL)
Cash Management Records (CASH)
Pay Information (PAY)
Payroll Identification (PAYID)
General Ledger Export FilesThe Standard Export process archives all general ledger export files inGLExport_Location ID_MMDDYY.zip. Each export file records the information asASCII pipe (“|”)-separated variables, and each record is terminated with a carriagereturn/linefeed pair. The export process removes the pipe character from any stringsto prevent parsing errors and ambiguity. The following table provides an overview ofthe General Ledger record types:
Table 20-2 General Ledger Export Records
Record Name Record Type Optional or Required
General Ledger GLID Required
Summary SUM Required
Discount DSC Required
Service Charge SVC Required
Tender TND Required
Tax TAX Required
Order Type OT Required
Paid In/Paid Out PIO Optional
General Ledger Custom GLC Optional
Menu Item Sales MI Optional
Menu Item Prices MNPR Optional
Check Detail CDTL Optional
Check Total CHDR Optional
Financial Forms Details FFD Optional
Financial Form Ledgers FFL Optional
Cash Management CASH Optional
General Ledger Export Files
20-2 User Guide
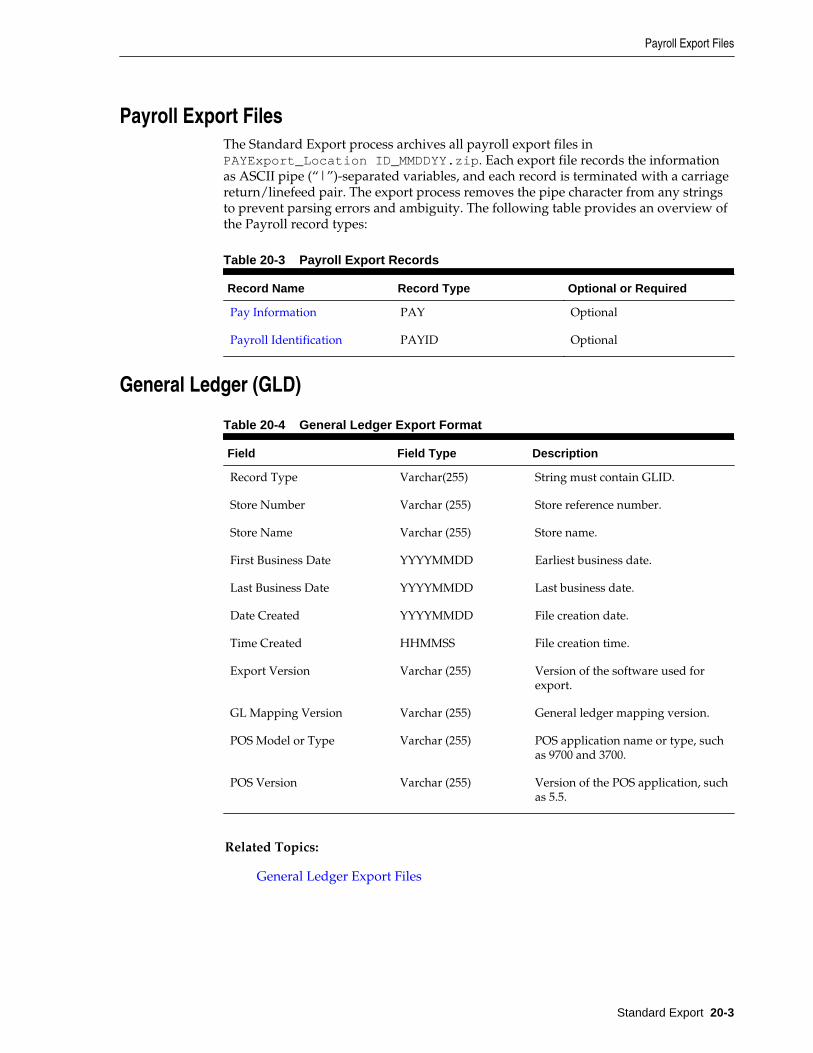
Payroll Export FilesThe Standard Export process archives all payroll export files inPAYExport_Location ID_MMDDYY.zip. Each export file records the informationas ASCII pipe (“|”)-separated variables, and each record is terminated with a carriagereturn/linefeed pair. The export process removes the pipe character from any stringsto prevent parsing errors and ambiguity. The following table provides an overview ofthe Payroll record types:
Table 20-3 Payroll Export Records
Record Name Record Type Optional or Required
Pay Information PAY Optional
Payroll Identification PAYID Optional
General Ledger (GLD)
Table 20-4 General Ledger Export Format
Field Field Type Description
Record Type Varchar(255) String must contain GLID.
Store Number Varchar (255) Store reference number.
Store Name Varchar (255) Store name.
First Business Date YYYYMMDD Earliest business date.
Last Business Date YYYYMMDD Last business date.
Date Created YYYYMMDD File creation date.
Time Created HHMMSS File creation time.
Export Version Varchar (255) Version of the software used forexport.
GL Mapping Version Varchar (255) General ledger mapping version.
POS Model or Type Varchar (255) POS application name or type, suchas 9700 and 3700.
POS Version Varchar (255) Version of the POS application, suchas 5.5.
Related Topics:
General Ledger Export Files
Payroll Export Files
Standard Export 20-3
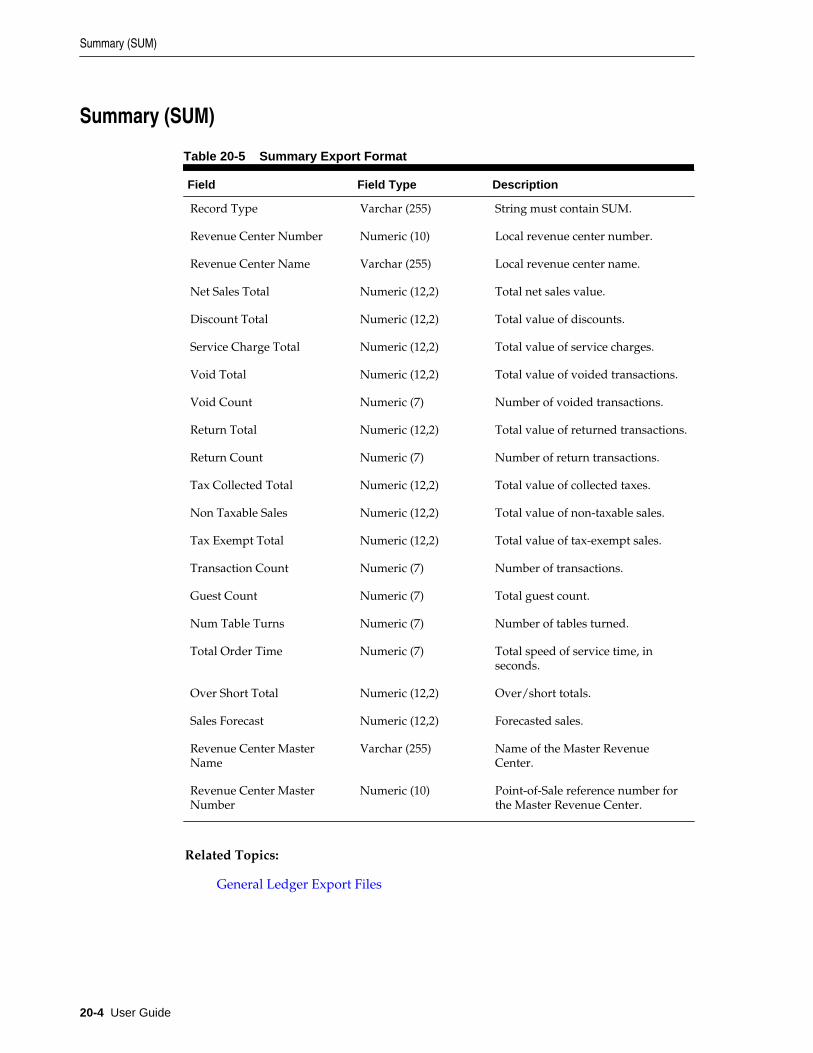
Summary (SUM)
Table 20-5 Summary Export Format
Field Field Type Description
Record Type Varchar (255) String must contain SUM.
Revenue Center Number Numeric (10) Local revenue center number.
Revenue Center Name Varchar (255) Local revenue center name.
Net Sales Total Numeric (12,2) Total net sales value.
Discount Total Numeric (12,2) Total value of discounts.
Service Charge Total Numeric (12,2) Total value of service charges.
Void Total Numeric (12,2) Total value of voided transactions.
Void Count Numeric (7) Number of voided transactions.
Return Total Numeric (12,2) Total value of returned transactions.
Return Count Numeric (7) Number of return transactions.
Tax Collected Total Numeric (12,2) Total value of collected taxes.
Non Taxable Sales Numeric (12,2) Total value of non-taxable sales.
Tax Exempt Total Numeric (12,2) Total value of tax-exempt sales.
Transaction Count Numeric (7) Number of transactions.
Guest Count Numeric (7) Total guest count.
Num Table Turns Numeric (7) Number of tables turned.
Total Order Time Numeric (7) Total speed of service time, inseconds.
Over Short Total Numeric (12,2) Over/short totals.
Sales Forecast Numeric (12,2) Forecasted sales.
Revenue Center MasterName
Varchar (255) Name of the Master RevenueCenter.
Revenue Center MasterNumber
Numeric (10) Point-of-Sale reference number forthe Master Revenue Center.
Related Topics:
General Ledger Export Files
Summary (SUM)
20-4 User Guide
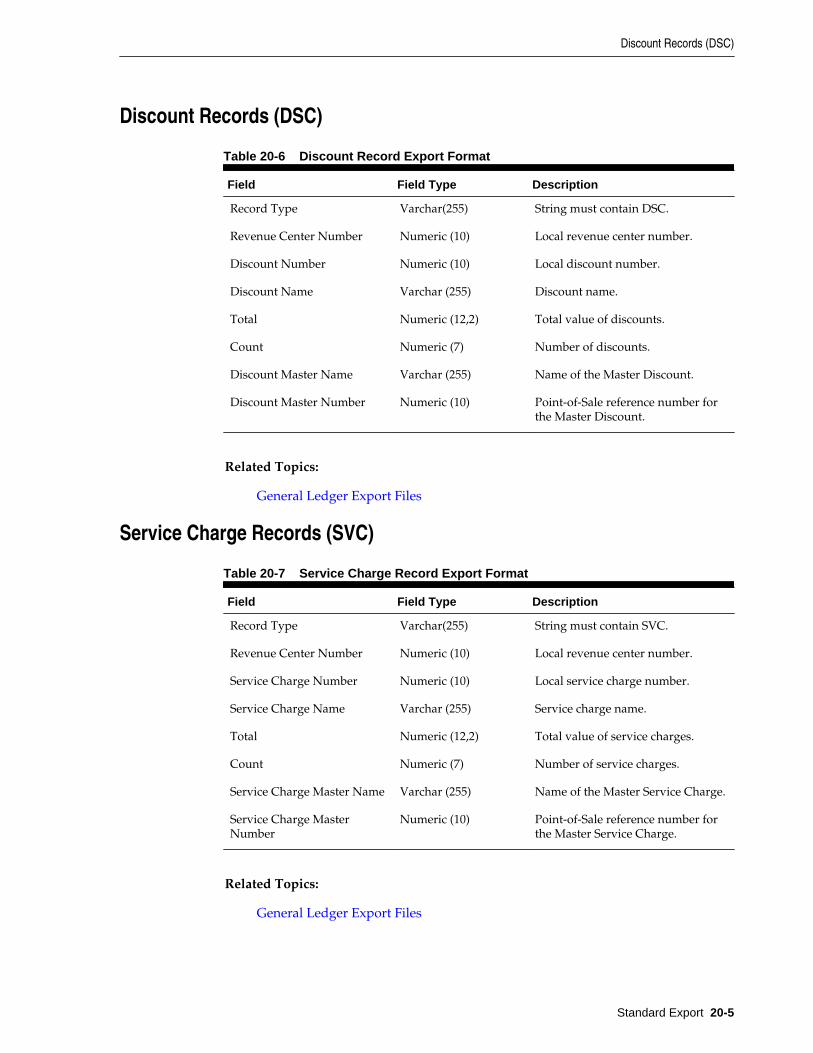
Discount Records (DSC)
Table 20-6 Discount Record Export Format
Field Field Type Description
Record Type Varchar(255) String must contain DSC.
Revenue Center Number Numeric (10) Local revenue center number.
Discount Number Numeric (10) Local discount number.
Discount Name Varchar (255) Discount name.
Total Numeric (12,2) Total value of discounts.
Count Numeric (7) Number of discounts.
Discount Master Name Varchar (255) Name of the Master Discount.
Discount Master Number Numeric (10) Point-of-Sale reference number forthe Master Discount.
Related Topics:
General Ledger Export Files
Service Charge Records (SVC)
Table 20-7 Service Charge Record Export Format
Field Field Type Description
Record Type Varchar(255) String must contain SVC.
Revenue Center Number Numeric (10) Local revenue center number.
Service Charge Number Numeric (10) Local service charge number.
Service Charge Name Varchar (255) Service charge name.
Total Numeric (12,2) Total value of service charges.
Count Numeric (7) Number of service charges.
Service Charge Master Name Varchar (255) Name of the Master Service Charge.
Service Charge MasterNumber
Numeric (10) Point-of-Sale reference number forthe Master Service Charge.
Related Topics:
General Ledger Export Files
Discount Records (DSC)
Standard Export 20-5
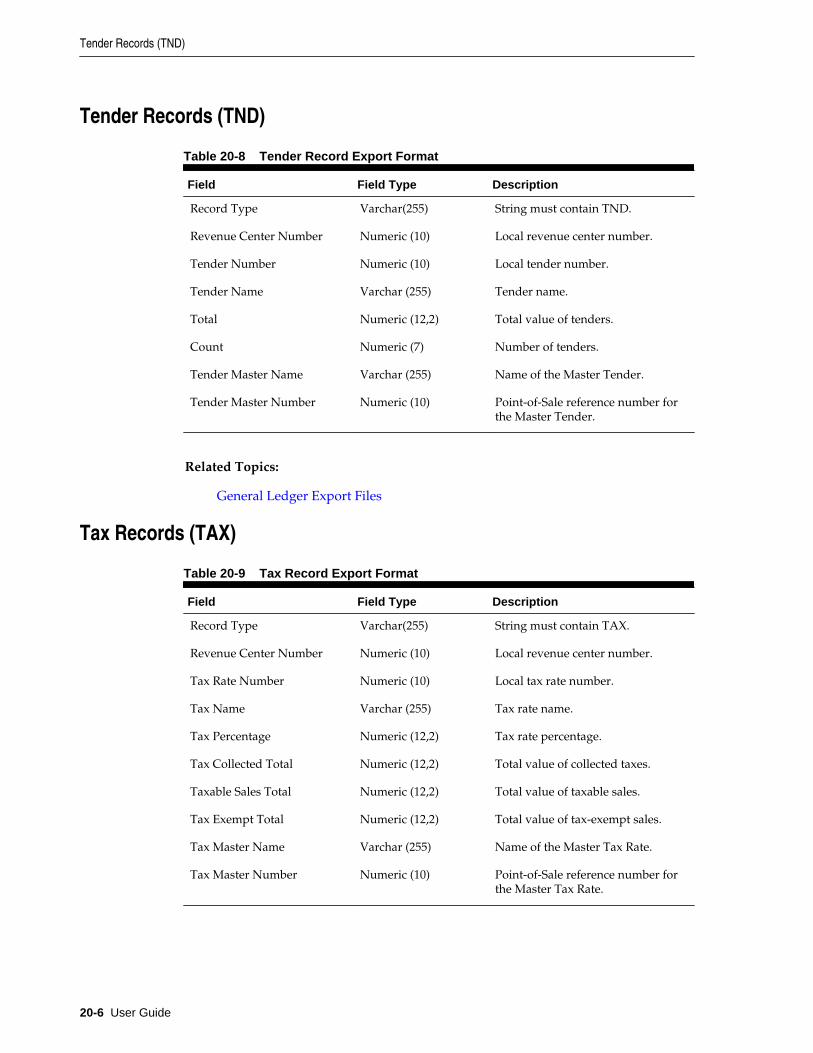
Tender Records (TND)
Table 20-8 Tender Record Export Format
Field Field Type Description
Record Type Varchar(255) String must contain TND.
Revenue Center Number Numeric (10) Local revenue center number.
Tender Number Numeric (10) Local tender number.
Tender Name Varchar (255) Tender name.
Total Numeric (12,2) Total value of tenders.
Count Numeric (7) Number of tenders.
Tender Master Name Varchar (255) Name of the Master Tender.
Tender Master Number Numeric (10) Point-of-Sale reference number forthe Master Tender.
Related Topics:
General Ledger Export Files
Tax Records (TAX)
Table 20-9 Tax Record Export Format
Field Field Type Description
Record Type Varchar(255) String must contain TAX.
Revenue Center Number Numeric (10) Local revenue center number.
Tax Rate Number Numeric (10) Local tax rate number.
Tax Name Varchar (255) Tax rate name.
Tax Percentage Numeric (12,2) Tax rate percentage.
Tax Collected Total Numeric (12,2) Total value of collected taxes.
Taxable Sales Total Numeric (12,2) Total value of taxable sales.
Tax Exempt Total Numeric (12,2) Total value of tax-exempt sales.
Tax Master Name Varchar (255) Name of the Master Tax Rate.
Tax Master Number Numeric (10) Point-of-Sale reference number forthe Master Tax Rate.
Tender Records (TND)
20-6 User Guide
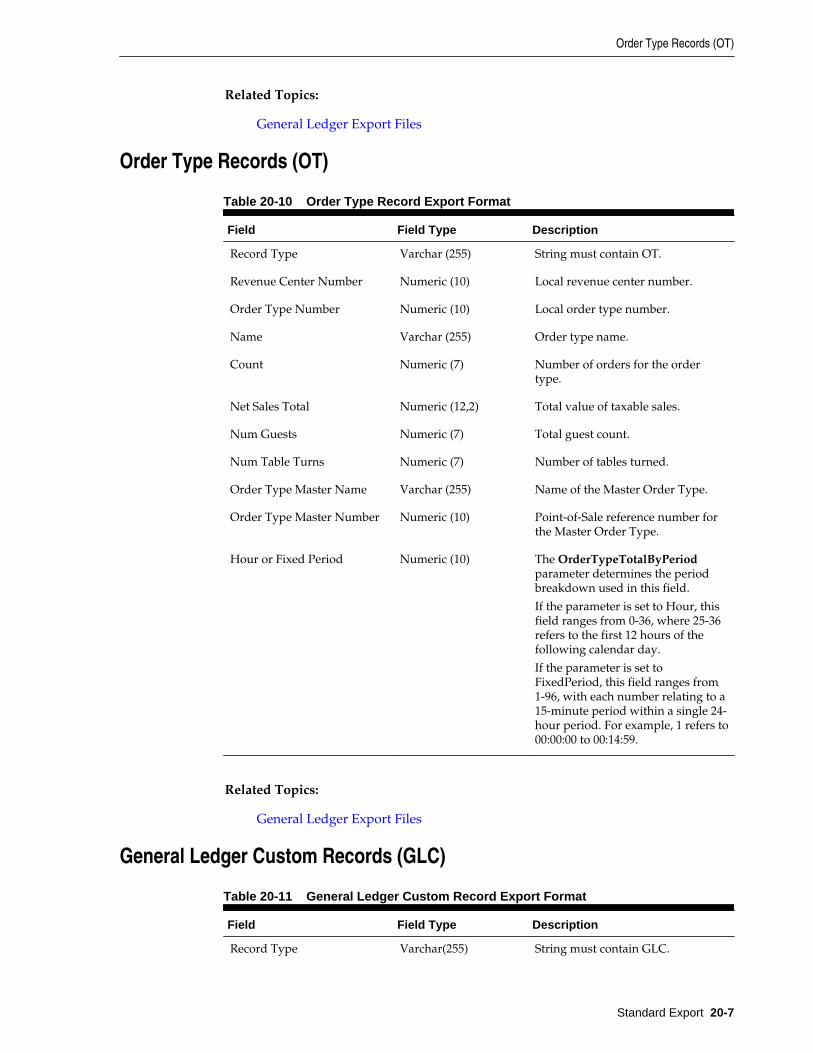
Related Topics:
General Ledger Export Files
Order Type Records (OT)
Table 20-10 Order Type Record Export Format
Field Field Type Description
Record Type Varchar (255) String must contain OT.
Revenue Center Number Numeric (10) Local revenue center number.
Order Type Number Numeric (10) Local order type number.
Name Varchar (255) Order type name.
Count Numeric (7) Number of orders for the ordertype.
Net Sales Total Numeric (12,2) Total value of taxable sales.
Num Guests Numeric (7) Total guest count.
Num Table Turns Numeric (7) Number of tables turned.
Order Type Master Name Varchar (255) Name of the Master Order Type.
Order Type Master Number Numeric (10) Point-of-Sale reference number forthe Master Order Type.
Hour or Fixed Period Numeric (10) The OrderTypeTotalByPeriodparameter determines the periodbreakdown used in this field.
If the parameter is set to Hour, thisfield ranges from 0-36, where 25-36refers to the first 12 hours of thefollowing calendar day.
If the parameter is set toFixedPeriod, this field ranges from1-96, with each number relating to a15-minute period within a single 24-hour period. For example, 1 refers to00:00:00 to 00:14:59.
Related Topics:
General Ledger Export Files
General Ledger Custom Records (GLC)
Table 20-11 General Ledger Custom Record Export Format
Field Field Type Description
Record Type Varchar(255) String must contain GLC.
Order Type Records (OT)
Standard Export 20-7
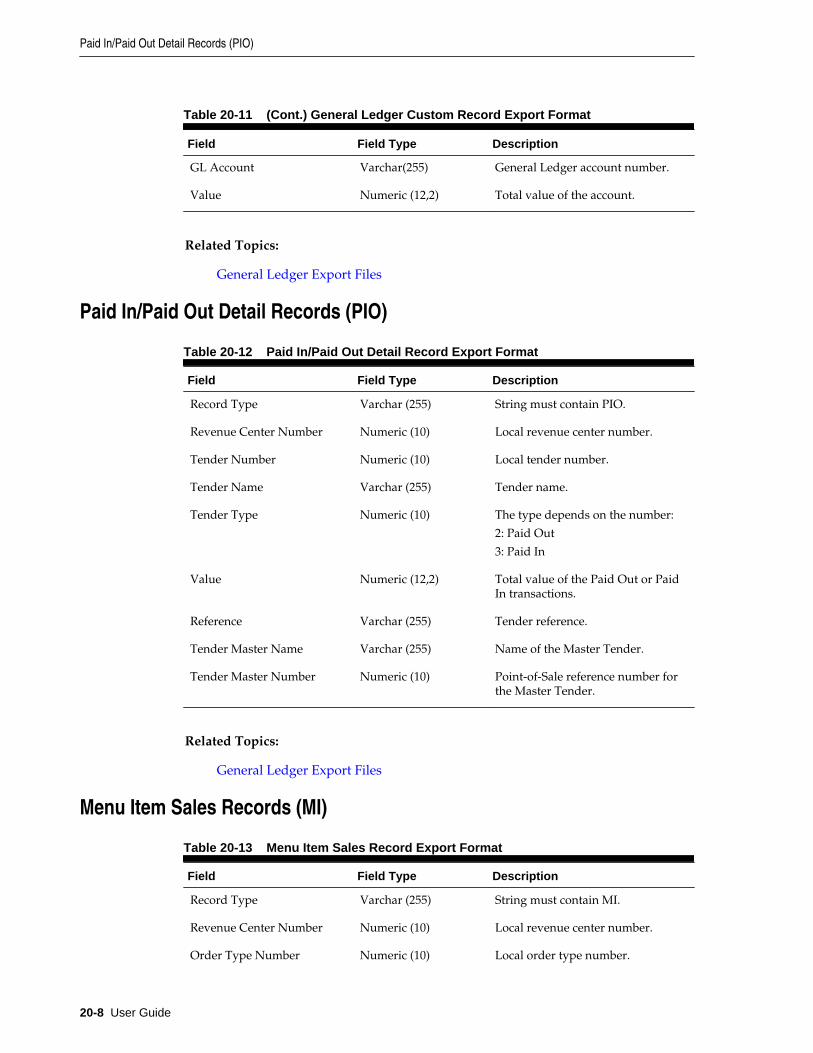
Table 20-11 (Cont.) General Ledger Custom Record Export Format
Field Field Type Description
GL Account Varchar(255) General Ledger account number.
Value Numeric (12,2) Total value of the account.
Related Topics:
General Ledger Export Files
Paid In/Paid Out Detail Records (PIO)
Table 20-12 Paid In/Paid Out Detail Record Export Format
Field Field Type Description
Record Type Varchar (255) String must contain PIO.
Revenue Center Number Numeric (10) Local revenue center number.
Tender Number Numeric (10) Local tender number.
Tender Name Varchar (255) Tender name.
Tender Type Numeric (10) The type depends on the number:
2: Paid Out
3: Paid In
Value Numeric (12,2) Total value of the Paid Out or PaidIn transactions.
Reference Varchar (255) Tender reference.
Tender Master Name Varchar (255) Name of the Master Tender.
Tender Master Number Numeric (10) Point-of-Sale reference number forthe Master Tender.
Related Topics:
General Ledger Export Files
Menu Item Sales Records (MI)
Table 20-13 Menu Item Sales Record Export Format
Field Field Type Description
Record Type Varchar (255) String must contain MI.
Revenue Center Number Numeric (10) Local revenue center number.
Order Type Number Numeric (10) Local order type number.
Paid In/Paid Out Detail Records (PIO)
20-8 User Guide
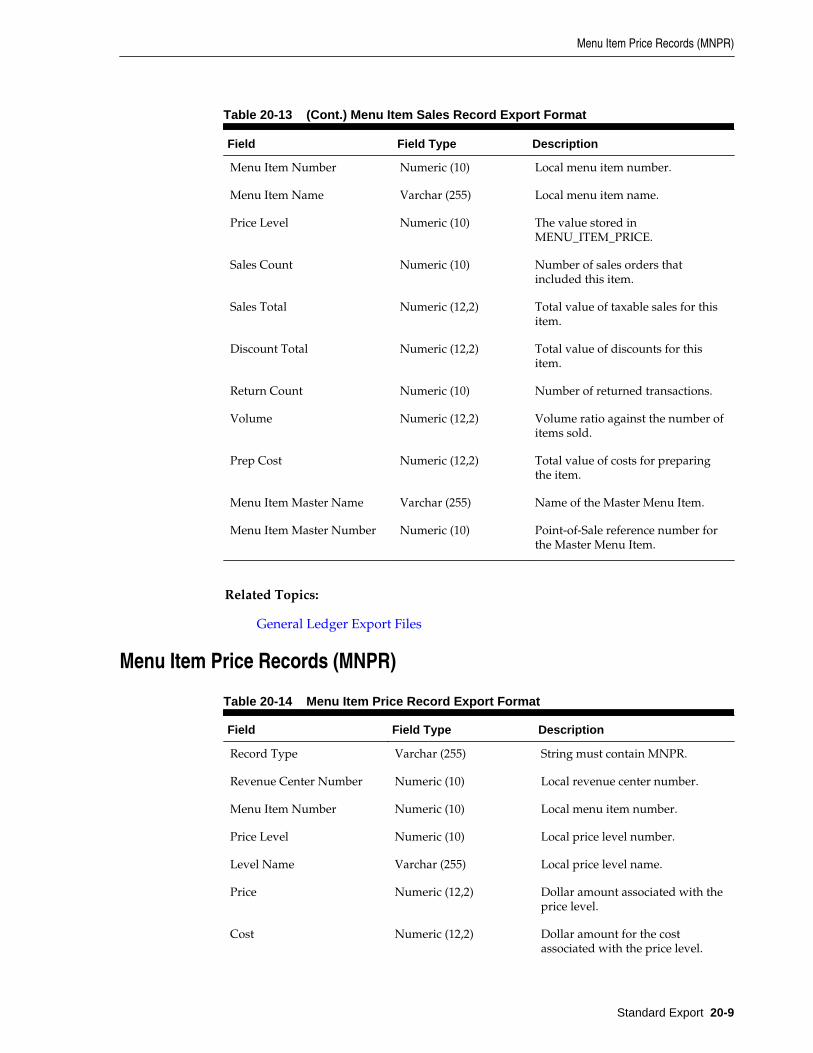
Table 20-13 (Cont.) Menu Item Sales Record Export Format
Field Field Type Description
Menu Item Number Numeric (10) Local menu item number.
Menu Item Name Varchar (255) Local menu item name.
Price Level Numeric (10) The value stored inMENU_ITEM_PRICE.
Sales Count Numeric (10) Number of sales orders thatincluded this item.
Sales Total Numeric (12,2) Total value of taxable sales for thisitem.
Discount Total Numeric (12,2) Total value of discounts for thisitem.
Return Count Numeric (10) Number of returned transactions.
Volume Numeric (12,2) Volume ratio against the number ofitems sold.
Prep Cost Numeric (12,2) Total value of costs for preparingthe item.
Menu Item Master Name Varchar (255) Name of the Master Menu Item.
Menu Item Master Number Numeric (10) Point-of-Sale reference number forthe Master Menu Item.
Related Topics:
General Ledger Export Files
Menu Item Price Records (MNPR)
Table 20-14 Menu Item Price Record Export Format
Field Field Type Description
Record Type Varchar (255) String must contain MNPR.
Revenue Center Number Numeric (10) Local revenue center number.
Menu Item Number Numeric (10) Local menu item number.
Price Level Numeric (10) Local price level number.
Level Name Varchar (255) Local price level name.
Price Numeric (12,2) Dollar amount associated with theprice level.
Cost Numeric (12,2) Dollar amount for the costassociated with the price level.
Menu Item Price Records (MNPR)
Standard Export 20-9
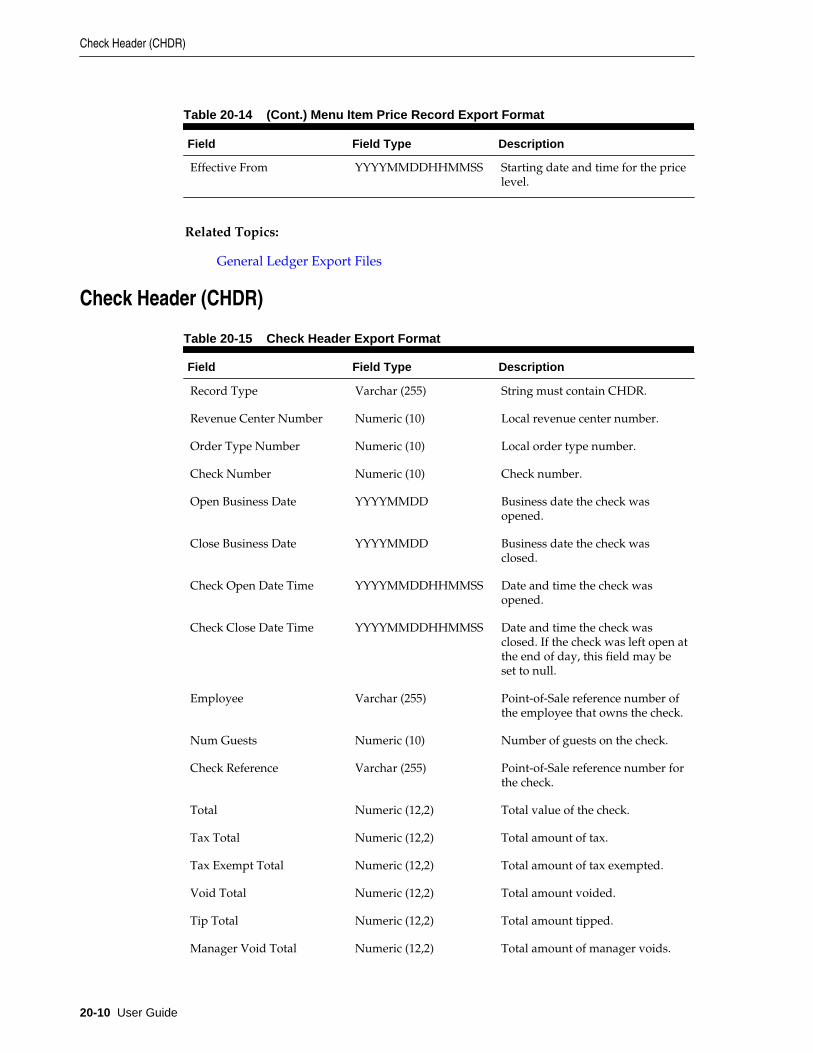
Table 20-14 (Cont.) Menu Item Price Record Export Format
Field Field Type Description
Effective From YYYYMMDDHHMMSS Starting date and time for the pricelevel.
Related Topics:
General Ledger Export Files
Check Header (CHDR)
Table 20-15 Check Header Export Format
Field Field Type Description
Record Type Varchar (255) String must contain CHDR.
Revenue Center Number Numeric (10) Local revenue center number.
Order Type Number Numeric (10) Local order type number.
Check Number Numeric (10) Check number.
Open Business Date YYYYMMDD Business date the check wasopened.
Close Business Date YYYYMMDD Business date the check wasclosed.
Check Open Date Time YYYYMMDDHHMMSS Date and time the check wasopened.
Check Close Date Time YYYYMMDDHHMMSS Date and time the check wasclosed. If the check was left open atthe end of day, this field may beset to null.
Employee Varchar (255) Point-of-Sale reference number ofthe employee that owns the check.
Num Guests Numeric (10) Number of guests on the check.
Check Reference Varchar (255) Point-of-Sale reference number forthe check.
Total Numeric (12,2) Total value of the check.
Tax Total Numeric (12,2) Total amount of tax.
Tax Exempt Total Numeric (12,2) Total amount of tax exempted.
Void Total Numeric (12,2) Total amount voided.
Tip Total Numeric (12,2) Total amount tipped.
Manager Void Total Numeric (12,2) Total amount of manager voids.
Check Header (CHDR)
20-10 User Guide
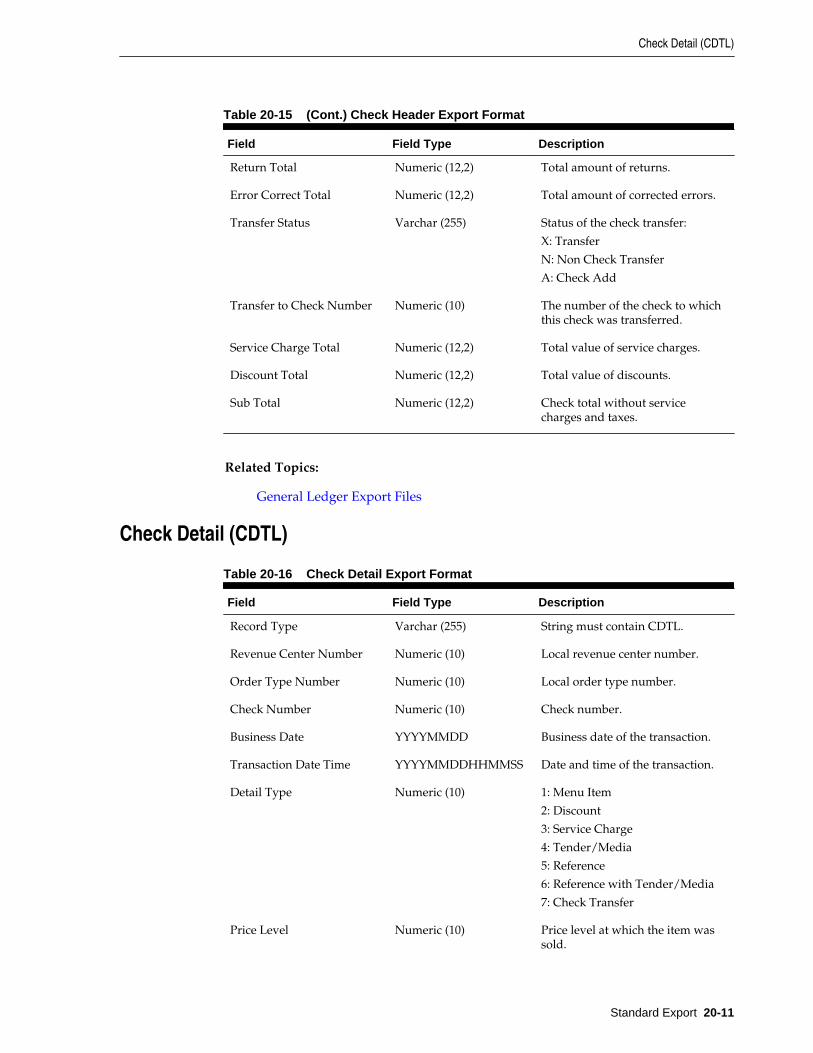
Table 20-15 (Cont.) Check Header Export Format
Field Field Type Description
Return Total Numeric (12,2) Total amount of returns.
Error Correct Total Numeric (12,2) Total amount of corrected errors.
Transfer Status Varchar (255) Status of the check transfer:
X: Transfer
N: Non Check Transfer
A: Check Add
Transfer to Check Number Numeric (10) The number of the check to whichthis check was transferred.
Service Charge Total Numeric (12,2) Total value of service charges.
Discount Total Numeric (12,2) Total value of discounts.
Sub Total Numeric (12,2) Check total without servicecharges and taxes.
Related Topics:
General Ledger Export Files
Check Detail (CDTL)
Table 20-16 Check Detail Export Format
Field Field Type Description
Record Type Varchar (255) String must contain CDTL.
Revenue Center Number Numeric (10) Local revenue center number.
Order Type Number Numeric (10) Local order type number.
Check Number Numeric (10) Check number.
Business Date YYYYMMDD Business date of the transaction.
Transaction Date Time YYYYMMDDHHMMSS Date and time of the transaction.
Detail Type Numeric (10) 1: Menu Item
2: Discount
3: Service Charge
4: Tender/Media
5: Reference
6: Reference with Tender/Media
7: Check Transfer
Price Level Numeric (10) Price level at which the item wassold.
Check Detail (CDTL)
Standard Export 20-11
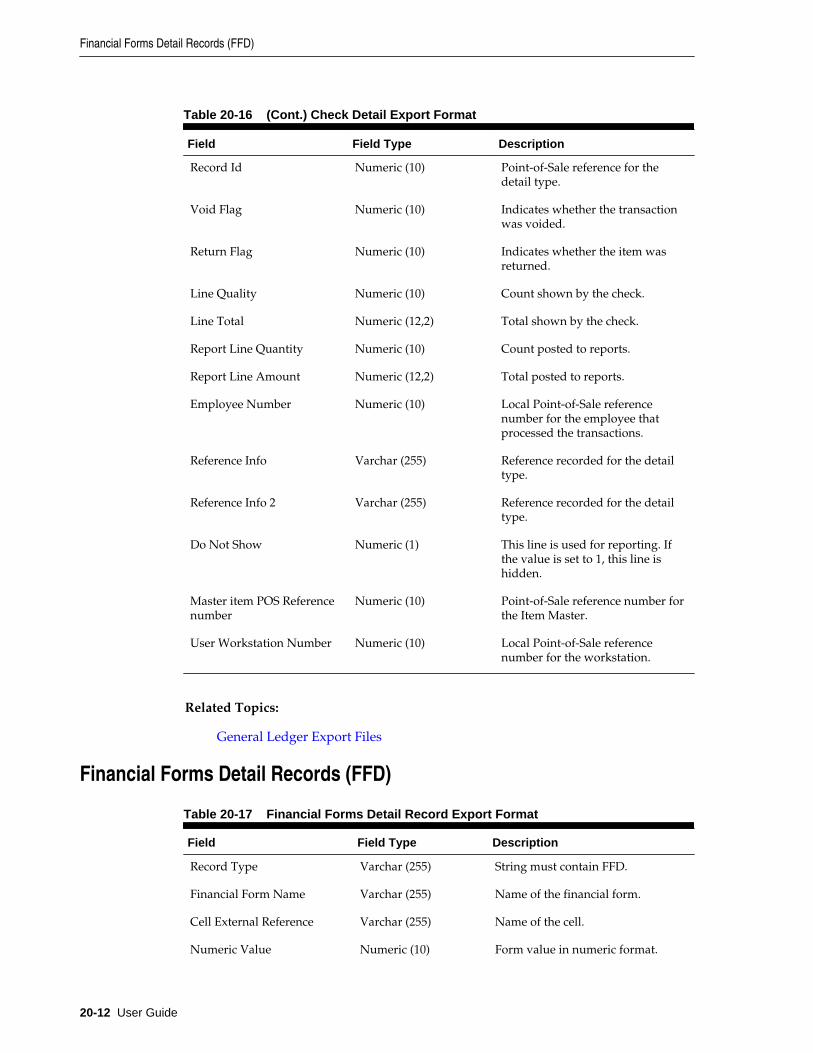
Table 20-16 (Cont.) Check Detail Export Format
Field Field Type Description
Record Id Numeric (10) Point-of-Sale reference for thedetail type.
Void Flag Numeric (10) Indicates whether the transactionwas voided.
Return Flag Numeric (10) Indicates whether the item wasreturned.
Line Quality Numeric (10) Count shown by the check.
Line Total Numeric (12,2) Total shown by the check.
Report Line Quantity Numeric (10) Count posted to reports.
Report Line Amount Numeric (12,2) Total posted to reports.
Employee Number Numeric (10) Local Point-of-Sale referencenumber for the employee thatprocessed the transactions.
Reference Info Varchar (255) Reference recorded for the detailtype.
Reference Info 2 Varchar (255) Reference recorded for the detailtype.
Do Not Show Numeric (1) This line is used for reporting. Ifthe value is set to 1, this line ishidden.
Master item POS Referencenumber
Numeric (10) Point-of-Sale reference number forthe Item Master.
User Workstation Number Numeric (10) Local Point-of-Sale referencenumber for the workstation.
Related Topics:
General Ledger Export Files
Financial Forms Detail Records (FFD)
Table 20-17 Financial Forms Detail Record Export Format
Field Field Type Description
Record Type Varchar (255) String must contain FFD.
Financial Form Name Varchar (255) Name of the financial form.
Cell External Reference Varchar (255) Name of the cell.
Numeric Value Numeric (10) Form value in numeric format.
Financial Forms Detail Records (FFD)
20-12 User Guide
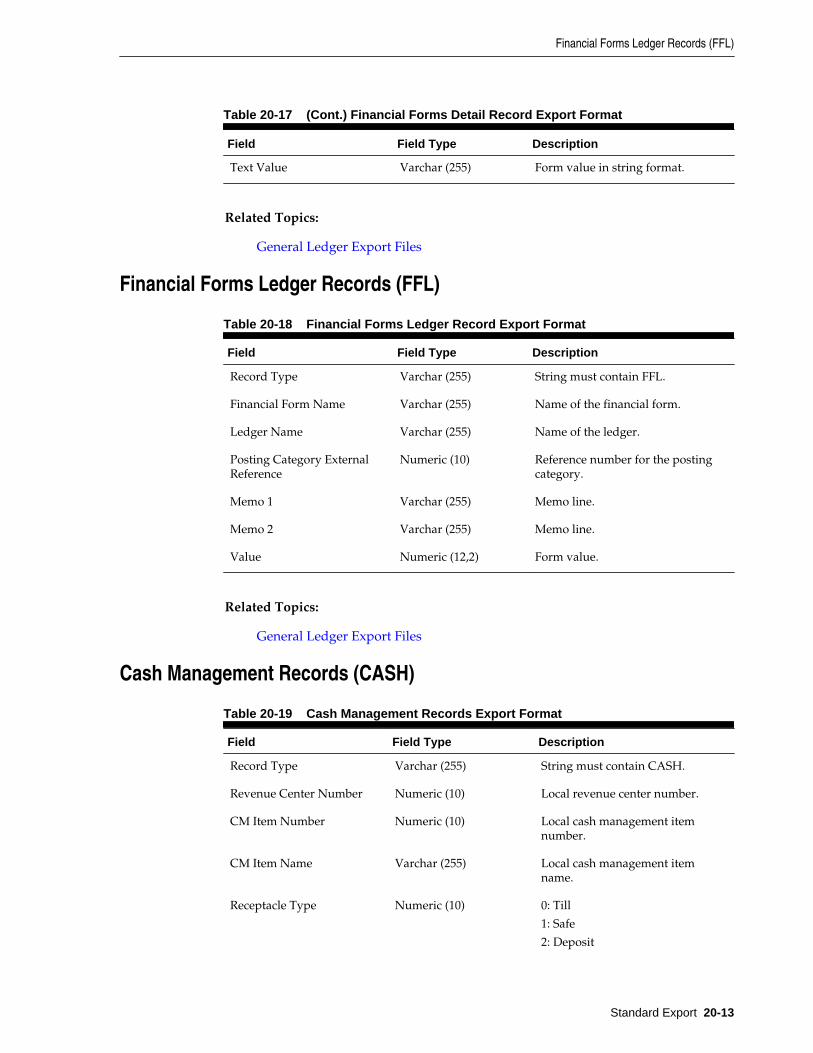
Table 20-17 (Cont.) Financial Forms Detail Record Export Format
Field Field Type Description
Text Value Varchar (255) Form value in string format.
Related Topics:
General Ledger Export Files
Financial Forms Ledger Records (FFL)
Table 20-18 Financial Forms Ledger Record Export Format
Field Field Type Description
Record Type Varchar (255) String must contain FFL.
Financial Form Name Varchar (255) Name of the financial form.
Ledger Name Varchar (255) Name of the ledger.
Posting Category ExternalReference
Numeric (10) Reference number for the postingcategory.
Memo 1 Varchar (255) Memo line.
Memo 2 Varchar (255) Memo line.
Value Numeric (12,2) Form value.
Related Topics:
General Ledger Export Files
Cash Management Records (CASH)
Table 20-19 Cash Management Records Export Format
Field Field Type Description
Record Type Varchar (255) String must contain CASH.
Revenue Center Number Numeric (10) Local revenue center number.
CM Item Number Numeric (10) Local cash management itemnumber.
CM Item Name Varchar (255) Local cash management itemname.
Receptacle Type Numeric (10) 0: Till
1: Safe
2: Deposit
Financial Forms Ledger Records (FFL)
Standard Export 20-13
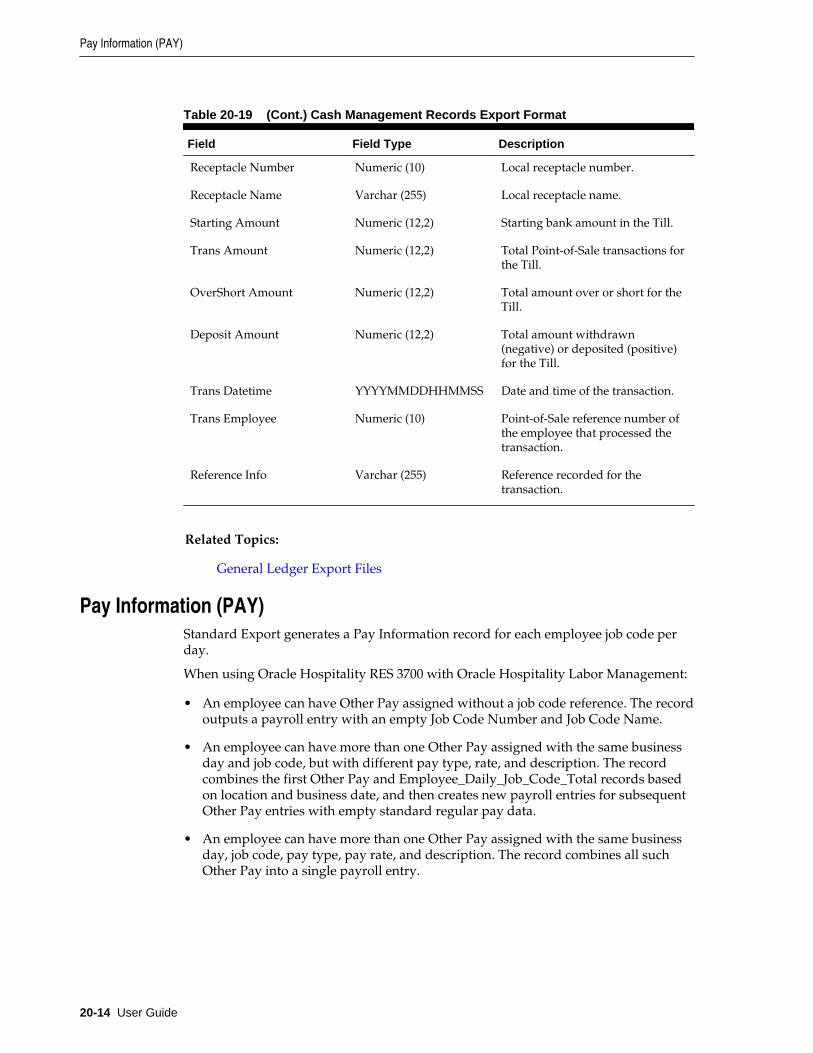
Table 20-19 (Cont.) Cash Management Records Export Format
Field Field Type Description
Receptacle Number Numeric (10) Local receptacle number.
Receptacle Name Varchar (255) Local receptacle name.
Starting Amount Numeric (12,2) Starting bank amount in the Till.
Trans Amount Numeric (12,2) Total Point-of-Sale transactions forthe Till.
OverShort Amount Numeric (12,2) Total amount over or short for theTill.
Deposit Amount Numeric (12,2) Total amount withdrawn(negative) or deposited (positive)for the Till.
Trans Datetime YYYYMMDDHHMMSS Date and time of the transaction.
Trans Employee Numeric (10) Point-of-Sale reference number ofthe employee that processed thetransaction.
Reference Info Varchar (255) Reference recorded for thetransaction.
Related Topics:
General Ledger Export Files
Pay Information (PAY)Standard Export generates a Pay Information record for each employee job code perday.
When using Oracle Hospitality RES 3700 with Oracle Hospitality Labor Management:
• An employee can have Other Pay assigned without a job code reference. The recordoutputs a payroll entry with an empty Job Code Number and Job Code Name.
• An employee can have more than one Other Pay assigned with the same businessday and job code, but with different pay type, rate, and description. The recordcombines the first Other Pay and Employee_Daily_Job_Code_Total records basedon location and business date, and then creates new payroll entries for subsequentOther Pay entries with empty standard regular pay data.
• An employee can have more than one Other Pay assigned with the same businessday, job code, pay type, pay rate, and description. The record combines all suchOther Pay into a single payroll entry.
Pay Information (PAY)
20-14 User Guide
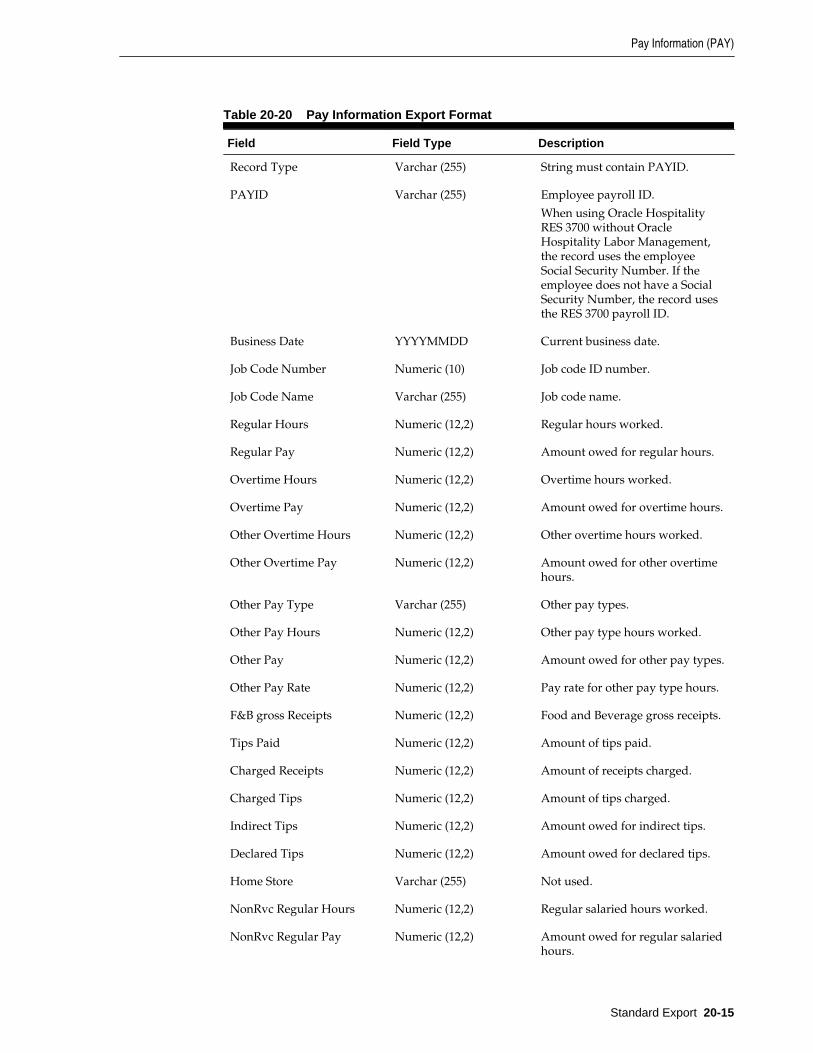
Table 20-20 Pay Information Export Format
Field Field Type Description
Record Type Varchar (255) String must contain PAYID.
PAYID Varchar (255) Employee payroll ID.
When using Oracle HospitalityRES 3700 without OracleHospitality Labor Management,the record uses the employeeSocial Security Number. If theemployee does not have a SocialSecurity Number, the record usesthe RES 3700 payroll ID.
Business Date YYYYMMDD Current business date.
Job Code Number Numeric (10) Job code ID number.
Job Code Name Varchar (255) Job code name.
Regular Hours Numeric (12,2) Regular hours worked.
Regular Pay Numeric (12,2) Amount owed for regular hours.
Overtime Hours Numeric (12,2) Overtime hours worked.
Overtime Pay Numeric (12,2) Amount owed for overtime hours.
Other Overtime Hours Numeric (12,2) Other overtime hours worked.
Other Overtime Pay Numeric (12,2) Amount owed for other overtimehours.
Other Pay Type Varchar (255) Other pay types.
Other Pay Hours Numeric (12,2) Other pay type hours worked.
Other Pay Numeric (12,2) Amount owed for other pay types.
Other Pay Rate Numeric (12,2) Pay rate for other pay type hours.
F&B gross Receipts Numeric (12,2) Food and Beverage gross receipts.
Tips Paid Numeric (12,2) Amount of tips paid.
Charged Receipts Numeric (12,2) Amount of receipts charged.
Charged Tips Numeric (12,2) Amount of tips charged.
Indirect Tips Numeric (12,2) Amount owed for indirect tips.
Declared Tips Numeric (12,2) Amount owed for declared tips.
Home Store Varchar (255) Not used.
NonRvc Regular Hours Numeric (12,2) Regular salaried hours worked.
NonRvc Regular Pay Numeric (12,2) Amount owed for regular salariedhours.
Pay Information (PAY)
Standard Export 20-15
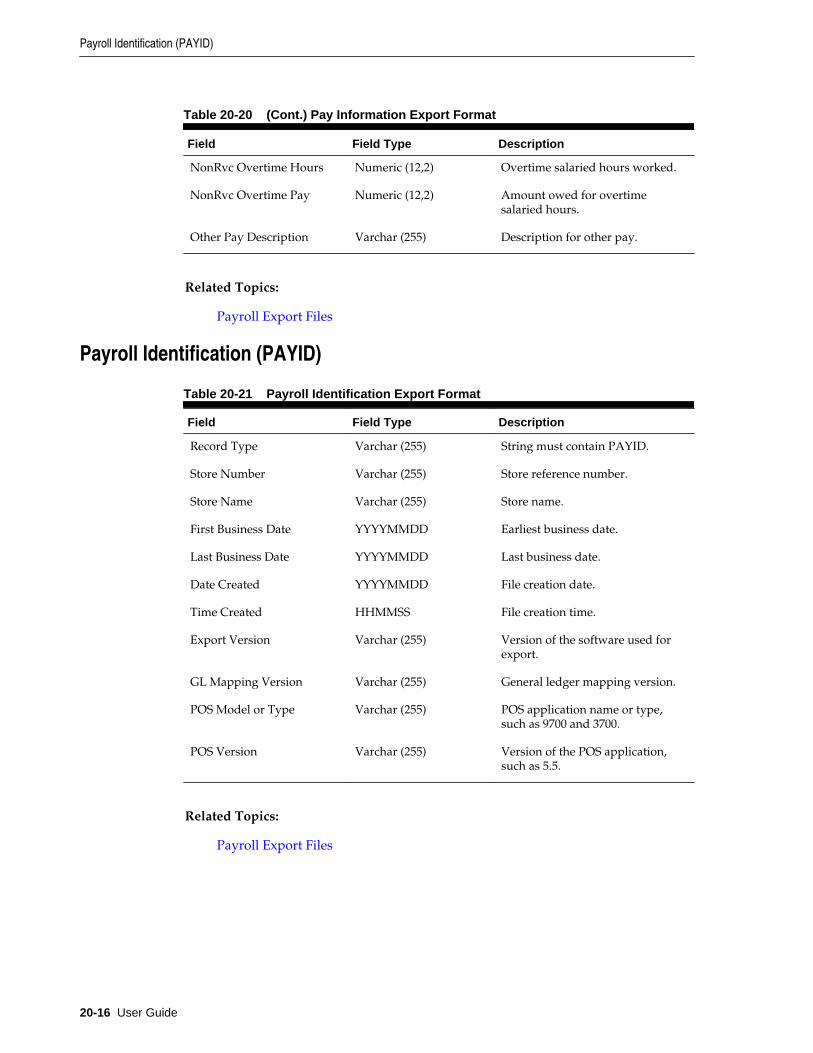
Table 20-20 (Cont.) Pay Information Export Format
Field Field Type Description
NonRvc Overtime Hours Numeric (12,2) Overtime salaried hours worked.
NonRvc Overtime Pay Numeric (12,2) Amount owed for overtimesalaried hours.
Other Pay Description Varchar (255) Description for other pay.
Related Topics:
Payroll Export Files
Payroll Identification (PAYID)
Table 20-21 Payroll Identification Export Format
Field Field Type Description
Record Type Varchar (255) String must contain PAYID.
Store Number Varchar (255) Store reference number.
Store Name Varchar (255) Store name.
First Business Date YYYYMMDD Earliest business date.
Last Business Date YYYYMMDD Last business date.
Date Created YYYYMMDD File creation date.
Time Created HHMMSS File creation time.
Export Version Varchar (255) Version of the software used forexport.
GL Mapping Version Varchar (255) General ledger mapping version.
POS Model or Type Varchar (255) POS application name or type,such as 9700 and 3700.
POS Version Varchar (255) Version of the POS application,such as 5.5.
Related Topics:
Payroll Export Files
Payroll Identification (PAYID)
20-16 User Guide
![Oracle Analytics...7 Oracle Predictive Analytics vs. Microsoft vs. Tableau Predictive Analytics Feature Satisfaction Per G2 Reviewers OAC [Oracle Analytics Cloud] is literally changing](https://img.pdfslide.us/doc/110x75/5f3d321f3d33d25d7379c2fe/oracle-analytics-7-oracle-predictive-analytics-vs-microsoft-vs-tableau-predictive.jpg)