Embed Size (px)
Citation preview

M&A Salesforce.com & Slack.Inc
Target Price: $23.7 USD Billion
Valuation as of 12 February 2020

Executive Summary
Executive
Summary
Financial
Analysis
Final
RecommendationValuation
4.7 0.9
A Promising Team Collaboration Software Engine
4.7 0.9
Should Salesforce acquire Slack?
YES!
1) The important role of the team collaboration software industryfor the pandemic and post-pandemic work dynamics.
2) The need of both companies to enhance their portfolio ofservices to expand their market share.
3) The cross-crossing customer opportunities expected after theacquisition.
We recommend an acquisition
for 23,7$ Billion
Strategic Rationale
for Acquisition
Main drivers

Financial Analysis

Financial Analysis
Executive
Summary
Financial
Analysis
Final
RecommendationValuation
4.7 0.94.7 0.9-400.00
-200.00
0.00
200.00
400.00
600.00
800.00
1,000.00
20
06
20
07
20
08
20
09
20
10
20
11
20
12
20
13
20
14
20
15
20
16
20
17
20
18
20
19
20
20
Source: fool.com & Team Assessment
Salesforce’s EBIT over Time
Salesforce presented a 27% CAGR increase in revenues from 2016 to2020….
…Nonetheless, it has always struggled with keeping their OperatingMargins low, compared to its competitors.
Operating Margins for Salesforce & Competitors (2019)
0.00% 8.00% 16.00% 24.00% 32.00%
Salesforce.com
Adobe Inc.
SAP SE
Source: Refinitiv & Team Assessment
Strategic Rationale
for Acquisition
Salesforce

Financial Analysis
Financial
Analysis
Final
RecommendationValuation
4.7 0.94.7 0.9
Source: NASDAQ , Refinitiv & Team Assessment
Salesforce Cash flows from…
In August FY21, Salesforce reported the following… What caused the negative Net Change in Cash (CC&E)? InvestingActivities.
-$3,000.000
-$2,500.000
-$2,000.000
-$1,500.000
-$1,000.000
-$500.000
$0.000
IA With Acquisitions IA Without Acquisitons
Source: NASDAQ , Refinitiv & Team Assessment
Executive
Summary
Strategic Rationale
for Acquisition
All in all, Operating Cash Flows offer a more encompassing measurethat focuses just on the company’s ability to make profits from itsday-to-day business.
Salesforce Investing Activities Including and Excluding Acquisitions
Salesforce

Financial Analysis
Financial
Analysis
Final
RecommendationValuation
4.7 0.9
Slack and Microsoft’s Revenues Growth Rate
Slack currently presents non-reliable historical data for forecastingpurposes, since it is recently new to the public market.
109.7%
81.62%
57.39%
15.38% 16.7%
40%
0.0%
20.0%
40.0%
60.0%
80.0%
100.0%
120.0%
2018 2019 2020
Slack Technologies Microsoft Teams
Source: Refinitiv, businessofapps.com & Team Assessment
Low levels in EBITDA Margin are due to elevated OperatingExpenses, which account for more than 100% of revenues.
-160.00%
-140.00%
-120.00%
-100.00%
-80.00%
-60.00%
-40.00%
-20.00%
0.00%
2017 2018 2019 2020
EBITDA Margins for Slack
Source: Forbes, Refinitiv & Team Assessment
Executive
Summary
Strategic Rationale
for Acquisition
Slack

Financial Analysis
Financial
Analysis
Final
RecommendationValuation
4.7 0.9
Slack has showed the importance of Cash for tech-companies. Liquidity and Profitability comparisons with Zoom are as following…
Profit Margins for Slack & Zoom
2.67
3.56
0.53
0.70
1.82
2.96
0.420.54
3.28
1.87
0.85 0.83
0.00
0.80
1.60
2.40
3.20
4.00
Zoom Video Slack Tech. Zoom Video Slack Tech.
Current Ratio Cash Ratio
Zoom Video 2018
Zoom Video 2019Zoom Video 2020
Slack Tech. 2018
Slack Tech. 2018
Slack Tech. 2018
Source: Refinitiv & Team Assessment
Liquidity for Slack & Zoom
Source: Refinitiv & Team Assessment
79.5% 79.7% 81.5% 81.5%
-23.6%
-5.4%
0.0% 3.5%
-139.67%
-82.06%
-35.12%
-90.58%
-150.0%
-100.0%
-50.0%
0.0%
50.0%
100.0%
2017 2018 2019 2020
Zoom's Gross Margin Zoom's Net Margin
Slack's Gross Margin Slack's Net Margin
Executive
Summary
Strategic Rationale
for Acquisition
Slack

Strategic Rationale

Strategic Rationale
Financial
Analysis
Final
RecommendationStrategic Rationale for
AcquisitionValuation
4.7 0.9
Forecasts for Slack
0%
20%
40%
60%
202
2E
202
3E
202
4E
202
5E
202
6E
202
7E
202
8E
202
9E
203
0E
203
1E
Slack without Synergy Slack with Synergy
Growth Projections for
Slack
Source: Grand View Research, Salesforce.com
& Team Assessment
0.0
10.0
20.0
30.0
40.0
50.0
201
9
202
0
202
1
202
2E
202
3E
202
4E
202
5E
202
6E
202
7E
202
8E
202
9E
203
0E
203
1E
Team Collaboration Software Market Size (in billions)
Market Size Expectations
Source: IDC & Team Assessment
The panorama for Slack is positive but incapable of exploiting the potentialgrowth of the market without an acquisition by Salesforce.
• Slack without acquisition:
• If Slack is acquired by Salesforce:
• In the long term, the growth of Slack will most likely converge to the 12,7%market CAGR expected by The Grand View Research.
According to Deloitte:
“Even though the end of the pandemic will suppose the return of manyworkers to a physical space, most CEOs think that around 36% of theiremployees will continue working at home from the beginning of
january 2022 onwards” (Kaiser, Schatsky, & Jones, 2020).
28% CAGR
38% CAGR
First 5 years
Executive
Summary

Strategic Rationale
Financial
Analysis
Final
RecommendationStrategic Rationale for
AcquisitionValuation
4.7 0.9
Forecasts for Salesforce
Growth Projections for
Salesforce
Source: Grand View Research, Salesforce.com
& Team Assessment
Salesforce's biggest challenges for the future is to maintain its leading positionin market share.
• Salesforce without acquisition:
• Salesforce with acquisition:
• In the long term, Salesforce´s growth is expected to converge to the CRMmarket growth ( CAGR of 14,2%) according to The Grand View Research.
19% CAGR
20% CAGR
First 5 years
0%
10%
20%
30%
202
2E
202
3E
202
4E
202
5E
202
6E
202
7E
202
8E
202
9E
203
0E
203
1E
Salesforce without Synergy Salesforce with Synergy
Salesforce acquiring Slack poses a significant opportunity ofgrowth in a highly demanded and rapid changing market.
0.0
50.0
100.0
150.0
200.0
250.0
201
9
202
0
202
1
202
2E
202
3E
202
4E
202
5E
202
6E
202
7E
202
8E
202
9E
203
0E
203
1E
CMR Market Size (in billions)
Market Size Expectations
Source: IDC & Team Assessment
Executive
Summary

Strategic Rationale
Financial
Analysis
Final
RecommendationStrategic Rationale for
AcquisitionValuation
Value drivers for the acquisition
Slack´s trajectory, and key business metrics, shows why it is especially valuable forSalesforce´s future plan of maintaining their lead in the CRM market.
1. Customer Retention:
90% 88% 85% 82% 80%
0%
20%
40%
60%
80%
100%
1 2 3 4 5Years
1 2 Customer Spend:
$1
$9
$0
$2
$4
$6
$8
$10
0 1 2 3 4 5 6
Customer Spend Growth since Year of
Acquisition
Source: Theta Equity Partners & Team Assessment
Retention rate
(Years since newly acquire customer)
3 Low Customer´s Overlap:
Source: (S. Butterfield, December 18, 2020)
Approximately 90% of Slack´s paidcustomers (132,000) are not alreadyon Salesforce.
Most of them are small business.
Layering Slack’s technology onto the Salesforce 360 platform is expected to improve the user interface making it more attractive to its customers.
Executive
Summary

Valuation
Valuation
Financial
Analysis
Final
RecommendationValuation
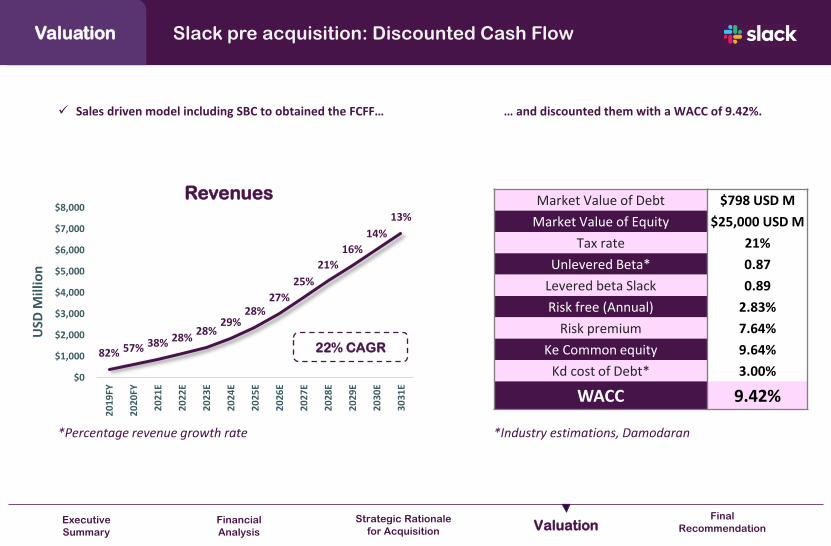
Slack pre acquisition: Discounted Cash Flow
Market Value of Debt $798 USD M
Market Value of Equity $25,000 USD M
Tax rate 21%
Unlevered Beta* 0.87
Levered beta Slack 0.89
Risk free (Annual) 2.83%
Risk premium 7.64%
Ke Common equity 9.64%
Kd cost of Debt* 3.00%
WACC 9.42%
82% 57% 38% 28%28%
29%28%
27%
25%
21%
16%
14%
13%
$0
$1,000
$2,000
$3,000
$4,000
$5,000
$6,000
$7,000
$8,000
20
19FY
20
20FY
20
21E
20
22E
20
23E
20
24E
20
25E
20
26E
20
27E
20
28E
20
29E
20
30E
30
31E
USD
Mill
ion
Revenues
*Percentage revenue growth rate
✓ Sales driven model including SBC to obtained the FCFF…
22% CAGR
… and discounted them with a WACC of 9.42%.
*Industry estimations, Damodaran
Executive
Summary
Strategic Rationale
for Acquisition

Valuation
Financial
Analysis
Final
RecommendationValuation
Slack pre acquisition: Discounted Cash Flow
✓ We decided to include SBC because of ownership dilution. Moreover, use a reinvestment factor of 1.75 following Damodaran’s method.
Team estimations
Management forecasts & Team estimations
Damodaran´s method
In Million USD 2022E 2023E 2024E 2025E 2026E 2027E 2028E 2029E 2030E 3031E
Revenues $1,116 $1,432 $1,847 $2,369 $3,009 $3,761 $4,551 $5,279 $6,018 $6,801
Revenues Growth Rate 28.3% 28.3% 29.0% 28.3% 27.0% 25.0% 21.0% 16.0% 14.0% 13.0%
Stock-based compensation (SBC) $77 $99 $127 $163 $208 $260 $314 $364 $415 $469
EBIT Including SBC ($92) ($5) $101 $234 $397 $589 $1,051 $1,219 $1,390 $1,571
EBIT (1- T) Including SBC ($92) ($5) $80 $185 $314 $466 $831 $963 $1,098 $1,241
EBIT (1-T) % of revenues -8.2% -0.4% 4.3% 7.8% 10.4% 12.4% 18.2% 18.2% 18.2% 18.2%
Reinvestments $140 $180 $237 $298 $365 $429 $450 $415 $421 $446
Free Cash Flow to Firm (With SBC) ($232) ($186) ($157) ($112) ($51) $37 $380 $548 $677 $795
FCFF % of revenues -20.8% -13.0% -8.5% -4.7% -1.7% 1.0% 8.4% 10.4% 11.2% 11.7%
Software industry average
PV(Terminal Value) PV(Cash Flows) Perpetual Growth
$6,908 $517 4.53%
Slack Individual DCF
Valuation 7.4 USD Bn
Executive
Summary
Strategic Rationale
for Acquisition

Valuation
Financial
Analysis
Final
RecommendationValuation
Slack pre acquisition: Relative Valuation
02468
1012141618
Text
ura
Co
rp.
Mar
keto
Inc.
Lin
ked
In C
orp
.
De
man
dw
are,
Inc
Net
suit
e In
c.
Cal
lidu
s So
ftw
are
, In
c
Mu
leSo
ft In
c.
Ad
apti
ve In
sigh
ts, I
nc
Ho
rto
nw
ork
s, In
c
Red
Hat
, In
c
Sen
dG
rid
, In
c
Ap
pti
o, I
nc
Min
db
oo
dy,
Inc
The
Ult
imat
e S
oft
war
eG
rou
p, I
nc.
Tab
leu
So
ftw
are
, In
c
Filtered Not Filtered Lineal (Filtered) Lineal (Not Filtered)
NTM Revenue Multiple
• NetSuite acquisition by Oracle
• Tableau acquisition by Salesforce
• Adaptive Insights acquisition by Workday
15,7$ Billion
1,55$ Billion
9,3$ Billion
Source: JP Morgan & Team Assessment
✓ Most of the transactions selected are software as a service companies acquiring other companies to complement the portfolio ofservices offered to their clients and maintain their market relevance.
Slack Individual DCF
Valuation 9.4 USD Bn
8.4 Revenue Multiple
Executive
Summary
Strategic Rationale
for Acquisition

Valuation
Financial
Analysis
Final
RecommendationValuation
4.7 0.9
Slack pre acquisition:
4.7 0.9We issued an ACQUISITION recommendation for Slack
Discounted Cash Flow (FCFF)
75% 25%
M&A Comps
7.9 USD Bn
Slack Company Value
Free Cash Flow to Firm
Sales-driven model Historical transactions
Revenue multiple analysisIncluding Stock-Based
Compensation
Considering both DCF and M&A Comps valuation
Individual value without synergy acquisition
7.4 USD Bn 9.4 USD Bn
Executive
Summary
Strategic Rationale
for Acquisition
Valuation
Financial
Analysis
Final
RecommendationValuation
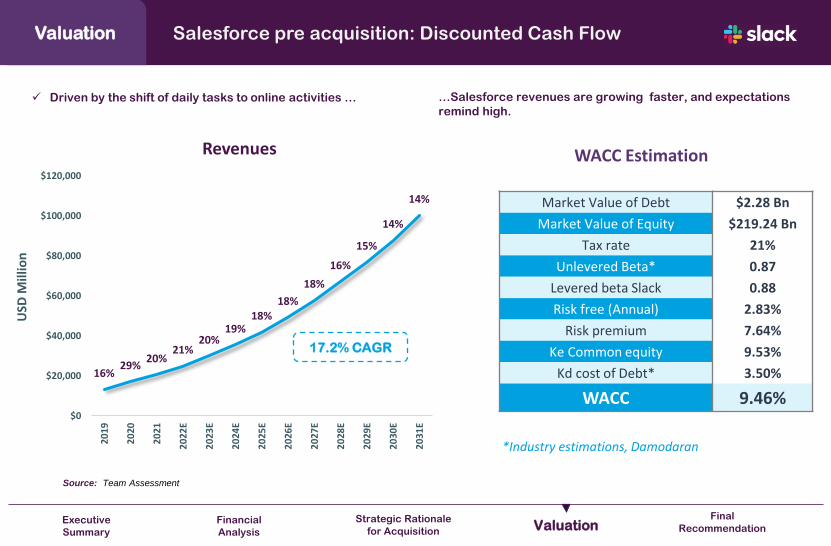
Salesforce pre acquisition: Discounted Cash Flow
✓ Driven by the shift of daily tasks to online activities … …Salesforce revenues are growing faster, and expectations
remind high.
16%29%
20%21%
20%19%
18%18%
18%
16%
15%
14%
14%
$0
$20,000
$40,000
$60,000
$80,000
$100,000
$120,000
20
19
20
20
20
21
20
22E
20
23E
20
24E
20
25E
20
26E
20
27E
20
28E
20
29E
20
30E
20
31E
Revenues
Source: Team Assessment
WACC Estimation
USD
Mill
ion
Market Value of Debt $2.28 Bn
Market Value of Equity $219.24 Bn
Tax rate 21%
Unlevered Beta* 0.87
Levered beta Slack 0.88
Risk free (Annual) 2.83%
Risk premium 7.64%
Ke Common equity 9.53%
Kd cost of Debt* 3.50%
WACC 9.46%
17.2% CAGR
*Industry estimations, Damodaran
Executive
Summary
Strategic Rationale
for Acquisition

Valuation
✓ Achieving higher revenues is Salesforce main objective. Therefore, our model is a sales-driven model
Financial
Analysis
Final
RecommendationValuation
Team estimations
Management forecasts & Team estimations
VP (Terminal Value) VP(FCF)Perpetual Growth
$206,548 $67,907 4.53%
In Million USD 2022E 2023E 2024E 2025E 2026E 2027E 2028E 2029E 2030E 2031E
Revenues $24,940 $29,929 $35,465 $41,938 $49,277 $57,900 $67,164 $76,903 $87,862 $100,338
Revenues Growth Rate 21% 20% 19% 18% 18% 18% 16% 15% 14% 14%
EBIT $1,267 $1,673 $2,181 $2,966 $4,007 $5,415 $7,224 $9,512 $12,497 $15,051
EBIT (1-T) $1,001 $1,322 $1,723 $2,343 $3,166 $4,278 $5,707 $7,514 $9,873 $11,890
EBIT (1-T) % of Revenues 4.0% 4.4% 4.9% 5.6% 6.4% 7.4% 8.5% 9.8% 11.2% 11.9%
Depreciation, Depletion & Amortization $2,117 $2,541 $3,011 $3,561 $4,184 $4,916 $5,702 $6,529 $7,459 $8,519
Capital Expenditures $1,284 $1,541 $1,826 $2,160 $2,538 $2,982 $3,459 $3,961 $4,525 $5,167
Change in Non Cash-NetWoring Capital -$2,602 -$2,872 -$3,551 -$4,112 -$4,883 -$5,707 -$6,638 -$7,590 -$8,678 -$9,907
Free Cash Flow (FCF) $4,436 $5,193 $6,459 $7,855 $9,695 $11,919 $14,588 $17,673 $21,485 $25,148
Salesforce Individual
DCF Valuation274.45 USD Bn
Executive
Summary
Strategic Rationale
for Acquisition
Salesforce pre acquisition: Discounted Cash Flow

Valuation
Financial
Analysis
Final
RecommendationValuation
0.9
Salesforce pre acquisition: Relative Valuation
-50
0
50
100
150
200
250
-1 4 9 14 19 24 29 34
EV/E
BIT
DA
EV/Revenues
Salesforce Multiple Prices
Multiple Estimation (Bn) Stock Price
EV/Revenues $254.6 $279.4
EV/EBITDA $78.3 $87.32
P/B $497.1 $541.64
P/S $412.2 $449.1
Median Price $339.4
$ 309.6 Billion
✓ Overall, the market expectations and ongoing crisis increased… …market cap of tech companies, nevertheless Salesforce is
still overpriced relative to its EBITDA
Multiple Analysis Enterprise
Value Ratio
Source: Refinitiv & Team Assessment *Note: Bubbles represent Market Cap
Relative Valuation estimated EV
*Note: Median Price Reduces Overestimation Bias
due to possible Outliers
Executive
Summary
Strategic Rationale
for Acquisition

Valuation
Financial
Analysis
Final
RecommendationValuation
Salesforce pre acquisition
4.70.9 4.70.9
Discounted Cash Flow (FCFF)
75% 25%
Relative Valuation
283.25 USD Bn
Salesforce Company Value
Free Cash Flow to Firm
Sales-driven model Historical transactions
Revenue multiple analysisIncluding Historical-Based
forecast
Salesforce will gain Market Share & Relevant customers Acquiring Slack
Executive
Summary
Strategic Rationale
for Acquisition
Valuation
Financial
Analysis
Final
RecommendationValuation
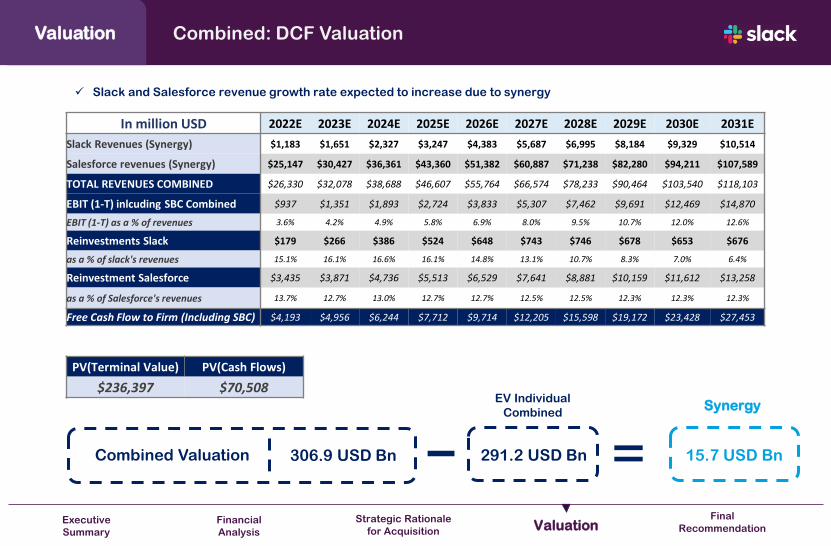
Combined: DCF Valuation
In million USD 2022E 2023E 2024E 2025E 2026E 2027E 2028E 2029E 2030E 2031E
Slack Revenues (Synergy) $1,183 $1,651 $2,327 $3,247 $4,383 $5,687 $6,995 $8,184 $9,329 $10,514
Salesforce revenues (Synergy) $25,147 $30,427 $36,361 $43,360 $51,382 $60,887 $71,238 $82,280 $94,211 $107,589
TOTAL REVENUES COMBINED $26,330 $32,078 $38,688 $46,607 $55,764 $66,574 $78,233 $90,464 $103,540 $118,103
EBIT (1-T) inlcuding SBC Combined $937 $1,351 $1,893 $2,724 $3,833 $5,307 $7,462 $9,691 $12,469 $14,870
EBIT (1-T) as a % of revenues 3.6% 4.2% 4.9% 5.8% 6.9% 8.0% 9.5% 10.7% 12.0% 12.6%
Reinvestments Slack $179 $266 $386 $524 $648 $743 $746 $678 $653 $676
as a % of slack's revenues 15.1% 16.1% 16.6% 16.1% 14.8% 13.1% 10.7% 8.3% 7.0% 6.4%
Reinvestment Salesforce $3,435 $3,871 $4,736 $5,513 $6,529 $7,641 $8,881 $10,159 $11,612 $13,258
as a % of Salesforce's revenues 13.7% 12.7% 13.0% 12.7% 12.7% 12.5% 12.5% 12.3% 12.3% 12.3%
Free Cash Flow to Firm (Including SBC) $4,193 $4,956 $6,244 $7,712 $9,714 $12,205 $15,598 $19,172 $23,428 $27,453
✓ Slack and Salesforce revenue growth rate expected to increase due to synergy
PV(Terminal Value) PV(Cash Flows)
$236,397 $70,508
Combined Valuation 306.9 USD Bn 291.2 USD Bn
EV Individual
Combined
15.7 USD Bn
Synergy
Executive
Summary
Strategic Rationale
for Acquisition

Final Recommendation

Final Recommendation
Financial
AnalysisFinal
Recommendation
Strategic Rationale
for AcquisitionValuation
4.7 0.9We issued a BUY recommendation for Slack
Discounted Cash
Flow (FCFF)
75% 25%
M&A Comps
23.7 USD Bn
Slack Company
Value
Free Cash Flow to
Firm
Sales driven model Historical
transactions
Revenue multiple
analysis
15.7 USD Bn
Value of Synergy
Including Stock-Based
Compensation
7.9 USD Bn
Individual value
Executive
Summary

Thank You