Embed Size (px)
DESCRIPTION
Â
Citation preview
www.malling.no
MARKET REPORT WINTER 2015 / 2016
PAGE 2 MARKET REPORT WINTER 2015 / 2016 / MACRO
peter t. malling sr.chairman — eiendomshuset malling & co
PAGE 2 MARKET REPORT WINTER 2015 / 2016 / INTRODUCTION
ICARUS FLEW TOO HIGH– HAS NORWAY AS WELL?
As we entered the fourth quarter of the year we saw trophy assets coming to the market. Historically, low prime yield has represented an opportunity for some investors to cash in a nice profit, while for others, such as international
investors, it has represented an opportunity to invest in high quality assets that rarely shift hands. In an increasingly global real estate market, a historically low yield in Oslo is not necessarily considered aggressive pricing from an
international perspective. Now, what can we expect for 2016?
Although interest rates are low and the yield gap is attractive, lending to commercial real estate is tightening up. New regulatory measures and falling yields are pushing domestic banks towards a more restrictive lending policy, and
we can see the effects of this already. Pan Scandinavian banks and international banks are offering better terms than domestic banks. Some local banks even state that they have no aspirations for further growth. This is also reflected in the latest lending survey from the Norwegian Central Bank, which shows a considerable reduction in commercial real
estate lending. The Financial Supervisory Authority of Norway has presented statistics which show that foreign banks’ lending growth has been 14 % in a period in which Norwegian banks only experienced 5 % growth.
Although Norway is bracing itself for a few years of lower economic growth than trend, and an oil price of USD/barrel 50, the economy is comparatively still doing quite well in the grand scheme of things. International investors have
recognised this, and have consequently been the main source of capital into the Norwegian market, representing roughly 40 % of all investments in the Norwegian market in 2015. Although there is an increased short-term risk in the economic environment, the long-term outlook is still very positive given the robustness of the Norwegian state
economy. An employment market where analysts believe the unemployment rate will peak at 5 % is a dream scenario in almost any other country. A steady job-market results in a steady demand for office and commercial space, and
there is virtually no speculative construction, contrary to what has been seen in many other countries where real estate has been suffering the consequences of speculation (such as China, Ireland, Spain et. al).
Although we believe the transaction market will cool off somewhat next year, it will continue to remain at a new “normal” level well above NOK 50 billion per year, given the injection of foreign capital that is
providing healthy liquidity in the marketplace.
We hope you enjoy our latest market report. Remember that Malling & Co is here to support you in all yourneeds in dealing with commercial real estate, including transaction support, tenant representation,
research services, rental services, valuations and asset management.
2015 is coming to an end and it has been a remarkable year, with record volumes in the transaction market and a
prime yield of just above 4 %. In our last market report we highlighted a market that was high on low interest rates.
But the question is – can this euphoric state of mind continue in 2016?
—

CONTENTSIntroduction . . . . . . . . . . . . . . . . . . . . . . . . . . . . . . . . . . . . . . . . . . . . . . . . . . . . . . . . . . . . . . . . . . . . . . . . . . . . . . . . . 2Macro . . . . . . . . . . . . . . . . . . . . . . . . . . . . . . . . . . . . . . . . . . . . . . . . . . . . . . . . . . . . . . . . . . . . . . . . . . . . . . . . . . . . . . . 4Oslo office market . . . . . . . . . . . . . . . . . . . . . . . . . . . . . . . . . . . . . . . . . . . . . . . . . . . . . . . . . . . . . . . . . . . . . . . . . . 8Stavanger . . . . . . . . . . . . . . . . . . . . . . . . . . . . . . . . . . . . . . . . . . . . . . . . . . . . . . . . . . . . . . . . . . . . . . . . . . . . . . . . . 28Drammen . . . . . . . . . . . . . . . . . . . . . . . . . . . . . . . . . . . . . . . . . . . . . . . . . . . . . . . . . . . . . . . . . . . . . . . . . . . . . . . . . 30Retail . . . . . . . . . . . . . . . . . . . . . . . . . . . . . . . . . . . . . . . . . . . . . . . . . . . . . . . . . . . . . . . . . . . . . . . . . . . . . . . . . . . . . . 32Industrial & Logistics . . . . . . . . . . . . . . . . . . . . . . . . . . . . . . . . . . . . . . . . . . . . . . . . . . . . . . . . . . . . . . . . . . . . 36 The transaction market . . . . . . . . . . . . . . . . . . . . . . . . . . . . . . . . . . . . . . . . . . . . . . . . . . . . . . . . . . . . . . . . . 38Key figures – Service charges . . . . . . . . . . . . . . . . . . . . . . . . . . . . . . . . . . . . . . . . . . . . . . . . . . . . . . . . . . 40About Malling & Co . . . . . . . . . . . . . . . . . . . . . . . . . . . . . . . . . . . . . . . . . . . . . . . . . . . . . . . . . . . . . . . . . . . . . . . 42
EDITING COMPLETED 18th November 2015DESIGN OG LAYOUT Børresen & Co
CONTENTS / MARKET REPORT WINTER 2015 / 2016 PAGE 3
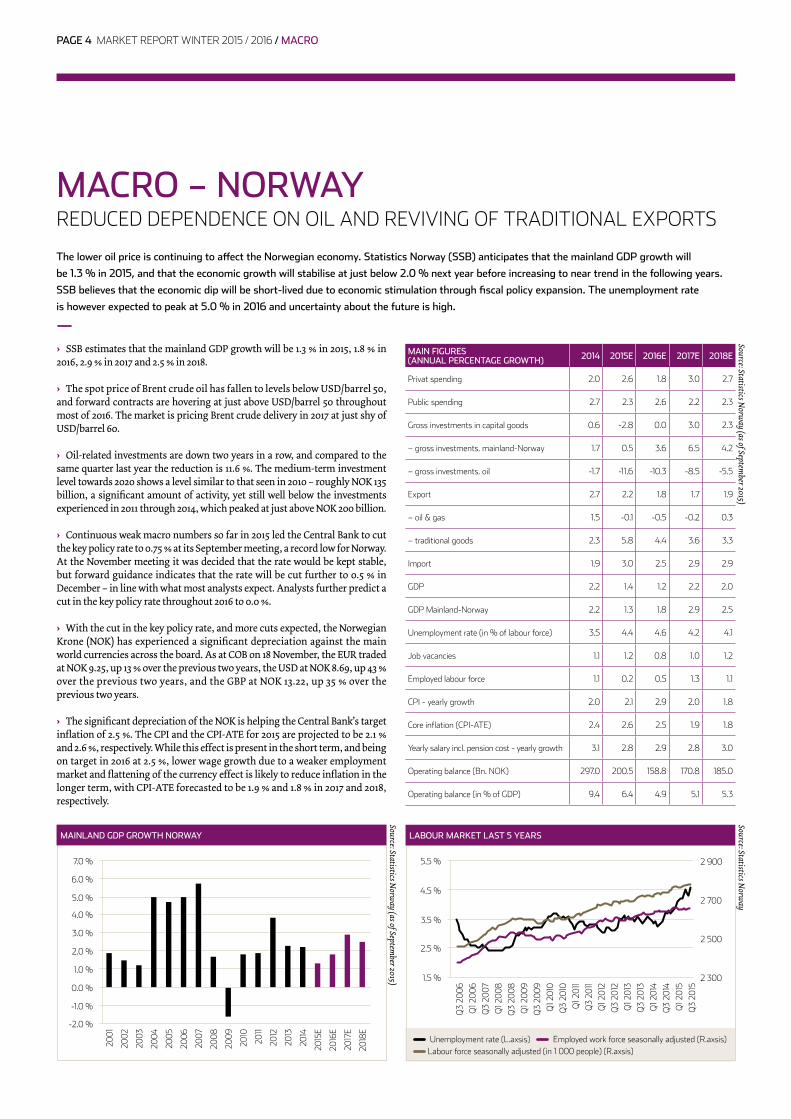
› SSB estimates that the mainland GDP growth will be 1.3 % in 2015, 1.8 % in 2016, 2.9 % in 2017 and 2.5 % in 2018.
› The spot price of Brent crude oil has fallen to levels below USD/barrel 50, and forward contracts are hovering at just above USD/barrel 50 throughout most of 2016. The market is pricing Brent crude delivery in 2017 at just shy of USD/barrel 60.
› Oil-related investments are down two years in a row, and compared to the same quarter last year the reduction is 11.6 %. The medium-term investment level towards 2020 shows a level similar to that seen in 2010 – roughly NOK 135 billion, a significant amount of activity, yet still well below the investments experienced in 2011 through 2014, which peaked at just above NOK 200 billion.
› Continuous weak macro numbers so far in 2015 led the Central Bank to cut the key policy rate to 0.75 % at its September meeting, a record low for Norway. At the November meeting it was decided that the rate would be kept stable, but forward guidance indicates that the rate will be cut further to 0.5 % in December – in line with what most analysts expect. Analysts further predict a cut in the key policy rate throughout 2016 to 0.0 %.
› With the cut in the key policy rate, and more cuts expected, the Norwegian Krone (NOK) has experienced a significant depreciation against the main world currencies across the board. As at COB on 18 November, the EUR traded at NOK 9.25, up 13 % over the previous two years, the USD at NOK 8.69, up 43 % over the previous two years, and the GBP at NOK 13.22, up 35 % over the previous two years.
› The significant depreciation of the NOK is helping the Central Bank’s target inflation of 2.5 %. The CPI and the CPI-ATE for 2015 are projected to be 2.1 % and 2.6 %, respectively. While this effect is present in the short term, and being on target in 2016 at 2.5 %, lower wage growth due to a weaker employment market and flattening of the currency effect is likely to reduce inflation in the longer term, with CPI-ATE forecasted to be 1.9 % and 1.8 % in 2017 and 2018, respectively.
MACRO – NORWAYREDUCED DEPENDENCE ON OIL AND REVIVING OF TRADITIONAL EXPORTS
MAIN FIGURES (ANNUAL PERCENTAGE GROWTH) 2014 2015E 2016E 2017E 2018E
Privat spending 2 .0 2 .6 1 .8 3 .0 2 .7
Public spending 2 .7 2 .3 2 .6 2 .2 2 .3
Gross investments in capital goods 0 .6 -2 .8 0 .0 3 .0 2 .3
– gross investments . mainland-Norway 1 .7 0 .5 3 .6 6 .5 4 .2
– gross investments . oil -1 .7 -11 .6 -10 .3 -8 .5 -5 .5
Export 2 .7 2 .2 1 .8 1 .7 1 .9
– oil & gas 1 .5 -0 .1 -0 .5 -0 .2 0 .3
– traditional goods 2 .3 5 .8 4 .4 3 .6 3 .3
Import 1 .9 3 .0 2 .5 2 .9 2 .9
GDP 2 .2 1 .4 1 .2 2 .2 2 .0
GDP Mainland-Norway 2 .2 1 .3 1 .8 2 .9 2 .5
Unemployment rate (in % of labour force) 3 .5 4 .4 4 .6 4 .2 4 .1
Job vacancies 1 .1 1 .2 0 .8 1 .0 1 .2
Employed labour force 1 .1 0 .2 0 .5 1 .3 1 .1
CPI - yearly growth 2 .0 2 .1 2 .9 2 .0 1 .8
Core inflation (CPI-ATE) 2 .4 2 .6 2 .5 1 .9 1 .8
Yearly salary incl . pension cost - yearly growth 3 .1 2 .8 2 .9 2 .8 3 .0
Operating balance (Bn . NOK) 297 .0 200 .5 158 .8 170 .8 185 .0
Operating balance (in % of GDP) 9 .4 6 .4 4 .9 5 .1 5 .3
The lower oil price is continuing to affect the Norwegian economy. Statistics Norway (SSB) anticipates that the mainland GDP growth will
be 1.3 % in 2015, and that the economic growth will stabilise at just below 2.0 % next year before increasing to near trend in the following years.
SSB believes that the economic dip will be short-lived due to economic stimulation through fiscal policy expansion. The unemployment rate
is however expected to peak at 5.0 % in 2016 and uncertainty about the future is high.
—
Source: Statistics Norw
ay (as of September 2015)
2001
2002
2003
2004
2005
2006
2007
2008
2009
2010
2011
2012
2013
2014
2015
E
2016
E
2017
E
2018
E
Unemployment rate (L .axsis) Employed work force seasonally adjusted (R .axsis) Labour force seasonally adjusted (in 1 000 people) (R .axsis)
MAINLAND GDP GROWTH NORWAY
Source: Statistics Norw
ay (as of September 2015)
7 .0 % 5 .5 %
4 .5 %
3 .5 %
2 .5 %
1 .5 %
2 900
2 700
2 500
2 300
6 .0 %
5 .0 %
4 .0 %
3 .0 %
2 .0 %
1 .0 %
0 .0 %
-1 .0 %
-2 .0 %
LABOUR MARKET LAST 5 YEARS
Source: Statistics Norw
ay
Q3
2006
Q1 2
006
Q3
2007
Q1 2
008
Q3
2008
Q1 2
009
Q3
2009
Q1 2
010
Q3
2010
Q1 2
011
Q3
2011
Q1 2
012
Q3
2012
Q1 2
013
Q3
2013
Q1 2
014
Q3
2014
Q1 2
015
Q3
2015
PAGE 4 MARKET REPORT WINTER 2015 / 2016 / MACRO
Sum Nibor + DNB 5Y 3 month Nibor Key policy rate
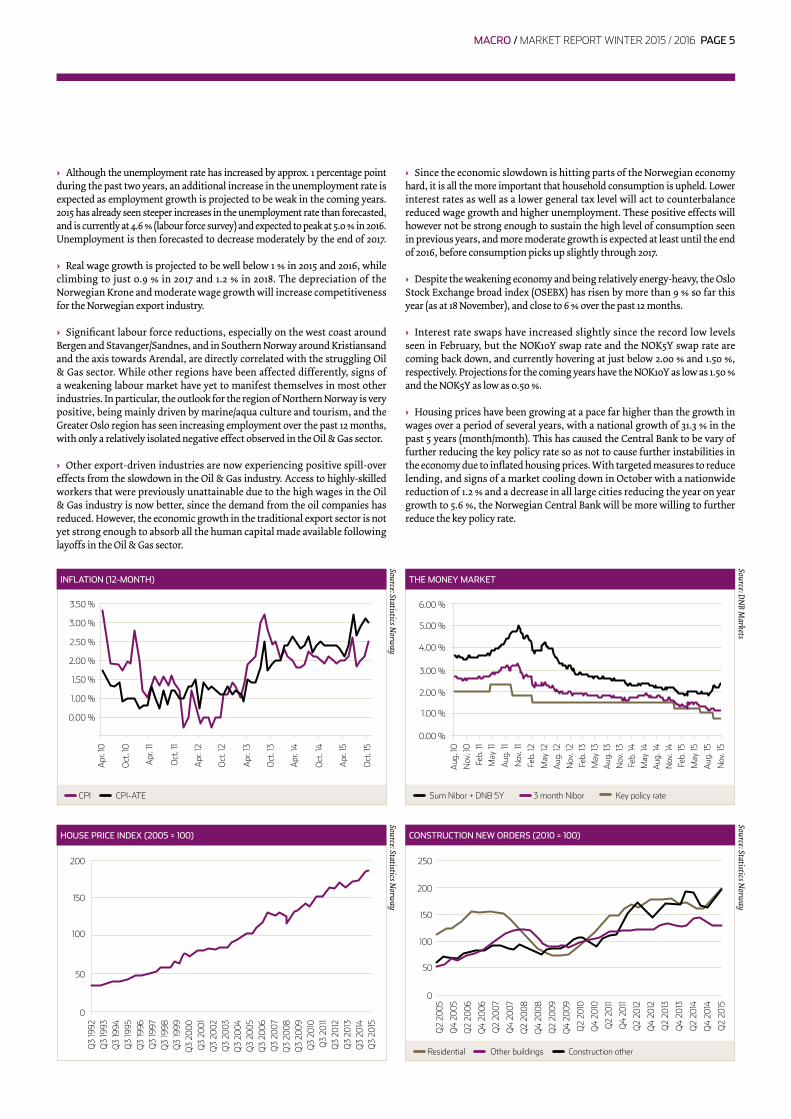
› Although the unemployment rate has increased by approx. 1 percentage point during the past two years, an additional increase in the unemployment rate is expected as employment growth is projected to be weak in the coming years. 2015 has already seen steeper increases in the unemployment rate than forecasted, and is currently at 4.6 % (labour force survey) and expected to peak at 5.0 % in 2016. Unemployment is then forecasted to decrease moderately by the end of 2017.
› Real wage growth is projected to be well below 1 % in 2015 and 2016, while climbing to just 0.9 % in 2017 and 1.2 % in 2018. The depreciation of the Norwegian Krone and moderate wage growth will increase competitiveness for the Norwegian export industry.
› Significant labour force reductions, especially on the west coast around Bergen and Stavanger/Sandnes, and in Southern Norway around Kristiansand and the axis towards Arendal, are directly correlated with the struggling Oil & Gas sector. While other regions have been affected differently, signs of a weakening labour market have yet to manifest themselves in most other industries. In particular, the outlook for the region of Northern Norway is very positive, being mainly driven by marine/aqua culture and tourism, and the Greater Oslo region has seen increasing employment over the past 12 months, with only a relatively isolated negative effect observed in the Oil & Gas sector.
› Other export-driven industries are now experiencing positive spill-over effects from the slowdown in the Oil & Gas industry. Access to highly-skilled workers that were previously unattainable due to the high wages in the Oil & Gas industry is now better, since the demand from the oil companies has reduced. However, the economic growth in the traditional export sector is not yet strong enough to absorb all the human capital made available following layoffs in the Oil & Gas sector.
› Since the economic slowdown is hitting parts of the Norwegian economy hard, it is all the more important that household consumption is upheld. Lower interest rates as well as a lower general tax level will act to counterbalance reduced wage growth and higher unemployment. These positive effects will however not be strong enough to sustain the high level of consumption seen in previous years, and more moderate growth is expected at least until the end of 2016, before consumption picks up slightly through 2017.
› Despite the weakening economy and being relatively energy-heavy, the Oslo Stock Exchange broad index (OSEBX) has risen by more than 9 % so far this year (as at 18 November), and close to 6 % over the past 12 months.
› Interest rate swaps have increased slightly since the record low levels seen in February, but the NOK10Y swap rate and the NOK5Y swap rate are coming back down, and currently hovering at just below 2.00 % and 1.50 %, respectively. Projections for the coming years have the NOK10Y as low as 1.50 % and the NOK5Y as low as 0.50 %.
› Housing prices have been growing at a pace far higher than the growth in wages over a period of several years, with a national growth of 31.3 % in the past 5 years (month/month). This has caused the Central Bank to be vary of further reducing the key policy rate so as not to cause further instabilities in the economy due to inflated housing prices. With targeted measures to reduce lending, and signs of a market cooling down in October with a nationwide reduction of 1.2 % and a decrease in all large cities reducing the year on year growth to 5.6 %, the Norwegian Central Bank will be more willing to further reduce the key policy rate.
THE MONEY MARKET
Source: DN
B Markets
6 .00 %
5 .00 %
4 .00 %
3 .00 %
2 .00 %
1 .00 %
0 .00 %
Aug
. 10
Nov
. 10
Feb .
11M
ay 11
Aug
. 11
Nov
. 11
Feb .
12
May
12A
ug . 1
2N
ov . 1
2Fe
b . 13
May
13A
ug . 1
3N
ov . 1
3Fe
b . 14
May
14A
ug . 1
4N
ov . 1
4Fe
b . 15
May
15
Aug
. 15
Nov
. 15
Residential Other buildings Construction other
HOUSE PRICE INDEX (2005 = 100)
Source: Statistics Norw
ay
200
150
100
50
0
Q3
1992
Q3
1993
Q3
1994
Q3
1995
Q3
1996
Q3
1997
Q3
1998
Q3
1999
Q3
2000
Q3
2001
Q3
2002
Q3
2003
Q3
2004
Q3
2005
Q3
2006
Q3
2007
Q3
2008
Q3
2009
Q3
2010
Q3
2011
Q3
2012
Q3
2013
Q3
2014
Q3
2015
CONSTRUCTION NEW ORDERS (2010 = 100)
Source: Statistics Norw
ay
0
50
100
150
200
250
Q2
2007
Q4
2009
Q2
2012
Q2
2005
Q4
2007
Q2
2010
Q4
2012
Q4
2005
Q2
2008
Q4
2010
Q2
2013
Q2
2006
Q4
2008
Q2
2011
Q4
2013
Q4
2006
Q2
2009
Q4
2011
Q2
2014
Q4
2014
Q2
2015
CPI CPI-ATE
INFLATION (12-MONTH)
Source: Statistics Norw
ay
3 .50 %
3 .00 %
2 .50 %
2 .00 %
1 .50 %
1 .00 %
0 .00 %
Apr
. 10
Oct
. 10
Apr
. 11
Oct
. 11
Apr
. 12
Oct
. 12
Apr
. 13
Oct
. 13
Apr
. 14
Oct
. 14
Apr
. 15
Oct
. 15
MACRO / MARKET REPORT WINTER 2015 / 2016 PAGE 5
Source: IMF W
orld Economic O
utlook (as of October 2015)
ANNUAL GDP GROWTH (PERCENT) 2014 2015E 2016E 2017E 2018E
Global 3 .4 3 .1 3 .6 3 .8 3 .9
The US 2 .4 2 .6 2 .8 2 .8 2 .7
EU 28 1 .5 1 .9 1 .9 2 .0 1 .9
The Eurozone 0 .9 1 .5 1 .6 1 .7 1 .6
Advanced economies 1 .7 1 .9 2 .2 2 .1 2 .1
Emerging and developing Europe 2 .8 3 .0 3 .0 3 .4 3 .3
Germany 1 .6 1 .5 1 .6 1 .5 1 .3
France 0 .2 1 .2 1 .5 1 .6 1 .7
The UK 3 .0 2 .5 2 .2 2 .2 2 .2
Sweden 2 .3 2 .8 3 .0 2 .7 2 .5
Denmark 1 .1 1 .6 2 .0 2 .1 2 .2
Italy -0 .4 0 .8 1 .3 1 .2 1 .1
Japan -0 .1 0 .6 1 .0 0 .4 0 .7
China 7 .3 6 .8 6 .3 6 .0 6 .1
Russia 0 .6 -3 .8 -0 .6 1 .0 1 .5
Middle East and North Africa 2 .6 2 .3 3 .8 4 .1 4 .1
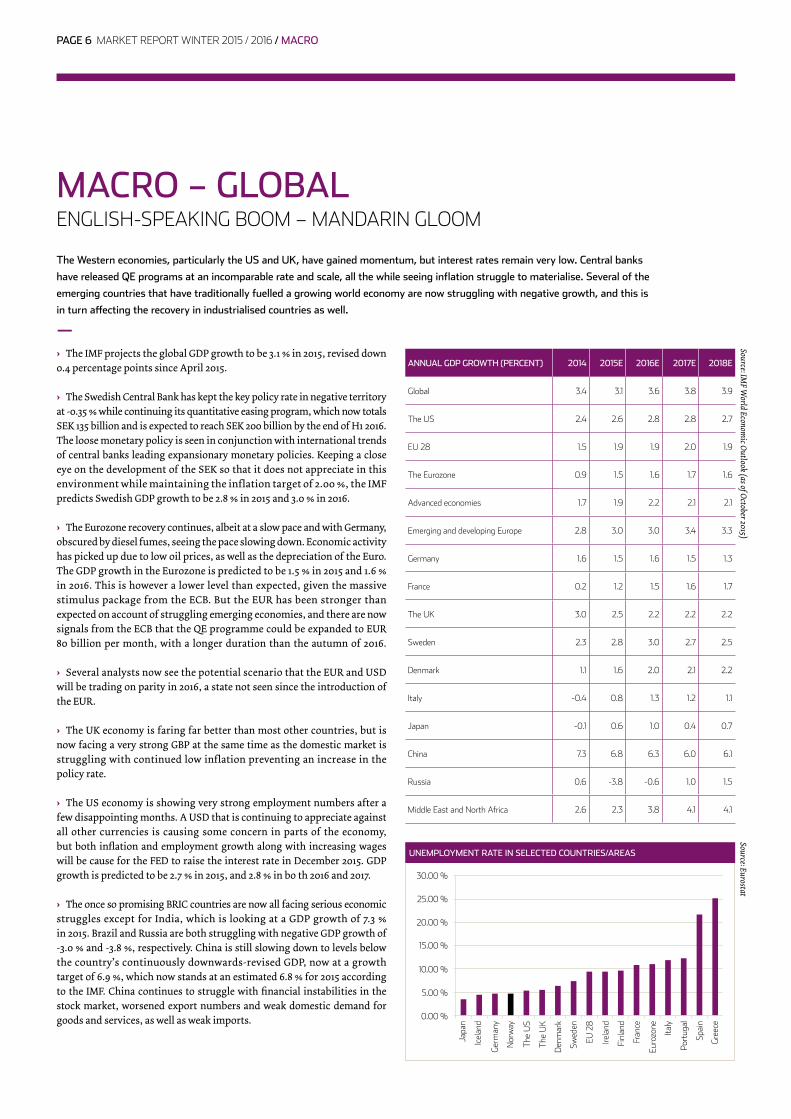
› The IMF projects the global GDP growth to be 3.1 % in 2015, revised down 0.4 percentage points since April 2015.
› The Swedish Central Bank has kept the key policy rate in negative territory at -0.35 % while continuing its quantitative easing program, which now totals SEK 135 billion and is expected to reach SEK 200 billion by the end of H1 2016. The loose monetary policy is seen in conjunction with international trends of central banks leading expansionary monetary policies. Keeping a close eye on the development of the SEK so that it does not appreciate in this environment while maintaining the inflation target of 2.00 %, the IMF predicts Swedish GDP growth to be 2.8 % in 2015 and 3.0 % in 2016.
› The Eurozone recovery continues, albeit at a slow pace and with Germany, obscured by diesel fumes, seeing the pace slowing down. Economic activity has picked up due to low oil prices, as well as the depreciation of the Euro. The GDP growth in the Eurozone is predicted to be 1.5 % in 2015 and 1.6 % in 2016. This is however a lower level than expected, given the massive stimulus package from the ECB. But the EUR has been stronger than expected on account of struggling emerging economies, and there are now signals from the ECB that the QE programme could be expanded to EUR 80 billion per month, with a longer duration than the autumn of 2016.
› Several analysts now see the potential scenario that the EUR and USD will be trading on parity in 2016, a state not seen since the introduction of the EUR.
› The UK economy is faring far better than most other countries, but is now facing a very strong GBP at the same time as the domestic market is struggling with continued low inflation preventing an increase in the policy rate.
› The US economy is showing very strong employment numbers after a few disappointing months. A USD that is continuing to appreciate against all other currencies is causing some concern in parts of the economy, but both inflation and employment growth along with increasing wages will be cause for the FED to raise the interest rate in December 2015. GDP growth is predicted to be 2.7 % in 2015, and 2.8 % in bo th 2016 and 2017.
› The once so promising BRIC countries are now all facing serious economic struggles except for India, which is looking at a GDP growth of 7.3 % in 2015. Brazil and Russia are both struggling with negative GDP growth of -3.0 % and -3.8 %, respectively. China is still slowing down to levels below the country’s continuously downwards-revised GDP, now at a growth target of 6.9 %, which now stands at an estimated 6.8 % for 2015 according to the IMF. China continues to struggle with financial instabilities in the stock market, worsened export numbers and weak domestic demand for goods and services, as well as weak imports.
MACRO – GLOBALENGLISH-SPEAKING BOOM – MANDARIN GLOOM
The Western economies, particularly the US and UK, have gained momentum, but interest rates remain very low. Central banks
have released QE programs at an incomparable rate and scale, all the while seeing inflation struggle to materialise. Several of the
emerging countries that have traditionally fuelled a growing world economy are now struggling with negative growth, and this is
in turn affecting the recovery in industrialised countries as well.
—
Source: Eurostat
UNEMPLOYMENT RATE IN SELECTED COUNTRIES/AREAS
0 .00 %
5 .00 %
10 .00 %
15 .00 %
20 .00 %
25 .00 %
30 .00 %
Japa
n
Icel
and
Ger
man
y
Nor
way
The
US
The
UK
Den
mar
k
Swed
en
EU 2
8
Irela
nd
Finl
and
Fran
ce
Euro
zone
Italy
Port
ugal
Spai
n
Gre
ece
PAGE 6 MARKET REPORT WINTER 2015 / 2016 / MACRO
PROJECT EDGE
Malling & Co Eiendomskapital has advised Tristan Capital Partners in their acquisition of a retail big box portfolio of 8 properties across Norway.
MACRO / MARKET REPORT WINTER 2015 / 2016 PAGE 7
*Net Employment Outlook is derived by taking the percentage of employers anticipating an increase in hiring activity and subtracting from this the percentage of employers expecting to see a decrease in employment at their location in the next quarter (Q4 2015) .
Bottom 4 All Top 4**Norwegian Labour and Welfare Administration .
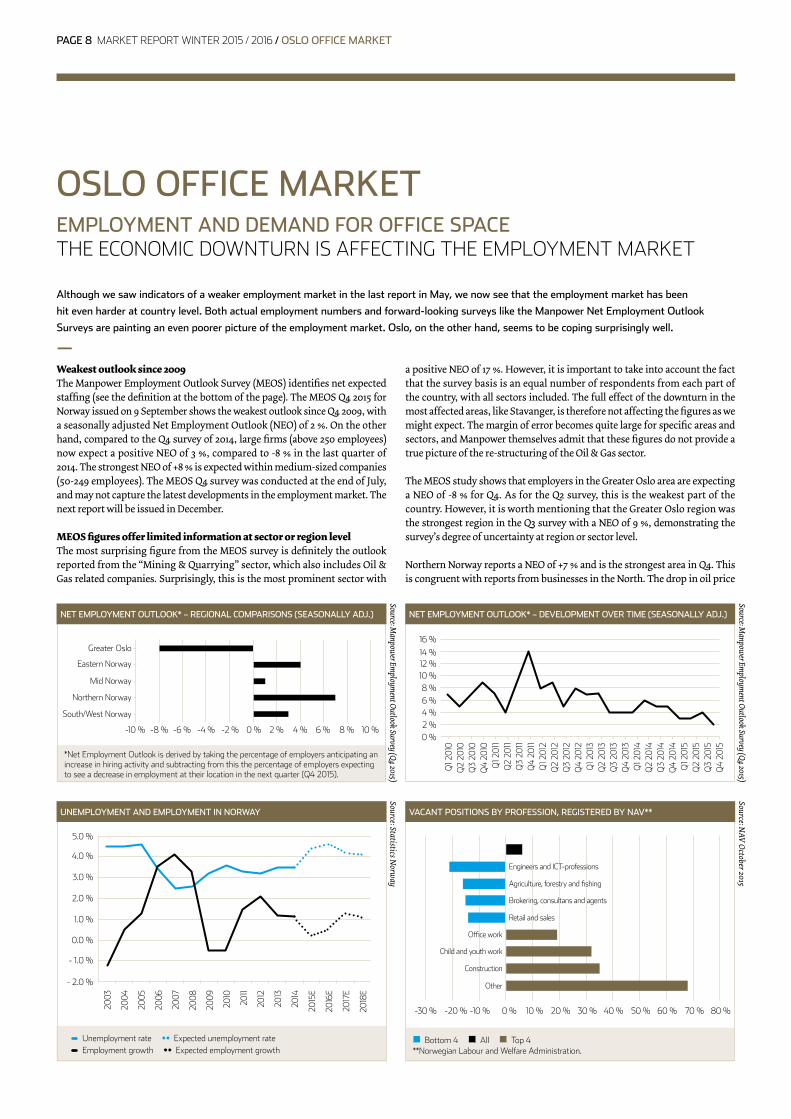
Weakest outlook since 2009The Manpower Employment Outlook Survey (MEOS) identifies net expected staffing (see the definition at the bottom of the page). The MEOS Q4 2015 for Norway issued on 9 September shows the weakest outlook since Q4 2009, with a seasonally adjusted Net Employment Outlook (NEO) of 2 %. On the other hand, compared to the Q4 survey of 2014, large firms (above 250 employees) now expect a positive NEO of 3 %, compared to -8 % in the last quarter of 2014. The strongest NEO of +8 % is expected within medium-sized companies (50-249 employees). The MEOS Q4 survey was conducted at the end of July, and may not capture the latest developments in the employment market. The next report will be issued in December.
MEOS figures offer limited information at sector or region levelThe most surprising figure from the MEOS survey is definitely the outlook reported from the “Mining & Quarrying” sector, which also includes Oil & Gas related companies. Surprisingly, this is the most prominent sector with
EMPLOYMENT AND DEMAND FOR OFFICE SPACETHE ECONOMIC DOWNTURN IS AFFECTING THE EMPLOYMENT MARKET
Although we saw indicators of a weaker employment market in the last report in May, we now see that the employment market has been
hit even harder at country level. Both actual employment numbers and forward-looking surveys like the Manpower Net Employment Outlook
Surveys are painting an even poorer picture of the employment market. Oslo, on the other hand, seems to be coping surprisingly well.
—
NET EMPLOYMENT OUTLOOK* – DEVELOPMENT OVER TIME (SEASONALLY ADJ.)
Source: Manpow
er Employm
ent Outlook Survey (Q4 2015)
0 %2 %4 %6 %8 %
10 %12 %14 %
16 %
Q1 2
010
Q2
2010
Q3
2010
Q4
2010
Q1 2
011
Q2
2011
Q3
2011
Q4
2011
Q1 2
012
Q2
2012
Q3
2012
Q4
2012
Q1 2
013
Q2
2013
Q3
2013
Q4
2013
Q1 2
014
Q2
2014
Q3
2014
Q4
2014
Q1 2
015
Q2
2015
Q3
2015
Q4
2015
VACANT POSITIONS BY PROFESSION, REGISTERED BY NAV**
Source: NAV O
ctober 2015
UNEMPLOYMENT AND EMPLOYMENT IN NORWAY
Source: Statistics Norw
ay
Unemployment rate Expected unemployment rate Employment growth Expected employment growth
- 1.0 %
- 2.0 %
0.0 %
1.0 %
2.0 %
3.0 %
4.0 %
5.0 %
80 %70 %60 %50 %40 %30 %20 %10 %0 %-10 %-20 %-30 %
NET EMPLOYMENT OUTLOOK* – REGIONAL COMPARISONS (SEASONALLY ADJ.)
Source: Manpow
er Employm
ent Outlook Survey (Q4 2015)
-6 %-8 %
Greater Oslo
-4 %-10 % -2 % 0 % 2 % 4 % 6 % 8 % 10 %
South/West Norway
Northern Norway
Mid Norway
Eastern Norway
Brokering, consultans and agents
Retail and sales
Office work
Child and youth work
Construction
Other
Agriculture, forestry and fishing
Engineers and ICT-professions
2003
2004
2005
2006
2007
2010
2011
2012
2013
2014
2015
E
2016
E
2017
E
2018
E
2009
2008
a positive NEO of 17 %. However, it is important to take into account the fact that the survey basis is an equal number of respondents from each part of the country, with all sectors included. The full effect of the downturn in the most affected areas, like Stavanger, is therefore not affecting the figures as we might expect. The margin of error becomes quite large for specific areas and sectors, and Manpower themselves admit that these figures do not provide a true picture of the re-structuring of the Oil & Gas sector.
The MEOS study shows that employers in the Greater Oslo area are expecting a NEO of -8 % for Q4. As for the Q2 survey, this is the weakest part of the country. However, it is worth mentioning that the Greater Oslo region was the strongest region in the Q3 survey with a NEO of 9 %, demonstrating the survey’s degree of uncertainty at region or sector level.
Northern Norway reports a NEO of +7 % and is the strongest area in Q4. This is congruent with reports from businesses in the North. The drop in oil price
OSLO OFFICE MARKET
PAGE 8 MARKET REPORT WINTER 2015 / 2016 / OSLO OFFICE MARKET
has significantly depreciated the NOK, which has made Norwegian seafood and tourism attractive. These are very good examples of other industries indirectly benefiting from the drop in oil price.
The South West region reports a NEO of 3 percentage points, which seems positive taking into account the fact that Stavanger, the oil capital of Norway, is located in this region. Unemployment reported by NAV in the Stavanger region has increased significantly during the past year (more than 100 %), although from a very low level. The register-based unemployment rate in Stavanger (not including people on work search programs) is now 4.2 %, compared to 3.3 % in Oslo.
Because the MEOS study has certain limitations when it comes to sector or region, we find it more interesting to investigate labour market figures for sectors or regions reported by NAV (the Norwegian Labour and Welfare Administration) and SSB (Statistics Norway). Looking at the NAV figures, we see that engineering and ICT professions have seen the strongest growth in unemployment with a change of -21 % in available jobs. This correlates with the workforce cuts seen in the Oil & Gas sector. It is also worth mentioning
that the Retail & Sales sector is also among the top four, with a change of -14 % in available jobs.
NAV and SSB figures paint a relatively positive picture for OsloThe ratio of registered unemployed persons reported by NAV in October 2015 shows a stable development for the labour market in Oslo compared to last year, with a flat 4.0 % of the total workforce unemployed or seeking work. If we take a closer look at the figures from NAV, we see that there has been an increase of 4.0 % in vacant positions in Oslo, and 15.0 % in the surrounding county of Akershus. The labour force survey from Statistics Norway also indicates a net increase of approx. 3 000 employees in Oslo and 10 000 in Akershus when comparing Q3 numbers in 2014 with those in 2015. It seems that the negative effects of the Oil & Gas sector are limited, and that Oslo has a more diversified portfolio of business sectors compared to other regions. It should be noted, however, that available statistics from the labour market are limited to either sectors or geographical location, and that combined statistics are lacking. This makes it difficult to directly connect the labour market figures to the demand for office space on a local level.
SANDSTUVEIEN 68, RYEN
Malling & Co Forvaltning assists Watrium AS with the economic management of a BREEAM-NOR Excellent office building (13 500 m2).
OSLO OFFICE MARKET / MARKET REPORT WINTER 2015 / 2016 PAGE 9
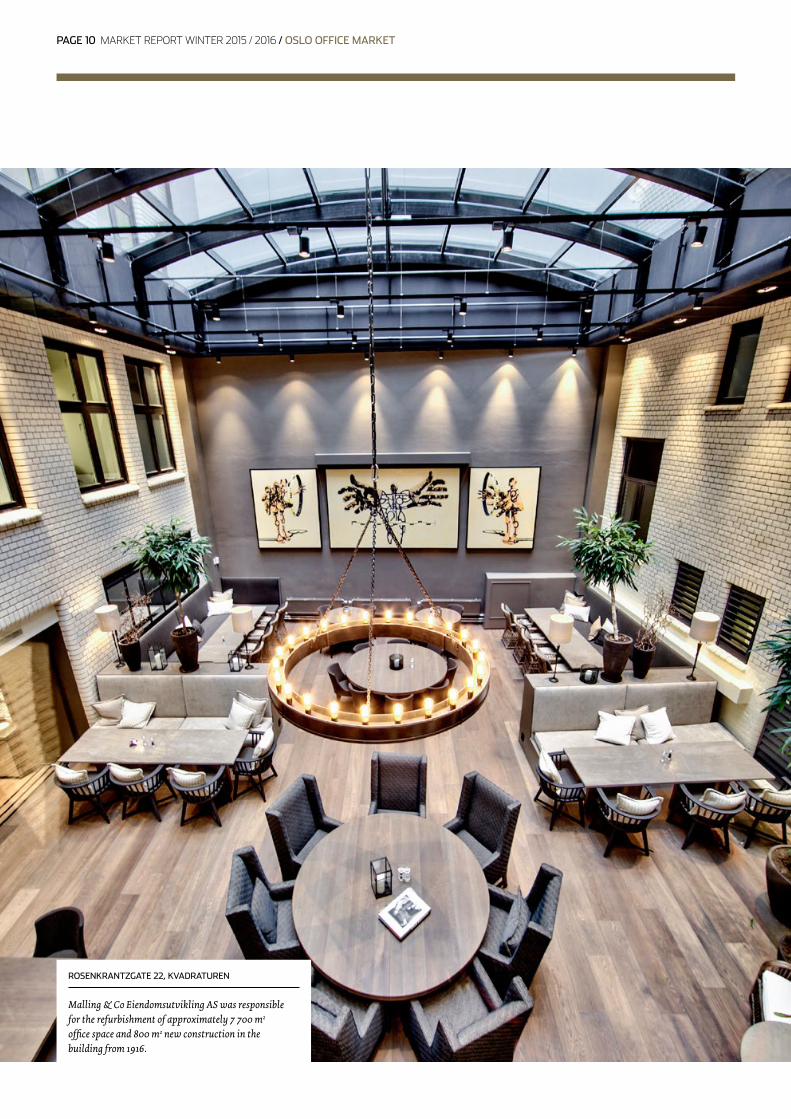
ROSENKRANTZGATE 22, KVADRATUREN
Malling & Co Eiendomsutvikling AS was responsible for the refurbishment of approximately 7 700 m2 office space and 800 m2 new construction in the building from 1916.
PAGE 10 MARKET REPORT WINTER 2015 / 2016 / OSLO OFFICE MARKET
‹ 5 000 m2 > 5 000 m2
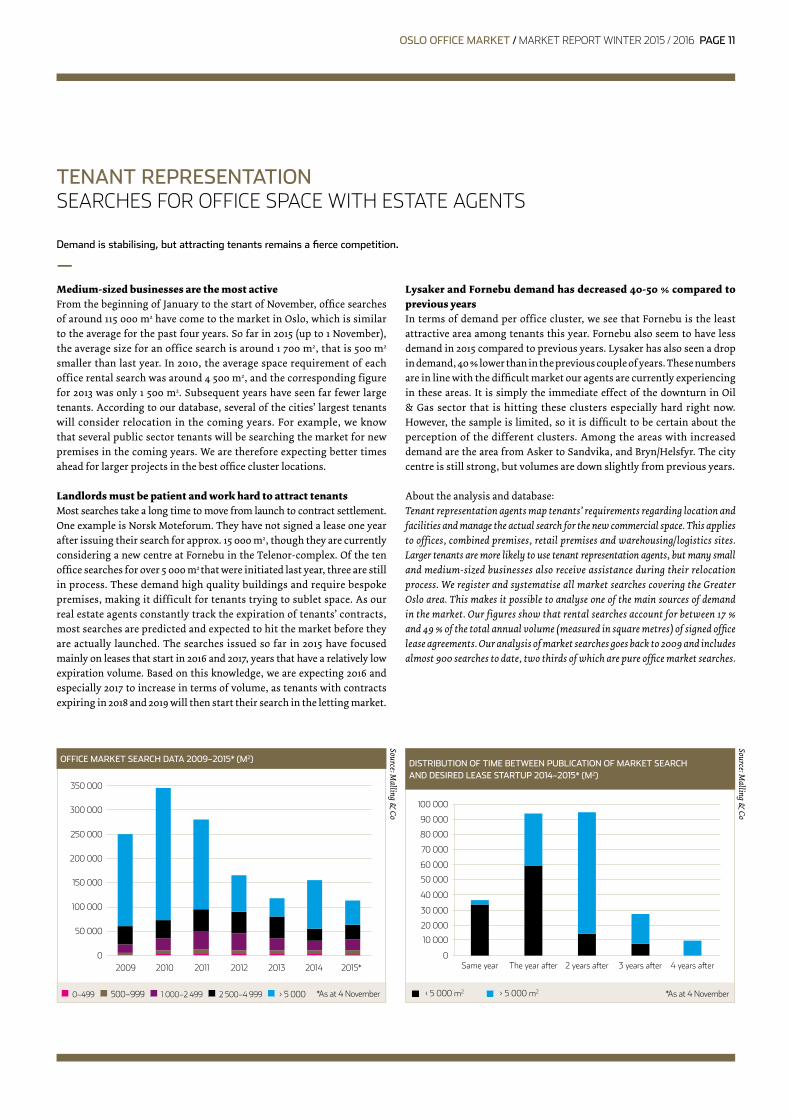
Medium-sized businesses are the most activeFrom the beginning of January to the start of November, office searches of around 115 000 m2 have come to the market in Oslo, which is similar to the average for the past four years. So far in 2015 (up to 1 November), the average size for an office search is around 1 700 m2, that is 500 m2
smaller than last year. In 2010, the average space requirement of each office rental search was around 4 500 m2, and the corresponding figure for 2013 was only 1 500 m2. Subsequent years have seen far fewer large tenants. According to our database, several of the cities’ largest tenants will consider relocation in the coming years. For example, we know that several public sector tenants will be searching the market for new premises in the coming years. We are therefore expecting better times ahead for larger projects in the best office cluster locations.
Landlords must be patient and work hard to attract tenantsMost searches take a long time to move from launch to contract settlement. One example is Norsk Moteforum. They have not signed a lease one year after issuing their search for approx. 15 000 m2, though they are currently considering a new centre at Fornebu in the Telenor-complex. Of the ten office searches for over 5 000 m2 that were initiated last year, three are still in process. These demand high quality buildings and require bespoke premises, making it difficult for tenants trying to sublet space. As our real estate agents constantly track the expiration of tenants’ contracts, most searches are predicted and expected to hit the market before they are actually launched. The searches issued so far in 2015 have focused mainly on leases that start in 2016 and 2017, years that have a relatively low expiration volume. Based on this knowledge, we are expecting 2016 and especially 2017 to increase in terms of volume, as tenants with contracts expiring in 2018 and 2019 will then start their search in the letting market.
TENANT REPRESENTATIONSEARCHES FOR OFFICE SPACE WITH ESTATE AGENTS
Demand is stabilising, but attracting tenants remains a fierce competition.
—Lysaker and Fornebu demand has decreased 40-50 % compared to previous yearsIn terms of demand per office cluster, we see that Fornebu is the least attractive area among tenants this year. Fornebu also seem to have less demand in 2015 compared to previous years. Lysaker has also seen a drop in demand, 40 % lower than in the previous couple of years. These numbers are in line with the difficult market our agents are currently experiencing in these areas. It is simply the immediate effect of the downturn in Oil & Gas sector that is hitting these clusters especially hard right now. However, the sample is limited, so it is difficult to be certain about the perception of the different clusters. Among the areas with increased demand are the area from Asker to Sandvika, and Bryn/Helsfyr. The city centre is still strong, but volumes are down slightly from previous years.
About the analysis and database: Tenant representation agents map tenants’ requirements regarding location and facilities and manage the actual search for the new commercial space. This applies to offices, combined premises, retail premises and warehousing/logistics sites. Larger tenants are more likely to use tenant representation agents, but many small and medium-sized businesses also receive assistance during their relocation process. We register and systematise all market searches covering the Greater Oslo area. This makes it possible to analyse one of the main sources of demand in the market. Our figures show that rental searches account for between 17 % and 49 % of the total annual volume (measured in square metres) of signed office lease agreements. Our analysis of market searches goes back to 2009 and includes almost 900 searches to date, two thirds of which are pure office market searches.
Source: Malling &
Co
OFFICE MARKET SEARCH DATA 2009–2015* (M2)
0–499 500–999 1 000–2 499 2 500–4 999 > 5 000
350 000
300 000
250 000
200 000
150 000
100 000
50 000
02009 2010 2011 2012 2013 2014 2015*
Source: Malling &
Co
DISTRIBUTION OF TIME BETWEEN PUBLICATION OF MARKET SEARCHAND DESIRED LEASE STARTUP 2014–2015* (M2)
70 000
80 000
90 000
100 000
60 000
50 000
40 000
30 000
20 000
10 000
04 years after3 years after2 years afterThe year afterSame year
*As at 4 November *As at 4 November
OSLO OFFICE MARKET / MARKET REPORT WINTER 2015 / 2016 PAGE 11
INNER CITY
OSLO WEST
OSLO EAST
OSLO OUTER EAST
OSLO OUTER SOUTH
OSLO OUTER WEST
BÆRUM
ASKER
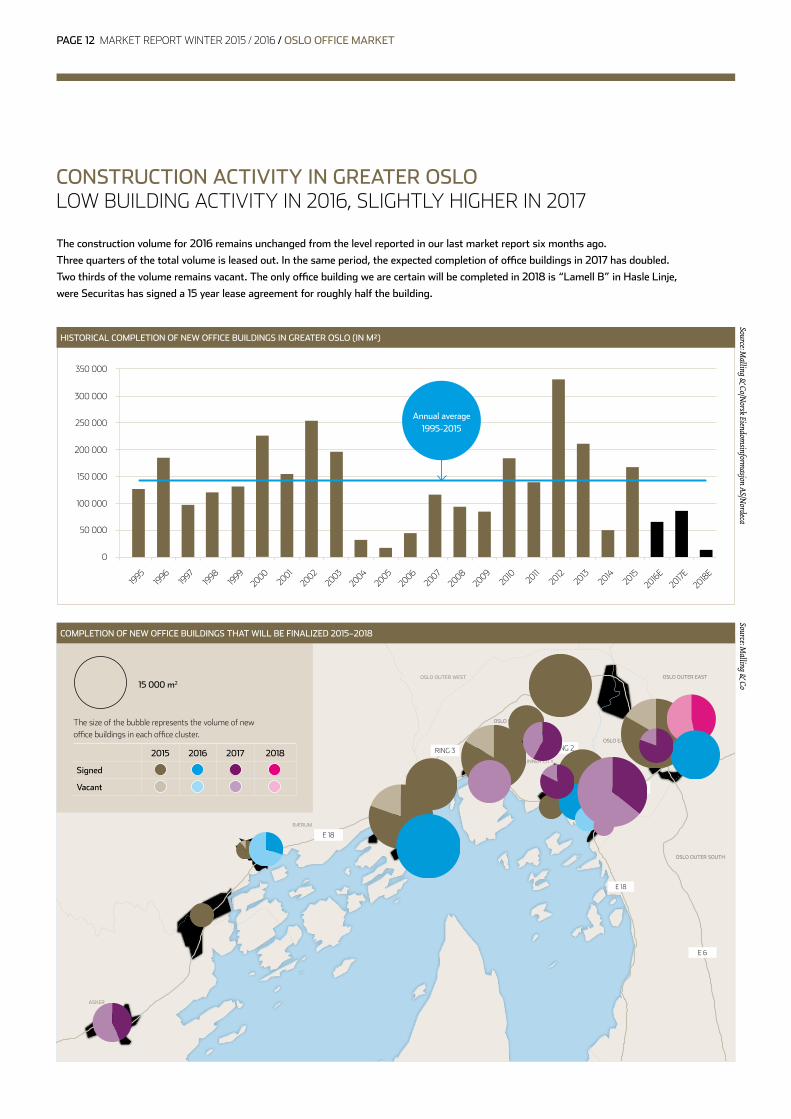
The construction volume for 2016 remains unchanged from the level reported in our last market report six months ago.
Three quarters of the total volume is leased out. In the same period, the expected completion of office buildings in 2017 has doubled.
Two thirds of the volume remains vacant. The only office building we are certain will be completed in 2018 is “Lamell B” in Hasle Linje,
were Securitas has signed a 15 year lease agreement for roughly half the building.
Source: Malling &
Co/Norsk Eiendom
sinformasjon AS/N
ordecaSource: M
alling & Co
HISTORICAL COMPLETION OF NEW OFFICE BUILDINGS IN GREATER OSLO (IN M²)
COMPLETION OF NEW OFFICE BUILDINGS THAT WILL BE FINALIZED 2015–2018
350 000
300 000
250 000
200 000
150 000
100 000
50 000
0
1995
1996
1997
1998
1999
20002001
20022003
20042005
20062007
20082009
2010 20112012
20132014
20152016
E2017E
2018E
15 000 m2
The size of the bubble represents the volume of new office buildings in each office cluster .
2015 2016 2017 2018
Signed
Vacant
CONSTRUCTION ACTIVITY IN GREATER OSLOLOW BUILDING ACTIVITY IN 2016, SLIGHTLY HIGHER IN 2017
Annual average 1995-2015
PAGE 12 MARKET REPORT WINTER 2015 / 2016 / OSLO OFFICE MARKET
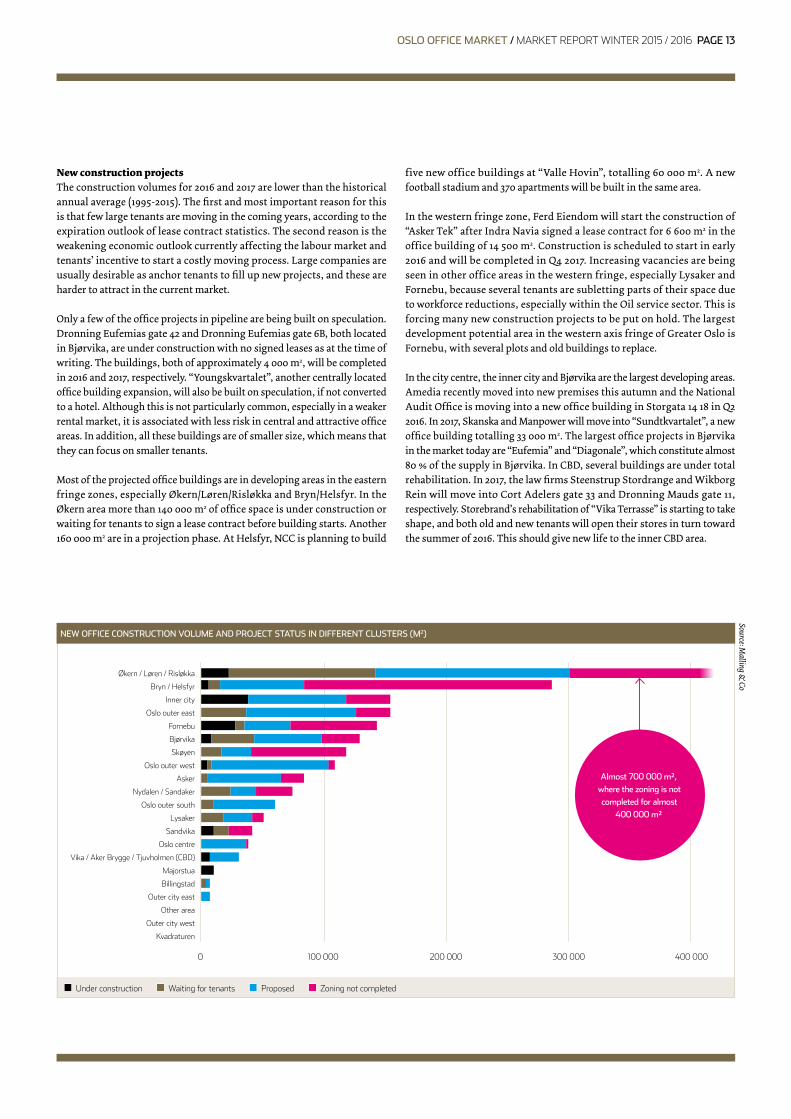
New construction projectsThe construction volumes for 2016 and 2017 are lower than the historical annual average (1995-2015). The first and most important reason for this is that few large tenants are moving in the coming years, according to the expiration outlook of lease contract statistics. The second reason is the weakening economic outlook currently affecting the labour market and tenants’ incentive to start a costly moving process. Large companies are usually desirable as anchor tenants to fill up new projects, and these are harder to attract in the current market.
Only a few of the office projects in pipeline are being built on speculation. Dronning Eufemias gate 42 and Dronning Eufemias gate 6B, both located in Bjørvika, are under construction with no signed leases as at the time of writing. The buildings, both of approximately 4 000 m2, will be completed in 2016 and 2017, respectively. “Youngskvartalet”, another centrally located office building expansion, will also be built on speculation, if not converted to a hotel. Although this is not particularly common, especially in a weaker rental market, it is associated with less risk in central and attractive office areas. In addition, all these buildings are of smaller size, which means that they can focus on smaller tenants.
Most of the projected office buildings are in developing areas in the eastern fringe zones, especially Økern/Løren/Risløkka and Bryn/Helsfyr. In the Økern area more than 140 000 m2 of office space is under construction or waiting for tenants to sign a lease contract before building starts. Another 160 000 m2 are in a projection phase. At Helsfyr, NCC is planning to build
five new office buildings at “Valle Hovin”, totalling 60 000 m2. A new football stadium and 370 apartments will be built in the same area.
In the western fringe zone, Ferd Eiendom will start the construction of “Asker Tek” after Indra Navia signed a lease contract for 6 600 m2 in the office building of 14 500 m2. Construction is scheduled to start in early 2016 and will be completed in Q4 2017. Increasing vacancies are being seen in other office areas in the western fringe, especially Lysaker and Fornebu, because several tenants are subletting parts of their space due to workforce reductions, especially within the Oil service sector. This is forcing many new construction projects to be put on hold. The largest development potential area in the western axis fringe of Greater Oslo is Fornebu, with several plots and old buildings to replace.
In the city centre, the inner city and Bjørvika are the largest developing areas. Amedia recently moved into new premises this autumn and the National Audit Office is moving into a new office building in Storgata 14 18 in Q2 2016. In 2017, Skanska and Manpower will move into “Sundtkvartalet”, a new office building totalling 33 000 m2. The largest office projects in Bjørvika in the market today are “Eufemia” and “Diagonale”, which constitute almost 80 % of the supply in Bjørvika. In CBD, several buildings are under total rehabilitation. In 2017, the law firms Steenstrup Stordrange and Wikborg Rein will move into Cort Adelers gate 33 and Dronning Mauds gate 11, respectively. Storebrand’s rehabilitation of “Vika Terrasse” is starting to take shape, and both old and new tenants will open their stores in turn toward the summer of 2016. This should give new life to the inner CBD area.
Under construction Waiting for tenants Proposed Zoning not completed
NEW OFFICE CONSTRUCTION VOLUME AND PROJECT STATUS IN DIFFERENT CLUSTERS (M2)
Source: Malling &
Co
Vika / Aker Brygge / Tjuvholmen (CBD)
Kvadraturen
Outer city west
Other area
Outer city east
Billingstad
Majorstua
Oslo centre
Sandvika
Lysaker
Oslo outer south
Nydalen / Sandaker
Asker
Oslo outer west
Skøyen
Bjørvika
Fornebu
Oslo outer east
Inner city
Bryn / Helsfyr
Økern / Løren / Risløkka
0 100 000 200 000 300 000 400 000
Almost 700 000 m², where the zoning is not completed for almost
400 000 m²
OSLO OFFICE MARKET / MARKET REPORT WINTER 2015 / 2016 PAGE 13
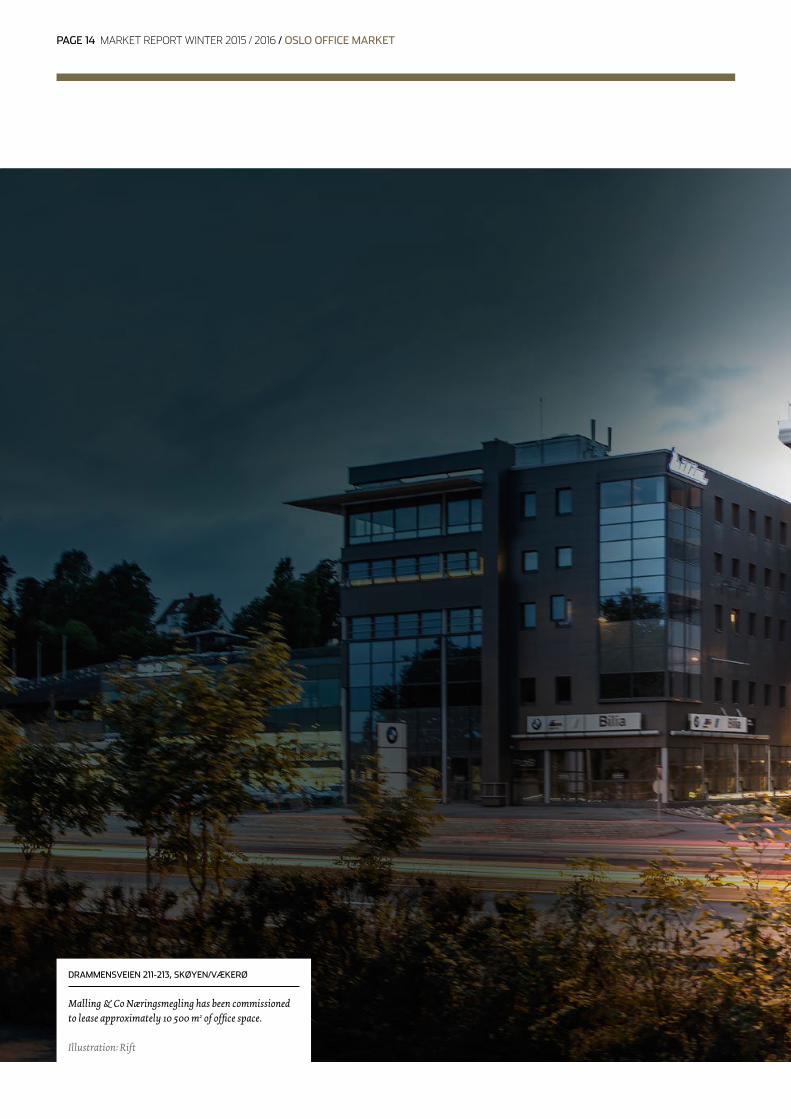
DRAMMENSVEIEN 211-213, SKØYEN/VÆKERØ
Malling & Co Næringsmegling has been commissioned to lease approximately 10 500 m2 of office space.
Illustration: Rift
PAGE 14 MARKET REPORT WINTER 2015 / 2016 / OSLO OFFICE MARKET

OSLO OFFICE MARKET / MARKET REPORT WINTER 2015 / 2016 PAGE 15
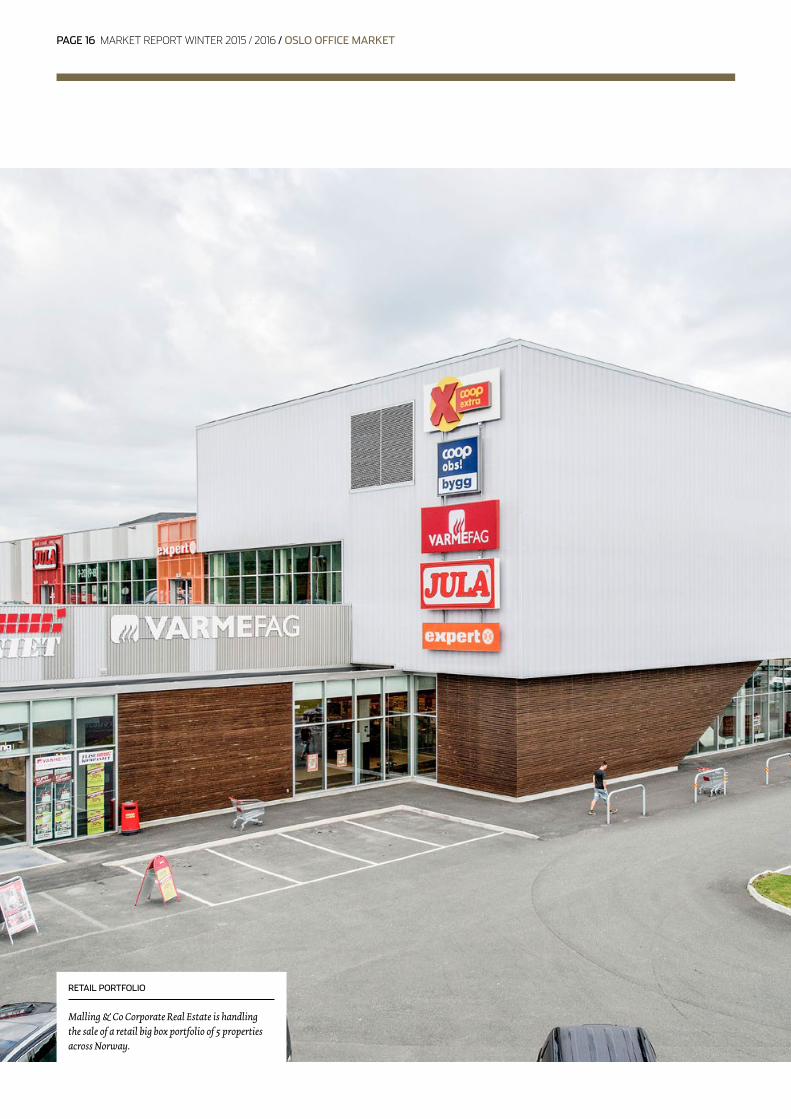
RETAIL PORTFOLIO
Malling & Co Corporate Real Estate is handling the sale of a retail big box portfolio of 5 properties across Norway.
PAGE 16 MARKET REPORT WINTER 2015 / 2016 / OSLO OFFICE MARKET
Number of m2 offered within 12 months Number of m2 offered beyond 12 months Supply central (incl . Skøyen) Supply fringe zone east Supply fringe zone west
Below 1 000 m2 1 000–5 000 m2 5 000–10 000 m2 Larger than 10 000 m2 Central Fringe zone east Fringe zone west
In October, the aggregated supply of office space in Greater Oslo was almost 1.2 million m2, an increase of 4 % since October 2014. The average size per ad was 1 400 m2, a slight decrease on last year. The number of ads for spaces larger than 5 000 m2 was 44, while 15 premises were larger than 10 000 m2. Half of all the premises larger than 2 000 m2 are currently vacant, approximately 360 000 m2, while 106 000 m2 and 73 500 m2 will become available during 2016 and 2017, respectively. Another 246 000 m2 are projected new constructions.
The total supply of office space allocated in our 14 defined office clusters in Greater Oslo was 860 000 m2 as at October 2015. The vacant office space, within a 12 month perspective, is 600 000 m2. Thus the aggregated supply rate for office clusters in Greater Oslo is 11.4 %, and the vacancy rate is 7.9 %. This is the highest vacancy level seen in 2015, but slightly lower than seen in October 2014.
SUPPLY IN THE RENTAL MARKETSUBLETTING IN THE WESTERN AXIS POSES AN INCREASING THREAT
We define supply as all office space that is available in the market, both in existing buildings and new constructions.
There are also some projects that are offered in specific processes to tenants looking for space, but that are not available on
the online marketplace, FINN.no. This means that the supply side still has a lot in stock if the market is ready to absorb it.
Our list of potential new building projects is long, and will affect the market for many years to come.
—It should be noted that we have made minor adjustments to historical vacancy figures due to a wider definition of office space in the total stock. Compared to previous figures, vacancy has been adjusted down by 0.8 percentage points.
Subletting constituted 11 % of the total office supply in the western fringe zone as at October 2015, and this has been an increasing trend in recent months. Our mapping of the tenants in the axis shows that 18 % of the tenants are in the Oil & Gas sector, and are directly affected by the lower oil price. Subletting poses a threat to rental prices since tenants in general are more inclined to accept lower rents. We expect subletting to continue to be an important part of the supply.
SUPPLY IN CENTRAL OSLO, EASTERN AND WESTERN FRINGE ZONE PER 15. OCT. 2015
Source: Malling &
Co/FINN
.no
16 %
14 %
12 %
10 %
8 %
6 %
4 %
2 %
0 %
Q1 2
011
Q2
2011
Q3
2011
Q4
2011
Q1 2
012
Q2
2012
Q3
2012
Q4
2012
Q1 2
013
Q2
2013
Q3
2013
Q4
2013
Q1 2
014
Q2
2014
Q3
2014
Q4
2014
Q1 2
015
Q2
2015
Q3
2015
Q4
2015
*
STATUS OF OFFICE SPACE OVER 2 000 M² OFFERED ON FINN.NO, PER OCT. 2015OFFICE SPACE FOR RENT (M²) DIVIDED INTO SIZE INTERVALS PER 15. OCT. 2015
Source: Malling &
Co
Source: Malling &
Co
1 000 000900 000800 000700 000600 000500 000400 000300 000200 000100 000
0
50 000
100 000
150 000
200 000
250 000
300 000
350 000
400 000
0
Now
Q1 2
011
Q1 2
016
Q2
2016
Q3
2016
Q4
2016
Q1 2
017
Q2
2017
Q3
2017
Q4
2017
Proj
ecte
d
Q2
2011
Q3
2011
Q4
2011
Q1 2
012
Q2
2012
Q3
2012
Q4
2012
Q1 2
013
Q2
2013
Q3
2013
Q4
2013
Q1 2
014
Q2
2014
Q3
2014
Q4
2014
Q2
2015
Q1 2
015
Q3
2015
Q4
2015
*
OFFICE SPACE FOR RENT (M²) DIVIDED INTO OFFICE CLUSTERS PER 15. OCT. 2015
Source: Malling &
Co/FINN
.no
180 000160 000140 000120 000100 00080 00060 00040 00020 000
0
Økern/
Løren/R
isløkk
a
Inner
city
Lysa
ker
CBD
Bryn/H
elsfyr
Forne
bu
Kvadra
turen
Skøye
n
Bjørvik
a
Nydale
n/San
dake
r
Sandv
ikaAske
r
Billings
tad
Majorst
uen
OSLO OFFICE MARKET / MARKET REPORT WINTER 2015 / 2016 PAGE 17
6
4
2
7
9
108
12
3
13
11
1
CENTRAL OSLO
OSLO WEST
OSLO EAST
OSLO OUTER EAST
OSLO OUTER SOUTH
BÆRUM
ASKER
5
14
14 %SUPPLY RATE PER OCT. 2015
16 %SUPPLY RATE PER OCT. 2015
9 %SUPPLY RATE PER OCT. 2015
19 %SUPPLY RATE PER OCT. 2015
10 %SUPPLY RATE PER OCT. 2015
9 %SUPPLY RATE PER OCT. 2015
*Advertised office space at FINN.no of the total office building mass in Greater Oslo. This includes potential advertised new projects.
**Advertised office space within 12 months at FINN.no of the total office building mass in Greater Oslo.
0–5 %
Indicates trend past 6 months.
Map colour indicates vacancy rates per October 2015
5–10 % 10–15 % Over 15 %
VACANCY** AND SUPPLY*
11 %SUPPLY* IN DEFINED OFFICE CLUSTERS– Up approx . 0 .5 percentage point past 12 months .
8 %VACANCY** IN DEFINED OFFICE CLUSTERS– Down approx . 0 .3 percentage point past 12 months .
LYSAKER
5
SKØYEN
6
MAJORSTUEN
7
11 %SUPPLY RATE PER OCT. 2015
FORNEBU
4
3 %VACANCY RATEPER OCT. 2015
5 %VACANCY RATEPER OCT. 2015
9 %VACANCY RATEPER OCT. 2015
13 %VACANCY RATEPER OCT. 2015
17 %VACANCY RATEPER OCT. 2015
10 %VACANCY RATEPER OCT. 2015
ASKER
1
BILLINGSTAD
2
SANDVIKA
3
9 %VACANCY RATEPER OCT. 2015
PAGE 18 MARKET REPORT WINTER 2015 / 2016 / OSLO OFFICE MARKET
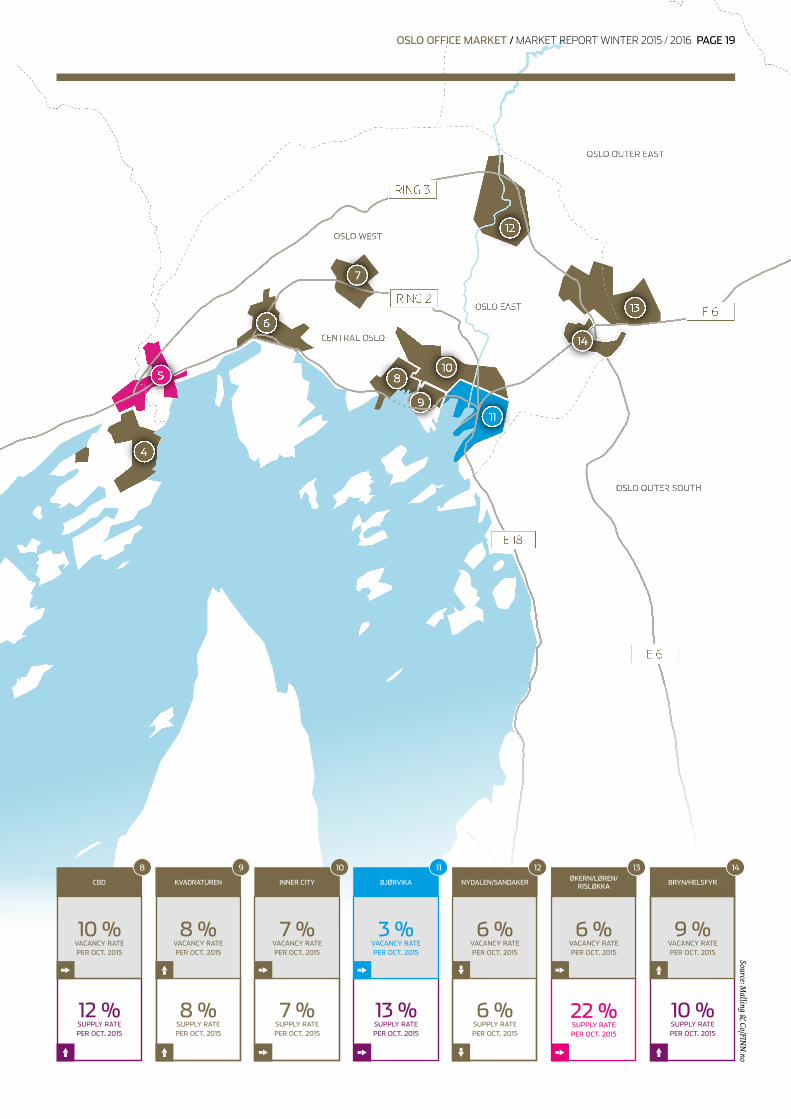
6
4
2
7
9
108
12
3
13
11
1
CENTRAL OSLO
OSLO WEST
OSLO EAST
OSLO OUTER EAST
OSLO OUTER SOUTH
BÆRUM
ASKER
5
14
12 %SUPPLY RATE PER OCT. 2015
8 %SUPPLY RATE PER OCT. 2015
7 %SUPPLY RATE PER OCT. 2015
6 %SUPPLY RATE PER OCT. 2015
10 %SUPPLY RATE PER OCT. 2015
KVADRATUREN
9
INNER CITY
10
NYDALEN/SANDAKER
12
BRYN/HELSFYR
14
13 %SUPPLY RATE PER OCT. 2015
10 %VACANCY RATEPER OCT. 2015
8 %VACANCY RATEPER OCT. 2015
7 %VACANCY RATEPER OCT. 2015
3 %VACANCY RATEPER OCT. 2015
6 %VACANCY RATEPER OCT. 2015
6 %VACANCY RATEPER OCT. 2015
9 %VACANCY RATEPER OCT. 2015
22 %SUPPLY RATE PER OCT. 2015
Source: Malling &
Co/FINN
.no
CBD
8
BJØRVIKA
11ØKERN/LØREN/
RISLØKKA
13
OSLO OFFICE MARKET / MARKET REPORT WINTER 2015 / 2016 PAGE 19
FURTHER DEVELOPMENT OF THE RENTAL MARKETTHE FRINGE IS UNDER PRESSURE, WHILE THE CITYCENTRE HOLDS FIRM
› The weakened economic environment, especially in the Oil & Gas sector, has resulted in the market in the western fringe zone facing lower demand and increased sub-letting. The eastern side is seeing somewhat better conditions, as this area is less dependent on the Oil & Gas, but new developments are pressuring the market from the supply side.
› As yields have been under pressure, new developments may be calculated with lower rents all else being equal, but the recent increase in credit margins may be a neutralising factor.
› Resistance in the rest of the economy is causing the demand to remain stable in the city centre, where supply is also lower, thus keeping rent levels flat. As the economy picks up again, we expect a further increase in rent levels as demand is too slow to react.
› Low construction over the next few years will keep the supply low, at least for immediately available space.
› The city will continue to grow in all future scenarios for population growth, and create a need for around 100 000 m2 new projects annually in the middle scenario.
› As very few projects are built on speculation, we believe this will act as a natural cushion that will prevent rent levels from dropping significantly if the demand does not pick up again.
› The long-term trend of clustering office space around public transportation hubs will create a gap between the achievable rents in office clusters and those in single office locations without the same accessibility.
The short term trends (1 year)› The employment market seems better in Oslo than expected, although some areas are affected more heavily by the reduced activity within the Oil & Gas sector. › We believe the majority of the effect from the workforce reductions in the Oil & Gas sector has already hit the market.› Few projects will be finalized the coming year.› We believe vacancy will drop slowly in office clusters on average towards the end of 2016.› A moderate market sentiment and sufficient space in stock will not put pressure on rents in the short term.
Long term trends (1-3 years)› We believe the uncertainty in the economy will postpone tenants’ decisions and shift demand towards existing buildings. New build projects will not be an option for many tenants.› Less construction activity in 2016 and 2017 and continuing conversion to residential/hotel will result in a net stable or decreasing stock.› If the economic growth picks up like several analyst believe, we se possibilities of pressure in the market as there is a significant lead time to increase stock.› Growth in the Norwegian economy and the oil investments are expected to pick up in 2016.› Rents in eastern fringe may rise on average. However this will mainly be an effect of increased quality of the offered office space, rather than pressure in the market.
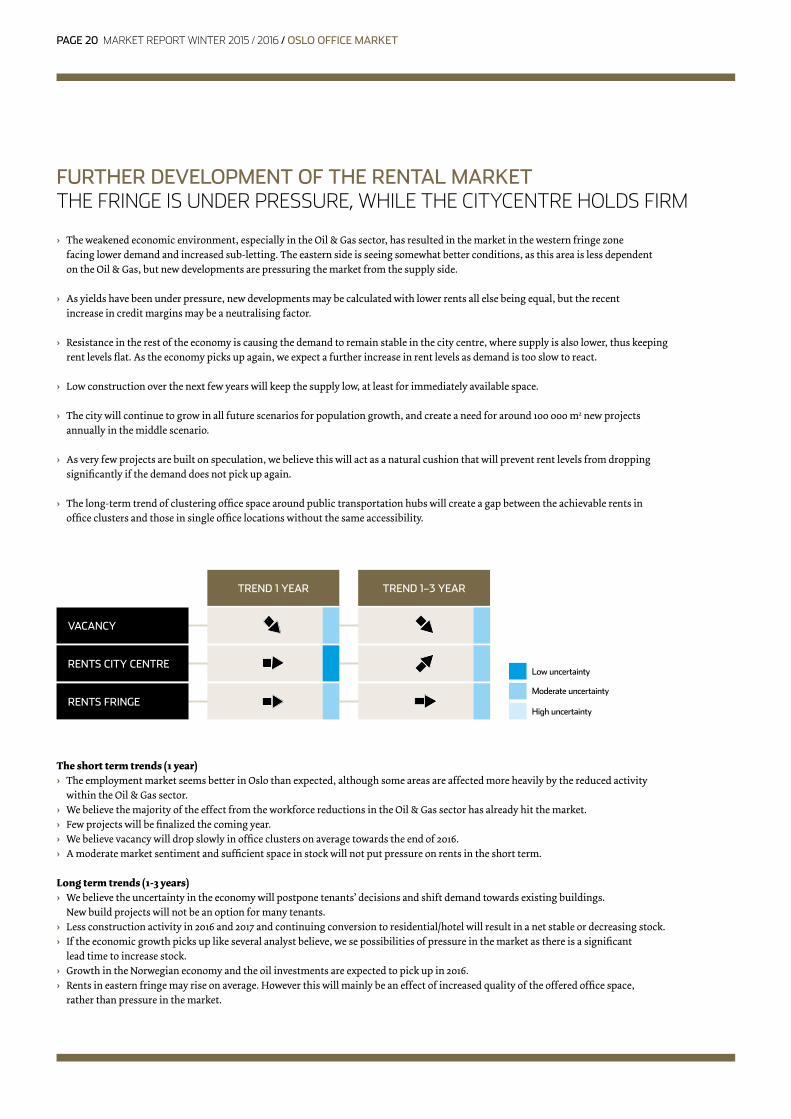
TREND 1 YEAR TREND 1–3 YEAR
VACANCY
RENTS CITY CENTRE
RENTS FRINGE
Low uncertainty
Moderate uncertainty
High uncertainty
PAGE 20 MARKET REPORT WINTER 2015 / 2016 / OSLO OFFICE MARKET
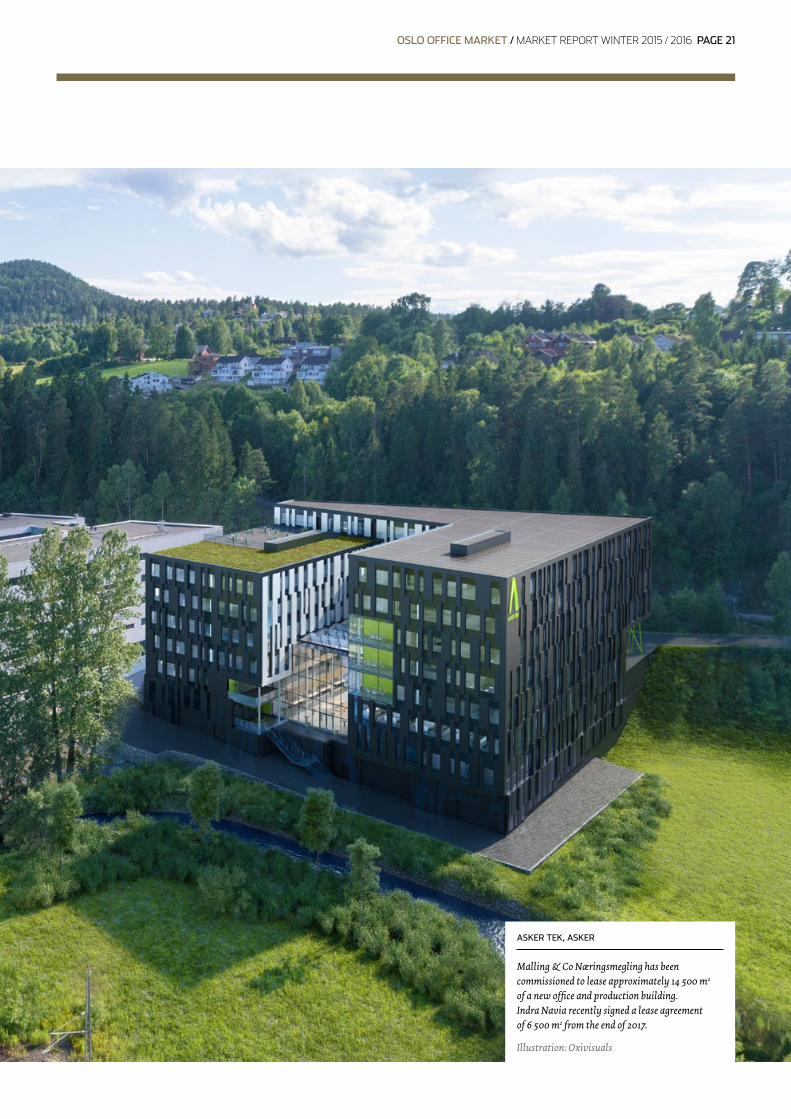
ASKER TEK, ASKER
Malling & Co Næringsmegling has been commissioned to lease approximately 14 500 m2 of a new office and production building. Indra Navia recently signed a lease agreement of 6 500 m2 from the end of 2017.
Illustration: Oxivisuals
OSLO OFFICE MARKET / MARKET REPORT WINTER 2015 / 2016 PAGE 21
In order to map the state of the rental market, we track the activity on Norway’s dominant online marketplace, FINN.no. Utilising these figures, we find
that the total supply (as a percentage of the total stock) in our defined office clusters has varied between 10.8 % and 11.4 % over the past 12 months.
The supply includes new builds and is not time-constrained. If we limit our analysis to the vacancy rate, defined as the office locations available within
12 months, the vacancy rate decreased up to the summer, and we are now slightly down from the level seen 12 months ago. As at October 2015, the
office clusters with the highest relative vacancy are Lysaker, Billingstad and Skøyen. The office supply – in absolute terms – is greatest in Økern/Løren/
Risløkka, Central Oslo and Lysaker. In relative terms, the office supply is greatest in Økern/Løren/Risløkka, Lysaker and Billingstad.
THE RENTAL MARKETGREATER OSLO
Per October 2015 Per October 2014
Normal rent (NOK/m²)* 1 600 – 1 800 1 600 – 1 800
Prime rent (NOK/m²)* 2 100 2 100
Supply** 14 % 3 %
Vacancy** 9 % 3 %
Per October 2015 Per October 2014
Normal rent (NOK/m²)* 1 250 – 1 500 1 250 – 1 500
Prime rent (NOK/m²)* 1 700 1 700
Supply** 16 % 26 %
Vacancy** 13 % 26 %
ASKER
Comment:
The prime rent and normal rent have remained stable over the past 12 months . The
supply recently decreased after Indra Navia signed a lease agreement in Ferd Eiendom’s
new build project in Hagaløkkveien 26 (6 600 m²) . The building (14 500 m² office) will be
completed in Q4 2017 . Oxer Eiendom is planning to start the construction of a new office
building of 18 000 m² next to Asker Panorama in the spring of 2016 .
Comment:
The cluster is characterised by big box retail and smaller logistics properties . There are
several large big box retailers in the area, such as IKEA, Elkjøp Mega Store and Megaflis .
Conversion from combination properties to retail and residential projects are planned
in several areas, with construction starting in 2017-2018 at the earliest . In Lilleåsen 2,
Billingstad Utvikling is planning a new office building of 3 100 m² .
BILLINGSTAD
*See definition of «normal» rent and prime rent on page 26.**See definition of supply and vacancy on page 18.
A SELECTION OF THE LATEST MAJOR LEASE CONTRACTS
Tenant Moving toAddress /office cluster
Moving from Address / office cluster
Space
Wikborg Rein Dronning Mauds gate 11 / CBD Kronprinsesse Märthas plass 1 / CBD 8 500 m²
Helsedirektoratet (e-helse) Verkstedveien 1 / Skøyen Universitetsgata 2 / Inner city 7 500 m²
Securitas Hasle Linje / Økern-Løren-Risløkka Urtegata 9 / Inner city 7 000 m²
Indra Navia Hagaløkkveien 28 / Asker Olaf Helsets vei 6 6 600 m²
Steenstrup Stordrange Cort Adelers gate 33 / CBD Haakon VII’s gate 5 / CBD 6 300 m²
Kvale Advokatfirma Haakon VIIs gate 10 / CBD Fridtjof Nansen plass 4 / CBD 4 500 m²
Manpower Sundtkvartalet / Inner city Tordenskiolds gate 2 / CBD 4 200 m²
Making Waves Wergelandsveien 15 / Inner city Kristian IVs gate 13 / Inner city 3 400 m²
PAGE 22 MARKET REPORT WINTER 2015 / 2016 / OSLO OFFICE MARKET
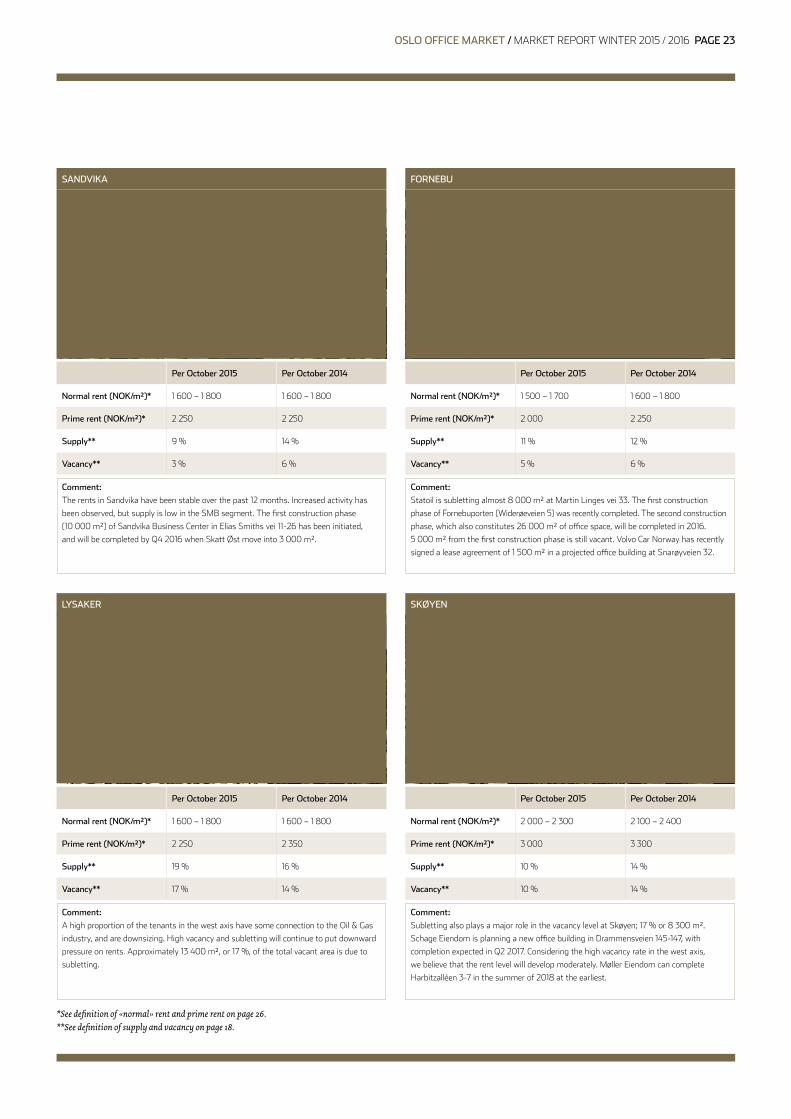
Per October 2015 Per October 2014
Normal rent (NOK/m²)* 1 600 – 1 800 1 600 – 1 800
Prime rent (NOK/m²)* 2 250 2 250
Supply** 9 % 14 %
Vacancy** 3 % 6 %
Per October 2015 Per October 2014
Normal rent (NOK/m²)* 1 600 – 1 800 1 600 – 1 800
Prime rent (NOK/m²)* 2 250 2 350
Supply** 19 % 16 %
Vacancy** 17 % 14 %
Per October 2015 Per October 2014
Normal rent (NOK/m²)* 1 500 – 1 700 1 600 – 1 800
Prime rent (NOK/m²)* 2 000 2 250
Supply** 11 % 12 %
Vacancy** 5 % 6 %
Per October 2015 Per October 2014
Normal rent (NOK/m²)* 2 000 – 2 300 2 100 – 2 400
Prime rent (NOK/m²)* 3 000 3 300
Supply** 10 % 14 %
Vacancy** 10 % 14 %
SANDVIKA
LYSAKER
Comment:
The rents in Sandvika have been stable over the past 12 months . Increased activity has
been observed, but supply is low in the SMB segment . The first construction phase
(10 000 m²) of Sandvika Business Center in Elias Smiths vei 11-26 has been initiated,
and will be completed by Q4 2016 when Skatt Øst move into 3 000 m² .
Comment:
A high proportion of the tenants in the west axis have some connection to the Oil & Gas
industry, and are downsizing . High vacancy and subletting will continue to put downward
pressure on rents . Approximately 13 400 m², or 17 %, of the total vacant area is due to
subletting .
Comment:
Statoil is subletting almost 8 000 m² at Martin Linges vei 33 . The first construction
phase of Fornebuporten (Widerøeveien 5) was recently completed . The second construction
phase, which also constitutes 26 000 m² of office space, will be completed in 2016 .
5 000 m² from the first construction phase is still vacant . Volvo Car Norway has recently
signed a lease agreement of 1 500 m² in a projected office building at Snarøyveien 32 .
Comment:
Subletting also plays a major role in the vacancy level at Skøyen; 17 % or 8 300 m² .
Schage Eiendom is planning a new office building in Drammensveien 145-147, with
completion expected in Q2 2017 . Considering the high vacancy rate in the west axis,
we believe that the rent level will develop moderately . Møller Eiendom can complete
Harbitzalléen 3-7 in the summer of 2018 at the earliest .
FORNEBU
SKØYEN
*See definition of «normal» rent and prime rent on page 26.**See definition of supply and vacancy on page 18.
OSLO OFFICE MARKET / MARKET REPORT WINTER 2015 / 2016 PAGE 23
MAJORSTUEN
KVADRATUREN
CBD
INNER CITY
Per October 2015 Per October 2014
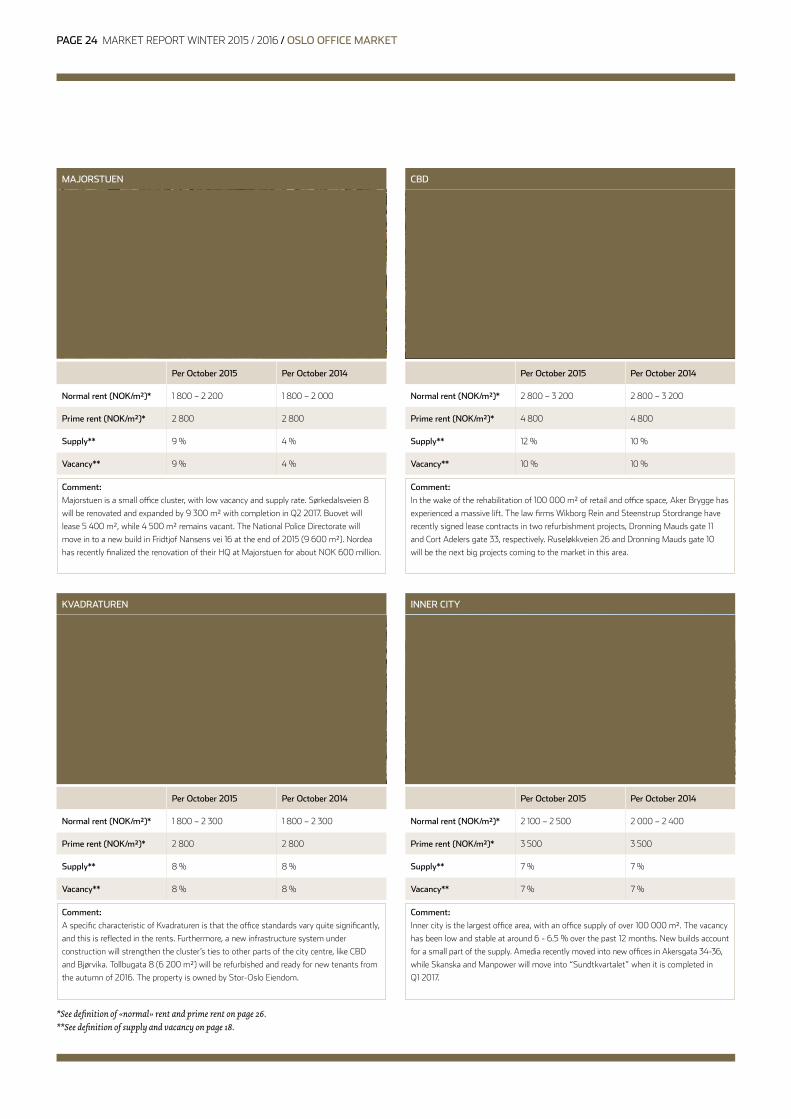
Normal rent (NOK/m²)* 1 800 – 2 200 1 800 – 2 000
Prime rent (NOK/m²)* 2 800 2 800
Supply** 9 % 4 %
Vacancy** 9 % 4 %
Per October 2015 Per October 2014
Normal rent (NOK/m²)* 1 800 – 2 300 1 800 – 2 300
Prime rent (NOK/m²)* 2 800 2 800
Supply** 8 % 8 %
Vacancy** 8 % 8 %
Per October 2015 Per October 2014
Normal rent (NOK/m²)* 2 800 – 3 200 2 800 – 3 200
Prime rent (NOK/m²)* 4 800 4 800
Supply** 12 % 10 %
Vacancy** 10 % 10 %
Per October 2015 Per October 2014
Normal rent (NOK/m²)* 2 100 – 2 500 2 000 – 2 400
Prime rent (NOK/m²)* 3 500 3 500
Supply** 7 % 7 %
Vacancy** 7 % 7 %
Comment:
Majorstuen is a small office cluster, with low vacancy and supply rate . Sørkedalsveien 8
will be renovated and expanded by 9 300 m² with completion in Q2 2017 . Buovet will
lease 5 400 m², while 4 500 m² remains vacant . The National Police Directorate will
move in to a new build in Fridtjof Nansens vei 16 at the end of 2015 (9 600 m²) . Nordea
has recently finalized the renovation of their HQ at Majorstuen for about NOK 600 million .
Comment:
A specific characteristic of Kvadraturen is that the office standards vary quite significantly,
and this is reflected in the rents . Furthermore, a new infrastructure system under
construction will strengthen the cluster’s ties to other parts of the city centre, like CBD
and Bjørvika . Tollbugata 8 (6 200 m²) will be refurbished and ready for new tenants from
the autumn of 2016 . The property is owned by Stor-Oslo Eiendom .
Comment:
In the wake of the rehabilitation of 100 000 m² of retail and office space, Aker Brygge has
experienced a massive lift . The law firms Wikborg Rein and Steenstrup Stordrange have
recently signed lease contracts in two refurbishment projects, Dronning Mauds gate 11
and Cort Adelers gate 33, respectively . Ruseløkkveien 26 and Dronning Mauds gate 10
will be the next big projects coming to the market in this area .
Comment:
Inner city is the largest office area, with an office supply of over 100 000 m² . The vacancy
has been low and stable at around 6 - 6 .5 % over the past 12 months . New builds account
for a small part of the supply . Amedia recently moved into new offices in Akersgata 34-36,
while Skanska and Manpower will move into “Sundtkvartalet” when it is completed in
Q1 2017 .
*See definition of «normal» rent and prime rent on page 26.**See definition of supply and vacancy on page 18.
PAGE 24 MARKET REPORT WINTER 2015 / 2016 / OSLO OFFICE MARKET
BJØRVIKA
ØKERN/LØREN/RISLØKKA
NYDALEN/SANDAKER
BRYN/HELSFYR
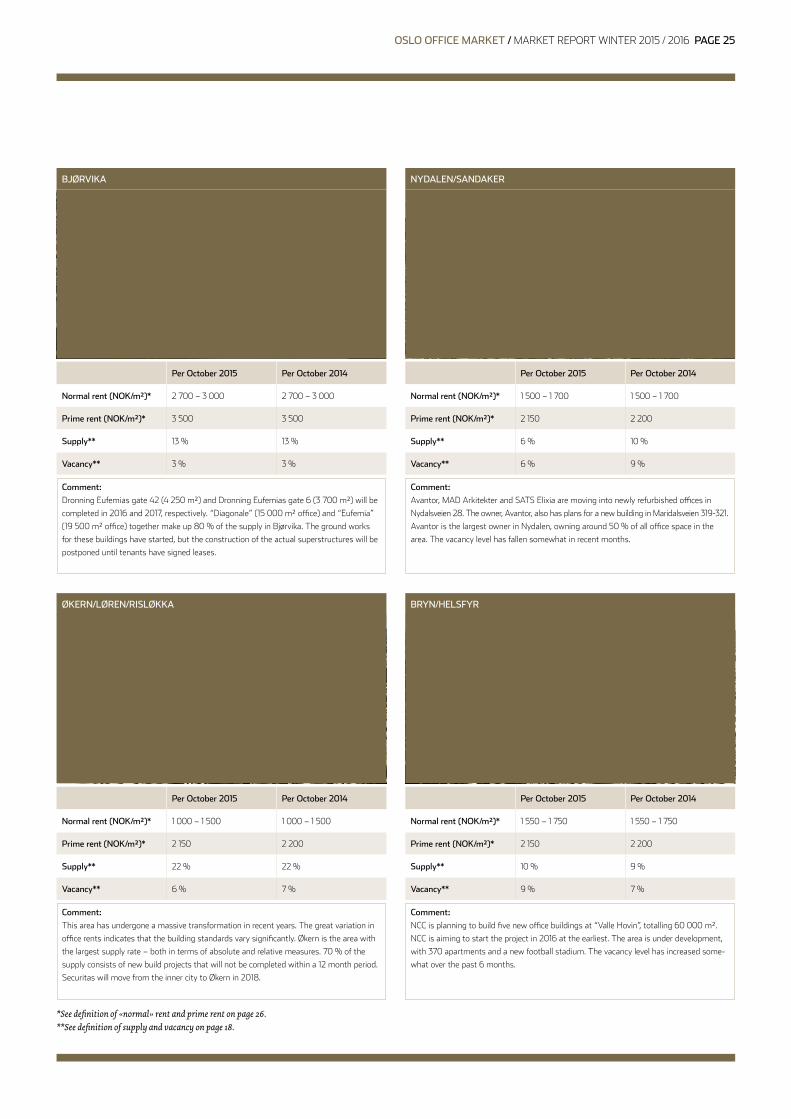
Per October 2015 Per October 2014
Normal rent (NOK/m²)* 2 700 – 3 000 2 700 – 3 000
Prime rent (NOK/m²)* 3 500 3 500
Supply** 13 % 13 %
Vacancy** 3 % 3 %
Per October 2015 Per October 2014
Normal rent (NOK/m²)* 1 000 – 1 500 1 000 – 1 500
Prime rent (NOK/m²)* 2 150 2 200
Supply** 22 % 22 %
Vacancy** 6 % 7 %
Per October 2015 Per October 2014
Normal rent (NOK/m²)* 1 500 – 1 700 1 500 – 1 700
Prime rent (NOK/m²)* 2 150 2 200
Supply** 6 % 10 %
Vacancy** 6 % 9 %
Per October 2015 Per October 2014
Normal rent (NOK/m²)* 1 550 – 1 750 1 550 – 1 750
Prime rent (NOK/m²)* 2 150 2 200
Supply** 10 % 9 %
Vacancy** 9 % 7 %
Comment:
Dronning Eufemias gate 42 (4 250 m²) and Dronning Eufemias gate 6 (3 700 m²) will be
completed in 2016 and 2017, respectively . “Diagonale” (15 000 m² office) and “Eufemia”
(19 500 m² office) together make up 80 % of the supply in Bjørvika . The ground works
for these buildings have started, but the construction of the actual superstructures will be
postponed until tenants have signed leases .
Comment:
This area has undergone a massive transformation in recent years . The great variation in
office rents indicates that the building standards vary significantly . Økern is the area with
the largest supply rate – both in terms of absolute and relative measures . 70 % of the
supply consists of new build projects that will not be completed within a 12 month period .
Securitas will move from the inner city to Økern in 2018 .
Comment:
Avantor, MAD Arkitekter and SATS Elixia are moving into newly refurbished offices in
Nydalsveien 28 . The owner, Avantor, also has plans for a new building in Maridalsveien 319-321 .
Avantor is the largest owner in Nydalen, owning around 50 % of all office space in the
area . The vacancy level has fallen somewhat in recent months .
Comment:
NCC is planning to build five new office buildings at “Valle Hovin”, totalling 60 000 m² .
NCC is aiming to start the project in 2016 at the earliest . The area is under development,
with 370 apartments and a new football stadium . The vacancy level has increased some-
what over the past 6 months .
*See definition of «normal» rent and prime rent on page 26.**See definition of supply and vacancy on page 18.
OSLO OFFICE MARKET / MARKET REPORT WINTER 2015 / 2016 PAGE 25
INNER CITY
OSLO WEST
OSLO EAST
OSLO OUTER EAST
OSLO OUTER SOUTH
OSLO OUTER WEST
BÆRUM
ASKER
10
6
4
2
14
7
9
8
12
3
13
11
1
5
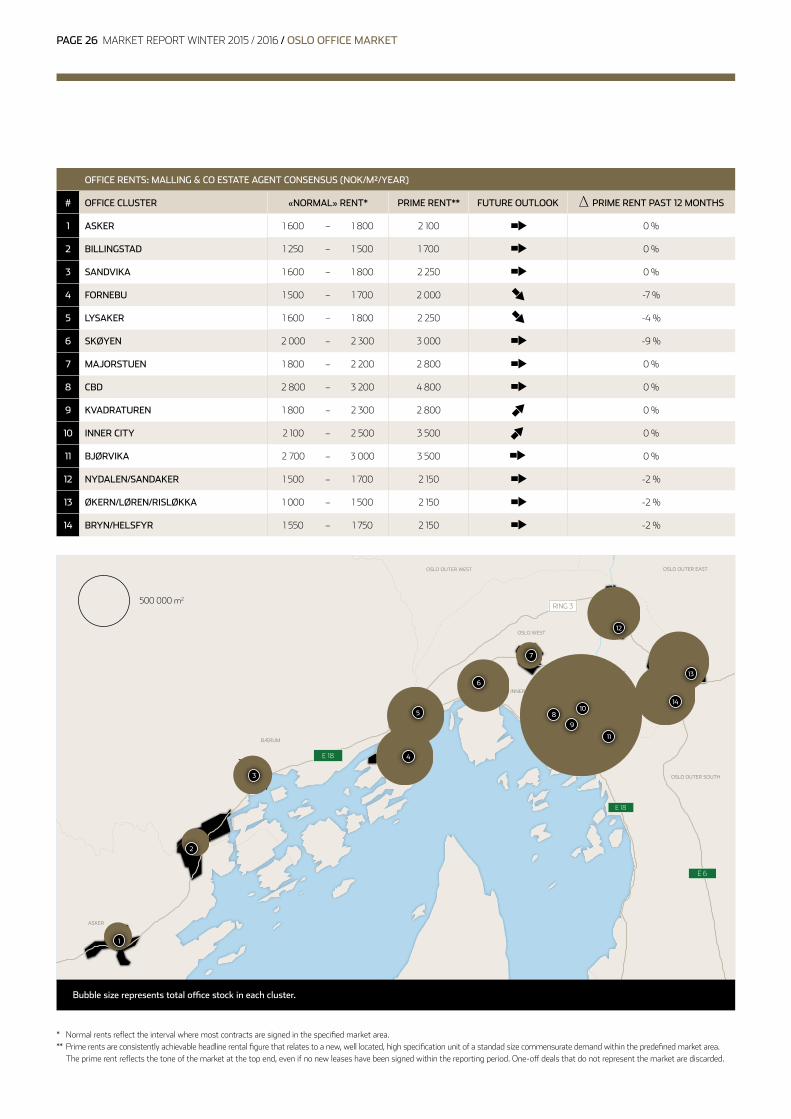
OFFICE RENTS: MALLING & CO ESTATE AGENT CONSENSUS (NOK/M²/YEAR)
# OFFICE CLUSTER «NORMAL» RENT* PRIME RENT** FUTURE OUTLOOK PRIME RENT PAST 12 MONTHS
1 ASKER 1 600 – 1 800 2 100 0 %
2 BILLINGSTAD 1 250 – 1 500 1 700 0 %
3 SANDVIKA 1 600 – 1 800 2 250 0 %
4 FORNEBU 1 500 – 1 700 2 000 -7 %
5 LYSAKER 1 600 – 1 800 2 250 -4 %
6 SKØYEN 2 000 – 2 300 3 000 -9 %
7 MAJORSTUEN 1 800 – 2 200 2 800 0 %
8 CBD 2 800 – 3 200 4 800 0 %
9 KVADRATUREN 1 800 – 2 300 2 800 0 %
10 INNER CITY 2 100 – 2 500 3 500 0 %
11 BJØRVIKA 2 700 – 3 000 3 500 0 %
12 NYDALEN/SANDAKER 1 500 – 1 700 2 150 -2 %
13 ØKERN/LØREN/RISLØKKA 1 000 – 1 500 2 150 -2 %
14 BRYN/HELSFYR 1 550 – 1 750 2 150 -2 %
* Normal rents reflect the interval where most contracts are signed in the specified market area . ** Prime rents are consistently achievable headline rental figure that relates to a new, well located, high specification unit of a standad size commensurate demand within the predefined market area . The prime rent reflects the tone of the market at the top end, even if no new leases have been signed within the reporting period . One-off deals that do not represent the market are discarded .
Bubble size represents total office stock in each cluster.
500 000 m2
PAGE 26 MARKET REPORT WINTER 2015 / 2016 / OSLO OFFICE MARKET
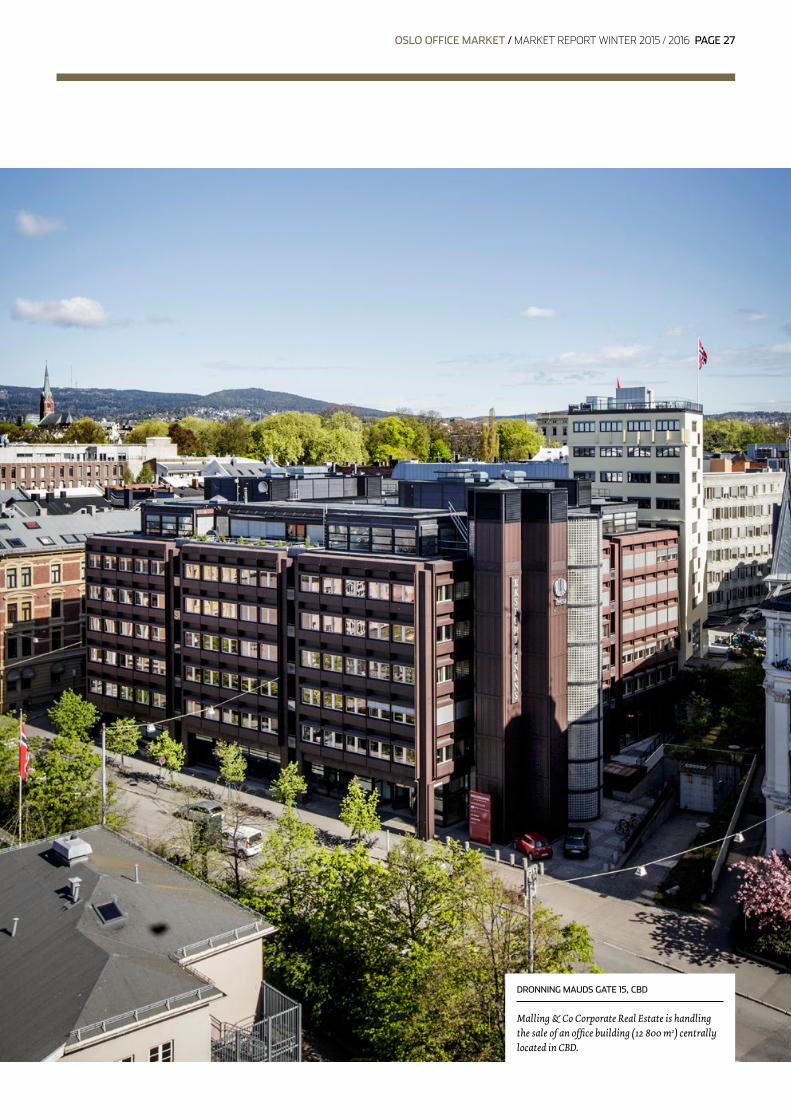
DRONNING MAUDS GATE 15, CBD
Malling & Co Corporate Real Estate is handling the sale of an office building (12 800 m2) centrally located in CBD.
OSLO OFFICE MARKET / MARKET REPORT WINTER 2015 / 2016 PAGE 27
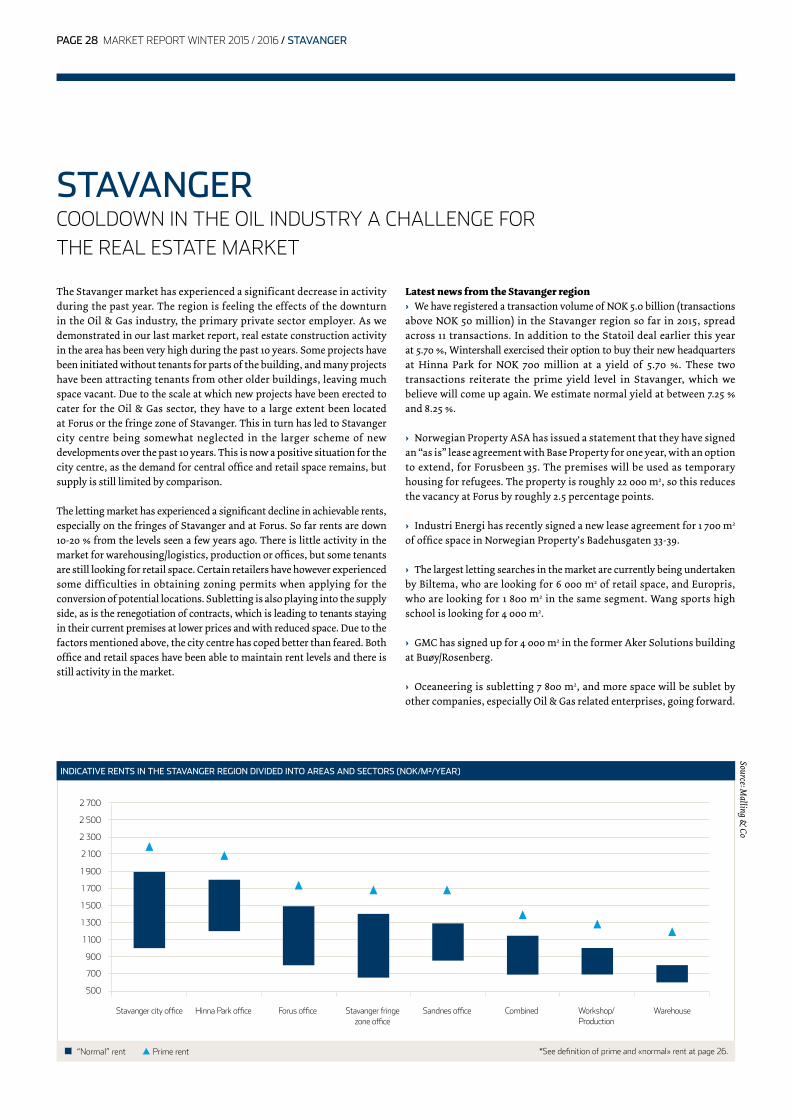
INDICATIVE RENTS IN THE STAVANGER REGION DIVIDED INTO AREAS AND SECTORS (NOK/M²/YEAR)
Stavanger city office Hinna Park office Forus office Stavanger fringe zone office
Sandnes office Combined Workshop/Production
Warehouse
500
700
900
1 100
1 300
1 500
1 700
1 900
2 100
2 300
2 500
2 700
“Normal” rent Prime rent *See definition of prime and «normal» rent at page 26 .
Source: Malling &
Co
STAVANGERCOOLDOWN IN THE OIL INDUSTRY A CHALLENGE FOR THE REAL ESTATE MARKET
The Stavanger market has experienced a significant decrease in activity during the past year. The region is feeling the effects of the downturn in the Oil & Gas industry, the primary private sector employer. As we demonstrated in our last market report, real estate construction activity in the area has been very high during the past 10 years. Some projects have been initiated without tenants for parts of the building, and many projects have been attracting tenants from other older buildings, leaving much space vacant. Due to the scale at which new projects have been erected to cater for the Oil & Gas sector, they have to a large extent been located at Forus or the fringe zone of Stavanger. This in turn has led to Stavanger city centre being somewhat neglected in the larger scheme of new developments over the past 10 years. This is now a positive situation for the city centre, as the demand for central office and retail space remains, but supply is still limited by comparison.
The letting market has experienced a significant decline in achievable rents, especially on the fringes of Stavanger and at Forus. So far rents are down 10-20 % from the levels seen a few years ago. There is little activity in the market for warehousing/logistics, production or offices, but some tenants are still looking for retail space. Certain retailers have however experienced some difficulties in obtaining zoning permits when applying for the conversion of potential locations. Subletting is also playing into the supply side, as is the renegotiation of contracts, which is leading to tenants staying in their current premises at lower prices and with reduced space. Due to the factors mentioned above, the city centre has coped better than feared. Both office and retail spaces have been able to maintain rent levels and there is still activity in the market.
Latest news from the Stavanger region› We have registered a transaction volume of NOK 5.0 billion (transactions above NOK 50 million) in the Stavanger region so far in 2015, spread across 11 transactions. In addition to the Statoil deal earlier this year at 5.70 %, Wintershall exercised their option to buy their new headquarters at Hinna Park for NOK 700 million at a yield of 5.70 %. These two transactions reiterate the prime yield level in Stavanger, which we believe will come up again. We estimate normal yield at between 7.25 % and 8.25 %.
› Norwegian Property ASA has issued a statement that they have signed an “as is” lease agreement with Base Property for one year, with an option to extend, for Forusbeen 35. The premises will be used as temporary housing for refugees. The property is roughly 22 000 m2, so this reduces the vacancy at Forus by roughly 2.5 percentage points.
› Industri Energi has recently signed a new lease agreement for 1 700 m2 of office space in Norwegian Property's Badehusgaten 33-39.
› The largest letting searches in the market are currently being undertaken by Biltema, who are looking for 6 000 m2 of retail space, and Europris, who are looking for 1 800 m2 in the same segment. Wang sports high school is looking for 4 000 m2.
› GMC has signed up for 4 000 m2 in the former Aker Solutions building at Buøy/Rosenberg.
› Oceaneering is subletting 7 800 m2, and more space will be sublet by other companies, especially Oil & Gas related enterprises, going forward.
PAGE 28 MARKET REPORT WINTER 2015 / 2016 / STAVANGER
E39
509
E39
44
13
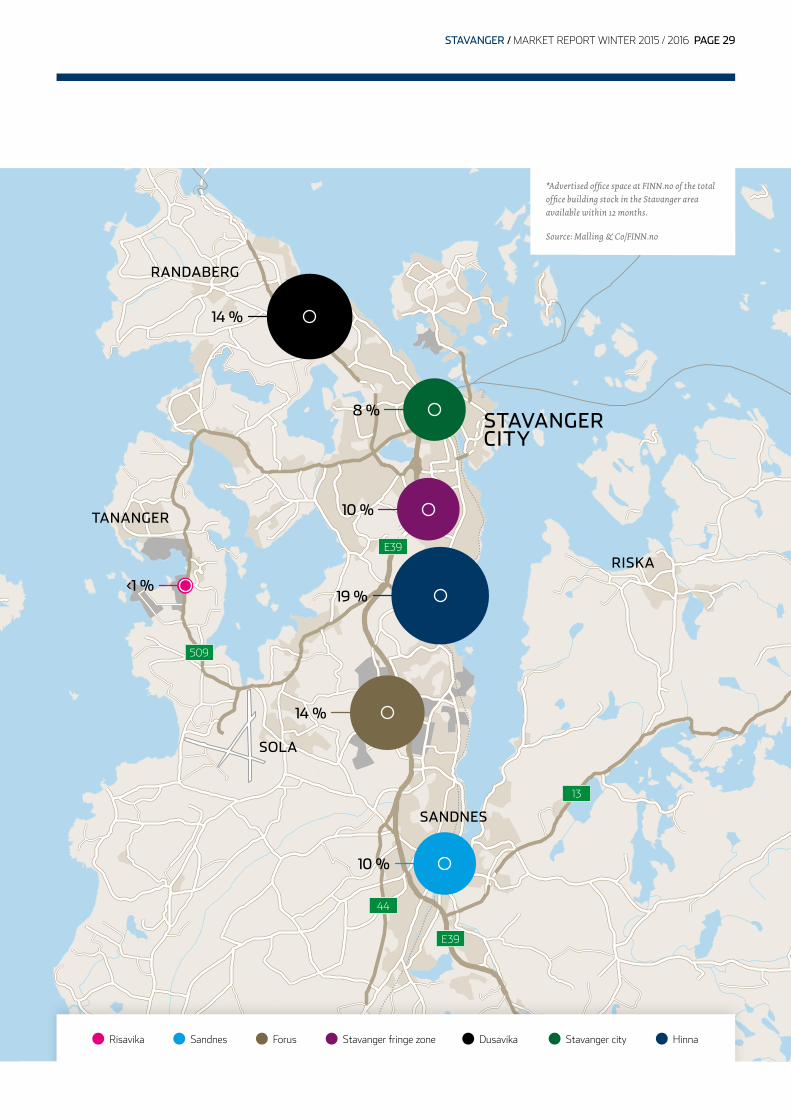
*Advertised office space at FINN.no of the total office building stock in the Stavanger areaavailable within 12 months. Source: Malling & Co/FINN.no
Risavika Sandnes Forus Stavanger fringe zone Stavanger city Dusavika Hinna
STAVANGERCITY
RANDABERG
SOLA
SANDNES
TANANGER
RISKA
10 %
19 %
14 %
10 %
8 %
14 %
<1 %
STAVANGER / MARKET REPORT WINTER 2015 / 2016 PAGE 29
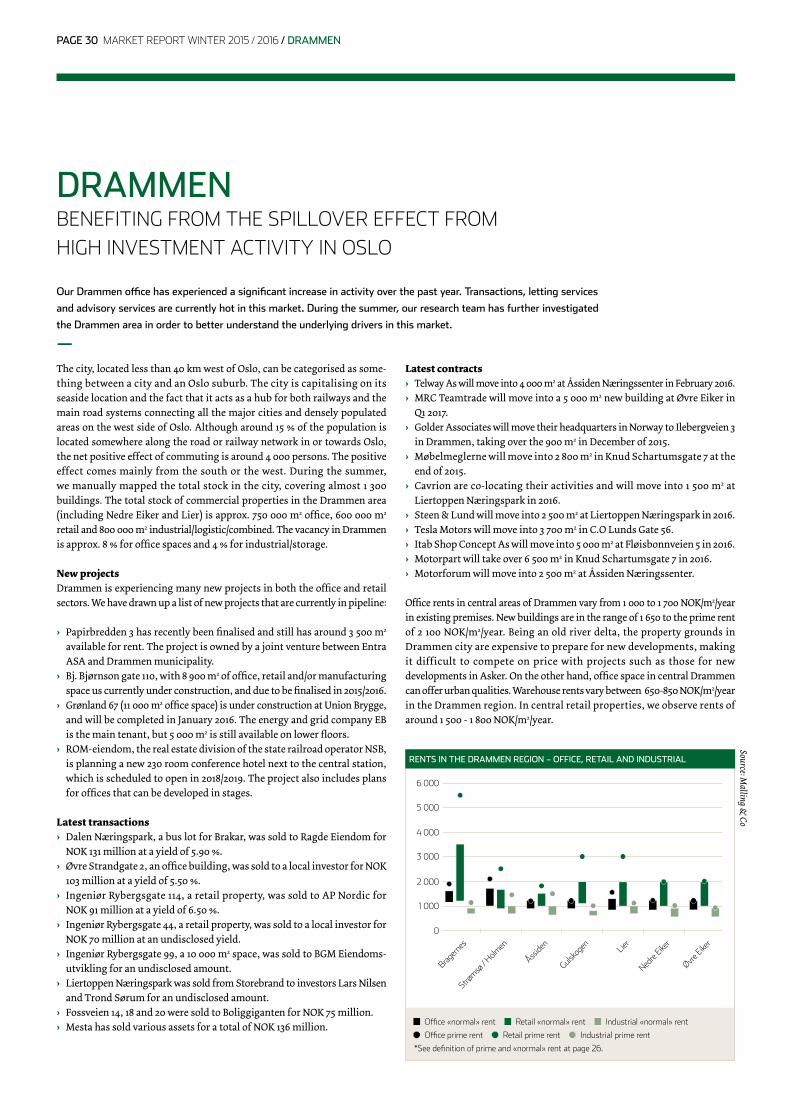
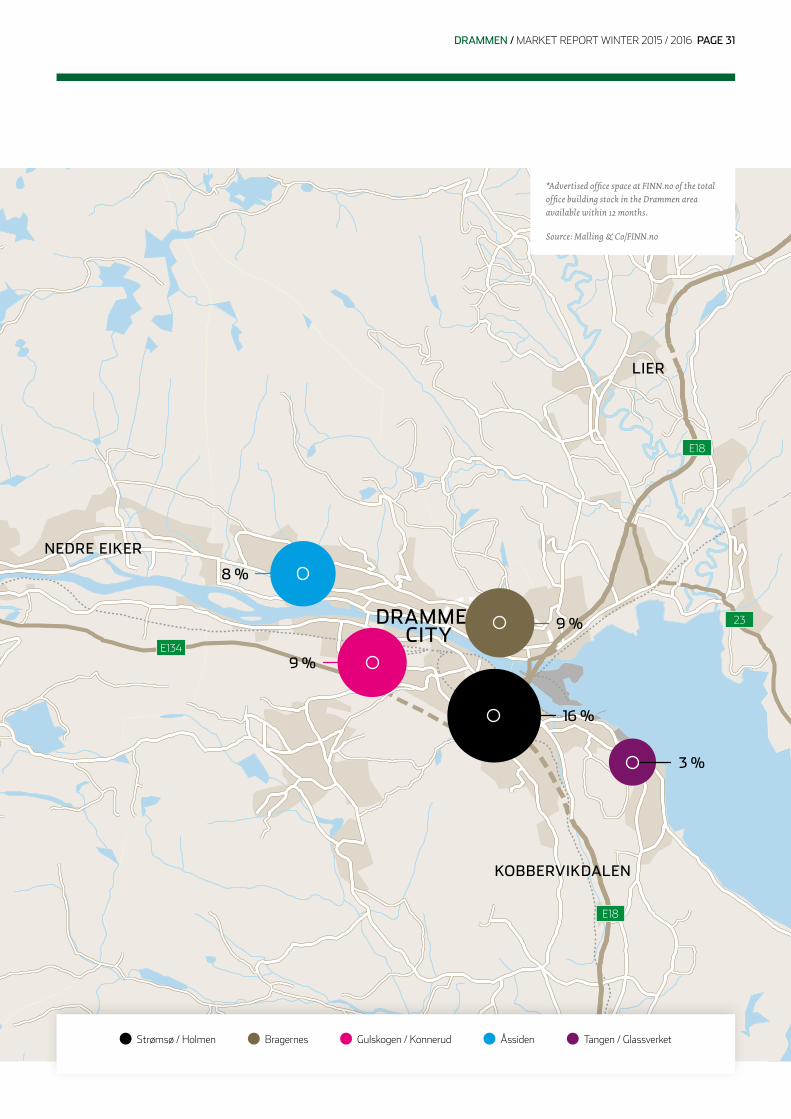
The city, located less than 40 km west of Oslo, can be categorised as some- thing between a city and an Oslo suburb. The city is capitalising on its seaside location and the fact that it acts as a hub for both railways and the main road systems connecting all the major cities and densely populated areas on the west side of Oslo. Although around 15 % of the population is located somewhere along the road or railway network in or towards Oslo, the net positive effect of commuting is around 4 000 persons. The positive effect comes mainly from the south or the west. During the summer, we manually mapped the total stock in the city, covering almost 1 300 buildings. The total stock of commercial properties in the Drammen area (including Nedre Eiker and Lier) is approx. 750 000 m2 office, 600 000 m2
retail and 800 000 m2 industrial/logistic/combined. The vacancy in Drammen is approx. 8 % for office spaces and 4 % for industrial/storage.
New projectsDrammen is experiencing many new projects in both the office and retail sectors. We have drawn up a list of new projects that are currently in pipeline:
› Papirbredden 3 has recently been finalised and still has around 3 500 m2 available for rent. The project is owned by a joint venture between Entra ASA and Drammen municipality.› Bj. Bjørnson gate 110, with 8 900 m2 of office, retail and/or manufacturing space us currently under construction, and due to be finalised in 2015/2016. › Grønland 67 (11 000 m2 office space) is under construction at Union Brygge, and will be completed in January 2016. The energy and grid company EB is the main tenant, but 5 000 m2 is still available on lower floors.› ROM-eiendom, the real estate division of the state railroad operator NSB, is planning a new 230 room conference hotel next to the central station, which is scheduled to open in 2018/2019. The project also includes plans for offices that can be developed in stages.
Latest transactions› Dalen Næringspark, a bus lot for Brakar, was sold to Ragde Eiendom for NOK 131 million at a yield of 5.90 %.› Øvre Strandgate 2, an office building, was sold to a local investor for NOK 103 million at a yield of 5.50 %.› Ingeniør Rybergsgate 114, a retail property, was sold to AP Nordic for NOK 91 million at a yield of 6.50 %.› Ingeniør Rybergsgate 44, a retail property, was sold to a local investor for NOK 70 million at an undisclosed yield.› Ingeniør Rybergsgate 99, a 10 000 m2 space, was sold to BGM Eiendoms- utvikling for an undisclosed amount.› Liertoppen Næringspark was sold from Storebrand to investors Lars Nilsen and Trond Sørum for an undisclosed amount.› Fossveien 14, 18 and 20 were sold to Boliggiganten for NOK 75 million.› Mesta has sold various assets for a total of NOK 136 million.
Latest contracts› Telway As will move into 4 000 m2 at Åssiden Næringssenter in February 2016. › MRC Teamtrade will move into a 5 000 m2 new building at Øvre Eiker in Q1 2017.› Golder Associates will move their headquarters in Norway to Ilebergveien 3 in Drammen, taking over the 900 m2 in December of 2015.› Møbelmeglerne will move into 2 800 m2 in Knud Schartumsgate 7 at the end of 2015.› Cavrion are co-locating their activities and will move into 1 500 m2 at Liertoppen Næringspark in 2016.› Steen & Lund will move into 2 500 m2 at Liertoppen Næringspark in 2016. › Tesla Motors will move into 3 700 m2 in C.O Lunds Gate 56.› Itab Shop Concept As will move into 5 000 m2 at Fløisbonnveien 5 in 2016. › Motorpart will take over 6 500 m2 in Knud Schartumsgate 7 in 2016.› Motorforum will move into 2 500 m2 at Åssiden Næringssenter.
Office rents in central areas of Drammen vary from 1 000 to 1 700 NOK/m2/year in existing premises. New buildings are in the range of 1 650 to the prime rent of 2 100 NOK/m2/year. Being an old river delta, the property grounds in Drammen city are expensive to prepare for new developments, making it difficult to compete on price with projects such as those for new developments in Asker. On the other hand, office space in central Drammen can offer urban qualities. Warehouse rents vary between 650-850 NOK/m2/year in the Drammen region. In central retail properties, we observe rents of around 1 500 - 1 800 NOK/m2/year.
DRAMMENBENEFITING FROM THE SPILLOVER EFFECT FROM HIGH INVESTMENT ACTIVITY IN OSLO
Our Drammen office has experienced a significant increase in activity over the past year. Transactions, letting services
and advisory services are currently hot in this market. During the summer, our research team has further investigated
the Drammen area in order to better understand the underlying drivers in this market.
—
Office «normal» rent Retail «normal» rent Industrial «normal» rent
Office prime rent Retail prime rent Industrial prime rent
*See definition of prime and «normal» rent at page 26 .
RENTS IN THE DRAMMEN REGION – OFFICE, RETAIL AND INDUSTRIAL
Source: Malling &
Co
6 000
5 000
4 000
3 000
2 000
1 000
0
Bragern
es
Strømsø
/ Holm
en
Åssiden
Gulsko
gen Lier
Nedre
Eiker
Øvre Eike
r
PAGE 30 MARKET REPORT WINTER 2015 / 2016 / DRAMMEN
E18
E18
23
E134
Strømsø / Holmen Bragernes Gulskogen / Konnerud Åssiden Tangen / Glassverket
DRAMMENBENEFITING FROM THE SPILLOVER EFFECT FROM HIGH INVESTMENT ACTIVITY IN OSLO
LIER
NEDRE EIKER
KOBBERVIKDALEN
DRAMMENCITY
3 %
9 %
16 %
8 %
9 %
*Advertised office space at FINN.no of the total office building stock in the Drammen area available within 12 months. Source: Malling & Co/FINN.no
DRAMMEN / MARKET REPORT WINTER 2015 / 2016 PAGE 31
High street shoppingIn spite of the weaker economic outlook, we continue to see great interest from international fashion brands who wish to open their stores in Oslo. The brands are however extremely thorough in their market analysis before they decide on whether or not to open one or several stores. New establishments are often considered up against further growth potential in established markets, where the brand already understands consumer trends and has an established logistics network. When a decision to open a store has been made, it is then about finding the optimal location for the concept. Most international fashion brands wish to be situated in “high street retail” areas in order to test the market before they open additional stores in, for example, shopping centres.
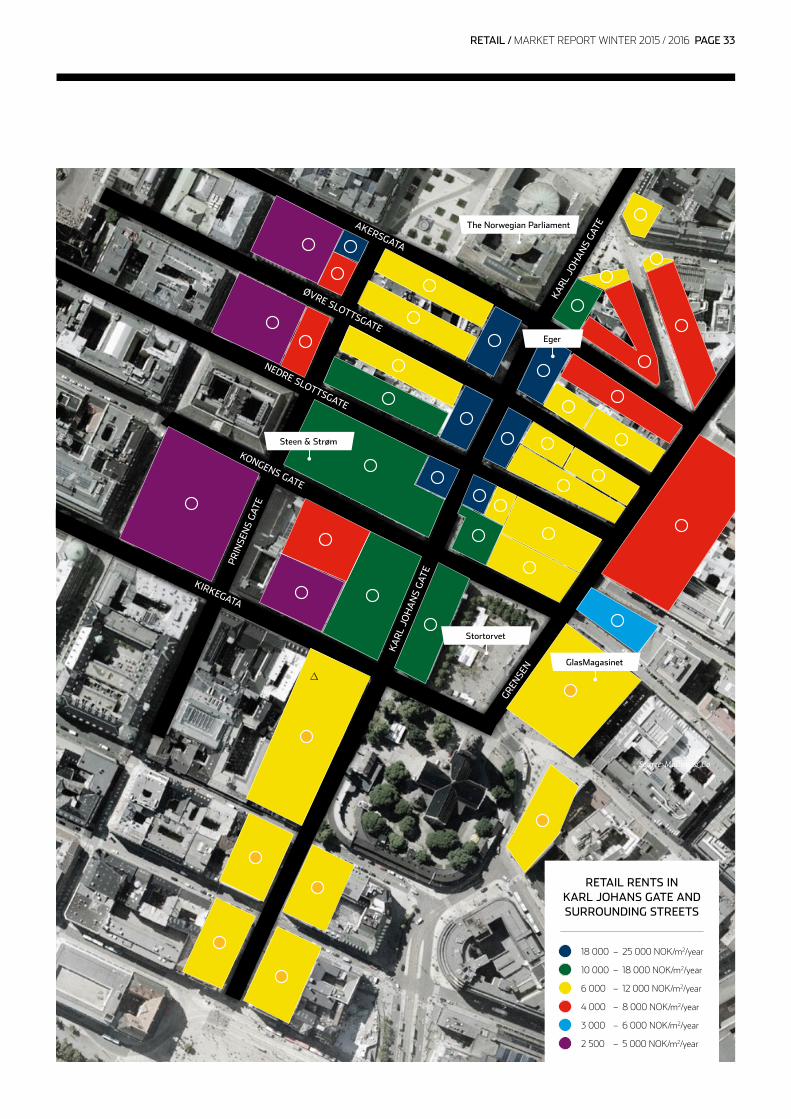
Refurbishment of shopping areasThe rental prices in the shopping area around Karl Johans gate vary considerably, and the prime rents are achieved around “Egertorget”. A significant increase in rents in recent years may make it profitable to refurbish old buildings. Tenants looking for a prime location also come with high requirements regarding quality. Several large rehabilitation projects are expected over the next four to five years, which we expect will enhance the attractiveness further.
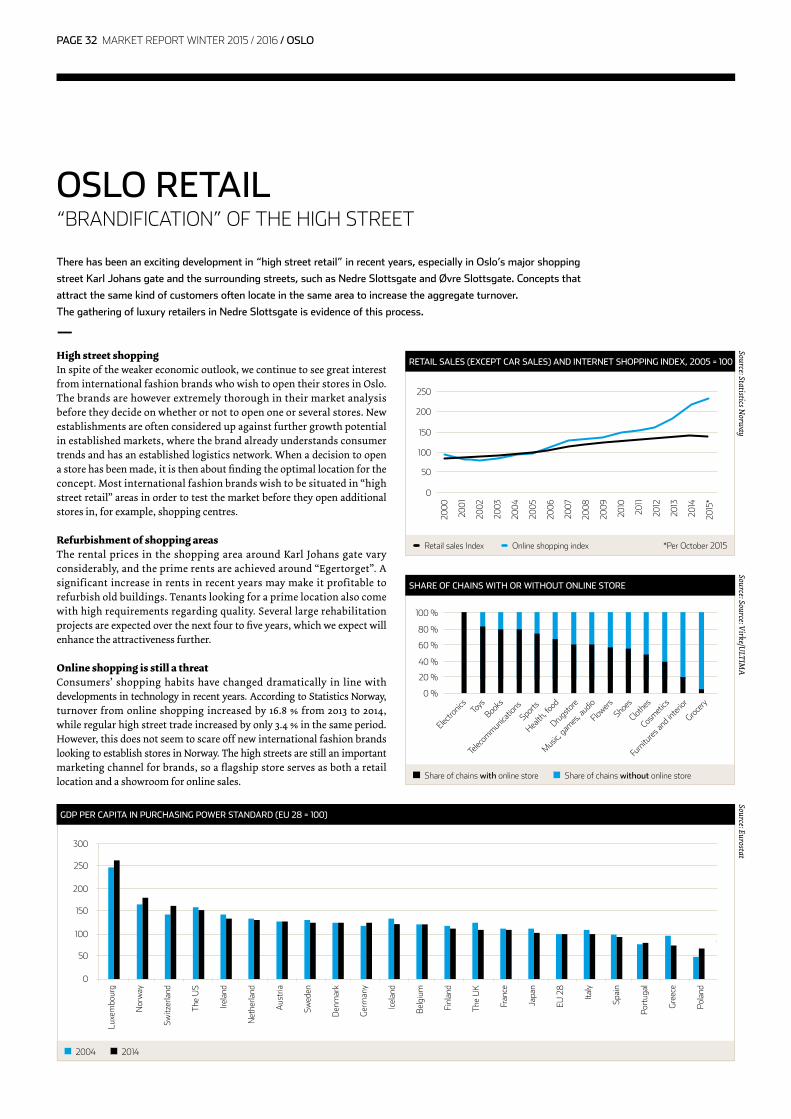
Online shopping is still a threatConsumers’ shopping habits have changed dramatically in line with developments in technology in recent years. According to Statistics Norway, turnover from online shopping increased by 16.8 % from 2013 to 2014, while regular high street trade increased by only 3.4 % in the same period. However, this does not seem to scare off new international fashion brands looking to establish stores in Norway. The high streets are still an important marketing channel for brands, so a flagship store serves as both a retail location and a showroom for online sales.
OSLO RETAIL“BRANDIFICATION” OF THE HIGH STREET
There has been an exciting development in “high street retail” in recent years, especially in Oslo’s major shopping
street Karl Johans gate and the surrounding streets, such as Nedre Slottsgate and Øvre Slottsgate. Concepts that
attract the same kind of customers often locate in the same area to increase the aggregate turnover.
The gathering of luxury retailers in Nedre Slottsgate is evidence of this process.
—
Retail sales Index Online shopping index *Per October 2015
Source: Statistics Norw
ay
RETAIL SALES (EXCEPT CAR SALES) AND INTERNET SHOPPING INDEX, 2005 = 100
250
200
150
100
50
0
2000
2001
2002
2003
2004
2005
2006
2007
2008
2009
2010
2011
2012
2013
2014
2015
*
Share of chains with online store Share of chains without online store
Source: Source: Virke/ULTIM
A
SHARE OF CHAINS WITH OR WITHOUT ONLINE STORE
0 %
20 %
40 %
60 %
80 %
100 %
Telec
ommun
icatio
ns
Sports
Furnitu
res an
d inter
ior
Grocery
Health
, food
Drugsto
re
Music,
games
, aud
io
Flowers
Shoes
Clothes
Cosmeti
cs
Electro
nics Toys
Books
Source: Eurostat
300
250
200
150
100
50
0
Luxe
mbo
urg
Nor
way
Switz
erla
nd
The
US
Irela
nd
Net
herla
nd
Aus
tria
Swed
en
Den
mar
k
Ger
man
y
Icel
and
Bel
gium
Finl
and
The
UK
Fran
ce
Japa
n
EU 2
8
Italy
Spai
n
Port
ugal
Gre
ece
Pola
nd
2004 2014
GDP PER CAPITA IN PURCHASING POWER STANDARD (EU 28 = 100)
PAGE 32 MARKET REPORT WINTER 2015 / 2016 / OSLO
The Norwegian Parliament
KIRKEGATA
KONGENS GATE
NEDRE SLOTTSGATEK
AR
L JO
HA
NS
GAT
E
KARL
JO
HA
NS
GATE
PR
INSE
NS
GAT
E
GREN
SEN
ØVRE SLOTTSGATE
AKERSGATA
Steen & Strøm
GlasMagasinet
Stortorvet
Eger
V
18 000 – 25 000 NOK/m2/year
RETAIL RENTS IN KARL JOHANS GATE AND SURROUNDING STREETS
10 000 – 18 000 NOK/m2/year
6 000 – 12 000 NOK/m2/year
4 000 – 8 000 NOK/m2/year
3 000 – 6 000 NOK/m2/year
2 500 – 5 000 NOK/m2/year
Source: Malling & Co
OSLO RETAIL“BRANDIFICATION” OF THE HIGH STREET
RETAIL / MARKET REPORT WINTER 2015 / 2016 PAGE 33

DRONNING MAUDS GATE 11, CBD
Malling & Co Næringsmegling has been commissioned to lease approximately 10 500 m2 of the totally modernized office building. The law firm Wikborg Rein has signed a lease agreement of 8 600 m2 from 2017.
Illustration: Pilot Arkitekter
PAGE 34 MARKET REPORT WINTER 2015 / 2016

MARKET REPORT WINTER 2015 / 2016 PAGE 35
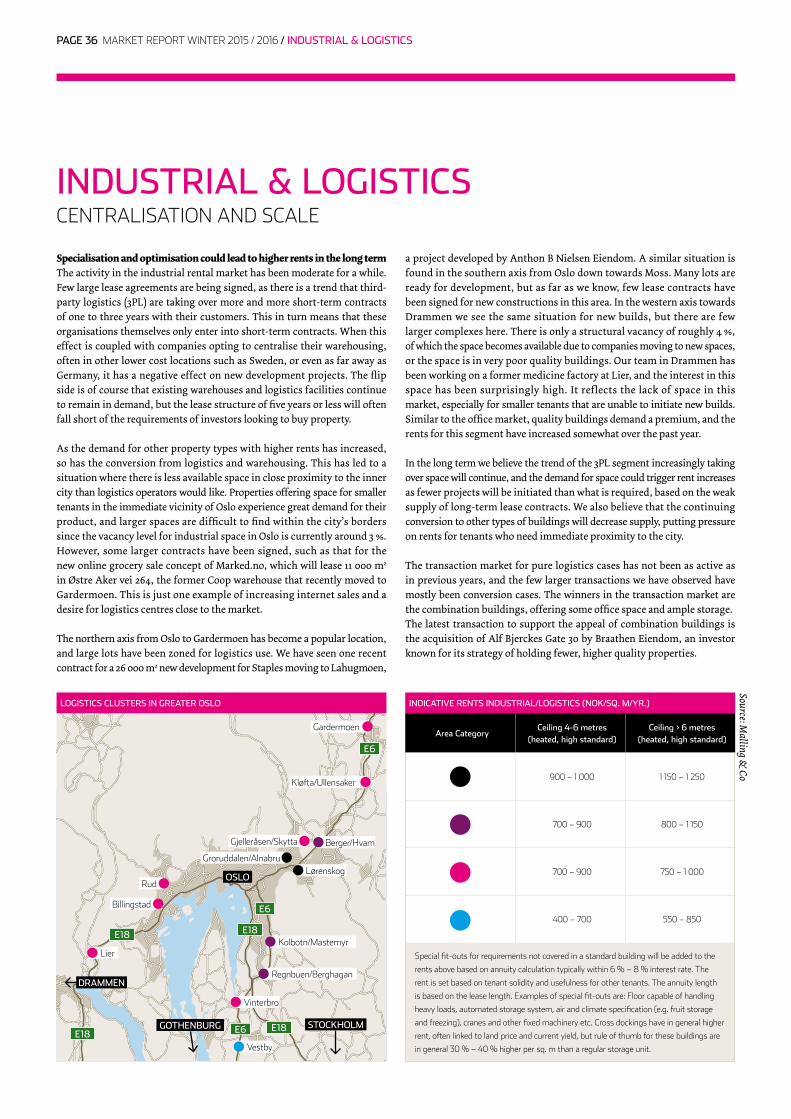
Source: Malling &
Co
Regnbuen/Berghagan
Kløfta/Ullensaker
Gardermoen
Gjelleråsen/Skytta
Groruddalen/Alnabru
Rud
Billingstad
Lier Kolbotn/Mastemyr
Lørenskog
Berger/Hvam
Vestby
OSLO
E6
E6
E6
E18E18
STOCKHOLMGOTHENBURG
Vinterbro
E18E18
LOGISTICS CLUSTERS IN GREATER OSLO
Specialisation and optimisation could lead to higher rents in the long term The activity in the industrial rental market has been moderate for a while. Few large lease agreements are being signed, as there is a trend that third-party logistics (3PL) are taking over more and more short-term contracts of one to three years with their customers. This in turn means that these organisations themselves only enter into short-term contracts. When this effect is coupled with companies opting to centralise their warehousing, often in other lower cost locations such as Sweden, or even as far away as Germany, it has a negative effect on new development projects. The flip side is of course that existing warehouses and logistics facilities continue to remain in demand, but the lease structure of five years or less will often fall short of the requirements of investors looking to buy property.
As the demand for other property types with higher rents has increased, so has the conversion from logistics and warehousing. This has led to a situation where there is less available space in close proximity to the inner city than logistics operators would like. Properties offering space for smaller tenants in the immediate vicinity of Oslo experience great demand for their product, and larger spaces are difficult to find within the city’s borders since the vacancy level for industrial space in Oslo is currently around 3 %. However, some larger contracts have been signed, such as that for the new online grocery sale concept of Marked.no, which will lease 11 000 m2
in Østre Aker vei 264, the former Coop warehouse that recently moved to Gardermoen. This is just one example of increasing internet sales and a desire for logistics centres close to the market.
The northern axis from Oslo to Gardermoen has become a popular location, and large lots have been zoned for logistics use. We have seen one recent contract for a 26 000 m2 new development for Staples moving to Lahugmoen,
INDUSTRIAL & LOGISTICSCENTRALISATION AND SCALE
a project developed by Anthon B Nielsen Eiendom. A similar situation is found in the southern axis from Oslo down towards Moss. Many lots are ready for development, but as far as we know, few lease contracts have been signed for new constructions in this area. In the western axis towards Drammen we see the same situation for new builds, but there are few larger complexes here. There is only a structural vacancy of roughly 4 %, of which the space becomes available due to companies moving to new spaces, or the space is in very poor quality buildings. Our team in Drammen has been working on a former medicine factory at Lier, and the interest in this space has been surprisingly high. It reflects the lack of space in this market, especially for smaller tenants that are unable to initiate new builds. Similar to the office market, quality buildings demand a premium, and the rents for this segment have increased somewhat over the past year.
In the long term we believe the trend of the 3PL segment increasingly taking over space will continue, and the demand for space could trigger rent increases as fewer projects will be initiated than what is required, based on the weak supply of long-term lease contracts. We also believe that the continuing conversion to other types of buildings will decrease supply, putting pressure on rents for tenants who need immediate proximity to the city. The transaction market for pure logistics cases has not been as active as in previous years, and the few larger transactions we have observed have mostly been conversion cases. The winners in the transaction market are the combination buildings, offering some office space and ample storage. The latest transaction to support the appeal of combination buildings is the acquisition of Alf Bjerckes Gate 30 by Braathen Eiendom, an investor known for its strategy of holding fewer, higher quality properties.
DRAMMEN
Special fit-outs for requirements not covered in a standard building will be added to the
rents above based on annuity calculation typically within 6 % – 8 % interest rate . The
rent is set based on tenant solidity and usefulness for other tenants . The annuity length
is based on the lease length . Examples of special fit-outs are: Floor capable of handling
heavy loads, automated storage system, air and climate specification (e .g . fruit storage
and freezing), cranes and other fixed machinery etc . Cross dockings have in general higher
rent, often linked to land price and current yield, but rule of thumb for these buildings are
in general 30 % – 40 % higher per sq . m than a regular storage unit .
INDICATIVE RENTS INDUSTRIAL/LOGISTICS (NOK/SQ. M/YR.)
Area CategoryCeiling 4-6 metres
(heated, high standard)Ceiling > 6 metres
(heated, high standard)
900 – 1 000 1 150 – 1 250
700 – 900 800 – 1 150
700 – 900 750 – 1 000
400 – 700 550 – 850
PAGE 36 MARKET REPORT WINTER 2015 / 2016 / INDUSTRIAL & LOGISTICS
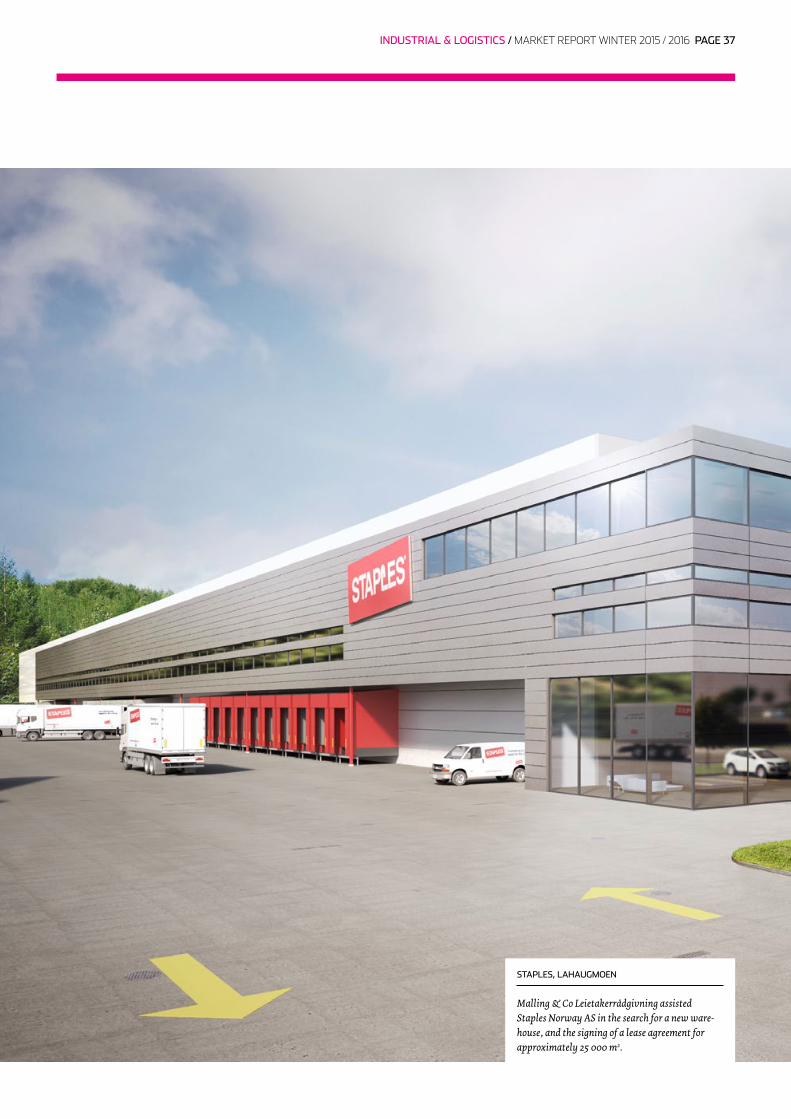
STAPLES, LAHAUGMOEN
Malling & Co Leietakerrådgivning assisted Staples Norway AS in the search for a new ware-house, and the signing of a lease agreement for approximately 25 000 m2.
INDUSTRIAL & LOGISTICS / MARKET REPORT WINTER 2015 / 2016 PAGE 37
Source: Cushman &
Wakefield/M
alling & Co
NET PRIME YIELD IN SELECTED EUROPEAN CITIES
CITY PRIME YIELD (OFFICE)
London 3 .25 %
Paris 3 .50 %
Zürich 3 .70 %
Munich 3 .85 %
Stockholm 3 .90 %
Berlin 4 .20 %
Oslo 4.20 %
Rome 4 .75 %
Copenhagen 4 .75 %
Helsinki 5 .00 %
Glasgow 5 .50 %
Office buildings and retail portfolios flying off the shelfWhen looking at the pure volume in 2015, the office and retail segments are neck and neck, with each constituting roughly one third of the total volume. While office transactions are driven by a combination of high volume and transactions, the retail segment has been primarily fuelled by a few very large portfolio deals, including the record high NOK 12.3 billion sales of the Sektor Group and the NOK 5.3 billion sales of Promenaden Property, both acquired by foreign investors. That being said, some very large office buildings have been sold as well, including Fornebuporten for NOK 3.2 billion and DNB middle building for NOK 3.9 billion.
Prime yield at 4.20 %The prime yield has been further reduced throughout the year, and we estimate a current prime yield at 4.20 %. Although the macro-economic environment has worsened for Norway in the short term, there are still underlying long-term drivers in the Norwegian economy that appeal to investors looking for prime objects in the CBD. As supply continues to fall short of demand for these premium objects, and interest rates are at record low levels, yield will trump the negative short-term outlook. Norway continues to be viewed as a stable and attractive safe harbour for real estate investments. As one would expect, we have also seen many sellers coming
to the marketplace when yields are at such attractive levels, and several trophy assets are being offered in the CBD. As such, there are also many sellers with less desirable objects observing these levels in the marketplace and believing that they can offload properties at fantastic prices. However, the market is pricing in a healthy risk premium for secondary properties, currently estimated at 6.00 % on average, and sellers who become too ambitious in their asking price will not see their properties move.
Bank financing tightening upOne of the most important drivers behind the active transaction market has been low funding costs. Banks have offered competitive margins at a time in which interest rates have fallen to record low levels. As yields have further decreased, and with regulatory measures increasing the amount of capital held by banks to support their commercial real estate lending, domestic banks are now becoming increasingly selective in their engagements. Several large domestic banks have clearly stated that they will be more selective regarding the customers to which they will grant loans, and how attractive properties must be before they are willing to finance a project. This has also been observed in the market by investors either being offered very high margins of 175 bps or more, or outright refusals of finance. The same restrictive trend for commercial real estate was also captured in the latest Central Bank lending survey. There are however branches of foreign banks with fewer regulatory requirements for commercial real estate lending to investors, and we also see that some life insurance companies are exposing themselves to the commercial real estate market as lenders instead of making direct investments in assets themselves.
Finishing the year at record level – uncertainty aheadThe record high volumes seen throughout 2015 have been a consequence of low interest rates, increased demand from foreign investors and portfolios being offered to the market. Upon further investigation of the drivers of the high volumes recorded, one also observes that foreign investors have been buying larger assets than those traditionally sold in the Norwegian market. A staggering 22 transactions were of a size of more than NOK 1 billion – this is almost as many deals of this size as seen in the past three years combined. We also know of several larger transactions that are currently in process and expected to close before year end that will increase this figure even further. However, this state is not expected to continue indefinitely. The narrowing spread between the prime yield and NOK10Y swap is second only to London in a European context, and margins are on the rise due to regulatory and economic factors. Investors might be unwilling, or unable, to pay even more for Norwegian commercial real estate going forward.
THE TRANSACTION MARKETTIGHTER CREDIT POLICIES
So far this year we have registered a total transaction volume of NOK 101.8 billion*, divided across 175 transactions*. Foreign
investors have continued their presence in the market throughout the year, and as at 18 November account for roughly 38 % of
the total transaction volume. The economic slowdown in Norway, especially within the Oil & Gas sector, has yet to affect the
transaction market in terms of investor attraction. However, the banks – at least those that are Norwegian-owned – are more
risk averse and have announced a much more restrictive lending policy towards commercial real estate. Attractive and central
locations and well-known customer groups appear to have an advantage in obtaining financing from the banks.
—
*As at 18 November (above NOK 50 million)
PAGE 38 MARKET REPORT WINTER 2015 / 2016 / THE TRANSACTION MARKET
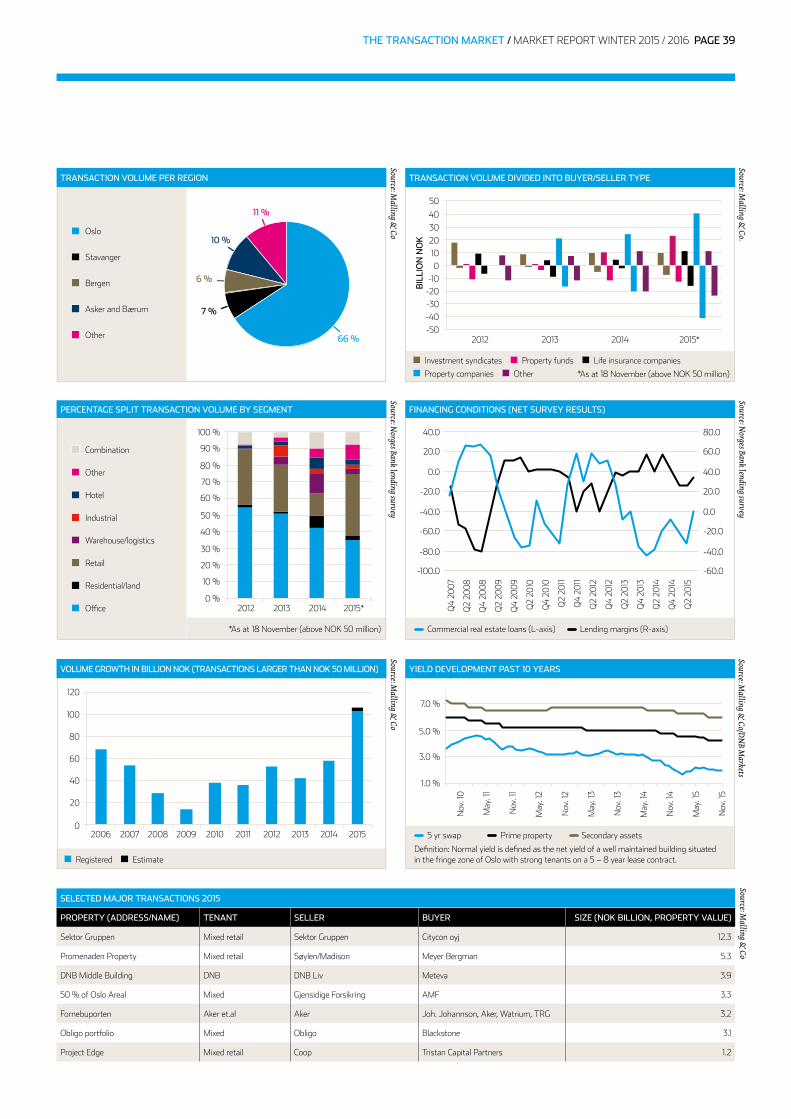
SELECTED MAJOR TRANSACTIONS 2015
PROPERTY (ADDRESS/NAME) TENANT SELLER BUYER SIZE (NOK BILLION, PROPERTY VALUE)
Sektor Gruppen Mixed retail Sektor Gruppen Citycon oyj 12 .3
Promenaden Property Mixed retail Søylen/Madison Meyer Bergman 5 .3
DNB Middle Building DNB DNB Liv Meteva 3 .9
50 % of Oslo Areal Mixed Gjensidige Forsikring AMF 3 .3
Fornebuporten Aker et .al Aker Joh . Johannson, Aker, Watrium, TRG 3 .2
Obligo portfolio Mixed Obligo Blackstone 3 .1
Project Edge Mixed retail Coop Tristan Capital Partners 1 .2
Source: Malling &
Co
Investment syndicates Property funds Life insurance companies
Property companies Other
5 yr swap Prime property Secondary assets
Registered Estimate
*As at 18 November (above NOK 50 million) Commercial real estate loans (L-axis) Lending margins (R-axis)
YIELD DEVELOPMENT PAST 10 YEARS
Source: Malling &
Co/DN
B Markets
Source: Malling &
Co
VOLUME GROWTH IN BILLION NOK (TRANSACTIONS LARGER THAN NOK 50 MILLION)
Source: Norges Bank lending survey
PERCENTAGE SPLIT TRANSACTION VOLUME BY SEGMENT
Source: Malling &
Co
TRANSACTION VOLUME PER REGION
Oslo
Combination
Other
Hotel
Industrial
Warehouse/logistics
Retail
Residential/land
Office
Bergen
Asker and Bærum
Other
Stavanger
66 %
11 %
7 %
6 %
10 %
Source: Malling &
Co.
TRANSACTION VOLUME DIVIDED INTO BUYER/SELLER TYPE
2012 2013 2014 2015*
BIL
LIO
N N
OK
50
403020100
-10-20-30-40-50
120
100
80
60
40
20
02006 2007 2008 2009 2010 2011 2012 2013 2014 2015
100 %
90 %
80 %
70 %
60 %
50 %
40 %
30 %
20 %
10 %
0 %2012 2013 2014 2015*
*As at 18 November (above NOK 50 million)
1 .0 %
3 .0 %
5 .0 %
7 .0 %
Nov
. 10
May
. 11
Nov
. 11
May
. 12
Nov
. 12
May
. 13
Nov
. 13
May
. 14
Nov
. 14
May
. 15
Nov
. 15
Source: Norges Bank lending survey
FINANCING CONDITIONS (NET SURVEY RESULTS)
40 .0
20 .0
0 .0
-20 .0
-40 .0
-60 .0
-80 .0
-100 .0
80 .0
60 .0
40 .0
20 .0
0 .0
-20 .0
-40 .0
-60 .0
Q2
2008
Q4
2008
Q2
2009
Q4
2009
Q2
2010
Q4
2010
Q2
2011
Q4
2011
Q2
2012
Q4
2012
Q2
2013
Q4
2013
Q2
2014
Q2
2015
Q4
2014
Q4
2007
Definition: Normal yield is defined as the net yield of a well maintained building situatedin the fringe zone of Oslo with strong tenants on a 5 – 8 year lease contract .
THE TRANSACTION MARKET / MARKET REPORT WINTER 2015 / 2016 PAGE 39
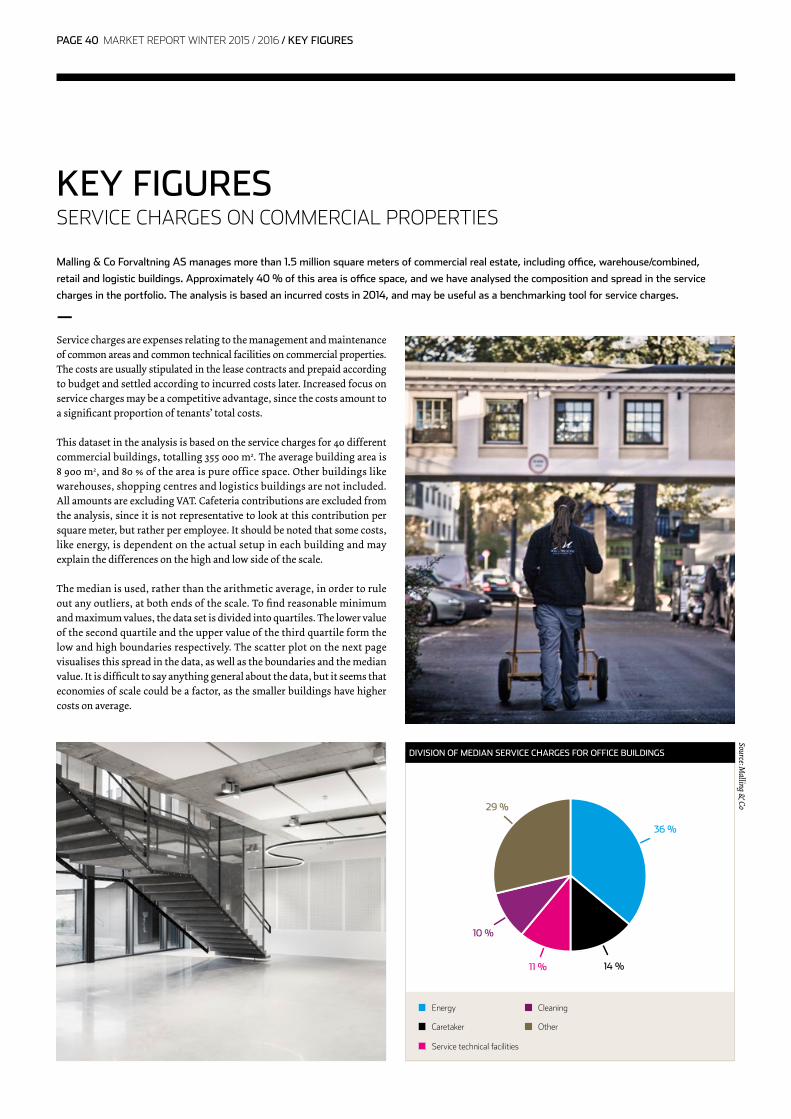
Service charges are expenses relating to the management and maintenance of common areas and common technical facilities on commercial properties. The costs are usually stipulated in the lease contracts and prepaid according to budget and settled according to incurred costs later. Increased focus on service charges may be a competitive advantage, since the costs amount to a significant proportion of tenants’ total costs.
This dataset in the analysis is based on the service charges for 40 different commercial buildings, totalling 355 000 m2. The average building area is 8 900 m2, and 80 % of the area is pure office space. Other buildings like warehouses, shopping centres and logistics buildings are not included. All amounts are excluding VAT. Cafeteria contributions are excluded from the analysis, since it is not representative to look at this contribution per square meter, but rather per employee. It should be noted that some costs, like energy, is dependent on the actual setup in each building and may explain the differences on the high and low side of the scale.
The median is used, rather than the arithmetic average, in order to rule out any outliers, at both ends of the scale. To find reasonable minimum and maximum values, the data set is divided into quartiles. The lower value of the second quartile and the upper value of the third quartile form the low and high boundaries respectively. The scatter plot on the next page visualises this spread in the data, as well as the boundaries and the median value. It is difficult to say anything general about the data, but it seems that economies of scale could be a factor, as the smaller buildings have higher costs on average.
KEY FIGURES SERVICE CHARGES ON COMMERCIAL PROPERTIES
Malling & Co Forvaltning AS manages more than 1.5 million square meters of commercial real estate, including office, warehouse/combined,
retail and logistic buildings. Approximately 40 % of this area is office space, and we have analysed the composition and spread in the service
charges in the portfolio. The analysis is based an incurred costs in 2014, and may be useful as a benchmarking tool for service charges.
—
DIVISION OF MEDIAN SERVICE CHARGES FOR OFFICE BUILDINGS
Source: Malling &
Co
Energy Cleaning
Caretaker Other
Service technical facilities
14 %
36 %
29 %
10 %
11 %
PAGE 40 MARKET REPORT WINTER 2015 / 2016 / KEY FIGURES
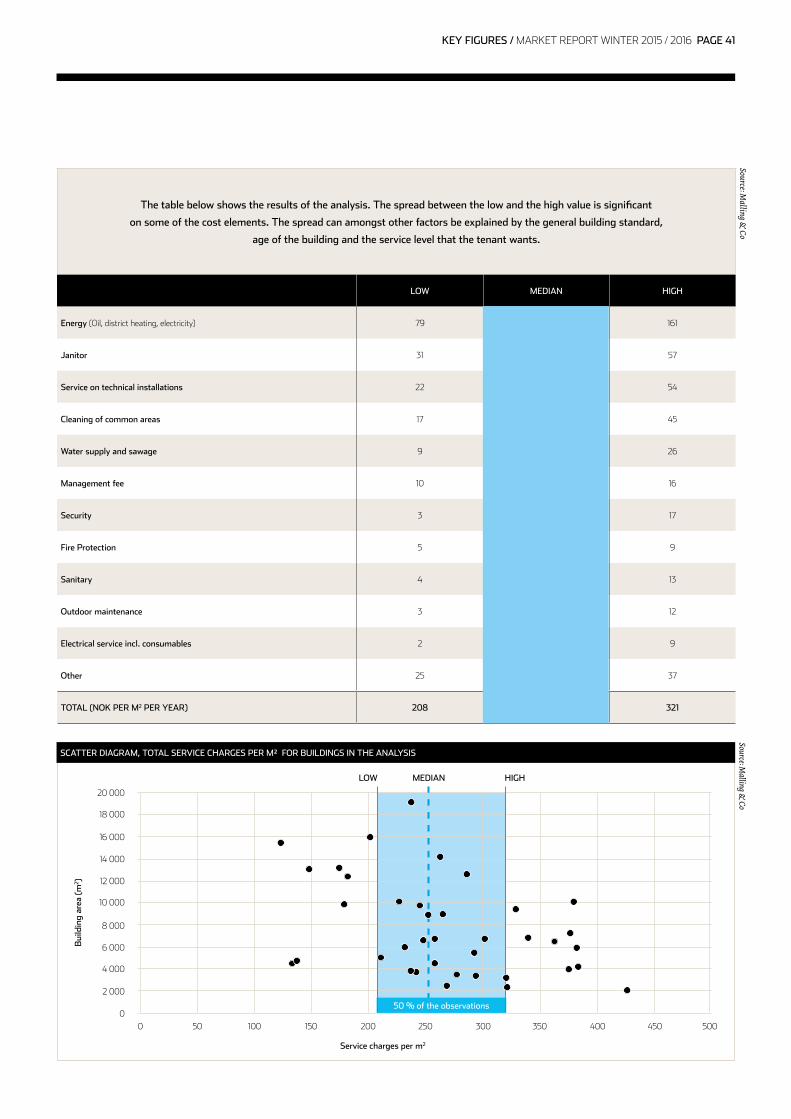
The table below shows the results of the analysis. The spread between the low and the high value is significant
on some of the cost elements. The spread can amongst other factors be explained by the general building standard,
age of the building and the service level that the tenant wants.
LOW MEDIAN HIGH
Energy (Oil, district heating, electricity) 79 113 161
Janitor 31 44 57
Service on technical installations 22 34 54
Cleaning of common areas 17 32 45
Water supply and sawage 9 16 26
Management fee 10 13 16
Security 3 9 17
Fire Protection 5 7 9
Sanitary 4 7 13
Outdoor maintenance 3 6 12
Electrical service incl. consumables 2 5 9
Other 25 29 37
TOTAL (NOK PER M2 PER YEAR) 208 258 321
Source: Malling &
Co
SCATTER DIAGRAM, TOTAL SERVICE CHARGES PER M² FOR BUILDINGS IN THE ANALYSIS
Source: Malling &
Co
0 50 100 150
LOW MEDIAN
Service charges per m2
HIGH
200 250 300 350 400 450 500
2 000
0
20 000
18 000
16 000
14 000
12 000
10 000
8 000
6 000
4 000
Bui
ldin
g ar
ea (
m2 )
50 % of the observations
KEY FIGURES / MARKET REPORT WINTER 2015 / 2016 PAGE 41

MALLING & CODRAMMEN
RESEARCH ANDADVISORY
COMPANY AND PROPERTY
MANAGEMENT
MALLING & COMARKETS
PROJECT FINANCING/
BUYSIDE ADVISORY
Mads MortensenManaging Partner
M: + 47 922 90 666E: mads@malling .no
Didrik CarlsenAdvisor
M: + 47 994 97 575E: dc@malling .no
Torjus MyklandProject Analyst
M: + 47 400 19 144E: tm@malling .no
CORPORATETRANSACTIONS
Lars C. LundAdvisor transactionsM: + 47 970 55 083
E: ll@malling .no
Anders K. MallingPartner/Advisor transactions
M: + 47 934 98 883E: am@malling .no
Morten A. MallingManaging Partner/Advisor
M: + 47 934 98 882E: mm@malling .no
Henrik Wolf MeedomAdvisor transactionsM: + 47 416 23 733E: hwm@malling .no
Tore-Christian HauklandPartner/Advisor transactions
M: + 47 993 84 787E: tch@malling .no
Jens Christian MellbyeAdvisor transactionsM: + 47 976 74 353E: jcm@malling .no
Haakon ØdegaardPartner/Head of Research
M: + 47 938 14 645E: ho@malling .no
Andreas Staubo BoassonSenior Analyst
M: + 47 986 05 209E: asb@malling .no
Ann Kristin AureAnalyst
M: + 47 986 14 518E: aka@malling .no
Herman NessSenior Analyst
M: + 47 995 44 488E: hn@malling .no
TENANT REPRESENTATION
Thomas FrognerPartner/Senior Advisor
M: + 47 400 38 191E: tf@malling .no
Oluf M. GehebPartner/Senior Advisor
M: + 47 911 56 547E: og@malling .no
Nora B. BrinchmannPartner/Senior Advisor
M: + 47 918 93 015E: nb@malling .no
Anne G. Kolstad SkogheimPartner/Senior Advisor
M: + 47 908 71 351E: aks@malling .no
Ruben Krantz KringstadBusiness DeveloperM: + 47 980 57 262E: rkk@malling .no
Anneli Bagne IngeboProject Manager
M: + 47 907 87 026E: abi@malling .no
Jostein Faye-PetersenAssociate
M: + 47 480 96 354E: jfp@malling .no
Eline Gedde-DahlProject Manager
M: + 47 901 30 300E: egd@malling .no
ENERGY ANDENVIRONMENT
Stein RandbyPartner
M: + 47 901 24 162E: sr@malling .no
Malling & Co offer services throughout the entire supply chain and benefit from synergies between the units—
Eiendomshuset Malling & Co is among Norway’s leading advisor and service provider within the field of commercial real estate. We have acquired our knowledge and experience over more than 50 years. Our two divisions, Markets and Management, have a total
workforce of approximately 140 employees. We offer services in the fields of management, rentals, transactions, valuations, analysis, consulting, tenant representation, energy and environment and project management.
PAGE 42 MARKET REPORT WINTER 2015 / 2016 / ABOUT MALLING & CO

Petter Warloff BergerManaging Partner
M: + 47 934 81 725E: pwb@malling .no
Marius VilhelmshaugenPartner/Estate AgentM: + 47 982 39 620E: mv@malling .no
Stian EspedalPartner/Estate AgentM: + 47 936 01 910E: ste@malling .no
Anne Berit MorkAccounting
M: + 47 905 56 763E: abm@malling .no
Sverre B. LundEstate Agent
M: + 47 906 46 797E: sbl@malling .no
MALLING & COSTAVANGER
MALLING & CODRAMMEN
COMPANY AND PROPERTY
MANAGEMENT
Cathrine KildalsenHead of Asset Management
M: + 47 918 67 524E: ck@malling .no
Tor-Arne UtgårdGroup CFO
M: + 47 913 44 294E: tau@malling .no
Odd FalkenbergHead of Technical Management
M: + 47 915 80 947E: of@malling .no
MALLING & COMARKETS
Peter T. Malling Jr.Managing Partner
M: + 47 481 50 481E: ptm .junior@malling .no
Marianne JohannessenHead of Marketing
M: + 47 950 53 635E: mj@malling .no
Tore BakkenPartner/Sales and Marketing Dir .
M: + 47 900 40 250E: tba@malling .no
CORPORATETRANSACTIONS
Kristian KleibergLawyer/Subject Coordinator
M: + 47 930 90 177E: kk@malling .no
Torill SkrettinglandManager/Senior Estate Agent
M: + 47 917 77 814E: ts@malling .no
Kurt Inge NybruEstate Agent
M: + 47 915 23 026E: kn@malling .no
Jan VarhaugEstate Agent
M: + 47 908 91 678E: jv@malling .no
LANDLORD REPRESENTATION
PROPERTYDEVELOPMENT
Eiendomshuset Malling & Co and its subsidiaries are an alliance partner of
the globally leading real estate advisor, Cushman & Wakefield.
—Cushman & Wakefield was established in
New York in 1917 and is now one of the world’s leading providers of real estate services. The
company currently has more than 16,000 employees in more than 256 offices and 60 countries. Its head office is currently located in New York, but the EMEA area
is controlled from London.
Fredrik SommerfeldtManaging PartnerM: + 47 916 09 161E: fs@malling .no
Thomas BagnEstate Agent
M: + 47 975 97 561E: thb@malling .no
Eirik SæbergEstate Agent
M: + 47 416 63 307E: es@malling .no
Dag TønderPartner/Senior Estate Agent
M: + 47 917 44 870E: dt@malling .no
Ole-Jacob DamsundPartner/Estate AgentM: + 47 970 20 644E: ojd@malling .no
Bård Stang-Lund ValasjøPartner
M: + 47 400 00 901E: bsv@malling .no
Tore TorgersenSenior Project Manager
M: + 47 417 41 681E: tt@malling .no
Lars Simen PaulgaardAdvisor
M: + 47 474 73 655E: lsp@malling .no
Trude S. AspelinMarket Analyst
M: + 47 922 55 946E: tsa@malling .no
ABOUT MALLING & CO / MARKET REPORT WINTER 2015 / 2016 PAGE 43

Eiendomshuset Malling & CoDronning Mauds gate 10, Postbox 1883 Vika, NO-0124 OsloT: +47 24 02 80 00 — F: +47 24 02 80 01 — E: post@malling .no — www.malling.no