Embed Size (px)
Citation preview
Implementing Implementing Energy Efficiency Initiatives Energy Efficiency Initiatives
in Industriesin Industries
16th March 2006
Pusat Tenaga Malaysia (PTM)
� Agent for public & private energy sectors
� Guardian/repository of national energy
database
� “Think-tank” on energy through
consultancy services
� Promoter of national energy efficiency &
renewable energy programmes
� Lead manager & coordinator in energy
research, development and demonstration
projects.
Malaysia Energy Malaysia Energy Malaysia Energy Malaysia Energy CentreCentreCentreCentreMalaysia Energy Malaysia Energy Malaysia Energy Malaysia Energy CentreCentreCentreCentre
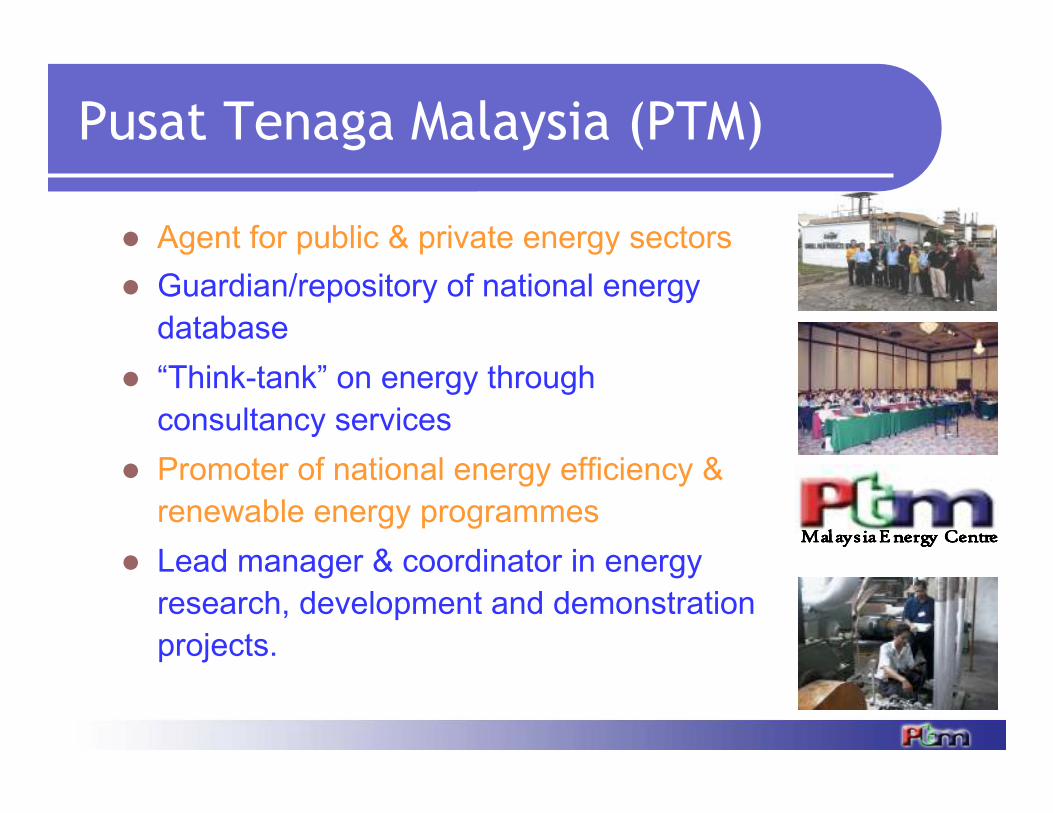
Why Energy Efficiency (EE)Why Energy Efficiency (EE)
Energy Per Capita in ASEAN
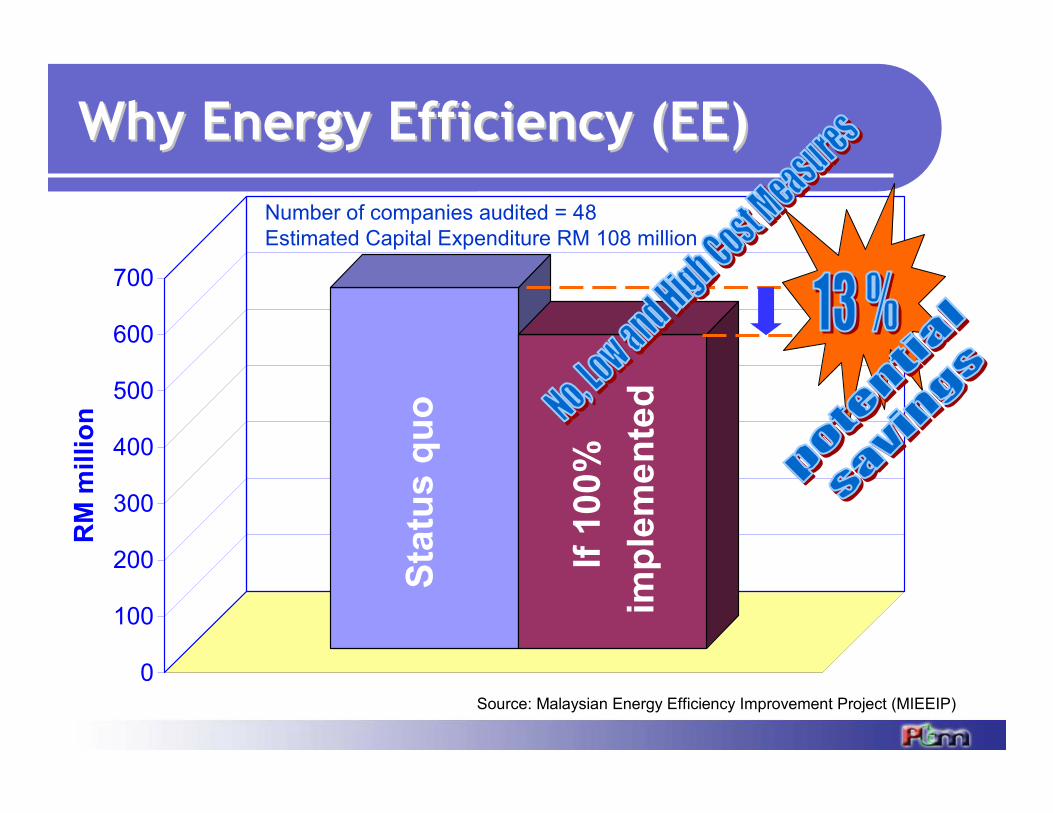
Why Energy Efficiency (EE)Why Energy Efficiency (EE)
0
100
200
300
400
500
600
700
RM
million
Source: Malaysian Energy Efficiency Improvement Project (MIEEIP)
Number of companies audited = 48
Estimated Capital Expenditure RM 108 million
Sta
tus q
uo
If 1
00%
imple
mente
d
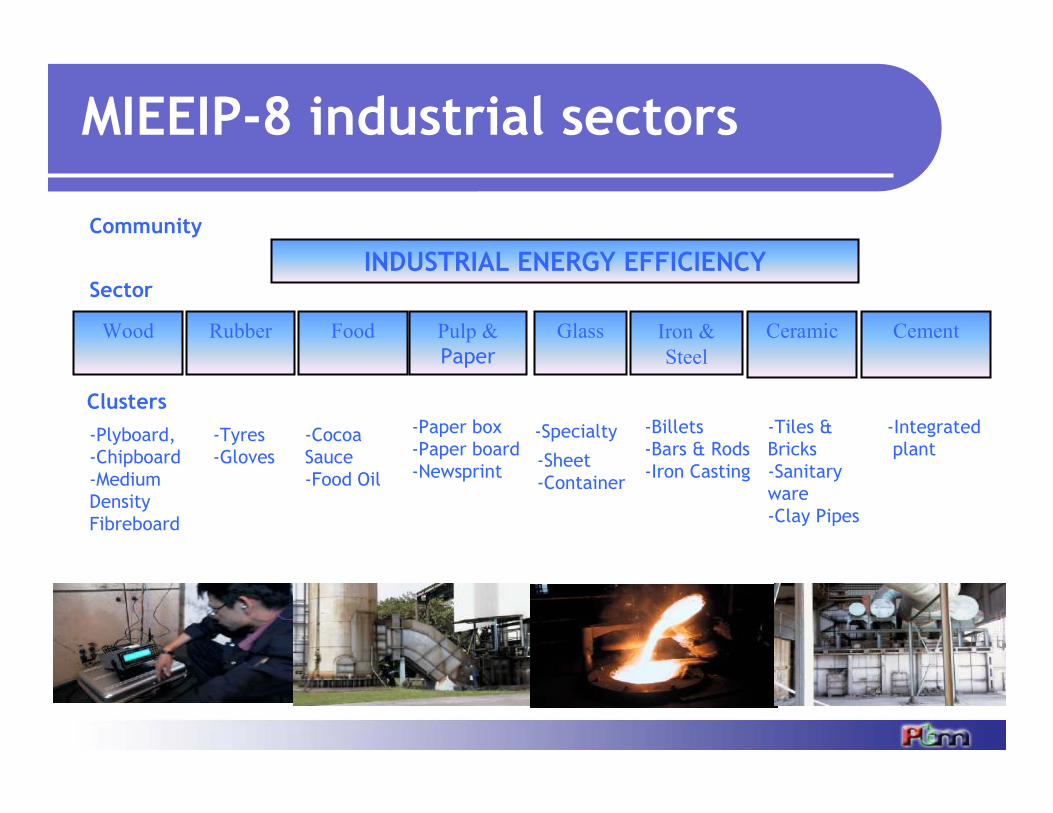
INDUSTRIAL ENERGY EFFICIENCY
Rubber
Community
Sector
Glass Iron &
Steel
Pulp &
Paper
Ceramic CementFood Wood
-Plyboard,
-Chipboard
-Medium
Density
Fibreboard
-Tyres
-Gloves
-Billets
-Bars & Rods
-Iron Casting
-Tiles &
Bricks
-Sanitary
ware
-Clay Pipes
-Paper box
-Paper board
-Newsprint
-Specialty
-Sheet
-Container
-Cocoa
Sauce
-Food Oil
MIEEIP-8 industrial sectors
-Integrated
plant
Clusters
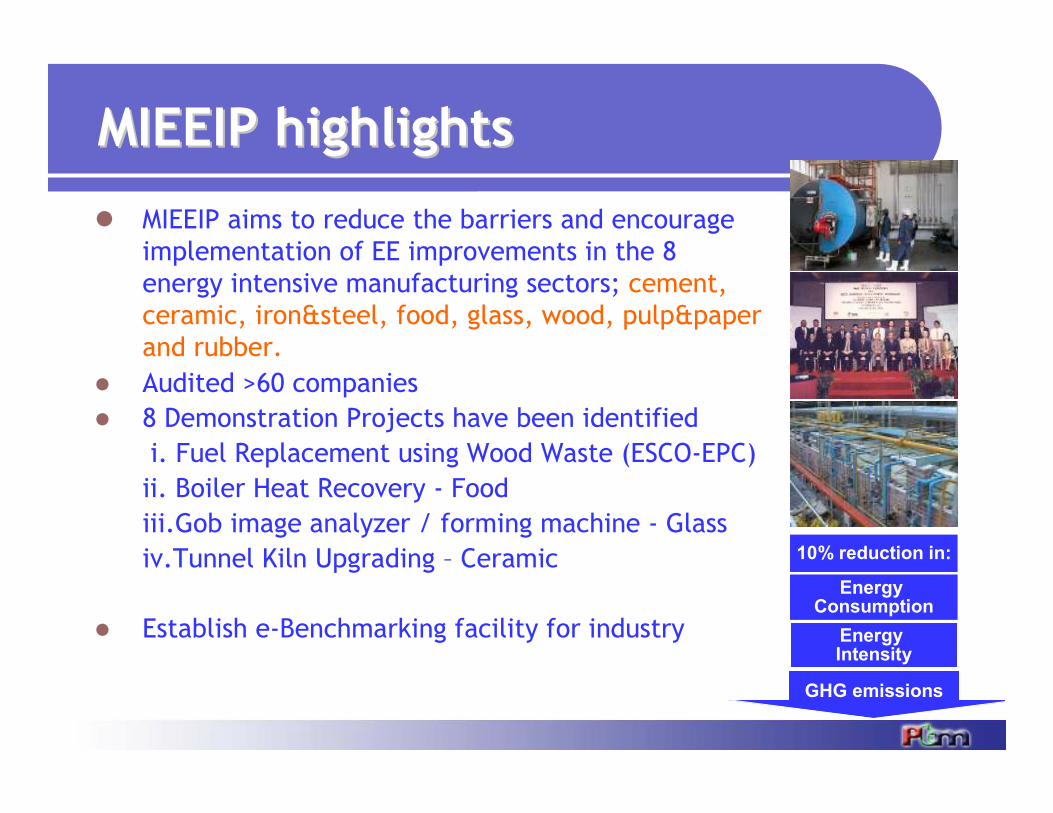
� MIEEIP aims to reduce the barriers and encourage
implementation of EE improvements in the 8
energy intensive manufacturing sectors; cement,
ceramic, iron&steel, food, glass, wood, pulp&paper
and rubber.
� Audited >60 companies
� 8 Demonstration Projects have been identified
i. Fuel Replacement using Wood Waste (ESCO-EPC)
ii. Boiler Heat Recovery - Food
iii.Gob image analyzer / forming machine - Glass
iv.Tunnel Kiln Upgrading – Ceramic
� Establish e-Benchmarking facility for industry
MIEEIP highlightsMIEEIP highlights
10% reduction in:
Energy Consumption
Energy Intensity
GHG emissions
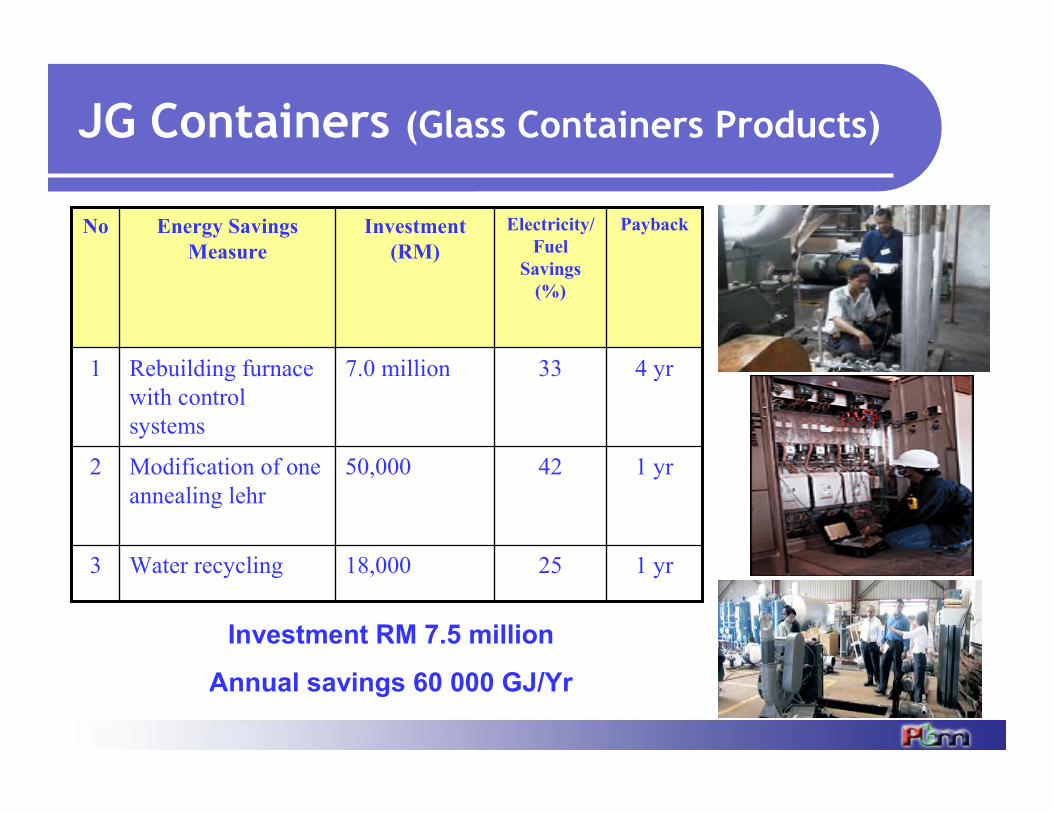
JG Containers (Glass Containers Products)
18,000
50,000
7.0 million
Investment
(RM)
1 yr25Water recycling3
1 yr42Modification of one
annealing lehr
2
4 yr33Rebuilding furnace
with control
systems
1
PaybackElectricity/
Fuel
Savings
(%)
Energy Savings
Measure
No
Investment RM 7.5 million
Annual savings 60 000 GJ/Yr
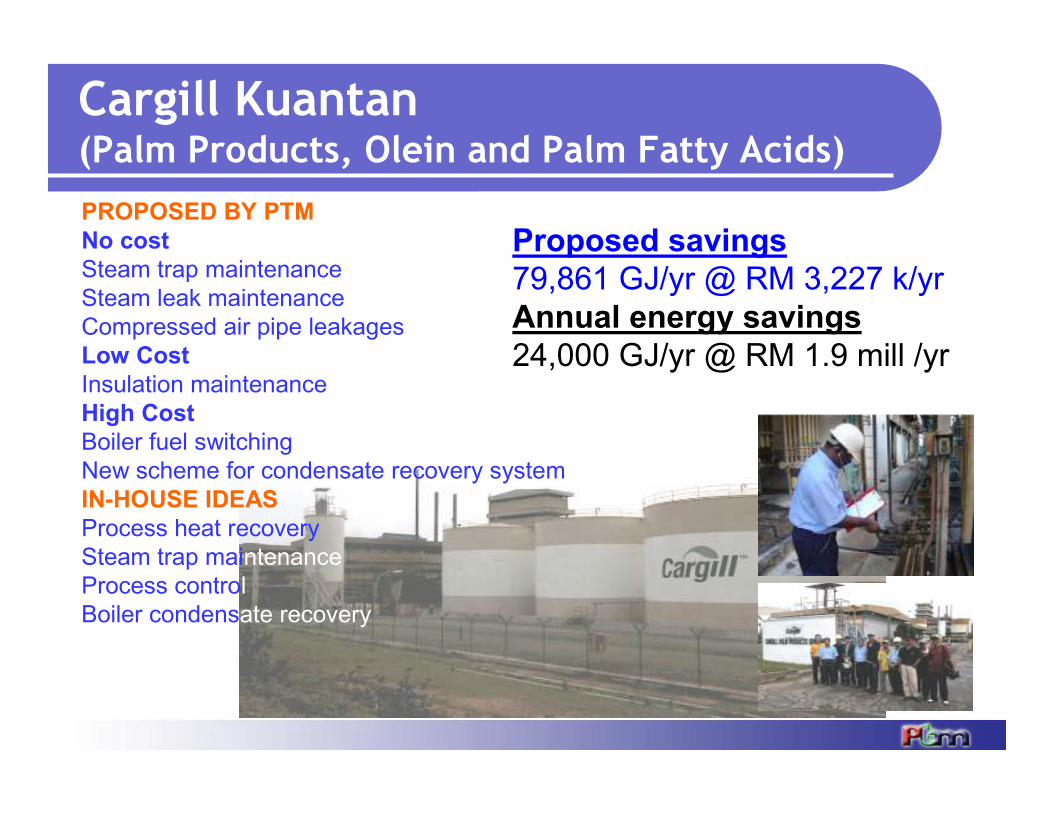
Cargill Kuantan(Palm Products, Olein and Palm Fatty Acids)
Proposed savings79,861 GJ/yr @ RM 3,227 k/yr
Annual energy savings 24,000 GJ/yr @ RM 1.9 mill /yr
PROPOSED BY PTMNo costSteam trap maintenance
Steam leak maintenance
Compressed air pipe leakages
Low CostInsulation maintenance
High CostBoiler fuel switching
New scheme for condensate recovery system
IN-HOUSE IDEASProcess heat recovery
Steam trap maintenance
Process control
Boiler condensate recovery
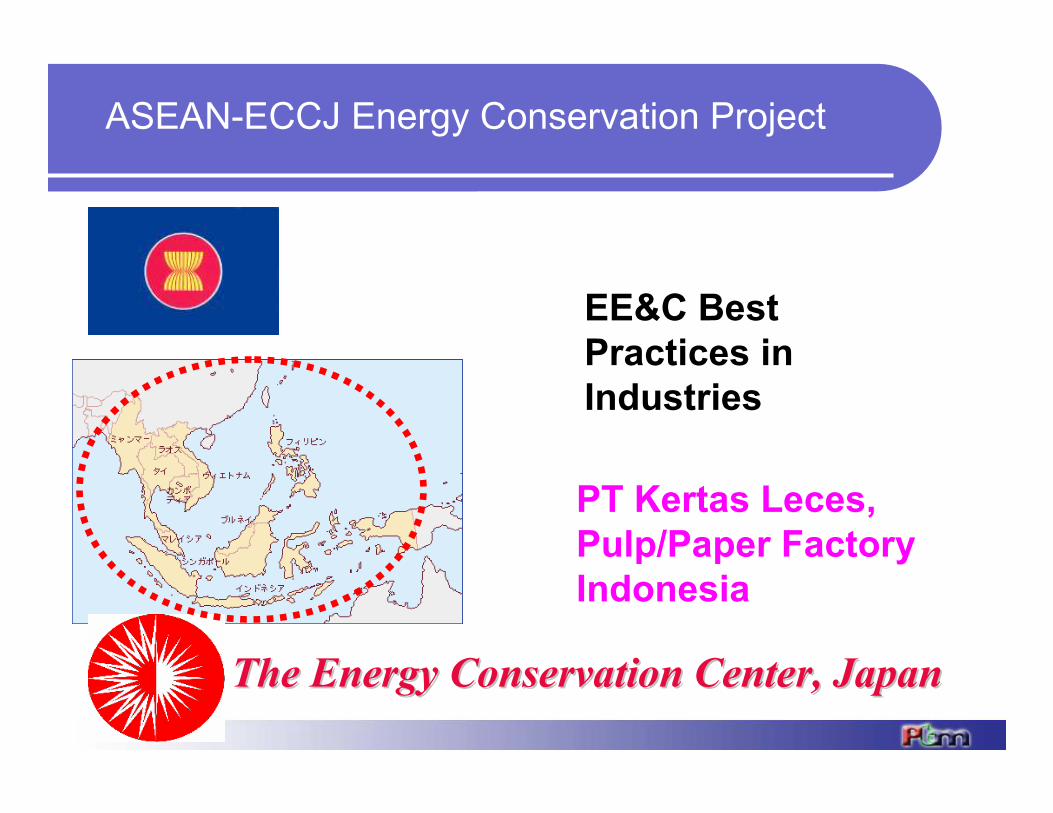
The Energy Conservation Center, JapanThe Energy Conservation Center, Japan
ASEAN-ECCJ Energy Conservation Project
PT Kertas Leces, Pulp/Paper FactoryIndonesia
EE&C Best Practices in Industries
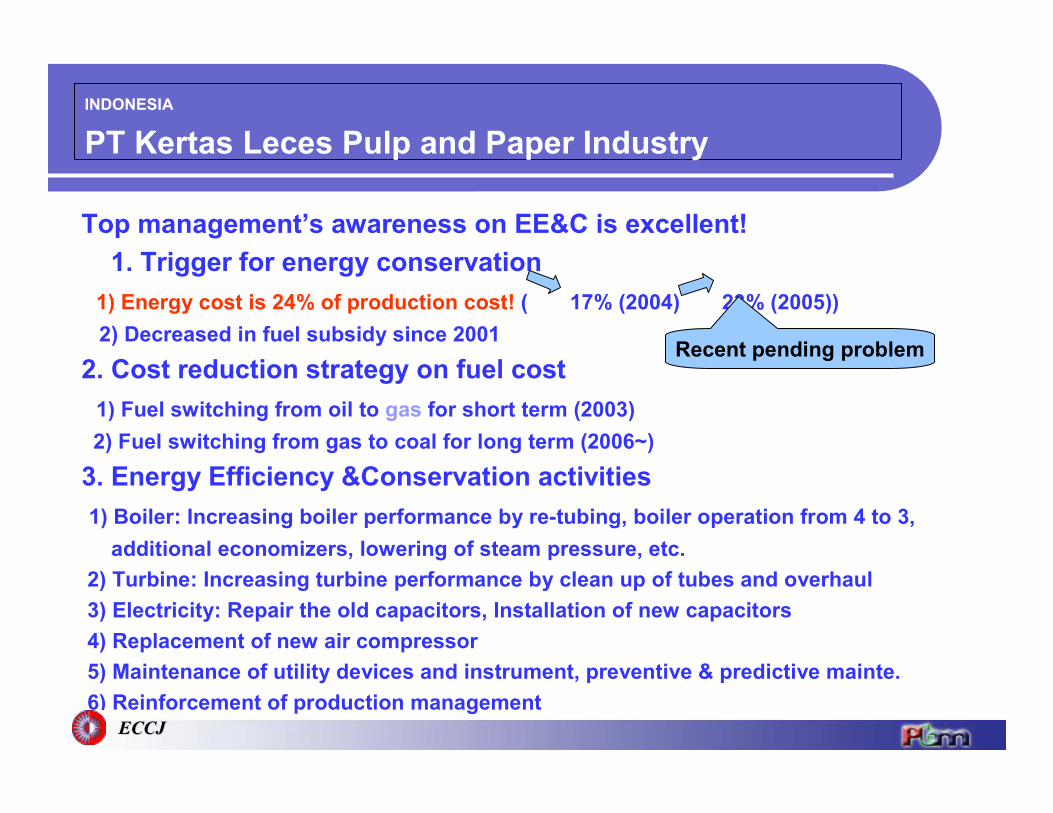
INDONESIA
PT Kertas Leces Pulp and Paper Industry
Top management’s awareness on EE&C is excellent!
1. Trigger for energy conservation
1) Energy cost is 24% of production cost! ( 17% (2004) 23% (2005))
2) Decreased in fuel subsidy since 2001
2. Cost reduction strategy on fuel cost
1) Fuel switching from oil to gas for short term (2003)
2) Fuel switching from gas to coal for long term (2006~)
3. Energy Efficiency &Conservation activities
1) Boiler: Increasing boiler performance by re-tubing, boiler operation from 4 to 3,
additional economizers, lowering of steam pressure, etc.
2) Turbine: Increasing turbine performance by clean up of tubes and overhaul
3) Electricity: Repair the old capacitors, Installation of new capacitors
4) Replacement of new air compressor
5) Maintenance of utility devices and instrument, preventive & predictive mainte.
6) Reinforcement of production management
Recent pending problem
ECCJECCJ
FUEL PRICE
2.2
3.674.18
9.66
2.67 2.96 3.2 3.3
4.36
1.4 1.6 1.7 1.9
1.07
1.32
0
1
2
3
4
5
6
7
8
9
10
2001 2002 2003 2004 2005
YEAR
US$/M
MB
TU
Oil Gas Coal
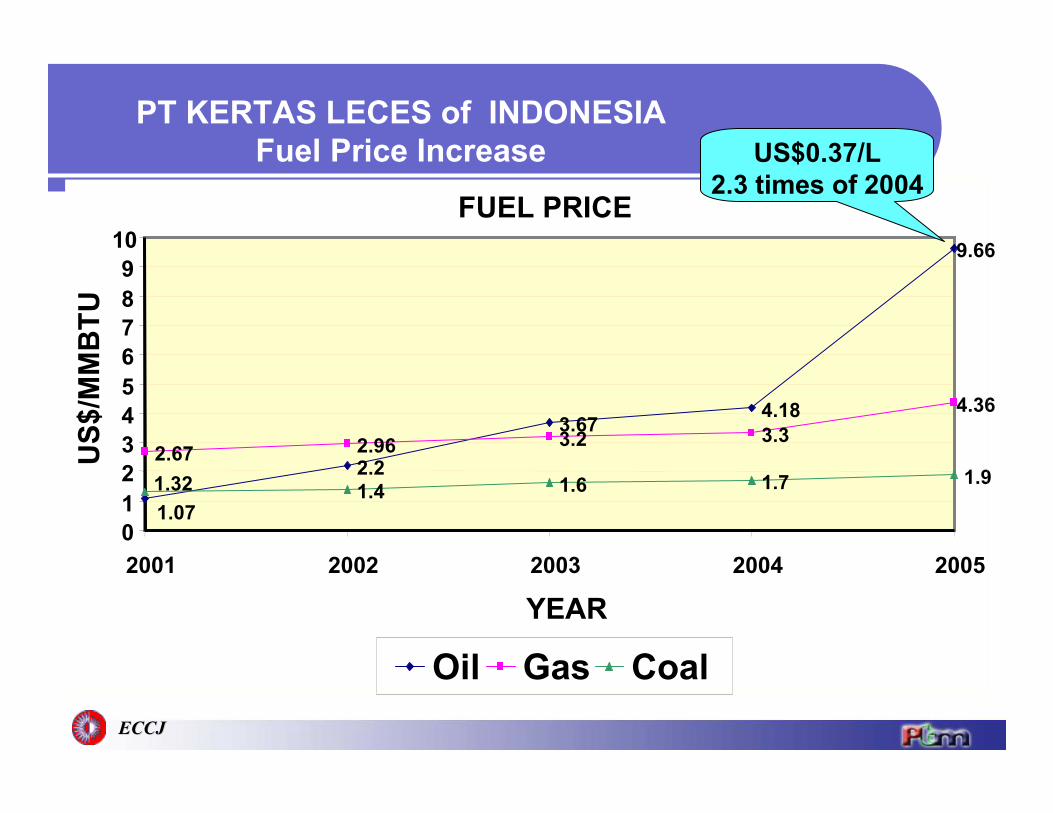
PT KERTAS LECES of INDONESIAFuel Price Increase US$0.37/L
2.3 times of 2004
ECCJECCJ
ECCJECCJ
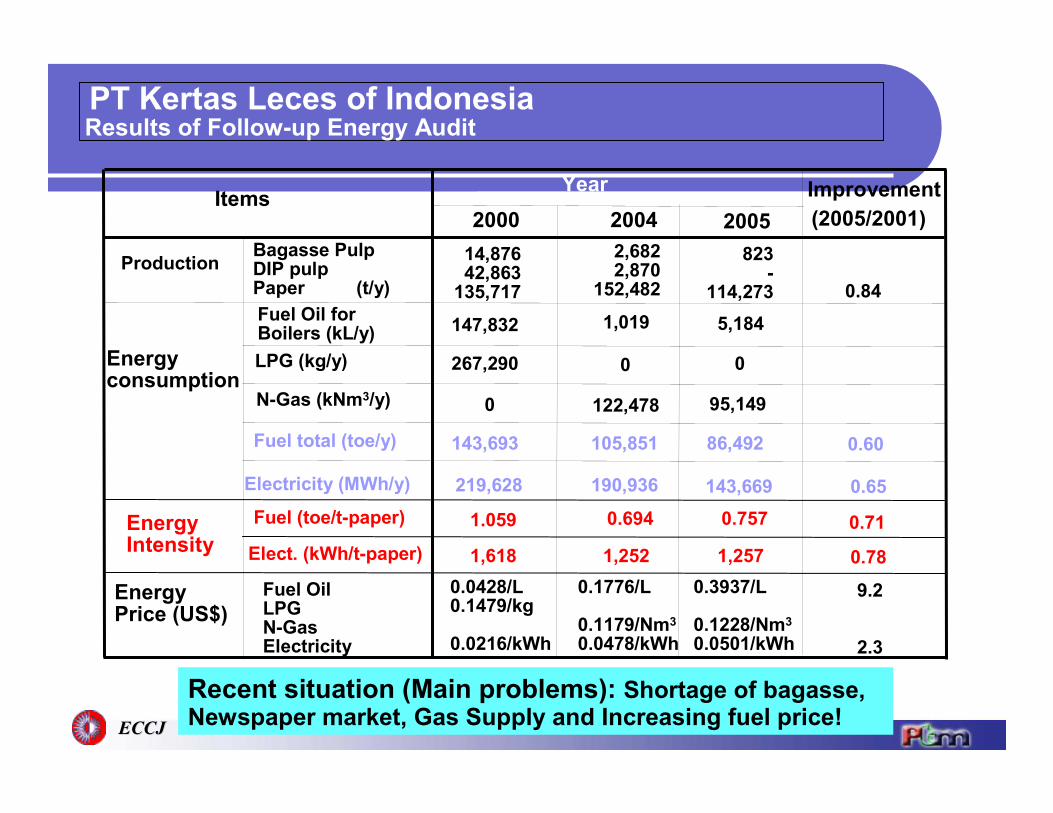
PT Kertas Leces of IndonesiaResults of Follow-up Energy Audit
ItemsYear
2004
Improvement
(2005/2001)
ProductionBagasse PulpDIP pulpPaper (t/y)
14,87642,863
135,717Fuel Oil for Boilers (kL/y) 147,832
Energyconsumption
Electricity (MWh/y)
Fuel OilLPGN-GasElectricity
0.0428/L0.1479/kg
0.0216/kWh
EnergyPrice (US$)
2000
Fuel (toe/t-paper)Energy Intensity
LPG (kg/y) 267,290
1.059
Elect. (kWh/t-paper) 1,618
Recent situation (Main problems): Shortage of bagasse, Newspaper market, Gas Supply and Increasing fuel price!
0.84
2,6822,870
152,482
2005
823-
114,273
N-Gas (kNm3/y)
0 0
219,628
122,4780 95,149
190,936 143,669 0.65
Fuel total (toe/y) 143,693 105,851 86,492 0.60
0.694 0.757 0.71
1,252 1,257 0.78
0.1776/L
0.1179/Nm3
0.0478/kWh
0.3937/L
0.1228/Nm3
0.0501/kWh
9.2
2.3
1,019 5,184
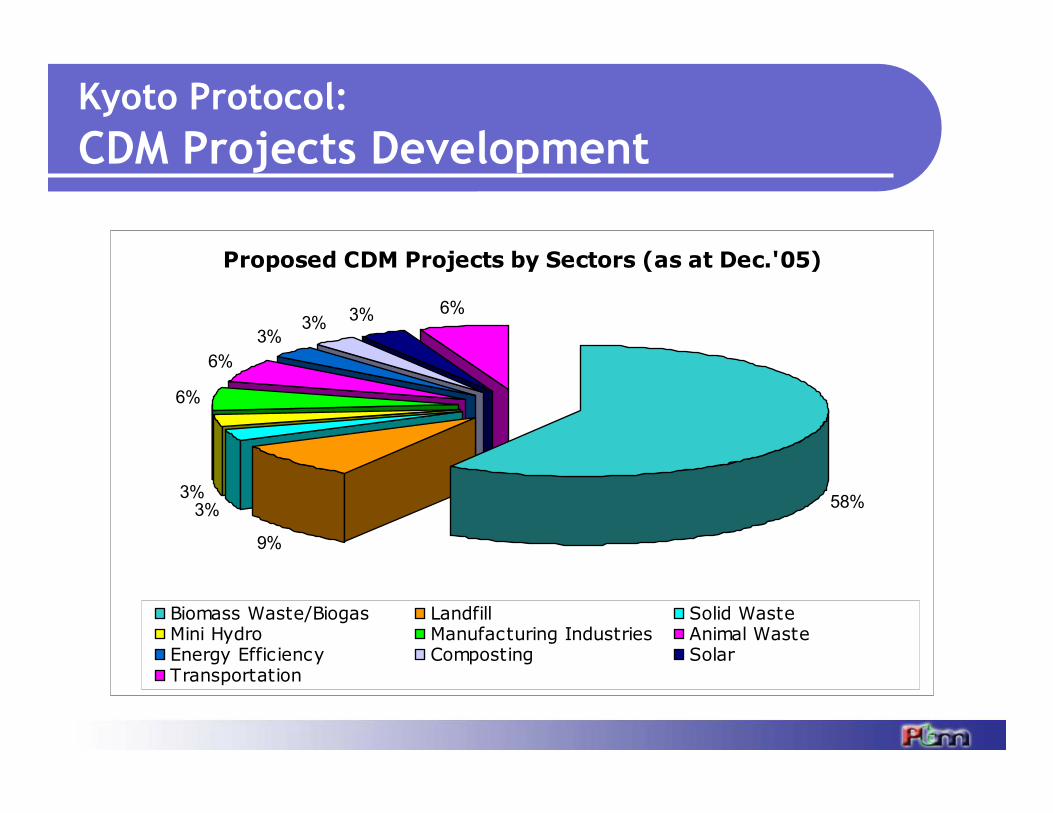
Kyoto Protocol:
CDM Projects Development
Proposed CDM Projects by Sectors (as at Dec.'05)
58%
9%
3%3%
6%
6%
3%3% 3% 6%
Biomass Waste/Biogas Landfill Solid WasteMini Hydro Manufacturing Industries Animal WasteEnergy Efficiency Composting Solar Transportation
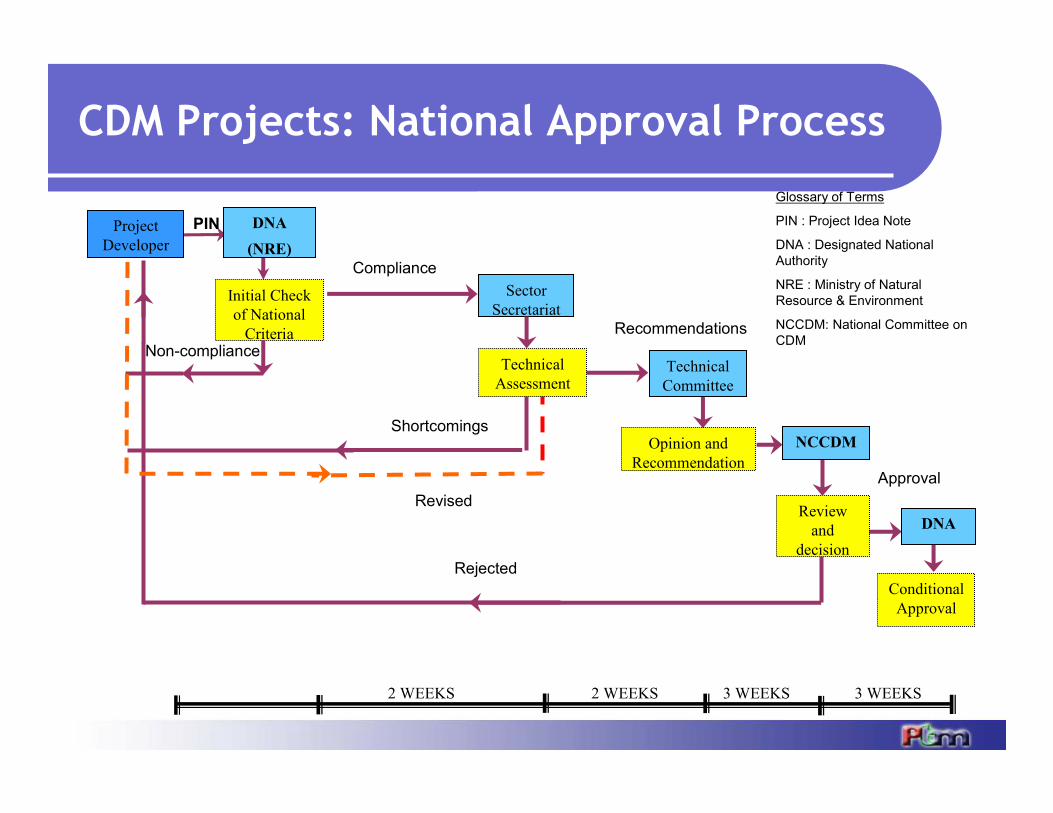
CDM Projects: National Approval Process
Project
Developer
DNA
(NRE)
Sector
Secretariat
Technical
Committee
Opinion and
Recommendation
DNAReview
and
decision
Conditional
Approval
PIN
2 WEEKS 2 WEEKS 3 WEEKS 3 WEEKS
Initial Check
of National
Criteria
Technical
Assessment
NCCDM
Compliance
Non-compliance
Shortcomings
Revised
Rejected
Recommendations
Approval
Glossary of Terms
PIN : Project Idea Note
DNA : Designated National
Authority
NRE : Ministry of Natural
Resource & Environment
NCCDM: National Committee on
CDM
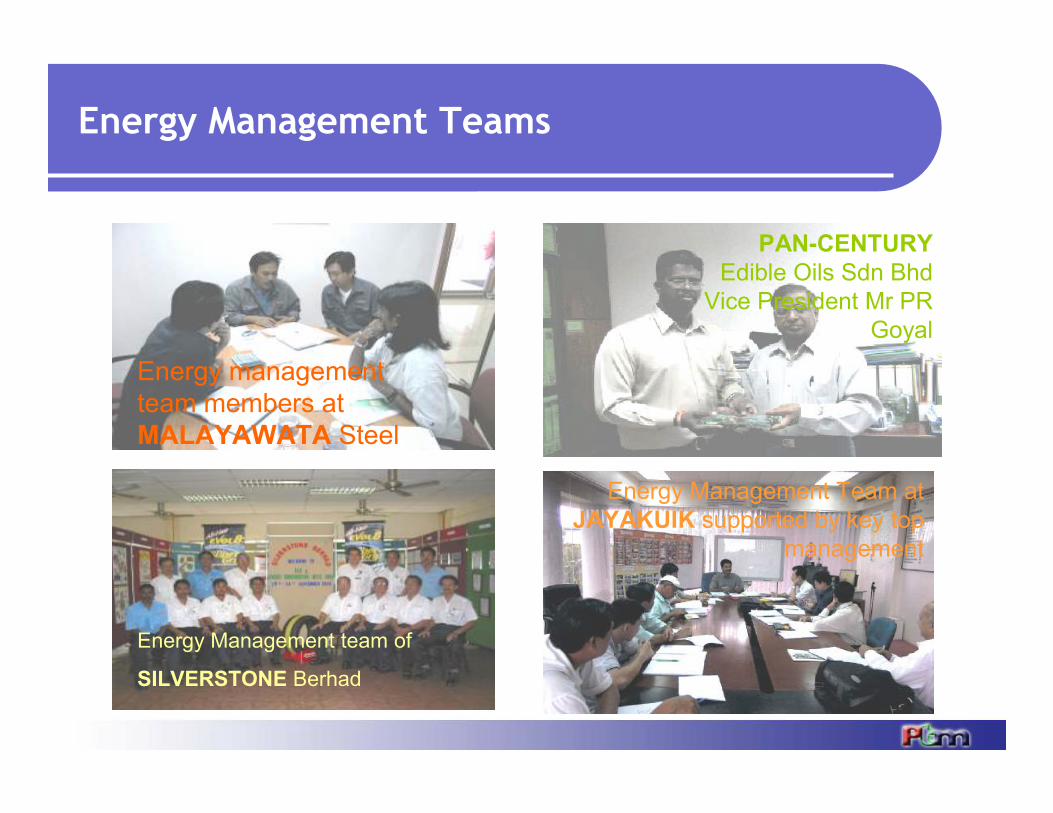
Energy Management Teams
Energy Management team of
SILVERSTONE Berhad
Energy Management Team at
JAYAKUIK supported by key top
management
Energy management
team members at
MALAYAWATA Steel
PAN-CENTURYEdible Oils Sdn Bhd
Vice President Mr PR
Goyal
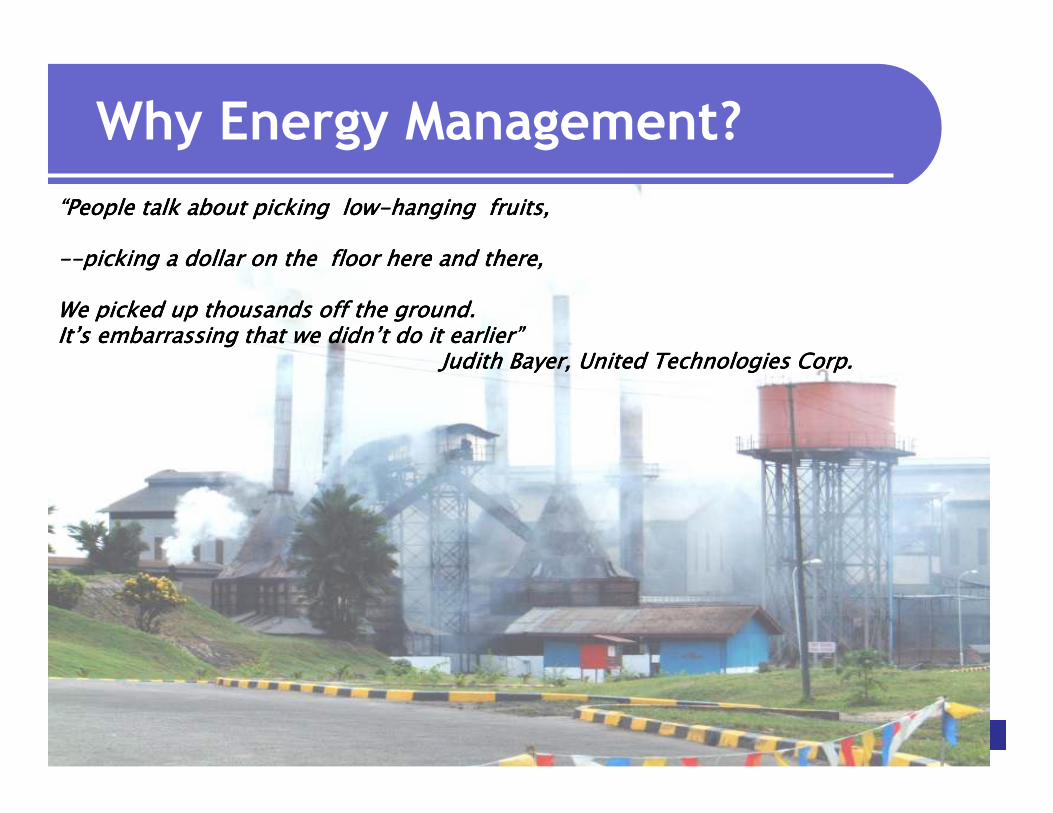
Why Energy Management?
““““People talk about picking lowPeople talk about picking lowPeople talk about picking lowPeople talk about picking low----hanging fruits,hanging fruits,hanging fruits,hanging fruits,
--------picking a dollar on the floor here and there, picking a dollar on the floor here and there, picking a dollar on the floor here and there, picking a dollar on the floor here and there,
We picked up thousands off the ground. We picked up thousands off the ground. We picked up thousands off the ground. We picked up thousands off the ground. It’s embarrassing that we didn’t do it earlier” It’s embarrassing that we didn’t do it earlier” It’s embarrassing that we didn’t do it earlier” It’s embarrassing that we didn’t do it earlier”
Judith Bayer, United Technologies Corp.Judith Bayer, United Technologies Corp.Judith Bayer, United Technologies Corp.Judith Bayer, United Technologies Corp.
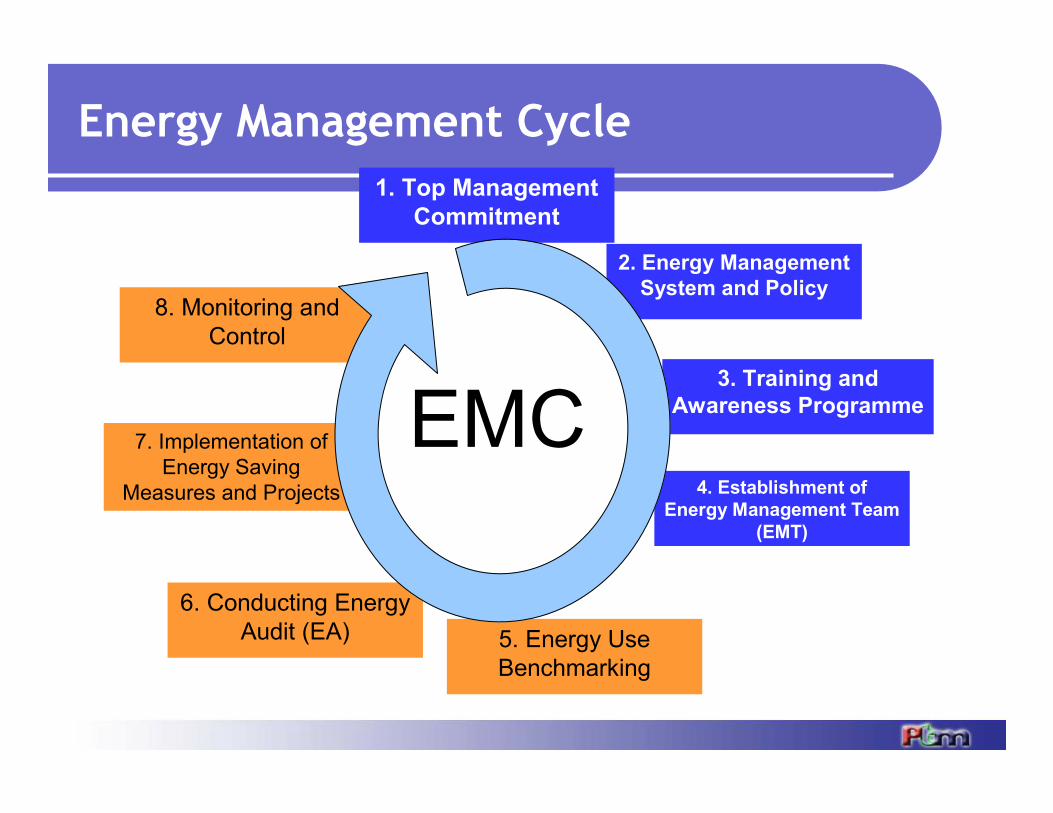
Energy Management Cycle
1. Top Management Commitment
2. Energy Management System and Policy
4. Establishment of Energy Management Team
(EMT)
5. Energy Use
Benchmarking
6. Conducting Energy
Audit (EA)
7. Implementation of
Energy Saving
Measures and Projects
8. Monitoring and
Control
3. Training and Awareness Programme EMC
Establish
Standards
Implement
plans
Measure
progress
Review
against
objectives
Establish
Standards
Implemen
t plans
Measure
progress
Review
against
objectives
Establish
Standards
Implement
plans
Measure
progress
Review
against
objectives
A Continuous
Improvement
By
Challenging
New Targets
Energy Management Culture
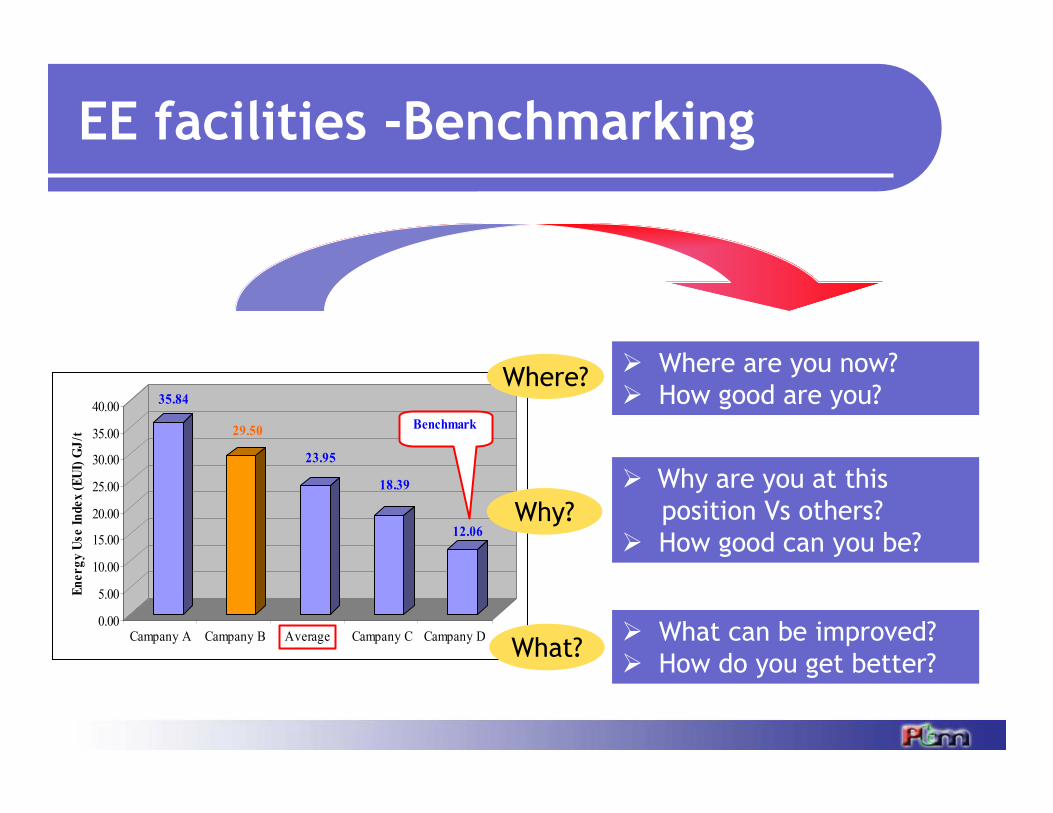
35.84
29.50
23.95
18.39
12.06
0.00
5.00
10.00
15.00
20.00
25.00
30.00
35.00
40.00
Energy Use Index (EUI) GJ/t
Campany A Campany B Average Campany C Campany D
Benchmark
Where?� Where are you now?
� How good are you?
Why?
� Why are you at this
position Vs others?
� How good can you be?
What?� What can be improved?
� How do you get better?
EE facilities -Benchmarking
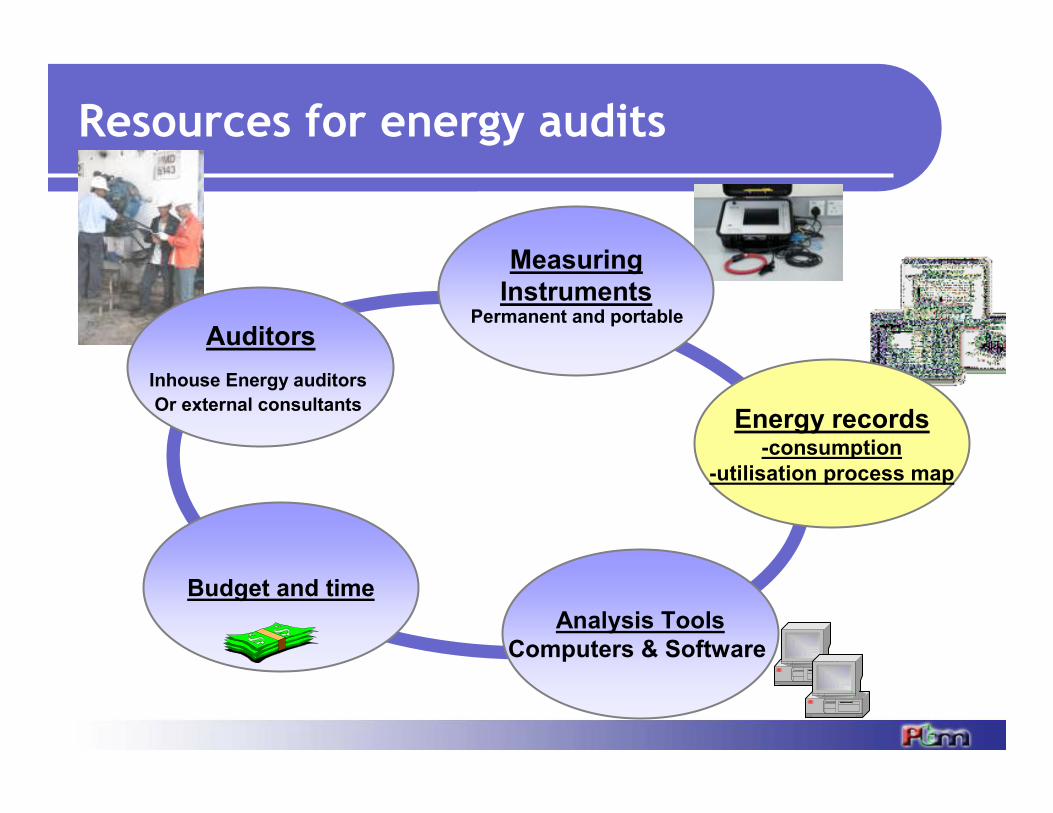
Resources for energy audits
Auditors
MeasuringInstruments
Analysis ToolsComputers & Software
Energy records-consumption
-utilisation process map
Inhouse Energy auditors
Or external consultants
Permanent and portable
Budget and time
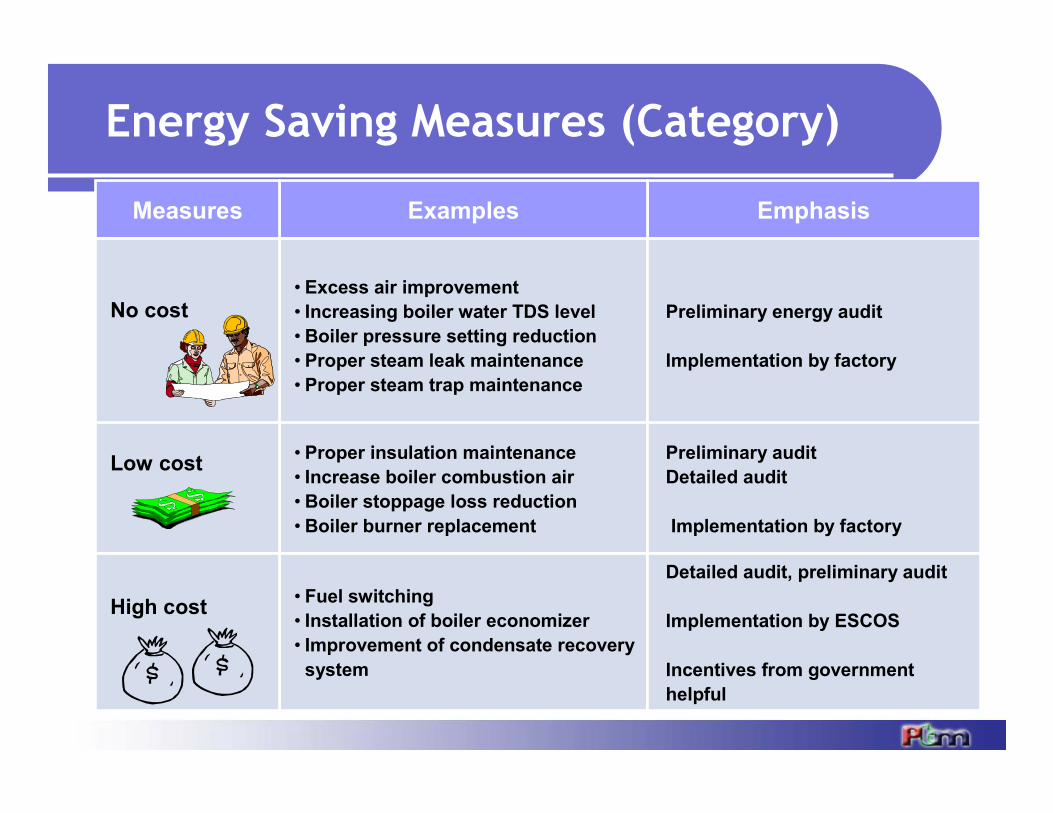
Energy Saving Measures (Category)
EmphasisExamplesMeasures
• Excess air improvement
• Increasing boiler water TDS level
• Boiler pressure setting reduction
• Proper steam leak maintenance
• Proper steam trap maintenance
Preliminary energy audit
Implementation by factory
No cost
• Proper insulation maintenance
• Increase boiler combustion air
• Boiler stoppage loss reduction
• Boiler burner replacement
Preliminary audit
Detailed audit
Implementation by factory
Low cost
• Fuel switching
• Installation of boiler economizer
• Improvement of condensate recovery
system
Detailed audit, preliminary audit
Implementation by ESCOS
Incentives from government
helpful
High cost
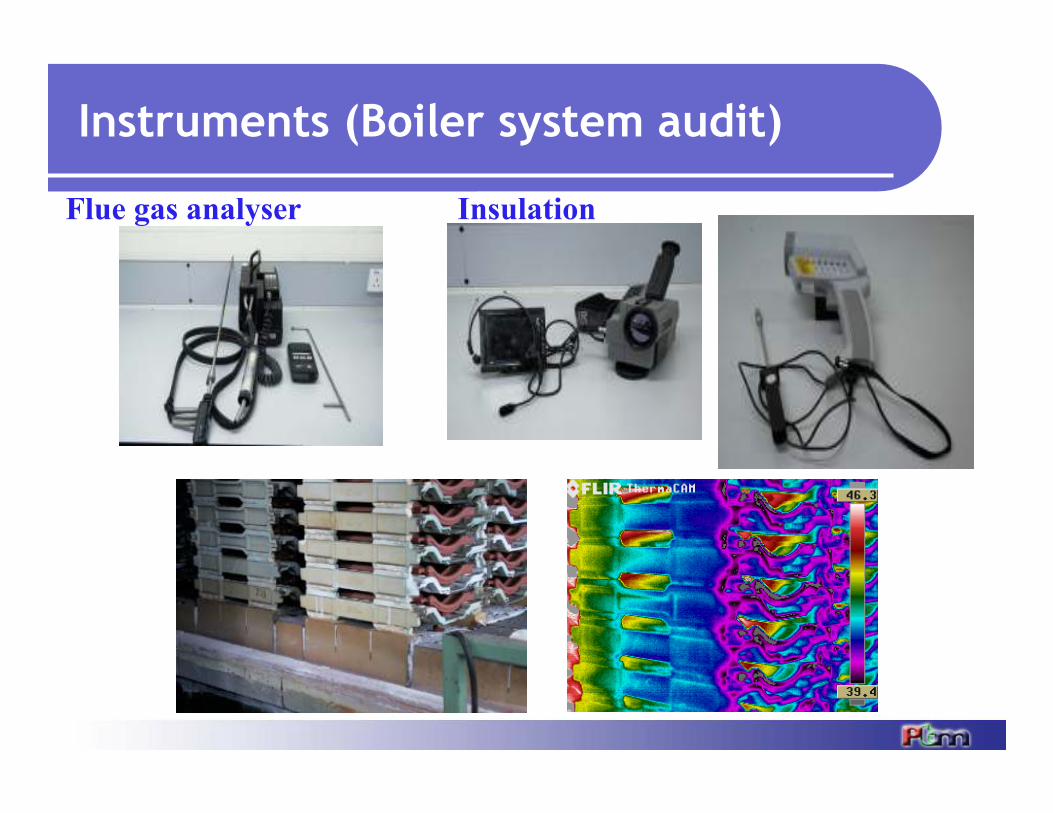
Instruments (Boiler system audit)
Flue gas analyser Insulation
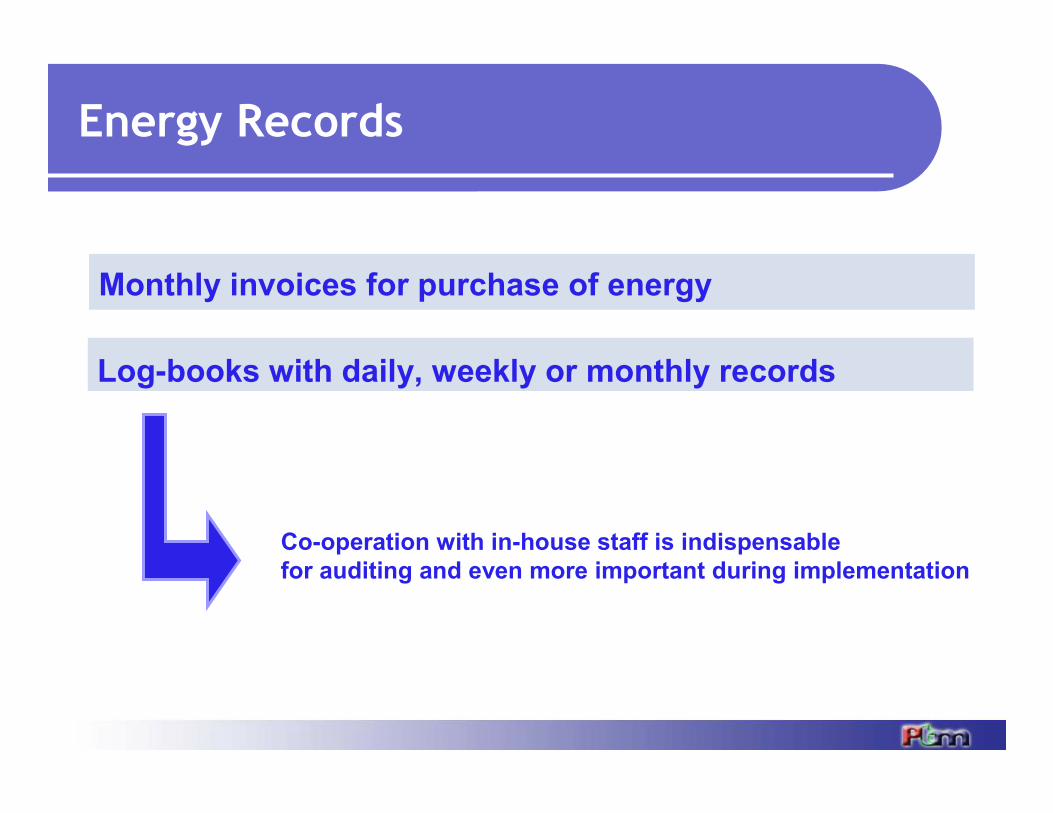
Energy Records
Co-operation with in-house staff is indispensablefor auditing and even more important during implementation
Monthly invoices for purchase of energy
Log-books with daily, weekly or monthly records
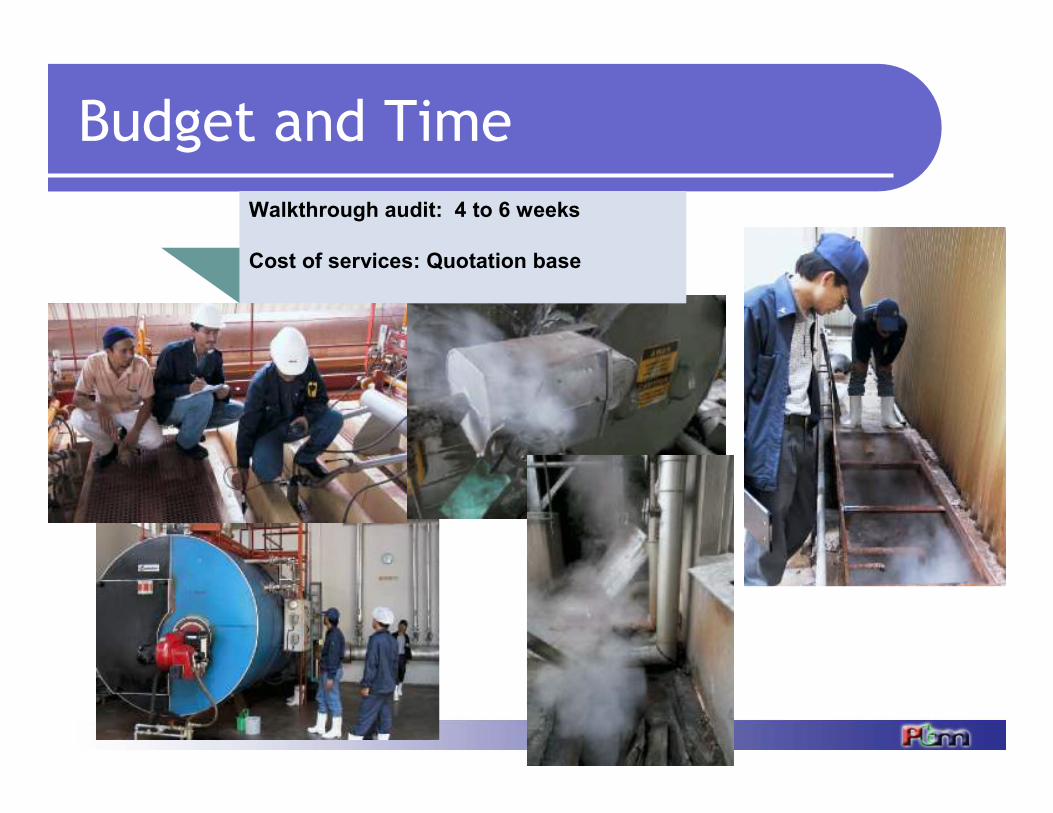
Budget and Time
Walkthrough audit: 4 to 6 weeks
Cost of services: Quotation base
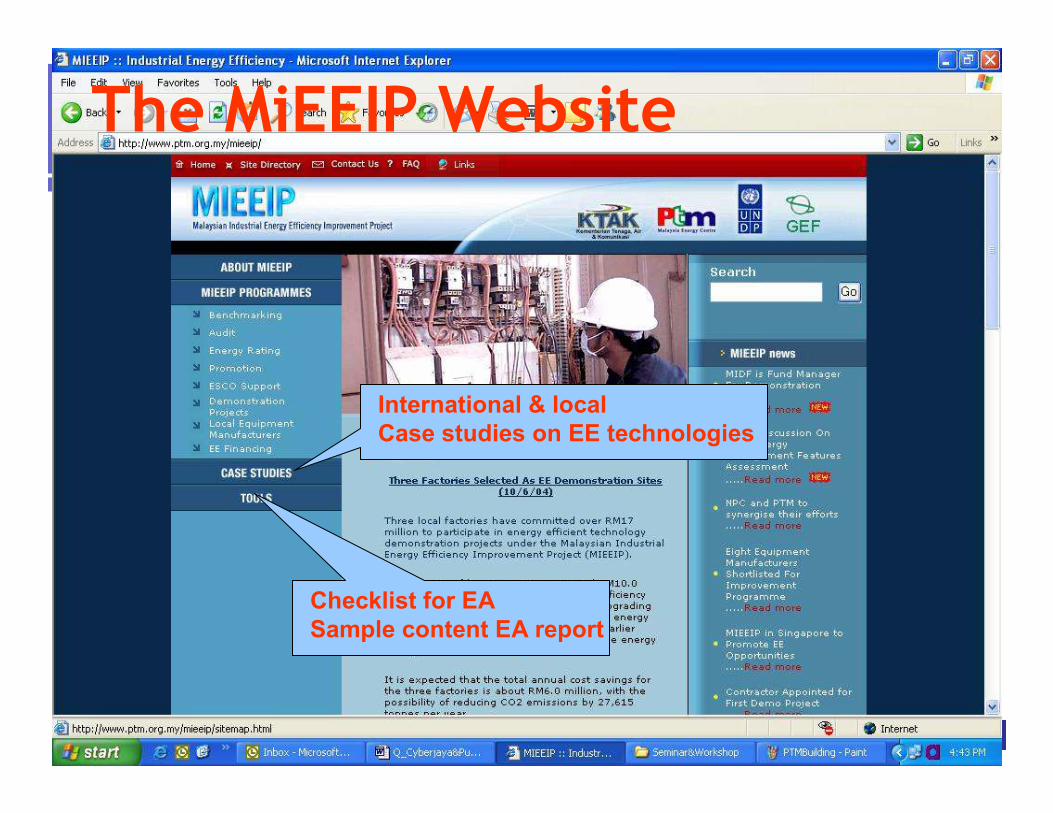
The MiEEIP Website
Checklist for EASample content EA report
International & localCase studies on EE technologies
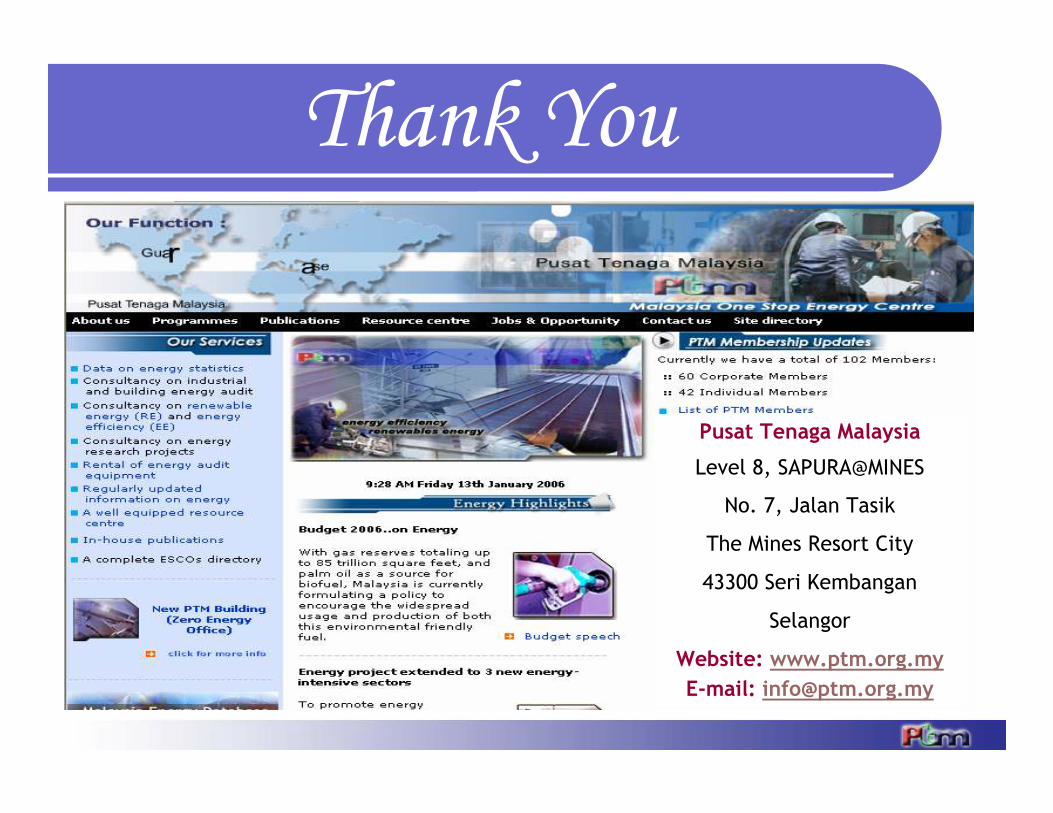
Pusat Tenaga Malaysia
Level 8, SAPURA@MINES
No. 7, Jalan Tasik
The Mines Resort City
43300 Seri Kembangan
Selangor
Website: www.ptm.org.my
E-mail: [email protected]
Thank You


![arXiv:1803.10916v1 [cs.SD] 29 Mar 2018 · We evaluated the proposed approach using real-world wake-up data collected from Mi AI Speaker1. The wake-up word is a four-syllable Mandarin](https://img.pdfslide.us/doc/110x75/5f84abf5cd54ec24183029d5/arxiv180310916v1-cssd-29-mar-2018-we-evaluated-the-proposed-approach-using.jpg)