Embed Size (px)
Citation preview
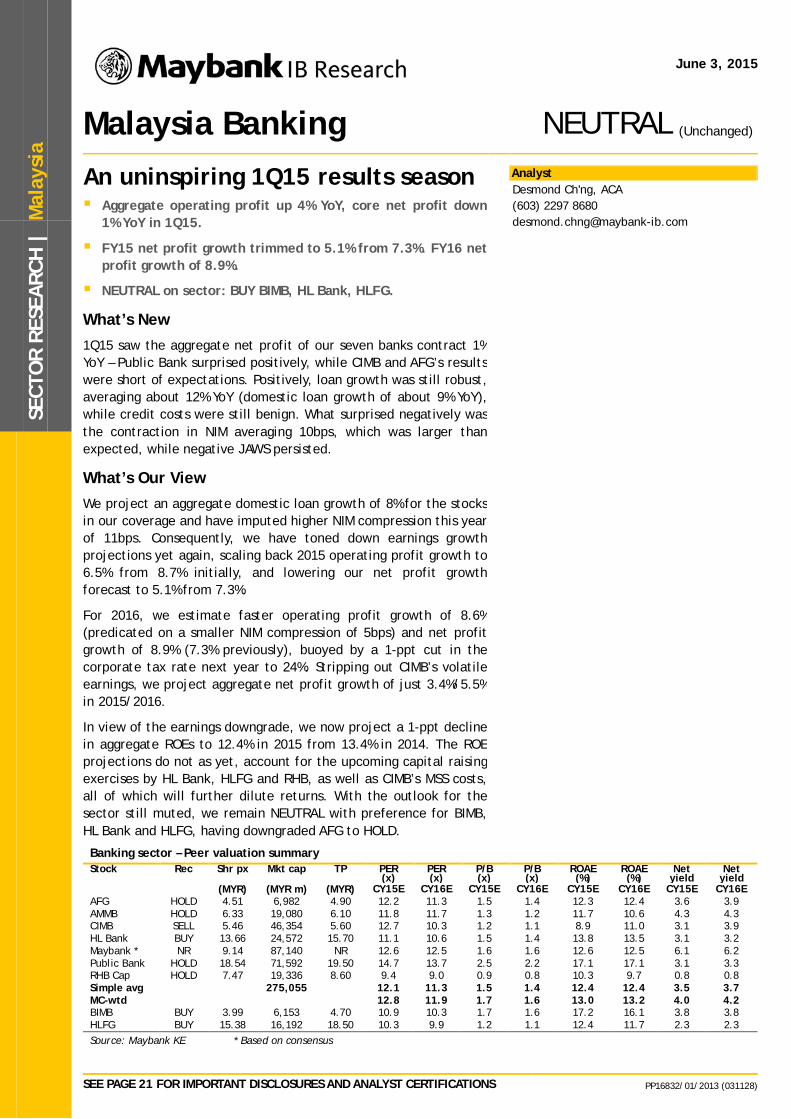
June 3, 2015
Mal
aysi
a SE
CTO
R RE
SEAR
CH |
SEE PAGE 21 FOR IMPORTANT DISCLOSURES AND ANALYST CERTIFICATIONS PP16832/01/2013 (031128)
Malaysia Banking
An uninspiring 1Q15 results season Aggregate operating profit up 4% YoY, core net profit down
1% YoY in 1Q15.
FY15 net profit growth trimmed to 5.1% from 7.3%. FY16 net profit growth of 8.9%.
NEUTRAL on sector: BUY BIMB, HL Bank, HLFG.
What’s New 1Q15 saw the aggregate net profit of our seven banks contract 1% YoY – Public Bank surprised positively, while CIMB and AFG’s results were short of expectations. Positively, loan growth was still robust, averaging about 12% YoY (domestic loan growth of about 9% YoY), while credit costs were still benign. What surprised negatively was the contraction in NIM averaging 10bps, which was larger than expected, while negative JAWS persisted.
What’s Our View We project an aggregate domestic loan growth of 8% for the stocks in our coverage and have imputed higher NIM compression this year of 11bps. Consequently, we have toned down earnings growth projections yet again, scaling back 2015 operating profit growth to 6.5% from 8.7% initially, and lowering our net profit growth forecast to 5.1% from 7.3%.
For 2016, we estimate faster operating profit growth of 8.6% (predicated on a smaller NIM compression of 5bps) and net profit growth of 8.9% (7.3% previously), buoyed by a 1-ppt cut in the corporate tax rate next year to 24%. Stripping out CIMB’s volatile earnings, we project aggregate net profit growth of just 3.4%/5.5% in 2015/2016.
In view of the earnings downgrade, we now project a 1-ppt decline in aggregate ROEs to 12.4% in 2015 from 13.4% in 2014. The ROE projections do not as yet, account for the upcoming capital raising exercises by HL Bank, HLFG and RHB, as well as CIMB’s MSS costs, all of which will further dilute returns. With the outlook for the sector still muted, we remain NEUTRAL with preference for BIMB, HL Bank and HLFG, having downgraded AFG to HOLD.
Analyst
Banking sector – Peer valuation summary Stock Rec Shr px Mkt cap TP PER
(x) PER (x)
P/B (x)
P/B (x)
ROAE (%)
ROAE (%)
Net yield
Net yield
(MYR) (MYR m) (MYR) CY15E CY16E CY15E CY16E CY15E CY16E CY15E CY16E AFG HOLD 4.51 6,982 4.90 12.2 11.3 1.5 1.4 12.3 12.4 3.6 3.9 AMMB HOLD 6.33 19,080 6.10 11.8 11.7 1.3 1.2 11.7 10.6 4.3 4.3 CIMB SELL 5.46 46,354 5.60 12.7 10.3 1.2 1.1 8.9 11.0 3.1 3.9 HL Bank BUY 13.66 24,572 15.70 11.1 10.6 1.5 1.4 13.8 13.5 3.1 3.2 Maybank * NR 9.14 87,140 NR 12.6 12.5 1.6 1.6 12.6 12.5 6.1 6.2 Public Bank HOLD 18.54 71,592 19.50 14.7 13.7 2.5 2.2 17.1 17.1 3.1 3.3 RHB Cap HOLD 7.47 19,336 8.60 9.4 9.0 0.9 0.8 10.3 9.7 0.8 0.8 Simple avg 275,055 12.1 11.3 1.5 1.4 12.4 12.4 3.5 3.7 MC-wtd 12.8 11.9 1.7 1.6 13.0 13.2 4.0 4.2 BIMB BUY 3.99 6,153 4.70 10.9 10.3 1.7 1.6 17.2 16.1 3.8 3.8 HLFG BUY 15.38 16,192 18.50 10.3 9.9 1.2 1.1 12.4 11.7 2.3 2.3 Source: Maybank KE * Based on consensus
(Unchanged)NEUTRAL
Desmond Ch'ng, ACA (603) 2297 8680 [email protected]

June 3, 2015 2
Malaysia Banking
1Q 2015 results round-up
An uninspiring start to the year
1Q15 was a good quarter for Public Bank, whose results surprised on the upside, but not so much for CIMB and AFG, whose results were below expectations. All in, it was an uninspiring quarter for the banking sector, which saw overall core net profit for the seven banks in our coverage slipping 1% YoY, due mainly to negative JAWS and higher credit costs during the period.
Our core net profit numbers compilation below strip out exceptional gains/costs in 1Q15 which included:
• A MYR202m restructuring cost at CIMB’s investment bank;
• A net gain of MYR62m at AMMB, principally relating to the sale of its stake in AmLife and AmTakaful;
• A net adjustment of MYR19m at AFG relating to an accounting adjustment on the income recognition of credit card transfers from upfront recognition to an amortization basis.
Cumulative core earnings for our banks (stripping out large exceptionals) Quarterly Cumulative
Year end: Dec (MYR'm) 1Q15 1Q14 YoY chg 4Q14 QoQ chg 3M15 3M14 YoY chg Interest income 17,481 15,734 11 17,473 0 17,481 15,734 11 Interest expense (9,011) (7,594) 19 (9,016) (0) (9,011) (7,594) 19 Net interest income 8,470 8,139 4 8,457 0 8,470 8,139 4 Islamic banking income 2,093 1,946 8 1,960 7 2,093 1,946 8 Non-interest income 4,263 3,841 11 4,516 (6) 4,263 3,841 11 Operating income 14,826 13,926 6 14,934 (1) 14,826 13,926 6 Operating expenses (7,312) (6,679) 9 (7,551) (3) (7,312) (6,679) 9 Operating profit 7,514 7,247 4 7,383 2 7,514 7,247 4 Loan loss allowance (860) (532) 62 (904) (5) (860) (532) 62 Other provisions 0 143 (100) (159) (100) 0 143 (100) Associate contributions 158 188 (16) 163 (3) 158 188 (16) Pretax profit 6,813 7,046 (3) 6,483 5 6,813 7,046 (3) Taxation (1,526) (1,704) (10) (1,315) 16 (1,526) (1,704) (10) Minority interest (69) (84) (19) (159) (57) (69) (84) (19) Net profit 5,219 5,257 (1) 5,010 4 5,219 5,257 (1) Recurring net profit 5,219 5,257 (1) 5,010 4 5,219 5,257 (1)
Sources: Companies, Maybank KE The table above sums up earnings for seven banks: Maybank, CIMB, Public Bank, HL Bank, RHB Capital, AMMB Holdings and Alliance Financial Group.
June 3, 2015 3
Malaysia Banking
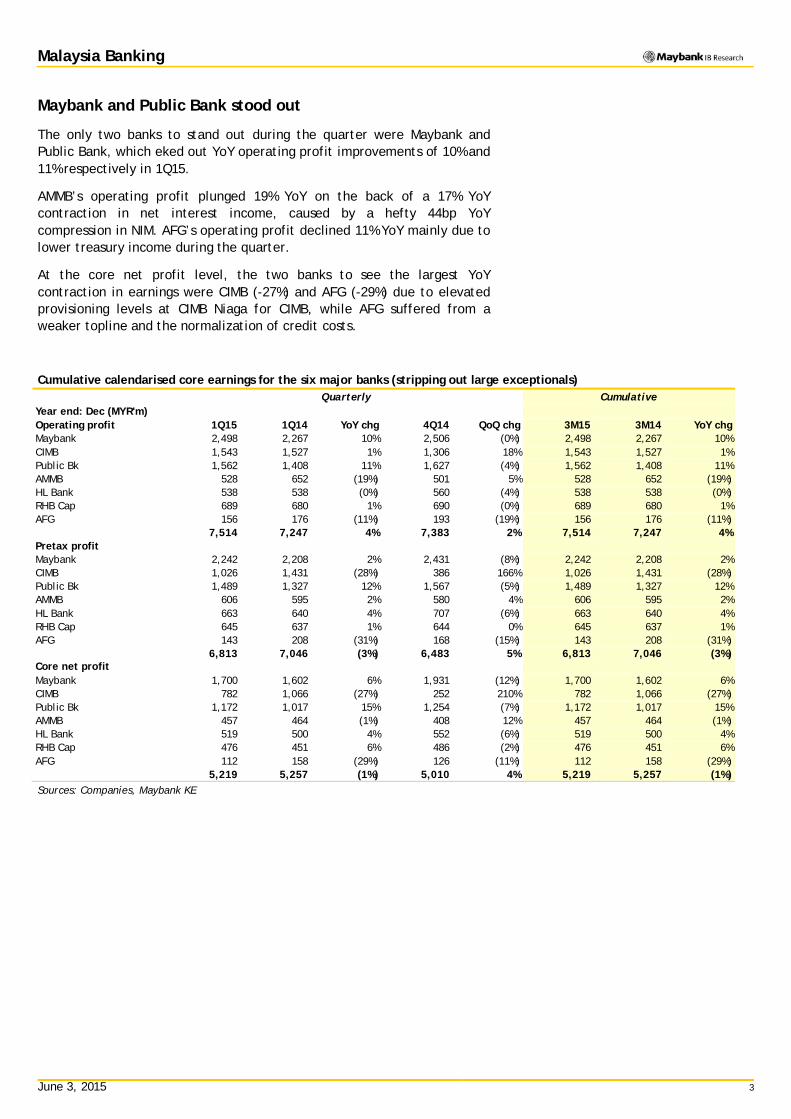
Maybank and Public Bank stood out
The only two banks to stand out during the quarter were Maybank and Public Bank, which eked out YoY operating profit improvements of 10% and 11% respectively in 1Q15.
AMMB’s operating profit plunged 19% YoY on the back of a 17% YoY contraction in net interest income, caused by a hefty 44bp YoY compression in NIM. AFG’s operating profit declined 11% YoY mainly due to lower treasury income during the quarter.
At the core net profit level, the two banks to see the largest YoY contraction in earnings were CIMB (-27%) and AFG (-29%) due to elevated provisioning levels at CIMB Niaga for CIMB, while AFG suffered from a weaker topline and the normalization of credit costs.
Cumulative calendarised core earnings for the six major banks (stripping out large exceptionals) Quarterly Cumulative
Year end: Dec (MYR'm) Operating profit 1Q15 1Q14 YoY chg 4Q14 QoQ chg 3M15 3M14 YoY chg Maybank 2,498 2,267 10% 2,506 (0%) 2,498 2,267 10% CIMB 1,543 1,527 1% 1,306 18% 1,543 1,527 1% Public Bk 1,562 1,408 11% 1,627 (4%) 1,562 1,408 11% AMMB 528 652 (19%) 501 5% 528 652 (19%) HL Bank 538 538 (0%) 560 (4%) 538 538 (0%) RHB Cap 689 680 1% 690 (0%) 689 680 1% AFG 156 176 (11%) 193 (19%) 156 176 (11%) 7,514 7,247 4% 7,383 2% 7,514 7,247 4% Pretax profit Maybank 2,242 2,208 2% 2,431 (8%) 2,242 2,208 2% CIMB 1,026 1,431 (28%) 386 166% 1,026 1,431 (28%) Public Bk 1,489 1,327 12% 1,567 (5%) 1,489 1,327 12% AMMB 606 595 2% 580 4% 606 595 2% HL Bank 663 640 4% 707 (6%) 663 640 4% RHB Cap 645 637 1% 644 0% 645 637 1% AFG 143 208 (31%) 168 (15%) 143 208 (31%) 6,813 7,046 (3%) 6,483 5% 6,813 7,046 (3%) Core net profit Maybank 1,700 1,602 6% 1,931 (12%) 1,700 1,602 6% CIMB 782 1,066 (27%) 252 210% 782 1,066 (27%) Public Bk 1,172 1,017 15% 1,254 (7%) 1,172 1,017 15% AMMB 457 464 (1%) 408 12% 457 464 (1%) HL Bank 519 500 4% 552 (6%) 519 500 4% RHB Cap 476 451 6% 486 (2%) 476 451 6% AFG 112 158 (29%) 126 (11%) 112 158 (29%) 5,219 5,257 (1%) 5,010 4% 5,219 5,257 (1%) Sources: Companies, Maybank KE

June 3, 2015 4
Malaysia Banking
Domestic loan growth moderated
Cumulative loan growth (including foreign loans) for the banks in our coverage expanded at a still robust rate of 12% YoY, with domestic loans increasing 9% YoY and foreign loans jumping 20% YoY, led in part by foreign currency translation gains.
The expansion in domestic loans was in line with the industry’s growth of 9% YoY end-Mar 2015, which was led by household (HH) loan growth of 9.8% YoY, tempered partly by slower non-HH loan growth of 8.5% Yoy. Latest Bank Negara statistics for April show a post-GST normalization of such growth, with industry loans expanding at a slower pace of 8.8% YoY as HH loan growth slowed to 9.4% and non-HH loan growth moderated to 8%.
A point to note, however, is that on an annualized basis, industry loan growth was a much slower 5% for the first four months of this year compared to the YoY growth of 9%.
AFG and Maybank reported the fastest loan growth of 14.7% and 14.2% YoY respectively. The former saw its commercial property loan portfolio jump 35% YoY, while auto financing grew a strong 28% YoY, albeit from a low base. Maybank’s loan growth was driven by its international business, which saw loans growth of 19% YoY, outpacing domestic loan growth of 10% YoY.
AMMB was the only bank to report a contraction in its loan book of 2%, due mainly to the contraction of its auto financing portfolio. Excluding auto finance, its retail loan book would have expanded 1.5% YoY instead of contracting 5.1% YoY.
Total loans – YoY growth 4Q13 1Q14 2Q14 3Q14 4Q14 1Q15 Maybank 13.7% 13.5% 12.6% 13.8% 13.3% 14.2%
CIMB 12.6% 11.9% 8.1% 9.3% 12.8% 12.5%
Public Bk 11.8% 11.3% 10.8% 10.2% 10.8% 11.7%
AMMB 6.1% 5.3% 1.5% 0.9% 0.7% -1.6%
HL Bank 8.2% 7.6% 7.2% 6.1% 6.7% 8.8%
RHB Cap 9.2% 11.2% 13.0% 12.0% 17.0% 13.7%
AFG 12.8% 14.1% 15.2% 14.9% 16.3% 14.7%
Total 11.5% 11.4% 10.1% 10.4% 11.7% 11.7% Source: Companies, Maybank KE
Domestic loans – YoY growth 4Q13 1Q14 2Q14 3Q14 4Q14 1Q15 Maybank 11.5% 9.6% 7.7% 8.4% 8.8% 10.1%
CIMB 12.4% 10.0% 7.4% 6.9% 7.7% 9.3%
Public Bk 12.0% 11.5% 11.2% 10.4% 10.5% 10.9%
AMMB 6.1% 5.3% 1.5% 0.9% 0.7% -1.6%
HL Bank 7.6% 7.1% 7.1% 6.1% 6.8% 8.9%
RHB Cap 5.1% 6.9% 8.6% 7.3% 14.3% 10.2%
AFG 12.8% 14.1% 15.2% 14.9% 16.3% 14.7%
Total 10.0% 9.2% 8.1% 7.7% 9.0% 9.1% Source: Companies, Maybank KE

June 3, 2015 5
Malaysia Banking
NIMs under much pressure
The pressure on margins accelerated in 1Q15, with average NIM dropping 10bps QoQ to 2.20% versus a 7bps QoQ decline in 4Q14. The largest compression was witnessed by AFG, whose NIM dropped 40bps QoQ, exacerbated by a one-off adjustment to credit card balance transfers from an upfront recognition to an amortization basis. On a normalized basis, its NIM contracted 10bps QoQ. CIMB saw the second largest QoQ NIM compression of 14bps, attributed mainly to funding cost pressures domestically.
The only bank to report a QoQ increase in NIM was Maybank, with a commendable 6bps improvement to 2.26%, due in large part to an improvement in funding mix, particularly in Malaysia, with the outflow of higher cost deposits during the quarter. Yields also improved QoQ in Singapore and Indonesia. YoY, AMMB reported the largest NIM contraction of 44bps due to various factors such as (i) the repositioning of its loan portfolio towards better quality loans, (ii) the mortgage book substitution effect which has seen the older, higher yielding mortgages replaced by lower yielding ones, (iii), the roll-off of the auto loan book and (iv) higher funding costs.
Net interest margins
1Q14 2Q14 3Q14 4Q14 1Q15 QoQ chg
Maybank 2.37% 2.35% 2.31% 2.20% 2.26% +0.06%
CIMB 2.85% 2.90% 2.82% 2.79% 2.65% -0.14%
Public Bk 2.28% 2.20% 2.29% 2.20% 2.15% -0.05%
AMMB 2.77% 2.45% 2.54% 2.38% 2.33% -0.05%
HL Bank 2.15% 2.09% 2.09% 2.04% 1.92% -0.12%
RHB Cap 2.33% 2.29% 2.29% 2.26% 2.22% -0.04%
AFG 2.17% 2.11% 2.27% 2.25% 1.85% -0.40%
Average 2.42% 2.34% 2.37% 2.30% 2.20% -0.10% Source: Companies, Maybank KE
On a quarterly basis, aggregate NIMs for the seven banks have declined from a high of 2.81% in 2Q10 to just 2.20% in 1Q15, this being a hefty 61bps compression, caused by both aggressive asset and liability competition, exacerbated by tightening liquidity in the banking system and ever-restrictive Basel III compliance requirements such as the Liquidity Coverage Ratio (LCR) and Net Stable Funding Ratio (NSFR).
Quarterly NIM (1Q09 – 1Q15)
Source: Companies, Maybank KE
2.00%
2.20%
2.40%
2.60%
2.80%
3.00%
1Q09 1Q10 1Q11 1Q12 1Q13 1Q14 1Q15

June 3, 2015 6
Malaysia Banking
Liquidity positions stable
Liquidity positions were stable QoQ with the average loan/deposit ratio (LDR) for the banks marginally lower at 89.0% end-Mar 2015 from 89.7% end-Dec 2014.
CIMB Niaga’s liquidity position improved QoQ as its LDR slipped to 95.8% end-Mar 2015 from 99.5% end-Dec 2014. Maybank’s domestic LDR rose to 91.5% from 89.5% end-Dec 2014, mainly due to the shedding of expensive deposits during the period, while the LDR for its Singapore operations also ticked up to 89.1% from 88.4%.
The balance sheets of AFG and HL Bank continue to be the most liquid with LDRs of 82% and 80% respectively end-Mar 2015.
Loans/customer deposits 1Q14 2Q14 3Q14 4Q14 1Q15 Maybank 91.0% 90.6% 90.6% 91.8% 92.2% CIMB 88.5% 87.5% 92.4% 91.5% 88.7% Public Bk 86.8% 87.1% 87.8% 88.0% 88.0% AMMB 97.2% 98.5% 99.3% 95.3% 93.5% HL Bank 78.4% 78.8% 79.1% 80.3% 80.1% RHB Cap 86.6% 87.1% 90.4% 89.5% 89.3% AFG 81.1% 82.9% 83.7% 85.1% 82.0% Average 88.1% 88.0% 89.6% 89.7% 89.0% Source: Companies, Maybank KE
Aggressive deposit campaigns
Customer deposits expanded at a decent pace of 11% YoY, more or less in line with loan growth.
It would appear, however, that the bulk of the deposits garnered during the quarter came mainly from business enterprises rather than from individuals, as reflected in the lower proportion of individual deposits to total deposits across our universe of banks, with the exception of Public Bank. This in itself is not entirely positive because of the very short-term nature of corporate deposits. Individual deposits rose 11% YoY while corporate deposits rose at a fast clip of 12% YoY.
HL Bank has the largest proportion of retail deposits to total deposits among its peers at 51% versus the industry’s 41%, while RHB Cap has the lowest at 27%.
Individual deposits as % of total deposits
1Q14 2Q14 3Q14 4Q14 1Q15 1Q15 vs
1Q14 Maybank 42.2% 41.4% 40.9% 41.0% 40.8% +9% CIMB 37.0% 35.8% 40.0% 39.6% 39.7% +20% Public Bk 44.6% 45.1% 44.8% 45.2% 45.8% +13% AMMB 38.5% 39.3% 40.7% 39.5% 38.8% +4% HL Bank 52.3% 51.2% 47.1% 51.4% 51.2% +5% RHB Cap 28.2% 26.9% 27.4% 27.3% 26.6% +4% AFG 44.8% 44.7% 42.6% 42.9% 40.1% +2% Average 40.9% 40.3% 40.6% 40.9% 40.8% +11% Source: Companies, Maybank KE

June 3, 2015 7
Malaysia Banking
Business enterprise deposits as % of total deposits
1Q14 2Q14 3Q14 4Q14 1Q15 1Q15 vs
1Q14 Maybank 45.1% 45.0% 44.6% 44.8% 45.0% +13% CIMB 40.3% 41.4% 37.4% 38.7% 39.5% +10% Public Bk 29.6% 29.8% 31.0% 30.4% 29.9% +11% AMMB 47.4% 45.7% 43.6% 45.2% 45.6% -1% HL Bank 42.2% 43.7% 44.9% 45.0% 44.9% +14% RHB Cap 58.9% 61.0% 60.9% 61.8% 62.2% +17% AFG 31.1% 31.9% 32.5% 31.5% 31.7% +16% Average 42.0% 42.6% 41.9% 42.3% 42.4% +12% Source: Companies, Maybank KE
CASA gathering efforts were mixed
Against deposit growth of 11% YoY, CASA expanded at a pace of just 9% YoY. The two banks to see double-digit CASA growth were Maybank and AFG. AFG, in particular, continues to benefit from its growing exposure to the SME sector, which has provided it with a large pool of low-cost deposits. Even so, AFG’s fixed deposits rose at a faster pace to CASA growth, resulting in a lower CASA ratio of just 33.6% end-Mar 2015 versus 34.8% end-Dec 2014, and this contributed to further pressure on NIMs. CIMB and AMMB were the other two banks to see a QoQ decline in their CASA ratios.
CASA as % of total deposits
1Q14 2Q14 3Q14 4Q14 1Q15 1Q15 vs
1Q14 Maybank 35.8% 35.7% 34.5% 35.2% 35.4% +12% CIMB 35.5% 34.7% 35.4% 35.1% 34.4% +9% Public Bk 25.5% 25.2% 25.0% 25.0% 25.0% +8% AMMB 20.9% 21.6% 20.1% 20.5% 20.3% 0% HL Bank 26.0% 26.2% 26.2% 25.7% 25.8% +6% RHB Cap 23.5% 23.3% 22.6% 21.7% 22.3% +5% AFG 34.0% 34.7% 35.2% 34.8% 33.6% +13% Average 30.4% 30.2% 29.8% 29.9% 29.8% +9% Source: Companies, Maybank KE
Fee income expanded 11% YoY
1Q15 fee income expanded at a commendable pace of 11% YoY, led by HL Bank (+287% YoY - check), Maybank (+19%) and Public Bank (+15%). AMMB and RHB Cap saw a YoY contraction in fee income. RHB Cap and Maybank currently have the largest proportion of fee income to total income at 21% and 19% respectively, while AFG and CIMB have the lowest at 13% and 14%.
Fee income as % of total income
1Q14 2Q14 3Q14 4Q14 1Q15 1Q15 vs
1Q14 Maybank 17.7% 20.1% 21.1% 21.0% 18.8% +19% CIMB 14.2% 13.3% 12.9% 13.9% 14.4% +6% Public Bk 15.6% 16.5% 15.8% 15.8% 16.3% +15% AMMB 16.3% 15.4% 14.9% 15.8% 15.7% -9% HL Bank 12.0% 14.2% 14.2% 16.3% 14.8% 28% RHB Cap 21.9% 20.7% 23.1% 27.0% 20.9% -2% AFG 11.7% 13.9% 17.1% 13.0% 13.0% -5% Average 16.3% 17.0% 17.5% 18.3% 16.9% +11% Source: Companies, Maybank KE

June 3, 2015 8
Malaysia Banking
Other NOII rose 12% YoY
Other non-interest income (other NOII) expanded YoY across most of the banks, mainly as a function of higher investment and forex profit gains during the quarter. On a QoQ basis, other NOII was relatively flat.
Other non-interest income as % of total income
1Q14 2Q14 3Q14 4Q14 1Q15 1Q15 vs
1Q14 Maybank 10.1% 8.1% 6.0% 15.1% 10.3% 14% CIMB 17.0% 12.3% 15.5% 12.2% 16.1% -2% Public Bk 6.4% 6.1% 5.6% 6.4% 6.9% 18% AMMB 10.8% 18.3% 19.4% 14.6% 18.4% 61% HL Bank 5.0% 8.2% 4.4% 3.9% 8.7% 81% RHB Cap 11.7% 9.4% 14.2% 13.0% 12.7% 12% AFG 14.0% 10.8% 6.2% 9.3% 5.8% -61% Average 11.3% 9.8% 10.1% 11.9% 11.8% 12% Source: Companies, Maybank KE
Negative JAWS during the period
Operating expenses rose 10% YoY. With the exception of Public Bank, all other banks reported negative JAWS during the period, with operating expenses expanding at a faster rate than operating income. Maybank saw the largest (+15% YoY) cost increase during the period, mainly because of higher union collective agreements as well as one-off marketing expenses.
Public Bank continues to lead the industry in terms of cost efficiencies, with a cost/income ratio (CIR) of just 31%, with its closest competitor, HL Bank, coming in at 46%. CIMB and RHB continue to have the highest cost structures in the industry with CIRs of 58% and 54% respectively in 1Q15.
Cost as % of total income
1Q14 2Q14 3Q14 4Q14 1Q15 1Q15 vs
1Q14 Maybank 48.9% 46.6% 50.3% 50.7% 49.9% +15% CIMB 56.8% 58.9% 57.6% 63.2% 58.1% +6% Public Bk 31.8% 31.7% 28.9% 28.1% 31.0% +7% AMMB 42.5% 49.8% 44.2% 49.8% 50.7% +13% HL Bank 43.3% 46.4% 42.3% 45.3% 45.6% +10% RHB Cap 53.6% 55.2% 51.1% 58.9% 54.3% +4% AFG 48.4% 44.9% 44.8% 44.7% 51.8% +2% Average 48.0% 48.5% 47.7% 50.6% 49.3% +10% Source: Companies, Maybank KE
Benign credit environment
Absolute NPLs ticked up 1% QoQ and increased QoQ for CIMB and RHB Capital. The former saw higher NPLs at CIMB Niaga while RHB Capital reported the impairment of three SME loans during the quarter. Maybank’s domestic NPL ratio trended down QoQ but its Singapore NPL ratio rose to 0.3% from 0.23% on the back of two corporate accounts from business banking that were impaired, while BII’s NPL ratio rose to 3.49% from 3.24%. On a cumulative basis, gross NPL ratios were relatively stable QoQ, trending marginally lower to 1.68%.

June 3, 2015 9
Malaysia Banking
Gross NPL ratios
1Q14 2Q14 3Q14 4Q14 1Q15
Maybank 1.52% 1.50% 1.65% 1.52% 1.50%
CIMB 3.07% 3.12% 3.28% 3.09% 3.18%
Public Bk 0.66% 0.65% 0.65% 0.61% 0.56%
AMMB 1.86% 1.87% 1.79% 1.88% 1.79%
HL Bank 1.24% 1.18% 1.15% 0.98% 0.89%
RHB Cap 2.54% 2.45% 2.29% 2.03% 2.03%
AFG 1.38% 1.36% 1.20% 1.14% 1.03%
Average 1.78% 1.76% 1.81% 1.70% 1.68% Source: Companies, Maybank KE
Credit costs still very benign
Credit costs were still very benign - AMMB and HL Bank continued to see net recoveries during the quarter. Maybank and RHB Cap were the only two banks to see a QoQ increase in credit costs while the largest improvement was reported by CIMB, which saw its credit cost come off in the absence of a domestic legacy loan provision and marginally lower provisions at CIMB Niaga against its coal loans exposure.
Credit charges 1Q14 2Q14 3Q14 4Q14 1Q15
Maybank 0.23% 0.17% 0.07% -0.03% 0.24%
CIMB 0.19% 0.24% 0.56% 1.43% 0.80%
Public Bk 0.15% 0.11% 0.08% 0.10% 0.12%
AMMB 0.29% 0.37% 0.02% -0.26% -0.27%
HL Bank 0.10% 0.09% -0.06% -0.20% -0.02%
RHB Cap 0.17% 0.05% 0.28% 0.12% 0.14%
AFG -0.22% 0.02% -0.08% 0.31% 0.19%
Average 0.18% 0.16% 0.18% 0.29% 0.26% Source: Companies, Maybank KE
Loan loss coverage stable QoQ
Loan loss coverage (LLC) averaged 90% end-Mar 2015, stable QoQ. LLC slipped QoQ for Maybank to 93% but would have been a higher 97.9% including regulatory reserves. HL Bank and Public Bank have the highest LLC in the industry at 128% while RHB Cap’s LLC remains low at just 61%.
Loan loss coverage
1Q14 2Q14 3Q14 4Q14 1Q15
Maybank 107% 108% 95% 96% 93%
CIMB 84% 79% 74% 83% 84%
Public Bk 119% 118% 117% 122% 128%
AMMB 127% 121% 118% 106% 105%
HL Bank 129% 129% 129% 130% 128%
RHB Cap 68% 67% 67% 61% 61%
AFG 93% 90% 89% 94% 103%
Average 97% 94% 88% 90% 90% Source: Companies, Maybank KE

June 3, 2015 10
Malaysia Banking
Asset leverage has improved over time
From an average asset/equity ratio of 15x in 1Q09, banks have deleveraged to just about 11.6x today. With the exception of CIMB and Public Bank, the asset leverage ratio of the other banks slipped lower QoQ and AMMB continues to be the least leveraged at 9.3x (Public Bank the highest at 12.5x).
Asset/equity ratios
1Q14 2Q14 3Q14 4Q14 1Q15
Maybank 12.0 11.9 12.2 12.1 11.9
CIMB 10.7 10.8 10.7 11.1 11.4
Public Bk 15.2 15.0 12.3 12.3 12.5
AMMB 10.1 9.0 9.0 9.4 9.3
HL Bank 11.9 11.7 11.8 11.6 11.5
RHB Cap 11.5 11.6 11.4 11.7 11.6
AFG 11.5 12.1 11.7 11.8 11.8
Average 11.9 11.8 11.5 11.6 11.6 Source: Companies, Maybank KE
Capital raising still in the pipeline
Capital positions are comfortable but not great relatively to regional peers, averaging about 10-11% across the financial groups. AMMB revealed its fully loaded CET1 ratio at the group level for the very first time, and its was 9.8%, marginally above our estimate of 9.2%.
HL Bank’s CET1 ratio is presently the lowest at 8.7% (group) and 7.7% (commercial bank) respectively. Nevertheless, its capital raising is in the pipeline and the objective, we believe is to raise its CET1 ratio to about 11%. HLFG will also have to raise equity to subscribe to its portion (a 64% stake) of HL Bank’s rights issue. RHB is also looking to raise capital this year, also to about 11%. All three capital raising exercises are still pending approval from Bank Negara.
Fully loaded CET1 ratios (estimated) Group estimate Commercial bank Maybank 10.6% 9.4% CIMB 10.0% 11.6% Public Bk 10.4% 10.0% AMMB 9.8% 10.0% HL Bank 8.7% 7.7% RHB Cap 9.8% 10.8% AFG 11.1% 11.1%
Source: Companies, Maybank KE
June 3, 2015 11
Malaysia Banking
Looking ahead…
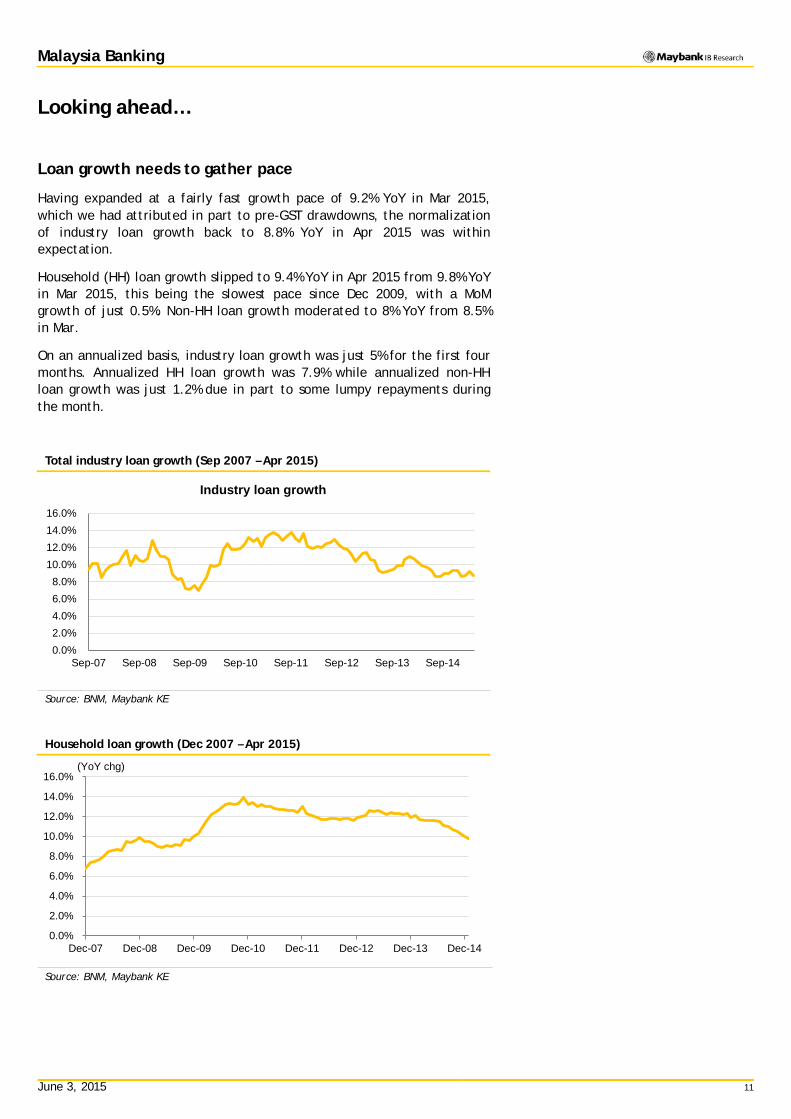
Loan growth needs to gather pace
Having expanded at a fairly fast growth pace of 9.2% YoY in Mar 2015, which we had attributed in part to pre-GST drawdowns, the normalization of industry loan growth back to 8.8% YoY in Apr 2015 was within expectation.
Household (HH) loan growth slipped to 9.4% YoY in Apr 2015 from 9.8% YoY in Mar 2015, this being the slowest pace since Dec 2009, with a MoM growth of just 0.5%. Non-HH loan growth moderated to 8% YoY from 8.5% in Mar.
On an annualized basis, industry loan growth was just 5% for the first four months. Annualized HH loan growth was 7.9% while annualized non-HH loan growth was just 1.2% due in part to some lumpy repayments during the month.
Total industry loan growth (Sep 2007 – Apr 2015)
Source: BNM, Maybank KE
Household loan growth (Dec 2007 – Apr 2015)
Source: BNM, Maybank KE
0.0%2.0%4.0%6.0%8.0%
10.0%12.0%14.0%16.0%
Sep-07 Sep-08 Sep-09 Sep-10 Sep-11 Sep-12 Sep-13 Sep-14
Industry loan growth
0.0%
2.0%
4.0%
6.0%
8.0%
10.0%
12.0%
14.0%
16.0%
Dec-07 Dec-08 Dec-09 Dec-10 Dec-11 Dec-12 Dec-13 Dec-14
(YoY chg)

June 3, 2015 12
Malaysia Banking
We maintain our 2015 industry loan growth forecast of 7.8%, predicated on a moderation in HH loan growth to 8.4% in 2015 from 9.9% in 2014 and non-HH loan growth of 7.0% YoY (2014: 8.5%). Against the annualized loan growth rate of just 5% in the first four months, our expectations therefore are for a pick-up in corporate lending in 2H to meet our targets.
Faster overseas loan growth
Since the last reporting period, loan growth for the seven banks below has been slightly faster than expected, due in part to stronger growth in overseas lending (aided also by forex translation gains). As such, we now expect aggregate loans growth in 2015 to be marginally faster at 9.6% versus our previous estimate of 9.2%. Domestic loan growth estimates are relatively unchanged at +8.2% YoY vs +8.1% previously.
Gross loan growth estimates (annualised) 2012 2013 2014 2015F 2016F
Maybank 12.9% 13.7% 13.3% 9.7% 9.5%
CIMB 8.9% 12.6% 12.8% 11.4% 9.8%
Public Bk 11.3% 11.8% 10.8% 10.8% 9.1%
AMMB 8.7% 6.2% 0.0% 2.5% 3.6%
HL Bank 7.6% 7.2% 7.7% 7.9% 7.4%
RHB Cap 14.4% 9.2% 17.0% 9.6% 9.1%
AFG 12.5% 13.8% 14.5% 9.7% 8.0%
Average 11.1% 11.5% 11.7% 9.6% 8.9% Source: Companies, Maybank KE
Gross domestic loan growth estimates (annualised) 2012 2013 2014 2015F 2016F
Maybank 13.2% 11.5% 8.8% 8.2% 7.8%
CIMB 5.7% 12.0% 8.1% 8.1% 7.7%
Public Bk 12.5% 12.0% 10.5% 9.8% 9.2%
AMMB 8.7% 6.2% 0.0% 2.5% 3.6%
HL Bank 7.2% 6.8% 7.5% 7.7% 7.2%
RHB Cap 12.7% 5.1% 14.3% 9.2% 8.6%
AFG 12.5% 13.8% 14.5% 9.7% 8.0%
Average 10.6% 9.9% 9.0% 8.2% 7.8% Source: Companies, Maybank KE
Total industry loan growth Industry Household Non-HH 2011 13.6% 13.0% 14.3% 2012 10.4% 11.4% 9.1% 2013 10.6% 12.4% 8.4% 2014 9.3% 9.9% 8.5% 2015E 7.8% 8.4% 7.0% 2016E 7.0% 7.1% 6.8%
Source: BNM, Maybank KE

June 3, 2015 13
Malaysia Banking
NIM compressions expected to be larger than expected
NIM compression has been more severe than expected and banks have been guiding for a larger NIM contraction this year. Much of the contraction stems from high funding costs, which in turn, has been attributed to banks restructuring their deposit portfolios in favour of more retail deposits to meet the LCR requirements. Moreover, there has been greater emphasis on stickier fixed deposits to ensure sufficient liquidity over a longer period.
At 86.6% end-Apr 2015, the prevailing industry LDR is stable and liquidity is ample. Nevertheless, we remain vigilant over the slowing pace of deposit growth, which could further fuel competitive pressures.
Loan/deposit ratio (Mar 2009 – Apr 2015)
Source: BNM, Maybank KE
Total deposit vs CASA growth (Sep 2010 – Apr 2015)
Source: BNM, Maybank KE
77.0
79.0
81.0
83.0
85.0
87.0
89.0
Mar-09 Mar-10 Mar-11 Mar-12 Mar-13 Mar-14 Mar-15
0.0%
2.0%
4.0%
6.0%
8.0%
10.0%
12.0%
14.0%
16.0%
18.0%
Sep-10 Mar-11 Sep-11 Mar-12 Sep-12 Mar-13 Sep-13 Mar-14 Sep-14 Mar-15
YoY chg
Growth in total deposits Growth in CASA
June 3, 2015 14
Malaysia Banking
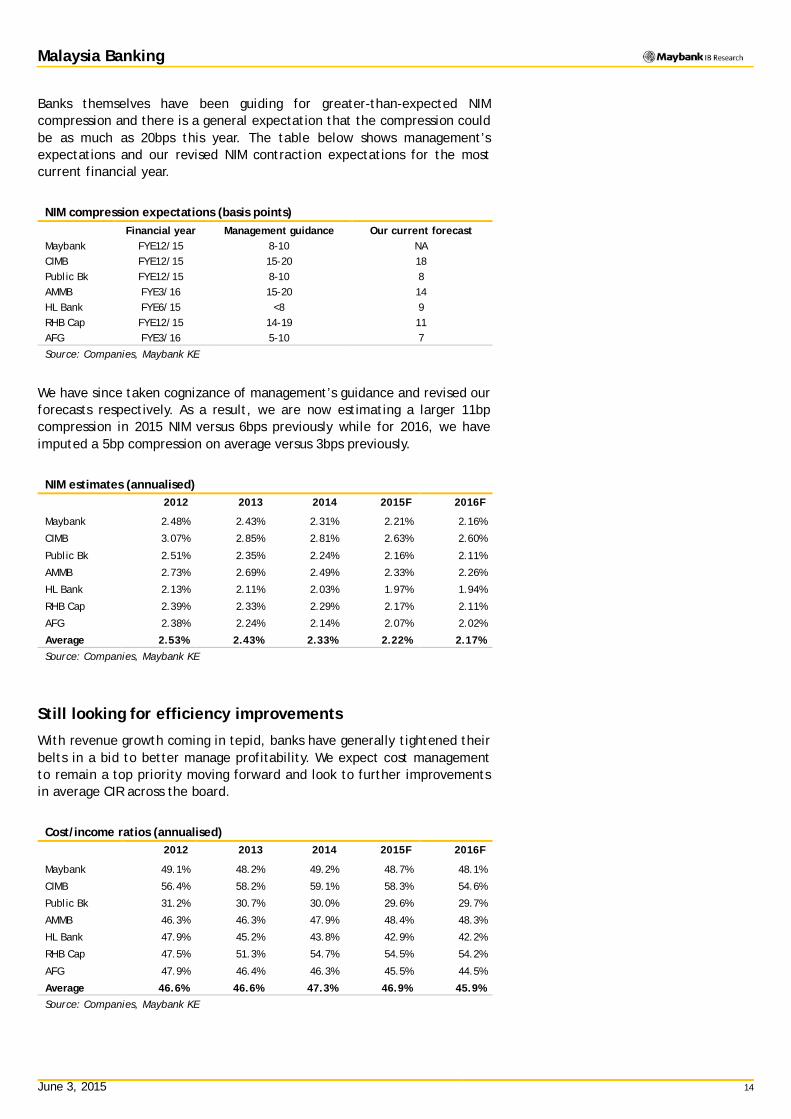
Banks themselves have been guiding for greater-than-expected NIM compression and there is a general expectation that the compression could be as much as 20bps this year. The table below shows management’s expectations and our revised NIM contraction expectations for the most current financial year.
NIM compression expectations (basis points) Financial year Management guidance Our current forecast Maybank FYE12/15 8-10 NA CIMB FYE12/15 15-20 18 Public Bk FYE12/15 8-10 8 AMMB FYE3/16 15-20 14 HL Bank FYE6/15 <8 9 RHB Cap FYE12/15 14-19 11 AFG FYE3/16 5-10 7
Source: Companies, Maybank KE
We have since taken cognizance of management’s guidance and revised our forecasts respectively. As a result, we are now estimating a larger 11bp compression in 2015 NIM versus 6bps previously while for 2016, we have imputed a 5bp compression on average versus 3bps previously.
NIM estimates (annualised) 2012 2013 2014 2015F 2016F
Maybank 2.48% 2.43% 2.31% 2.21% 2.16%
CIMB 3.07% 2.85% 2.81% 2.63% 2.60%
Public Bk 2.51% 2.35% 2.24% 2.16% 2.11%
AMMB 2.73% 2.69% 2.49% 2.33% 2.26%
HL Bank 2.13% 2.11% 2.03% 1.97% 1.94%
RHB Cap 2.39% 2.33% 2.29% 2.17% 2.11%
AFG 2.38% 2.24% 2.14% 2.07% 2.02%
Average 2.53% 2.43% 2.33% 2.22% 2.17% Source: Companies, Maybank KE
Still looking for efficiency improvements
With revenue growth coming in tepid, banks have generally tightened their belts in a bid to better manage profitability. We expect cost management to remain a top priority moving forward and look to further improvements in average CIR across the board.
Cost/income ratios (annualised) 2012 2013 2014 2015F 2016F
Maybank 49.1% 48.2% 49.2% 48.7% 48.1%
CIMB 56.4% 58.2% 59.1% 58.3% 54.6%
Public Bk 31.2% 30.7% 30.0% 29.6% 29.7%
AMMB 46.3% 46.3% 47.9% 48.4% 48.3%
HL Bank 47.9% 45.2% 43.8% 42.9% 42.2%
RHB Cap 47.5% 51.3% 54.7% 54.5% 54.2%
AFG 47.9% 46.4% 46.3% 45.5% 44.5%
Average 46.6% 46.6% 47.3% 46.9% 45.9% Source: Companies, Maybank KE
June 3, 2015 15
Malaysia Banking
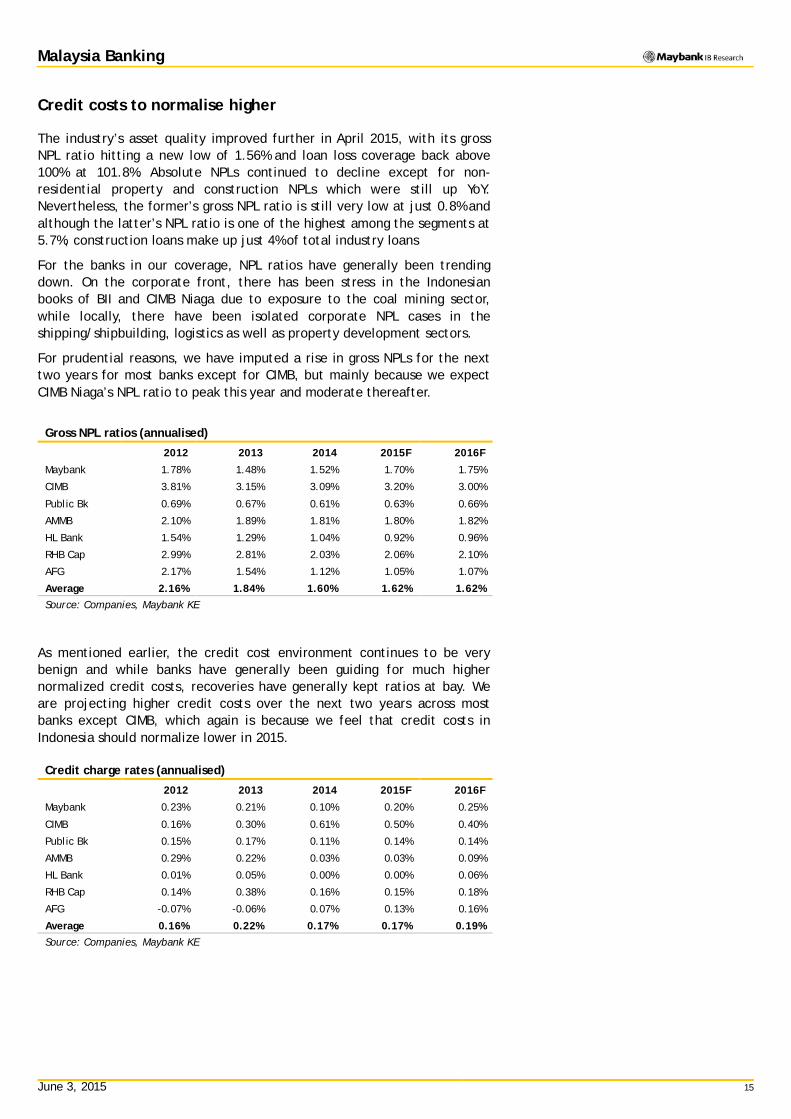
Credit costs to normalise higher
The industry’s asset quality improved further in April 2015, with its gross NPL ratio hitting a new low of 1.56% and loan loss coverage back above 100% at 101.8%. Absolute NPLs continued to decline except for non-residential property and construction NPLs which were still up YoY. Nevertheless, the former’s gross NPL ratio is still very low at just 0.8% and although the latter’s NPL ratio is one of the highest among the segments at 5.7%, construction loans make up just 4% of total industry loans
For the banks in our coverage, NPL ratios have generally been trending down. On the corporate front, there has been stress in the Indonesian books of BII and CIMB Niaga due to exposure to the coal mining sector, while locally, there have been isolated corporate NPL cases in the shipping/shipbuilding, logistics as well as property development sectors.
For prudential reasons, we have imputed a rise in gross NPLs for the next two years for most banks except for CIMB, but mainly because we expect CIMB Niaga’s NPL ratio to peak this year and moderate thereafter.
Gross NPL ratios (annualised)
2012 2013 2014 2015F 2016F
Maybank 1.78% 1.48% 1.52% 1.70% 1.75%
CIMB 3.81% 3.15% 3.09% 3.20% 3.00%
Public Bk 0.69% 0.67% 0.61% 0.63% 0.66%
AMMB 2.10% 1.89% 1.81% 1.80% 1.82%
HL Bank 1.54% 1.29% 1.04% 0.92% 0.96%
RHB Cap 2.99% 2.81% 2.03% 2.06% 2.10%
AFG 2.17% 1.54% 1.12% 1.05% 1.07%
Average 2.16% 1.84% 1.60% 1.62% 1.62% Source: Companies, Maybank KE
As mentioned earlier, the credit cost environment continues to be very benign and while banks have generally been guiding for much higher normalized credit costs, recoveries have generally kept ratios at bay. We are projecting higher credit costs over the next two years across most banks except CIMB, which again is because we feel that credit costs in Indonesia should normalize lower in 2015.
Credit charge rates (annualised)
2012 2013 2014 2015F 2016F
Maybank 0.23% 0.21% 0.10% 0.20% 0.25%
CIMB 0.16% 0.30% 0.61% 0.50% 0.40%
Public Bk 0.15% 0.17% 0.11% 0.14% 0.14%
AMMB 0.29% 0.22% 0.03% 0.03% 0.09%
HL Bank 0.01% 0.05% 0.00% 0.00% 0.06%
RHB Cap 0.14% 0.38% 0.16% 0.15% 0.18%
AFG -0.07% -0.06% 0.07% 0.13% 0.16%
Average 0.16% 0.22% 0.17% 0.17% 0.19% Source: Companies, Maybank KE

June 3, 2015 16
Malaysia Banking
Capital raising in the pipeline
Capital raising is one of the themes for 2015, with RHB, HL Bank and HLFG coming to the market for equity injections.
HL Bank: By our estimates, HL Bank’s CET1 ratio was just 7.7% at the commercial bank level end-Mar 2015. Assuming a minimum of 11%, we estimate that HL Bank would have to raise about MYR2.7b, which at a 20% discount to current share price, would translate to a 1-for-7 rights issue. This would lower its FY16 ROE to about 12.0% from 13.6% presently.
HL Financial Group: HLFG will likely have to raise funds to subscribe to its 64% stake in HL Bank’s fund raising ie about MYR1.7b. However, given that HLFG is a financial holding company and not a financial entity per se, we feel that it does not need to raise this entire amount in equity and could perhaps settle for a 70:30 equity:debt ratio. This implies that it would have to raise equity of just about MYR1.2b. Assuming a 20% discount to current share price, this would translate to a 1-for-11 rights issue.
RHB Capital: The group’s CET1 ratio was 9.8% end-Mar 2015 but recall that RHB plans to raise up to MYR2.5b via an estimated 1-for-6 rights issue that will take the ratio up to 11%. It has also proposed an internal group restructuring that will see RHB Bank assuming the listing status of RHB Capital. We see a positive enhancement to ROEs by about 1-ppt from this restructuring and an improvement to the group’s CET1 ratio to 11%. The flip side is that the equity raising and the restructuring are dilutive on EPS and its book value.

June 3, 2015 17
Malaysia Banking
Growth projections lowered further
In light of the larger-than-expected compression in NIM that we are expecting, we have toned down earnings growth projections yet again. Against an initial 2015 operating profit growth forecast of 8.7%, we have scaled back to 6.5%, principally on the back of the larger NIM compression. Correspondingly, our net profit growth forecast has now been lowered to 5.1% from 7.3%.
For 2016, we project faster operating profit growth of 8.6% amid lower NIM compression, and net profit growth of 8.9% (previously 7.3%), buoyed by a 1-ppt cut in the corporate tax rate next year to 24%.
A point to note is that the average growth rate for the stocks in our coverage has somewhat been distorted by our projections for CIMB, for which we have imputed (i) lower credit costs in FY15 and FY16 relative to FY14, as well as (ii) cost savings from its internal restructuring of MYR300m for FY16 and MYR500m for FY17. To this end, we project CIMB’s net profit growth in FY15/16/17 to be robust at 14%/24%/14% respectively.
Stripping CIMB out of the equation, we are projecting industry net profit growth of just 3.4%/5.5%/5.4% in 2015/2016/2017.
Projected growth: GDP vs banks’ operating & net profit growth estimates (YoY chg)
2013 2014 2015 2016
(% YoY) GDP Op
profit Net
profit GDP Op
profit Net
profit GDP Op
profit Net
profit GDP Op
profit Net
profit 1Q15 4.7 8.4 6.3 6.0 0.2 -0.3 4.9 6.5 5.1 Na 8.6 8.9 4Q14 4.7 8.4 6.3 6.0 0.2 -0.3 4.5 8.7 7.3 na 7.7 7.3 3Q14 4.7 8.4 6.3 5.9 0.9 1.9 5.2 10.5 8.0 Na 7.7 7.0 2Q14 4.7 8.4 6.3 6.0 2.9 5.0 5.0 12.0 9.1 1Q14 4.7 8.4 6.3 5.4 6.1 7.6 4Q13 4.7 8.4 6.3 5.0 10.3 9.6 3Q13 4.5 7.5 5.1 5.0 10.4 9.8 2Q13 4.5 8.1 6.6 5.2 12.5 8.8 1Q13 5.3 10.4 8.4 4Q12 5.3 10.6 8.7 3Q12 4.8 9.9 8.5 2Q12 5.1 10.5 8.6 1Q12 5.1 10.6 9.3 Source: Maybank KE
June 3, 2015 18
Malaysia Banking
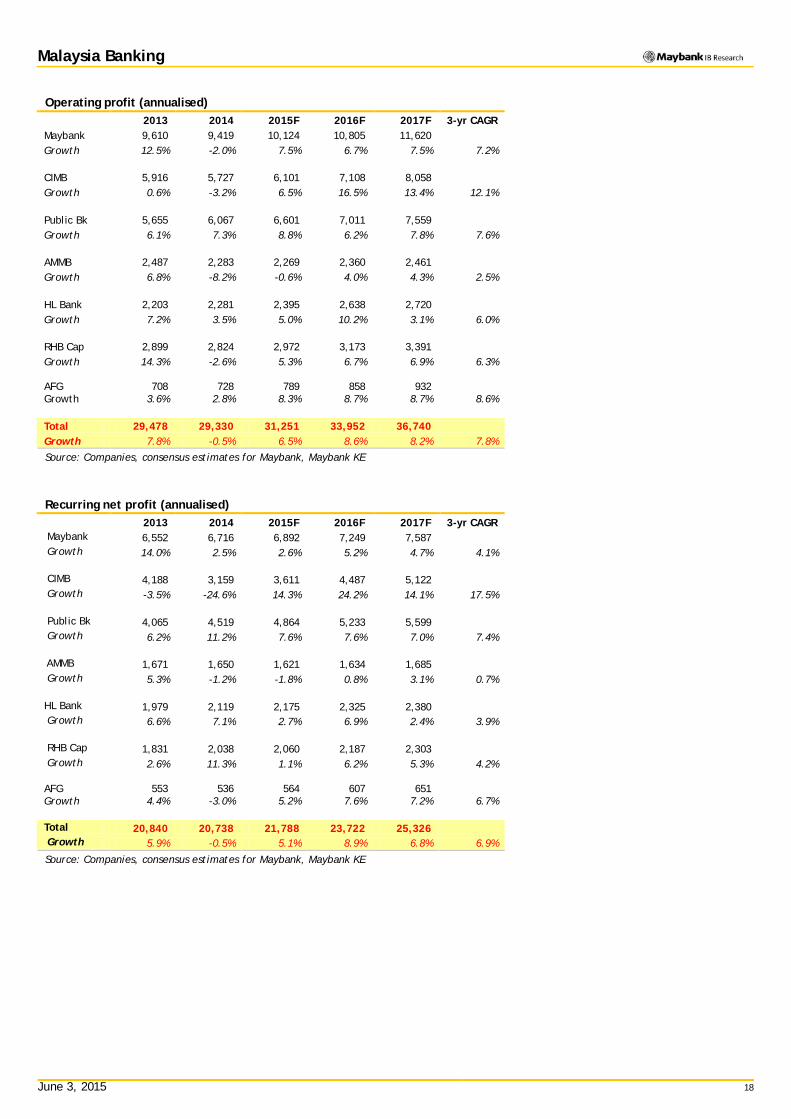
Operating profit (annualised) 2013 2014 2015F 2016F 2017F 3-yr CAGR
Maybank 9,610 9,419 10,124 10,805 11,620 Growth 12.5% -2.0% 7.5% 6.7% 7.5% 7.2% CIMB 5,916 5,727 6,101 7,108 8,058 Growth 0.6% -3.2% 6.5% 16.5% 13.4% 12.1% Public Bk 5,655 6,067 6,601 7,011 7,559 Growth 6.1% 7.3% 8.8% 6.2% 7.8% 7.6% AMMB 2,487 2,283 2,269 2,360 2,461 Growth 6.8% -8.2% -0.6% 4.0% 4.3% 2.5% HL Bank 2,203 2,281 2,395 2,638 2,720 Growth 7.2% 3.5% 5.0% 10.2% 3.1% 6.0% RHB Cap 2,899 2,824 2,972 3,173 3,391 Growth 14.3% -2.6% 5.3% 6.7% 6.9% 6.3% AFG 708 728 789 858 932 Growth 3.6% 2.8% 8.3% 8.7% 8.7% 8.6% Total 29,478 29,330 31,251 33,952 36,740 Growth 7.8% -0.5% 6.5% 8.6% 8.2% 7.8%
Source: Companies, consensus estimates for Maybank, Maybank KE
Recurring net profit (annualised) 2013 2014 2015F 2016F 2017F 3-yr CAGR
Maybank 6,552 6,716 6,892 7,249 7,587 Growth 14.0% 2.5% 2.6% 5.2% 4.7% 4.1% CIMB 4,188 3,159 3,611 4,487 5,122 Growth -3.5% -24.6% 14.3% 24.2% 14.1% 17.5% Public Bk 4,065 4,519 4,864 5,233 5,599 Growth 6.2% 11.2% 7.6% 7.6% 7.0% 7.4% AMMB 1,671 1,650 1,621 1,634 1,685 Growth 5.3% -1.2% -1.8% 0.8% 3.1% 0.7% HL Bank 1,979 2,119 2,175 2,325 2,380 Growth 6.6% 7.1% 2.7% 6.9% 2.4% 3.9% RHB Cap 1,831 2,038 2,060 2,187 2,303 Growth 2.6% 11.3% 1.1% 6.2% 5.3% 4.2% AFG 553 536 564 607 651 Growth 4.4% -3.0% 5.2% 7.6% 7.2% 6.7% Total 20,840 20,738 21,788 23,722 25,326 Growth 5.9% -0.5% 5.1% 8.9% 6.8% 6.9%
Source: Companies, consensus estimates for Maybank, Maybank KE

June 3, 2015 19
Malaysia Banking
ROEs are still trending down
AMMB has set a new ROE target of 12-12.5% for FY3/16, which is more realistic relative to the 14.5-15.5% target that it had set a year earlier. Even so, we still expect the group to fall short of expectations and forecast a lower ROE of 11%.
AFG, meanwhile, introduced its ROE target of 12-13% for FYE3/16. This compares against its actual ROE of 13.4% for FY15, and our ROE forecast of 12.3% for FY16.
We expect CIMB and RHB to fall short of their ROE targets this year. A point to note is that in the case of CIMB, our FY15 ROE does not yet account for its upcoming mutual separation scheme (MSS) expenses.
ROE guidance (%)
Management guidance Forward ROE
(our estimates) Maybank FYE12/15 13-14% na CIMB FYE12/15 11% 9.5% Public Bk FYE12/15 >16% 17.1% AMMB FYE3/16 12-12.5% 11.0% HL Bank FYE6/15 >14% 14.1% RHB Cap FYE12/15 >11.5% 10.3% AFG FYE3/16 12-13% 12.3%
Source: Companies, Maybank KE * Based on consensus
In view of the recent earnings downgrade, we have trimmed our 2015 aggregate ROE forecast to 12.4% from 12.8% previously, dropping 1-ppt from 13.4% in 2014. A point to note is that this does not yet take into consideration further dilution from capital raising exercises at HL Bank and RHB, nor the MSS cost at CIMB.
ROAE forecasts (calendarized) 2012 2013 2014 2015F 2016F
Maybank 15.9% 14.9% 13.6% 12.6% 12.5%
CIMB 16.0% 15.5% 9.2% 8.9%# 11.0%
Public Bk 22.7% 21.1% 18.7% 17.1% 17.1%
AMMB 14.0% 14.1% 14.0% 11.7% 10.6%
HL Bank 16.6% 15.1% 14.7% 13.8% 13.5%
RHB Cap 13.4% 11.5% 11.5% 10.3% 9.7%
AFG 13.9% 13.8% 12.6% 12.3% 12.4%
Average 16.1% 15.1% 13.4% 12.4% 12.4% Source: Companies, Maybank KE # After stripping out exceptionals
ROAA forecasts (calendarized) 2012 2013 2014 2015F 2016F
Maybank 1.2% 1.2% 1.1% 1.0% 1.0%
CIMB 1.4% 1.3% 0.8% 0.8% 1.0%
Public Bk 1.5% 1.4% 1.4% 1.3% 1.3%
AMMB 1.3% 1.4% 1.4% 1.2% 1.1%
HL Bank 1.2% 1.2% 1.2% 1.2% 1.2%
RHB Cap 1.0% 1.0% 1.0% 0.9% 0.9%
AFG 1.3% 1.2% 1.1% 1.0% 1.0%
Average 1.3% 1.2% 1.2% 1.1% 1.1% Source: Companies, Maybank KE

June 3, 2015 20
Malaysia Banking
Research Offices
REGIONAL
Sadiq CURRIMBHOY Regional Head, Research & Economics (65) 6231 5836 [email protected]
WONG Chew Hann, CA Regional Head of Institutional Research (603) 2297 8686 [email protected]
ONG Seng Yeow Regional Head of Retail Research (65) 6432 1453 [email protected]
ECONOMICS
Suhaimi ILIAS Chief Economist Singapore | Malaysia (603) 2297 8682 [email protected]
Luz LORENZO Philippines (63) 2 849 8836 [email protected]
Tim LEELAHAPHAN Thailand (66) 2658 6300 ext 1420 [email protected]
JUNIMAN Chief Economist, BII Indonesia (62) 21 29228888 ext 29682 [email protected]
STRATEGY
Sadiq CURRIMBHOY Global Strategist (65) 6231 5836 [email protected]
Willie CHAN Hong Kong / Regional (852) 2268 0631 [email protected]
MALAYSIA
WONG Chew Hann, CA Head of Research (603) 2297 8686 [email protected] • Strategy
Desmond CH’NG, ACA (603) 2297 8680 [email protected] • Banking & Finance
LIAW Thong Jung (603) 2297 8688 [email protected] • Oil & Gas Services- Regional
ONG Chee Ting, CA (603) 2297 8678 [email protected] • Plantations - Regional
Mohshin AZIZ (603) 2297 8692 [email protected] • Aviation - Regional • Petrochem
YIN Shao Yang, CPA (603) 2297 8916 [email protected] • Gaming – Regional • Media
TAN Chi Wei, CFA (603) 2297 8690 [email protected] • Power • Telcos
WONG Wei Sum, CFA (603) 2297 8679 [email protected] • Property
LEE Yen Ling (603) 2297 8691 [email protected] • Building Materials • Glove • Ports • Shipping
CHAI Li Shin, CFA (603) 2297 8684 [email protected] • Plantation • Construction & Infrastructure
Ivan YAP (603) 2297 8612 [email protected] • Automotive • Semiconductor • Technology
Kevin WONG (603) 2082 6824 [email protected] • REITs • Consumer Discretionary
LIEW Wei Han (603) 2297 8676 [email protected] • Consumer Staples
LEE Cheng Hooi Regional Chartist (603) 2297 8694 [email protected]
Tee Sze Chiah Head of Retail Research (603) 2297 6858 [email protected]
HONG KONG / CHINA
Howard WONG Head of Research (852) 2268 0648 [email protected] • Oil & Gas - Regional
Alexander LATZER (852) 2268 0647 [email protected] • Metals & Mining – Regional
Benjamin HO (852) 2268 0632 [email protected] • Consumer & Auto
Jacqueline KO, CFA (852) 2268 0633 [email protected] • Consumer Staples & Durables
Jessica NG (852) 2268 0678 [email protected] • Utilities & Renewable Energy
Ka Leong LO, CFA (852) 2268 0630 [email protected] • Consumer Discretionary & Auto
Mitchell KIM (852) 2268 0634 [email protected] • Internet & Telcos
Osbert TANG, CFA (86) 21 5096 8370 [email protected] • Transport & Industrials
Ricky WK NG, CFA (852) 2268 0689 [email protected] • Utilities & Renewable Energy
Steven ST CHAN (852) 2268 0645 [email protected] • Banking & Financials - Regional
Warren LAU (852) 2268 0644 [email protected] • Technology – Regional
INDIA
Jigar SHAH Head of Research (91) 22 6632 2632 [email protected] • Oil & Gas • Automobile • Cement
Anubhav GUPTA (91) 22 6623 2605 [email protected] • Metal & Mining • Capital Goods • Property
Vishal MODI (91) 22 6623 2607 [email protected] • Banking & Financials
Abhijeet KUNDU (91) 22 6623 2628 [email protected] • Consumer
Neerav DALAL (91) 22 6623 2606 [email protected] • Software Technology • Telcos
Ritesh POLADIA (91) 22 6623 2612 [email protected] • Media & Entertainment
SINGAPORE
NG Wee Siang Head of Research (65) 6231 5838 [email protected] • Banking & Finance
Gregory YAP (65) 6231 5848 [email protected] • SMID Caps • Technology & Manufacturing • Telcos
YEAK Chee Keong, CFA (65) 6231 5842 [email protected] • Offshore & Marine
Derrick HENG, CFA (65) 6231 5843 [email protected] • Transport • Property • REITs (Office)
Joshua TAN (65) 6231 5850 [email protected] • REITs (Retail, Industrial)
WEI Bin (65) 6231 5844 [email protected] • Commodity • Logistics • S-chips
John CHEONG (65) 6231 5845 [email protected] • Small & Mid Caps • Healthcare
TRUONG Thanh Hang (65) 6231 5847 [email protected] • Small & Mid Caps
INDONESIA
Isnaputra ISKANDAR Head of Research (62) 21 2557 1129 [email protected] • Strategy • Metals & Mining • Cement
Rahmi MARINA (62) 21 2557 1128 [email protected] • Banking & Finance
Aurellia SETIABUDI (62) 21 2953 0785 [email protected] • Property
Pandu ANUGRAH (62) 21 2557 1137 [email protected] • Infra • Construction • Transport• Telcos
Janni ASMAN (62) 21 2953 0784 [email protected] • Cigarette • Healthcare • Retail
Adhi TASMIN (62) 21 2557 1209 [email protected] • Plantations
PHILIPPINES
Luz LORENZO Head of Research (63) 2 849 8836 [email protected] • Strategy • Utilities • Conglomerates • Telcos
Lovell SARREAL (63) 2 849 8841 [email protected] • Consumer • Media • Cement
Rommel RODRIGO (63) 2 849 8839 [email protected] • Conglomerates • Property • Gaming • Ports/ Logistics
Katherine TAN (63) 2 849 8843 [email protected] • Banks • Construction
Ramon ADVIENTO (63) 2 849 8845 [email protected] • Mining
Michael BENGSON (63) 2 849 8840 [email protected] • Conglomerates
Jaclyn JIMENEZ (63) 2 849 8842 [email protected] • Consumer
Arabelle MAGHIRANG (63) 2 849 8838 [email protected] • Banks
THAILAND
Maria LAPIZ Head of Institutional Research Dir (66) 2257 0250 | (66) 2658 6300 ext 1399 [email protected] • Consumer • Materials • Ind. Estates
Sittichai DUANGRATTANACHAYA (66) 2658 6300 ext 1393 [email protected] • Services Sector • Transport
Sukit UDOMSIRIKUL Head of Retail Research (66) 2658 6300 ext 5090 [email protected]
Mayuree CHOWVIKRAN (66) 2658 6300 ext 1440 [email protected] • Strategy
Padon VANNARAT (66) 2658 6300 ext 1450 [email protected] • Strategy
Surachai PRAMUALCHAROENKIT (66) 2658 6300 ext 1470 [email protected] • Auto • Conmat • Contractor • Steel
Suttatip PEERASUB (66) 2658 6300 ext 1430 [email protected] • Media • Commerce
Sutthichai KUMWORACHAI (66) 2658 6300 ext 1400 [email protected] • Energy • Petrochem
Termporn TANTIVIVAT (66) 2658 6300 ext 1520 [email protected] • Property
Jaroonpan WATTANAWONG (66) 2658 6300 ext 1404 [email protected] • Transportation • Small cap
Chatchai JINDARAT (66) 2658 6300 ext 1401 [email protected] • Electronics VIETNAM
NGUYEN Thi Ngan Tuyen, Head of Retail Research (84) 8 44 555 888 x 8081 [email protected] • Food & Beverage • Oil&Gas • Banking
TRINH Thi Ngoc Diep (84) 4 44 555 888 x 8208 [email protected] • Technology • Utilities • Construction
PHAM Nhat Bich (84) 8 44 555 888 x 8083 [email protected] • Consumer • Manufacturing • Fishery
NGUYEN Thi Sony Tra Mi (84) 8 44 555 888 x 8084 [email protected] • Port operation • Pharmaceutical • Food & Beverage
June 3, 2015 21
Malaysia Banking
APPENDIX I: TERMS FOR PROVISION OF REPORT, DISCLAIMERS AND DISCLOSURES
DISCLAIMERS
This research report is prepared for general circulation and for information purposes only and under no circumstances should it be considered or intended as an offer to sell or a solicitation of an offer to buy the securities referred to herein. Investors should note that values of such securities, if any, may fluctuate and that each security’s price or value may rise or fall. Opinions or recommendations contained herein are in form of technical ratings and fundamental ratings. Technical ratings may differ from fundamental ratings as technical valuations apply different methodologies and are purely based on price and volume-related information extracted from the relevant jurisdiction’s stock exchange in the equity analysis. Accordingly, investors’ returns may be less than the original sum invested. Past performance is not necessarily a guide to future performance. This report is not intended to provide personal investment advice and does not take into account the specific investment objectives, the financial situation and the particular needs of persons who may receive or read this report. Investors should therefore seek financial, legal and other advice regarding the appropriateness of investing in any securities or the investment strategies discussed or recommended in this report.
The information contained herein has been obtained from sources believed to be reliable but such sources have not been independently verified by Maybank Investment Bank Berhad, its subsidiary and affiliates (collectively, “MKE”) and consequently no representation is made as to the accuracy or completeness of this report by MKE and it should not be relied upon as such. Accordingly, MKE and its officers, directors, associates, connected parties and/or employees (collectively, “Representatives”) shall not be liable for any direct, indirect or consequential losses or damages that may arise from the use or reliance of this report. Any information, opinions or recommendations contained herein are subject to change at any time, without prior notice.
This report may contain forward looking statements which are often but not always identified by the use of words such as “anticipate”, “believe”, “estimate”, “intend”, “plan”, “expect”, “forecast”, “predict” and “project” and statements that an event or result “may”, “will”, “can”, “should”, “could” or “might” occur or be achieved and other similar expressions. Such forward looking statements are based on assumptions made and information currently available to us and are subject to certain risks and uncertainties that could cause the actual results to differ materially from those expressed in any forward looking statements. Readers are cautioned not to place undue relevance on these forward-looking statements. MKE expressly disclaims any obligation to update or revise any such forward looking statements to reflect new information, events or circumstances after the date of this publication or to reflect the occurrence of unanticipated events.
MKE and its officers, directors and employees, including persons involved in the preparation or issuance of this report, may, to the extent permitted by law, from time to time participate or invest in financing transactions with the issuer(s) of the securities mentioned in this report, perform services for or solicit business from such issuers, and/or have a position or holding, or other material interest, or effect transactions, in such securities or options thereon, or other investments related thereto. In addition, it may make markets in the securities mentioned in the material presented in this report. MKE may, to the extent permitted by law, act upon or use the information presented herein, or the research or analysis on which they are based, before the material is published. One or more directors, officers and/or employees of MKE may be a director of the issuers of the securities mentioned in this report.
This report is prepared for the use of MKE’s clients and may not be reproduced, altered in any way, transmitted to, copied or distributed to any other party in whole or in part in any form or manner without the prior express written consent of MKE and MKE and its Representatives accepts no liability whatsoever for the actions of third parties in this respect.
This report is not directed to or intended for distribution to or use by any person or entity who is a citizen or resident of or located in any locality, state, country or other jurisdiction where such distribution, publication, availability or use would be contrary to law or regulation. This report is for distribution only under such circumstances as may be permitted by applicable law. The securities described herein may not be eligible for sale in all jurisdictions or to certain categories of investors. Without prejudice to the foregoing, the reader is to note that additional disclaimers, warnings or qualifications may apply based on geographical location of the person or entity receiving this report.
Malaysia
Opinions or recommendations contained herein are in the form of technical ratings and fundamental ratings. Technical ratings may differ from fundamental ratings as technical valuations apply different methodologies and are purely based on price and volume-related information extracted from Bursa Malaysia Securities Berhad in the equity analysis.
Singapore
This report has been produced as of the date hereof and the information herein may be subject to change. Maybank Kim Eng Research Pte. Ltd. (“Maybank KERPL”) in Singapore has no obligation to update such information for any recipient. For distribution in Singapore, recipients of this report are to contact Maybank KERPL in Singapore in respect of any matters arising from, or in connection with, this report. If the recipient of this report is not an accredited investor, expert investor or institutional investor (as defined under Section 4A of the Singapore Securities and Futures Act), Maybank KERPL shall be legally liable for the contents of this report, with such liability being limited to the extent (if any) as permitted by law.
Thailand
The disclosure of the survey result of the Thai Institute of Directors Association (“IOD”) regarding corporate governance is made pursuant to the policy of the Office of the Securities and Exchange Commission. The survey of the IOD is based on the information of a company listed on the Stock Exchange of Thailand and the market for Alternative Investment disclosed to the public and able to be accessed by a general public investor. The result, therefore, is from the perspective of a third party. It is not an evaluation of operation and is not based on inside information. The survey result is as of the date appearing in the Corporate Governance Report of Thai Listed Companies. As a result, the survey may be changed after that date. Maybank Kim Eng Securities (Thailand) Public Company Limited (“MBKET”) does not confirm nor certify the accuracy of such survey result.
Except as specifically permitted, no part of this presentation may be reproduced or distributed in any manner without the prior written permission of MBKET. MBKET accepts no liability whatsoever for the actions of third parties in this respect.
US
This research report prepared by MKE is distributed in the United States (“US”) to Major US Institutional Investors (as defined in Rule 15a-6 under the Securities Exchange Act of 1934, as amended) only by Maybank Kim Eng Securities USA Inc (“Maybank KESUSA”), a broker-dealer registered in the US (registered under Section 15 of the Securities Exchange Act of 1934, as amended). All responsibility for the distribution of this report by Maybank KESUSA in the US shall be borne by Maybank KESUSA. All resulting transactions by a US person or entity should be effected through a registered broker-dealer in the US. This report is not directed at you if MKE is prohibited or restricted by any legislation or regulation in any jurisdiction from making it available to you. You should satisfy yourself before reading it that Maybank KESUSA is permitted to provide research material concerning investments to you under relevant legislation and regulations.
UK
This document is being distributed by Maybank Kim Eng Securities (London) Ltd (“Maybank KESL”) which is authorized and regulated, by the Financial Services Authority and is for Informational Purposes only. This document is not intended for distribution to anyone defined as a Retail Client under the Financial Services and Markets Act 2000 within the UK. Any inclusion of a third party link is for the recipients convenience only, and that the firm does not take any responsibility for its comments or accuracy, and that access to such links is at the individuals own risk. Nothing in this report should be considered as constituting legal, accounting or tax advice, and that for accurate guidance recipients should consult with their own independent tax advisers.
June 3, 2015 22
Malaysia Banking
Disclosure of Interest Malaysia: MKE and its Representatives may from time to time have positions or be materially interested in the securities referred to herein and may further act as market maker or may have assumed an underwriting commitment or deal with such securities and may also perform or seek to perform investment banking services, advisory and other services for or relating to those companies.
Singapore: As of 8 January 2014, Maybank KERPL and the covering analyst do not have any interest in any companies recommended in this research report.
Thailand: MBKET may have a business relationship with or may possibly be an issuer of derivative warrants on the securities /companies mentioned in the research report. Therefore, Investors should exercise their own judgment before making any investment decisions. MBKET, its associates, directors, connected parties and/or employees may from time to time have interests and/or underwriting commitments in the securities mentioned in this report.
Hong Kong: KESHK may have financial interests in relation to an issuer or a new listing applicant referred to as defined by the requirements under Paragraph 16.5(a) of the Hong Kong Code of Conduct for Persons Licensed by or Registered with the Securities and Futures Commission.
As of 8 January 2014, KESHK and the authoring analyst do not have any interest in any companies recommended in this research report.
MKE may have, within the last three years, served as manager or co-manager of a public offering of securities for, or currently may make a primary market in issues of, any or all of the entities mentioned in this report or may be providing, or have provided within the previous 12 months, significant advice or investment services in relation to the investment concerned or a related investment and may receive compensation for the services provided from the companies covered in this report.
OTHERS Analyst Certification of Independence
The views expressed in this research report accurately reflect the analyst’s personal views about any and all of the subject securities or issuers; and no part of the research analyst’s compensation was, is or will be, directly or indirectly, related to the specific recommendations or views expressed in the report.
Reminder
Structured securities are complex instruments, typically involve a high degree of risk and are intended for sale only to sophisticated investors who are capable of understanding and assuming the risks involved. The market value of any structured security may be affected by changes in economic, financial and political factors (including, but not limited to, spot and forward interest and exchange rates), time to maturity, market conditions and volatility and the credit quality of any issuer or reference issuer. Any investor interested in purchasing a structured product should conduct its own analysis of the product and consult with its own professional advisers as to the risks involved in making such a purchase.
No part of this material may be copied, photocopied or duplicated in any form by any means or redistributed without the prior consent of MKE.
Definition of Ratings
Maybank Kim Eng Research uses the following rating system BUY Return is expected to be above 10% in the next 12 months (excluding dividends) HOLD Return is expected to be between - 10% to +10% in the next 12 months (excluding dividends) SELL Return is expected to be below -10% in the next 12 months (excluding dividends)
Applicability of Ratings
The respective analyst maintains a coverage universe of stocks, the list of which may be adjusted according to needs. Investment ratings are only applicable to the stocks which form part of the coverage universe. Reports on companies which are not part of the coverage do not carry investment ratings as we do not actively follow developments in these companies.
DISCLOSURES Legal Entities Disclosures
Malaysia: This report is issued and distributed in Malaysia by Maybank Investment Bank Berhad (15938-H) which is a Participating Organization of Bursa Malaysia Berhad and a holder of Capital Markets and Services License issued by the Securities Commission in Malaysia. Singapore: This material is issued and distributed in Singapore by Maybank KERPL (Co. Reg No 197201256N) which is regulated by the Monetary Authority of Singapore. Indonesia: PT Kim Eng Securities (“PTKES”) (Reg. No. KEP-251/PM/1992) is a member of the Indonesia Stock Exchange and is regulated by the BAPEPAM LK. Thailand: MBKET (Reg. No.0107545000314) is a member of the Stock Exchange of Thailand and is regulated by the Ministry of Finance and the Securities and Exchange Commission. Philippines: Maybank ATRKES (Reg. No.01-2004-00019) is a member of the Philippines Stock Exchange and is regulated by the Securities and Exchange Commission. Vietnam: Maybank Kim Eng Securities JSC (License Number: 71/UBCK-GP) is licensed under the State Securities Commission of Vietnam.Hong Kong: KESHK (Central Entity No AAD284) is regulated by the Securities and Futures Commission. India: Kim Eng Securities India Private Limited (“KESI”) is a participant of the National Stock Exchange of India Limited (Reg No: INF/INB 231452435) and the Bombay Stock Exchange (Reg. No. INF/INB 011452431) and is regulated by Securities and Exchange Board of India. KESI is also registered with SEBI as Category 1 Merchant Banker (Reg. No. INM 000011708) US: Maybank KESUSA is a member of/ and is authorized and regulated by the FINRA – Broker ID 27861. UK: Maybank KESL (Reg No 2377538) is authorized and regulated by the Financial Services Authority.

June 3, 2015 23
Malaysia Banking
Malaysia Maybank Investment Bank Berhad (A Participating Organisation of Bursa Malaysia Securities Berhad) 33rd Floor, Menara Maybank, 100 Jalan Tun Perak, 50050 Kuala Lumpur Tel: (603) 2059 1888; Fax: (603) 2078 4194
Singapore Maybank Kim Eng Securities Pte Ltd Maybank Kim Eng Research Pte Ltd 50 North Canal Road Singapore 059304 Tel: (65) 6336 9090
London Maybank Kim Eng Securities (London) Ltd 5th Floor, Aldermary House 10-15 Queen Street London EC4N 1TX, UK Tel: (44) 20 7332 0221 Fax: (44) 20 7332 0302
New York Maybank Kim Eng Securities USA Inc 777 Third Avenue, 21st Floor New York, NY 10017, U.S.A. Tel: (212) 688 8886 Fax: (212) 688 3500
Stockbroking Business: Level 8, Tower C, Dataran Maybank, No.1, Jalan Maarof 59000 Kuala Lumpur Tel: (603) 2297 8888 Fax: (603) 2282 5136
Hong Kong Kim Eng Securities (HK) Ltd Level 30, Three Pacific Place, 1 Queen’s Road East, Hong Kong Tel: (852) 2268 0800 Fax: (852) 2877 0104
Indonesia PT Maybank Kim Eng Securities Plaza Bapindo Citibank Tower 17th Floor Jl Jend. Sudirman Kav. 54-55 Jakarta 12190, Indonesia Tel: (62) 21 2557 1188 Fax: (62) 21 2557 1189
India Kim Eng Securities India Pvt Ltd 2nd Floor, The International 16, Maharishi Karve Road, Churchgate Station, Mumbai City - 400 020, India Tel: (91) 22 6623 2600 Fax: (91) 22 6623 2604
Philippines Maybank ATR Kim Eng Securities Inc. 17/F, Tower One & Exchange Plaza Ayala Triangle, Ayala Avenue Makati City, Philippines 1200 Tel: (63) 2 849 8888 Fax: (63) 2 848 5738
Thailand Maybank Kim Eng Securities (Thailand) Public Company Limited 999/9 The Offices at Central World, 20th - 21st Floor, Rama 1 Road Pathumwan, Bangkok 10330, Thailand Tel: (66) 2 658 6817 (sales) Tel: (66) 2 658 6801 (research)
Vietnam Maybank Kim Eng Securities Limited 4A-15+16 Floor Vincom Center Dong Khoi, 72 Le Thanh Ton St. District 1 Ho Chi Minh City, Vietnam Tel : (84) 844 555 888 Fax : (84) 8 38 271 030
Saudi Arabia In association with Anfaal Capital Villa 47, Tujjar Jeddah Prince Mohammed bin Abdulaziz Street P.O. Box 126575 Jeddah 21352 Tel: (966) 2 6068686 Fax: (966) 26068787
South Asia Sales Trading Kevin Foy Regional Head Sales Trading [email protected] Tel: (65) 6336-5157 US Toll Free: 1-866-406-7447
North Asia Sales Trading Alex Tsun [email protected] Tel: (852) 2268 0228 US Toll Free: 1 877 837 7635
Malaysia
Rommel Jacob [email protected] Tel: (603) 2717 5152
Thailand Tanasak Krishnasreni [email protected] Tel: (66)2 658 6820
Indonesia
Harianto Liong [email protected] Tel: (62) 21 2557 1177
New York
Andrew Dacey [email protected] Tel: (212) 688 2956
India Manish Modi [email protected] Tel: (91)-22-6623-2601
Vietnam
Tien Nguyen [email protected] Tel: (84) 44 555 888 x8079
Philippines Keith Roy [email protected] Tel: (63) 2 848-5288
www.maybank-ke.com | www.maybank-keresearch.com


![[Unchanged] Opportunity amid adversity - I3investorcdn1.i3investor.com/my/files/dfgs88n/2016/01/07/1483882668... · Opportunity amid adversity Adapt ... for corporate exercises](https://img.pdfslide.us/doc/110x75/5b0a24417f8b9abe5d8dc293/unchanged-opportunity-amid-adversity-i3investorcdn1-amid-adversity-adapt-.jpg)