Embed Size (px)
Citation preview
Making work mobile
Q1 Presentation
10 May 2021
Gross profitNOK million
29
96 97
0
50
100
150
200
FY 2019 FY 2020 LTM Q12021
EBITDA adjustedNOK million, EBITDA/GP %• Q1 gross profit of NOK 114 million, up from NOK 80
million in the first quarter of 2020
• Q1 EBITDA adjusted of NOK 13 million vs NOK 12
million in the first quarter of 2020
• Signed eight new managed mobility service
contracts in Q1, with an estimated value of NOK 15
million and ~3,300 managed devices
• Honourable mention in Gartner Magic Quadrant for
Managed Mobility Services - Global
• Acquisition of software provider Famoc,
strengthening Techstep’s MMS capabilities and
unlocking European expansion
Highlights
2
279
378412
FY 2019 FY 2020 LTM Q12021
10%
25% 24%
>200k
managed
devices
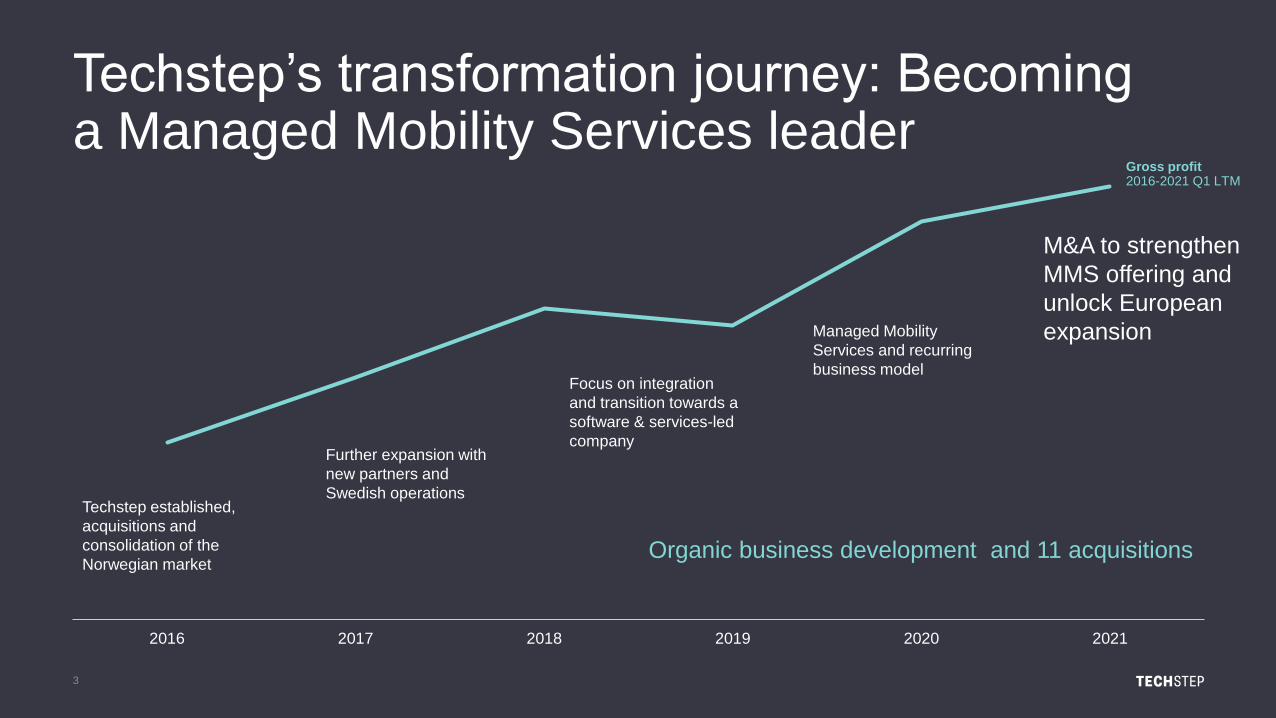
2016 2017 2018 2019 2020 2021
Techstep established,
acquisitions and
consolidation of the
Norwegian market
Further expansion with
new partners and
Swedish operations
Focus on integration
and transition towards a
software & services-led
company
Managed Mobility
Services and recurring
business model
Organic business development and 11 acquisitions
3
Techstep’s transformation journey: Becoming a Managed Mobility Services leader
Gross profit2016-2021 Q1 LTM
M&A to strengthen
MMS offering and
unlock European
expansion
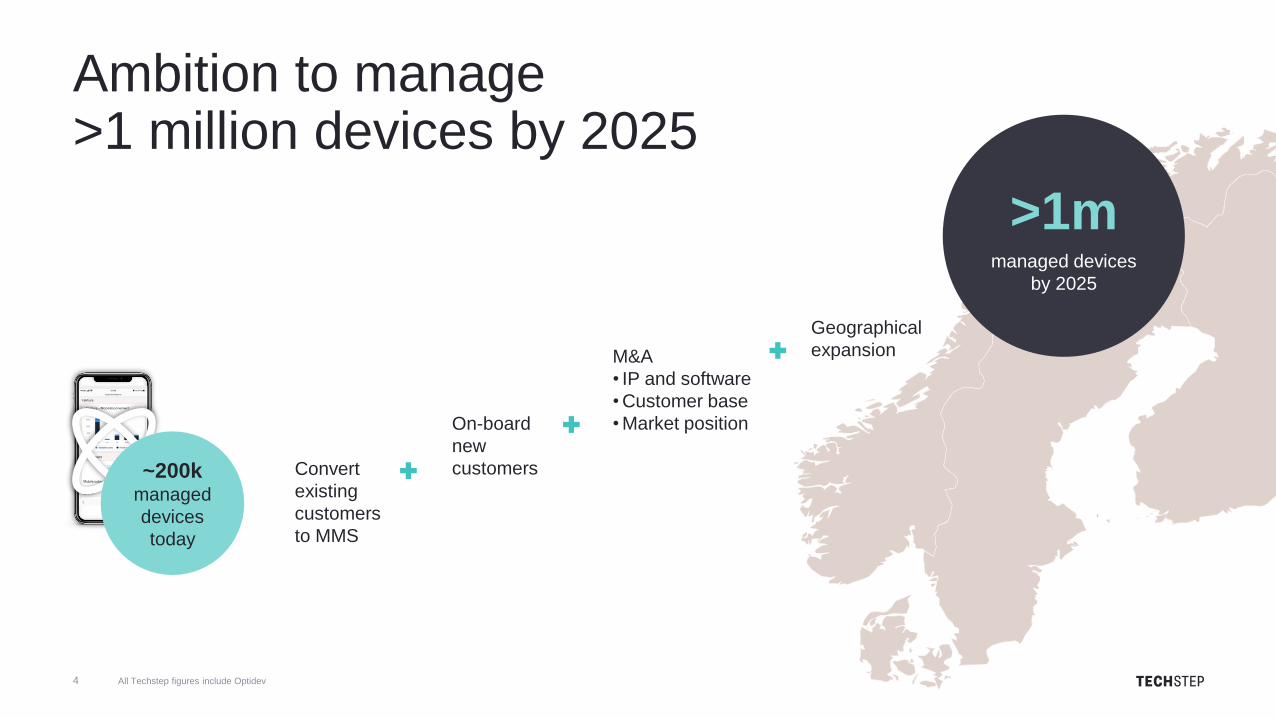
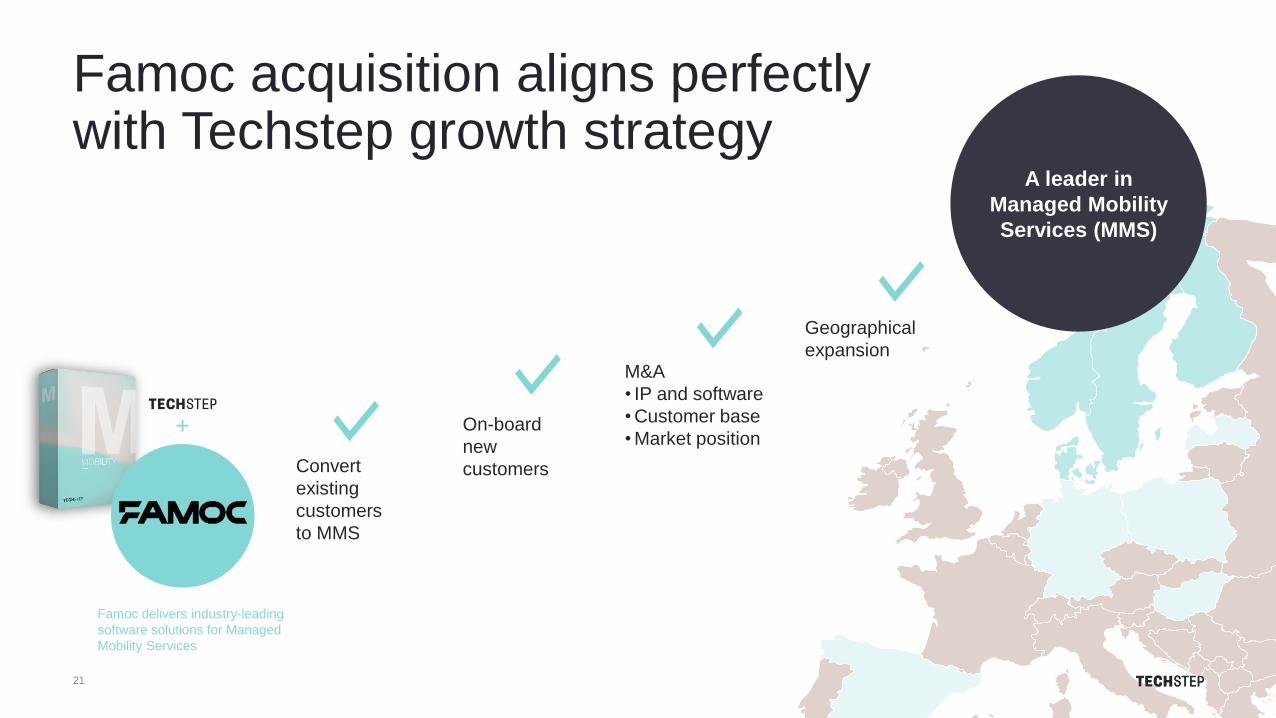
Convert
existing
customers
to MMS
On-board
new
customers
Geographical
expansionM&A
• IP and software
• Customer base
• Market position
>1mmanaged devices
by 2025
4
Ambition to manage >1 million devices by 2025
~200kmanaged
devices
today
All Techstep figures include Optidev

Making work mobile
Bus drivers uses tablets for damage
reports and timetables in the field
Electricians document their work
and invoice immediately between
site visits
Employees do admin work on
devices while in-store
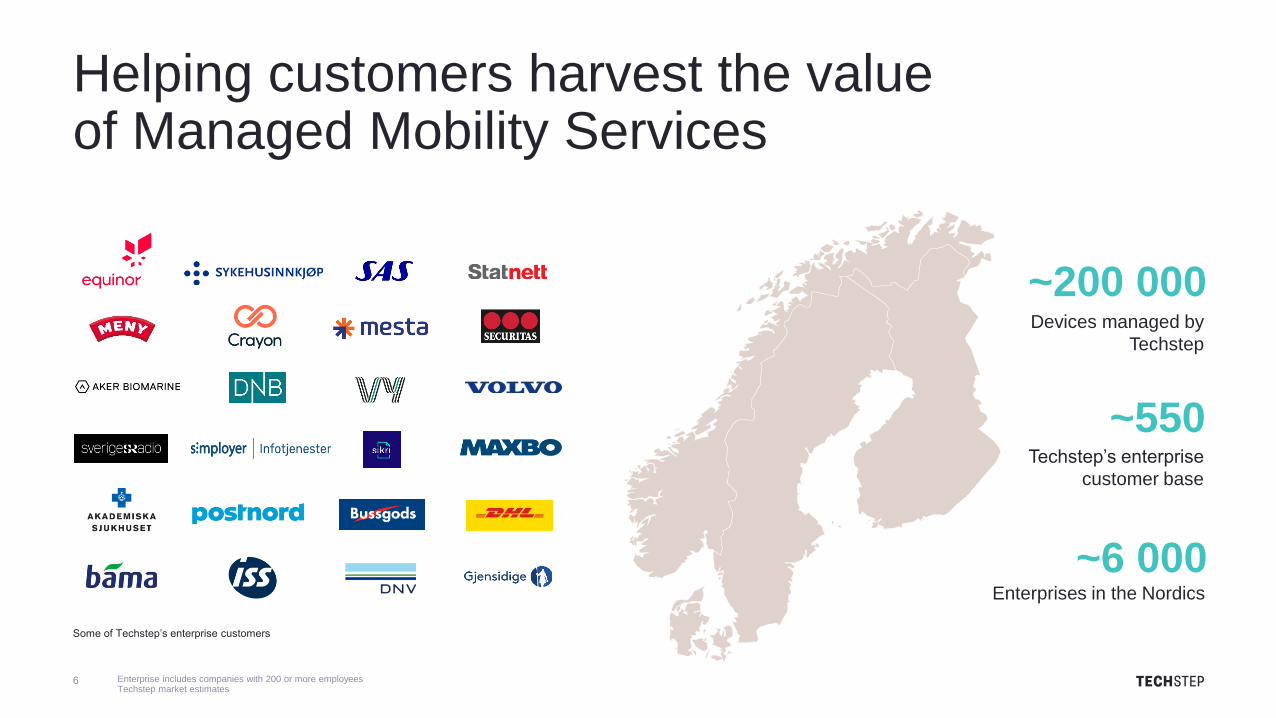
Enterprise includes companies with 200 or more employeesTechstep market estimates
~6 000Enterprises in the Nordics
~550Techstep’s enterprise
customer base
~200 000Devices managed by
Techstep
Some of Techstep’s enterprise customers
6
Helping customers harvest the value of Managed Mobility Services
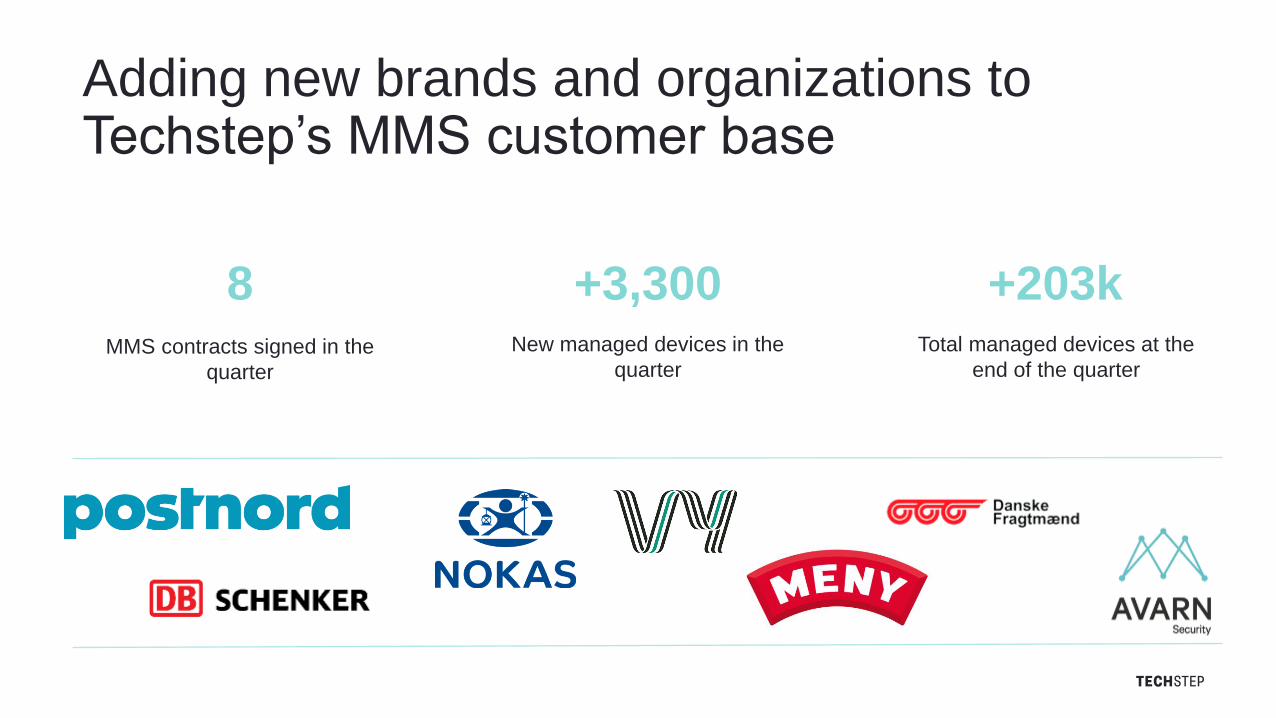
+203k MMS contracts signed in the
quarter
New managed devices in the
quarter
Total managed devices at the
end of the quarter
+3,3008
Adding new brands and organizations to Techstep’s MMS customer base
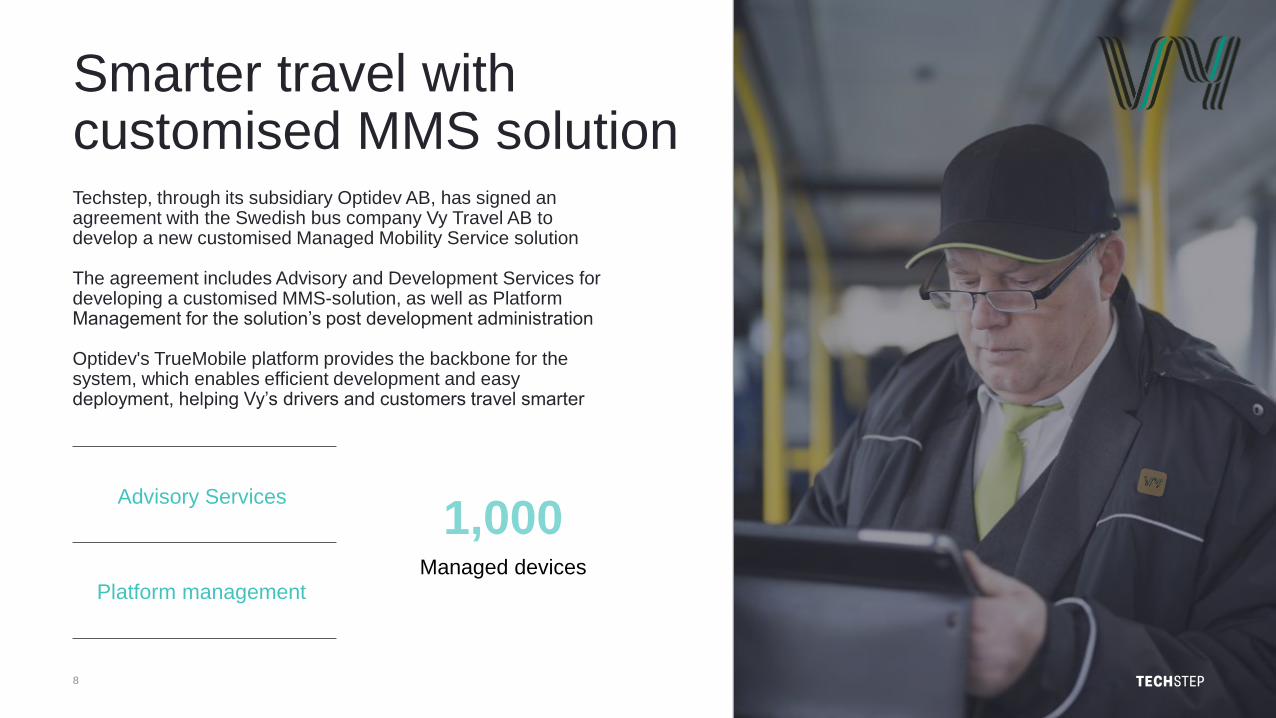
Techstep, through its subsidiary Optidev AB, has signed an agreement with the Swedish bus company Vy Travel AB to develop a new customised Managed Mobility Service solution
The agreement includes Advisory and Development Services for developing a customised MMS-solution, as well as Platform Management for the solution’s post development administration
Optidev's TrueMobile platform provides the backbone for the system, which enables efficient development and easy deployment, helping Vy’s drivers and customers travel smarter
8
Smarter travel with customised MMS solution
1,000Managed devices
Platform management
Advisory Services
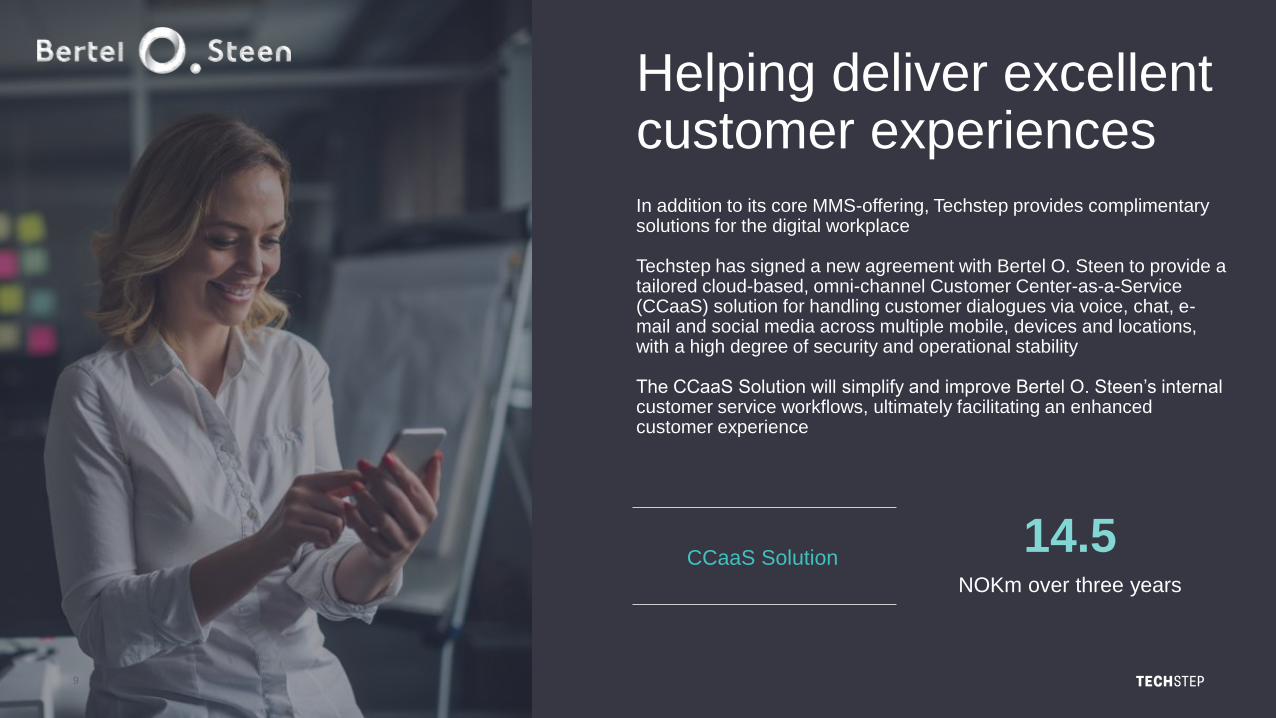
In addition to its core MMS-offering, Techstep provides complimentary solutions for the digital workplace
Techstep has signed a new agreement with Bertel O. Steen to provide a tailored cloud-based, omni-channel Customer Center-as-a-Service (CCaaS) solution for handling customer dialogues via voice, chat, e-mail and social media across multiple mobile, devices and locations, with a high degree of security and operational stability
The CCaaS Solution will simplify and improve Bertel O. Steen’s internal customer service workflows, ultimately facilitating an enhanced customer experience
9
Helping deliver excellent customer experiences
14.5NOKm over three years
CCaaS Solution

0
1
2
3
4
5
6
7
8
9
10
Future full-service MMS
solution
0
1
2
3
4
5
6
7
8
9
10
Standaloneservices
0
1
2
3
4
5
6
7
8
9
10
Today's full-service MMS
solution
Using Techstep’s service stack… ...and drive gross profit per managed device…to build recurring revenue bundles…
Powered by
Techstep IP, software and mobility expertise
10
Driving value creation with value-adding services
Advisory Services
Platform Management
Asset Management
All Techstep figures include Optidev
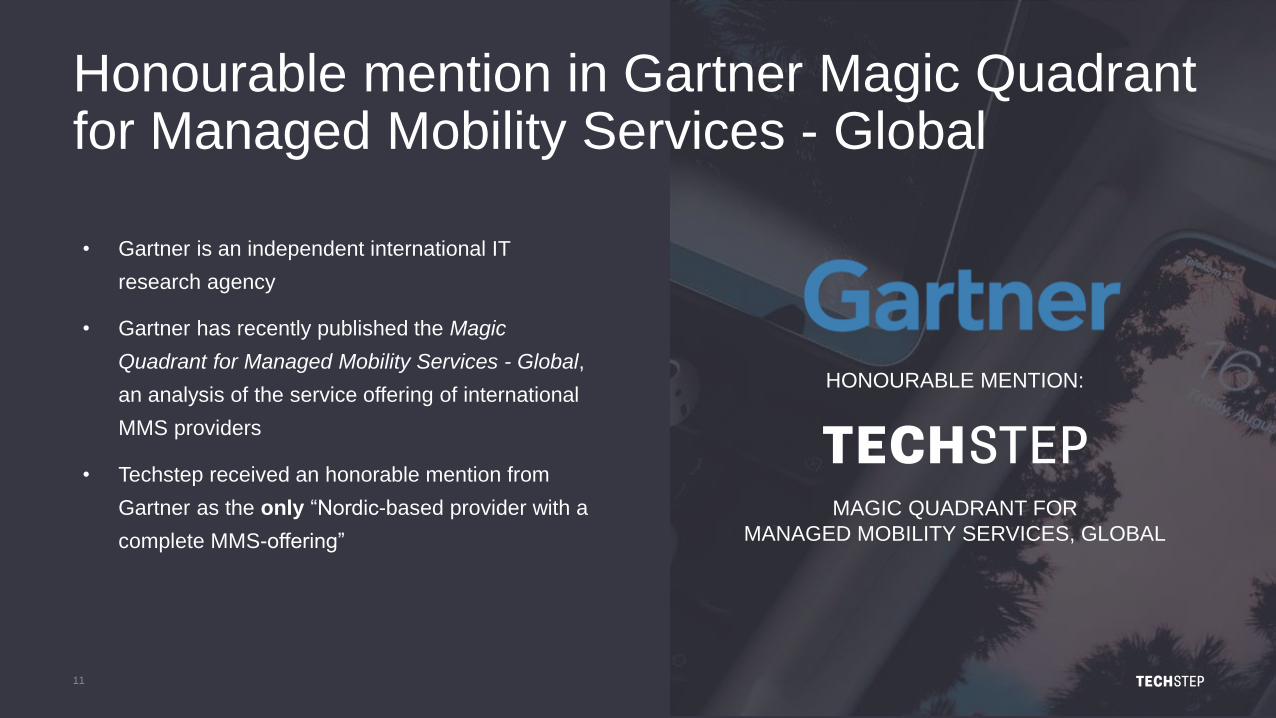
HONOURABLE MENTION:
MAGIC QUADRANT FOR
MANAGED MOBILITY SERVICES, GLOBAL
Honourable mention in Gartner Magic Quadrant for Managed Mobility Services - Global
11
• Gartner is an independent international IT
research agency
• Gartner has recently published the Magic
Quadrant for Managed Mobility Services - Global,
an analysis of the service offering of international
MMS providers
• Techstep received an honorable mention from
Gartner as the only “Nordic-based provider with a
complete MMS-offering”
Financials
Q1 2021
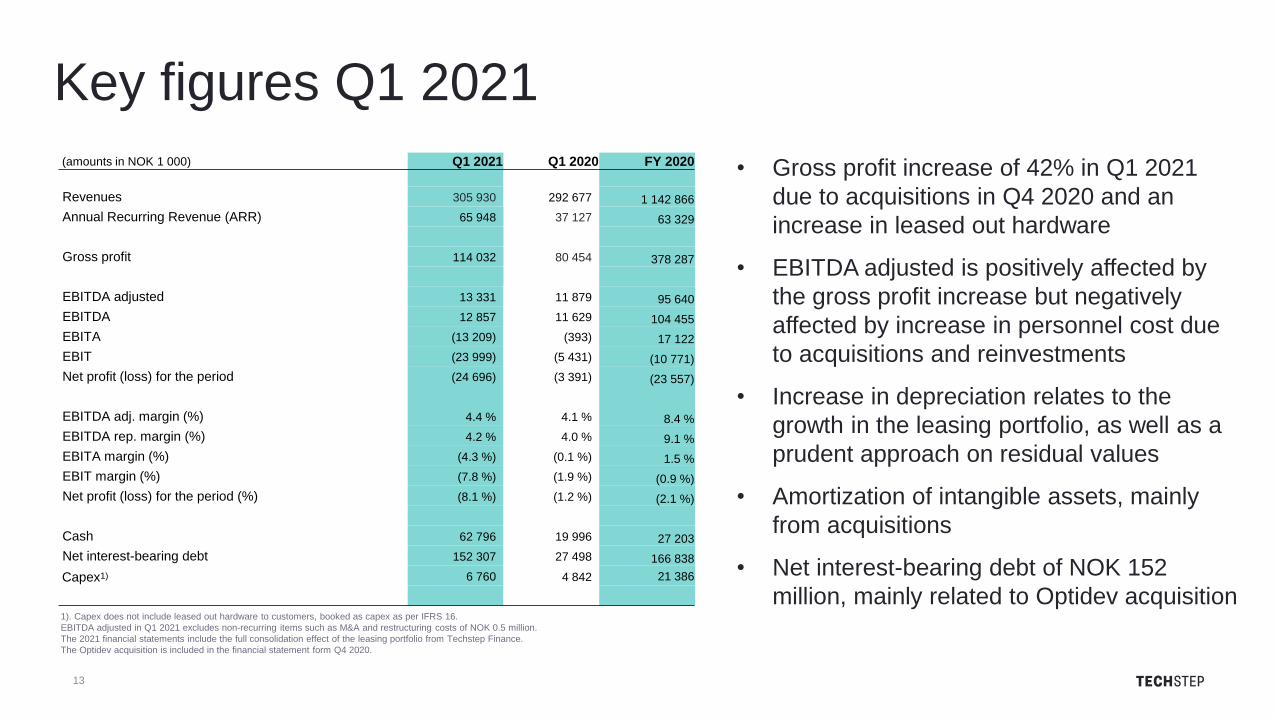
• Gross profit increase of 42% in Q1 2021
due to acquisitions in Q4 2020 and an
increase in leased out hardware
• EBITDA adjusted is positively affected by
the gross profit increase but negatively
affected by increase in personnel cost due
to acquisitions and reinvestments
• Increase in depreciation relates to the
growth in the leasing portfolio, as well as a
prudent approach on residual values
• Amortization of intangible assets, mainly
from acquisitions
• Net interest-bearing debt of NOK 152
million, mainly related to Optidev acquisition1). Capex does not include leased out hardware to customers, booked as capex as per IFRS 16.
EBITDA adjusted in Q1 2021 excludes non-recurring items such as M&A and restructuring costs of NOK 0.5 million.
The 2021 financial statements include the full consolidation effect of the leasing portfolio from Techstep Finance.
The Optidev acquisition is included in the financial statement form Q4 2020.
Key figures Q1 2021
(amounts in NOK 1 000) Q1 2021 Q1 2020 FY 2020
Revenues 305 930 292 677 1 142 866
Annual Recurring Revenue (ARR) 65 948 37 127 63 329
Gross profit 114 032 80 454 378 287
EBITDA adjusted 13 331 11 879 95 640
EBITDA 12 857 11 629 104 455
EBITA (13 209) (393) 17 122
EBIT (23 999) (5 431) (10 771)
Net profit (loss) for the period (24 696) (3 391) (23 557)
EBITDA adj. margin (%) 4.4 % 4.1 % 8.4 %
EBITDA rep. margin (%) 4.2 % 4.0 % 9.1 %
EBITA margin (%) (4.3 %) (0.1 %) 1.5 %
EBIT margin (%) (7.8 %) (1.9 %) (0.9 %)
Net profit (loss) for the period (%) (8.1 %) (1.2 %) (2.1 %)
Cash 62 796 19 996 27 203
Net interest-bearing debt 152 307 27 498 166 838
Capex1) 6 760 4 842 21 386
13
104 108 106 113 117
919 36
85104
3536
38
43
48
9493
92
105
115
3935
32
31
27
279 285 293
305
378
-
50.0
100.0
150.0
200.0
250.0
300.0
350.0
400.0
450.0
Q1 2020 Q2 2020 Q3 2020 Q4 2020 Q1 2021
Hardware Leasing Own software
Advisory & Services Operating commissions Other
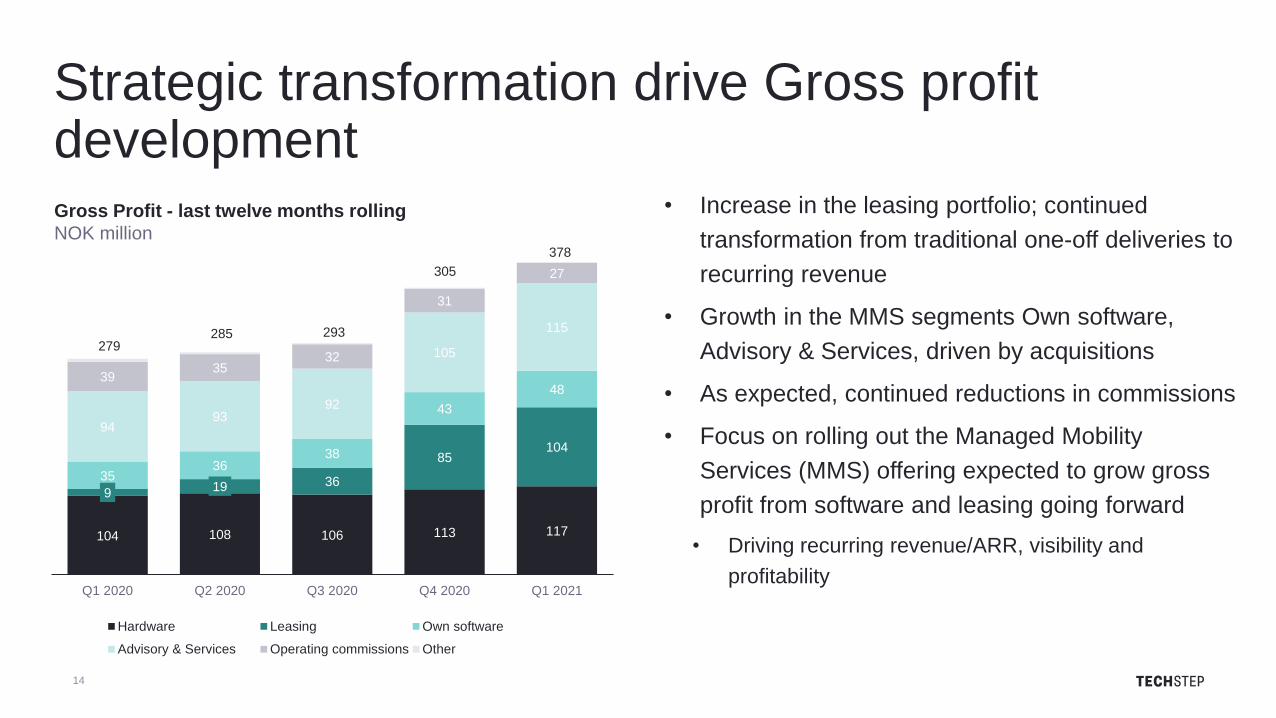
Gross Profit - last twelve months rolling
NOK million
• Increase in the leasing portfolio; continued
transformation from traditional one-off deliveries to
recurring revenue
• Growth in the MMS segments Own software,
Advisory & Services, driven by acquisitions
• As expected, continued reductions in commissions
• Focus on rolling out the Managed Mobility
Services (MMS) offering expected to grow gross
profit from software and leasing going forward
• Driving recurring revenue/ARR, visibility and
profitability
Strategic transformation drive Gross profit development
14
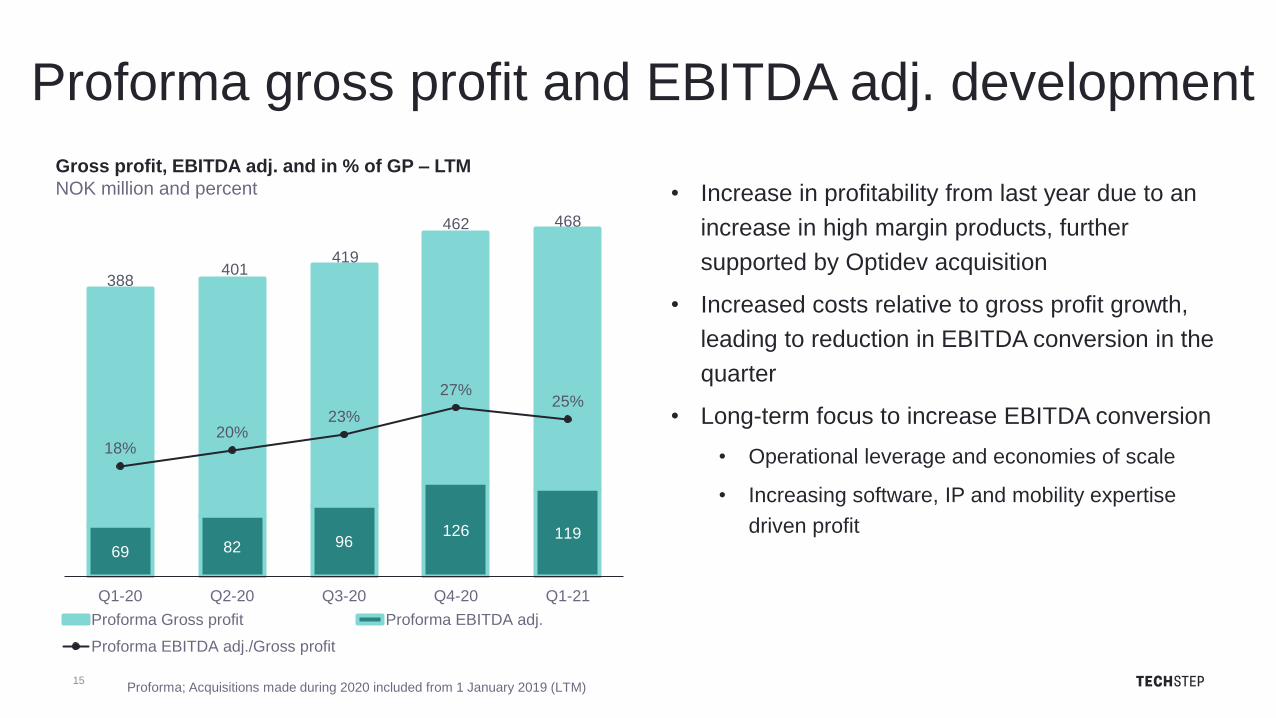
69 82 96126 119
388401
419
462 468
18%20%
23%
27%25%
0%
10%
20%
30%
40%
50%
60%
0
50
100
150
200
250
300
350
400
450
500
Q1-20 Q2-20 Q3-20 Q4-20 Q1-21
Proforma Gross profit Proforma EBITDA adj.
Proforma EBITDA adj./Gross profit
Gross profit, EBITDA adj. and in % of GP – LTM
NOK million and percent • Increase in profitability from last year due to an
increase in high margin products, further
supported by Optidev acquisition
• Increased costs relative to gross profit growth,
leading to reduction in EBITDA conversion in the
quarter
• Long-term focus to increase EBITDA conversion
• Operational leverage and economies of scale
• Increasing software, IP and mobility expertise
driven profit
15
Proforma gross profit and EBITDA adj. development
Proforma; Acquisitions made during 2020 included from 1 January 2019 (LTM)
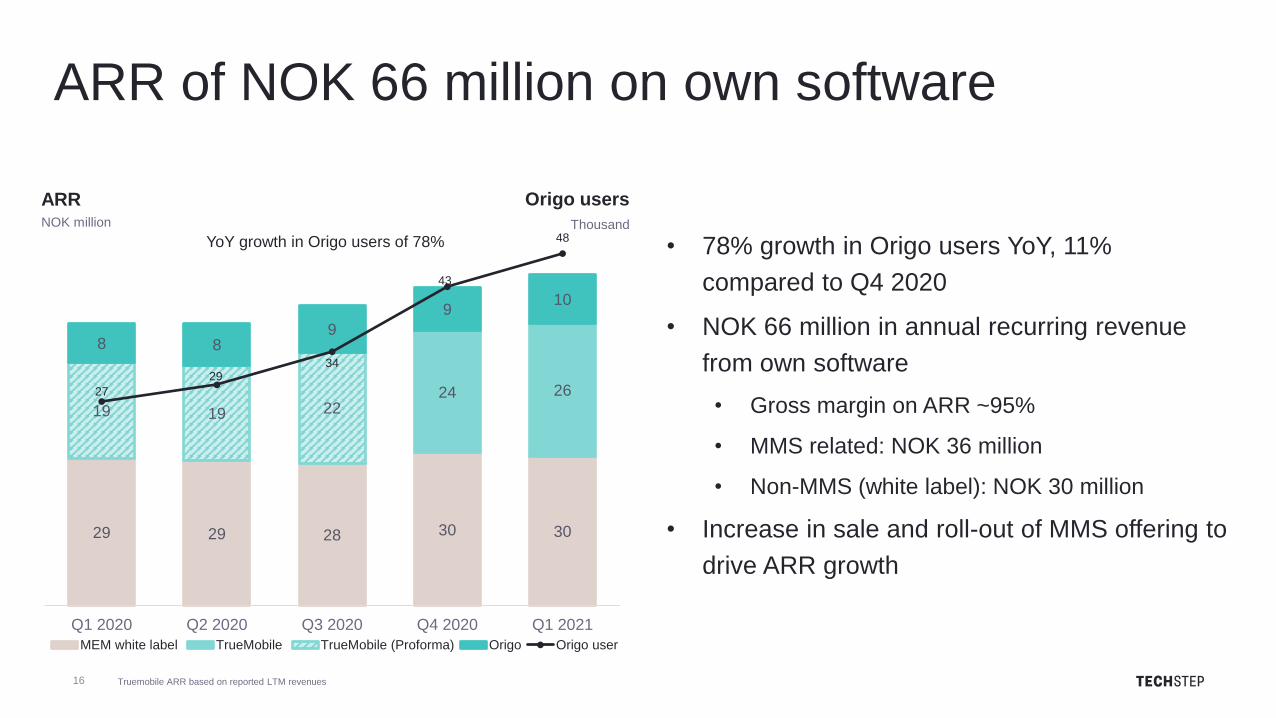
29 29 28 30 30
24 26
19 19 22
8 89
910
27
2934
43
48
Q1 2020 Q2 2020 Q3 2020 Q4 2020 Q1 2021
MEM white label TrueMobile TrueMobile (Proforma) Origo Origo user
• 78% growth in Origo users YoY, 11%
compared to Q4 2020
• NOK 66 million in annual recurring revenue
from own software
• Gross margin on ARR ~95%
• MMS related: NOK 36 million
• Non-MMS (white label): NOK 30 million
• Increase in sale and roll-out of MMS offering to
drive ARR growth
ARR of NOK 66 million on own software
16
ARRNOK million
Origo users
Thousand
Truemobile ARR based on reported LTM revenues
YoY growth in Origo users of 78%
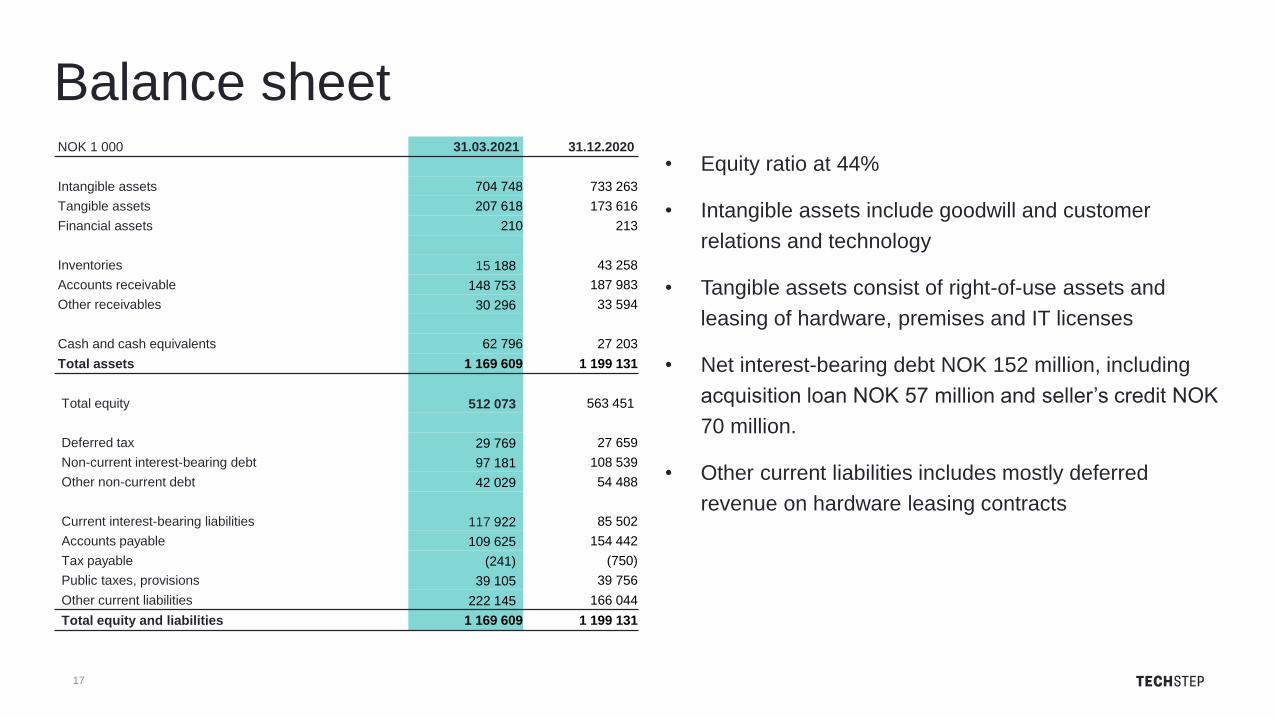
• Equity ratio at 44%
• Intangible assets include goodwill and customer
relations and technology
• Tangible assets consist of right-of-use assets and
leasing of hardware, premises and IT licenses
• Net interest-bearing debt NOK 152 million, including
acquisition loan NOK 57 million and seller’s credit NOK
70 million.
• Other current liabilities includes mostly deferred
revenue on hardware leasing contracts
Balance sheetNOK 1 000 31.03.2021 31.12.2020
Intangible assets 704 748 733 263
Tangible assets 207 618 173 616
Financial assets 210 213
Inventories 15 188 43 258
Accounts receivable 148 753 187 983
Other receivables 30 296 33 594
Cash and cash equivalents 62 796 27 203
Total assets 1 169 609 1 199 131
Total equity 512 073 563 451
Deferred tax 29 769 27 659
Non-current interest-bearing debt 97 181 108 539
Other non-current debt 42 029 54 488
Current interest-bearing liabilities 117 922 85 502
Accounts payable 109 625 154 442
Tax payable (241) (750)
Public taxes, provisions 39 105 39 756
Other current liabilities 222 145 166 044
Total equity and liabilities 1 169 609 1 199 131
17
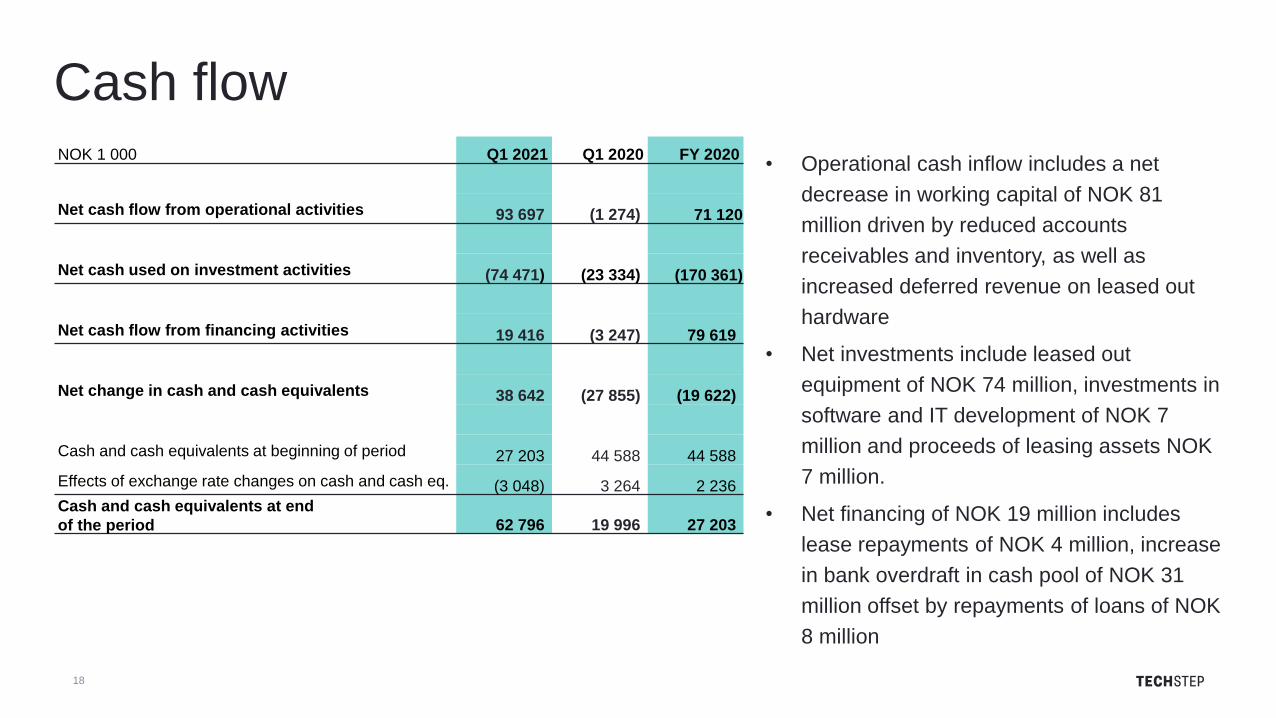
• Operational cash inflow includes a net
decrease in working capital of NOK 81
million driven by reduced accounts
receivables and inventory, as well as
increased deferred revenue on leased out
hardware
• Net investments include leased out
equipment of NOK 74 million, investments in
software and IT development of NOK 7
million and proceeds of leasing assets NOK
7 million.
• Net financing of NOK 19 million includes
lease repayments of NOK 4 million, increase
in bank overdraft in cash pool of NOK 31
million offset by repayments of loans of NOK
8 million
Cash flow NOK 1 000 Q1 2021 Q1 2020 FY 2020
Net cash flow from operational activities 93 697 (1 274) 71 120
Net cash used on investment activities (74 471) (23 334) (170 361)
Net cash flow from financing activities 19 416 (3 247) 79 619
Net change in cash and cash equivalents 38 642 (27 855) (19 622)
Cash and cash equivalents at beginning of period 27 203 44 588 44 588
Effects of exchange rate changes on cash and cash eq. (3 048) 3 264 2 236
Cash and cash equivalents at end
of the period 62 796 19 996 27 203
18

Executing on
M&A strategy
Q1 2021

Relevant
business
• Software led companies
targeting enterprises, or
verticals, in high demand
for mobility solutions
• Advisory/consulting
companies specialized
in Mobility
• Product distribution, if present
in the market with one of the
above
Maturity • Proven track record
Deal
structure
• Mix of shares, cash and
seller’s credit
Customer
base
Market
position
Software and
IP platform
Techstep targeting M&A to strengthen:
20
Growth strategy focused on M&A
Convert
existing
customers
to MMS
On-board
new
customers
Geographical
expansionM&A
• IP and software
• Customer base
• Market position
A leader in
Managed Mobility
Services (MMS)
21
Famoc acquisition aligns perfectly with Techstep growth strategy
Famoc delivers industry-leading
software solutions for Managed
Mobility Services
+
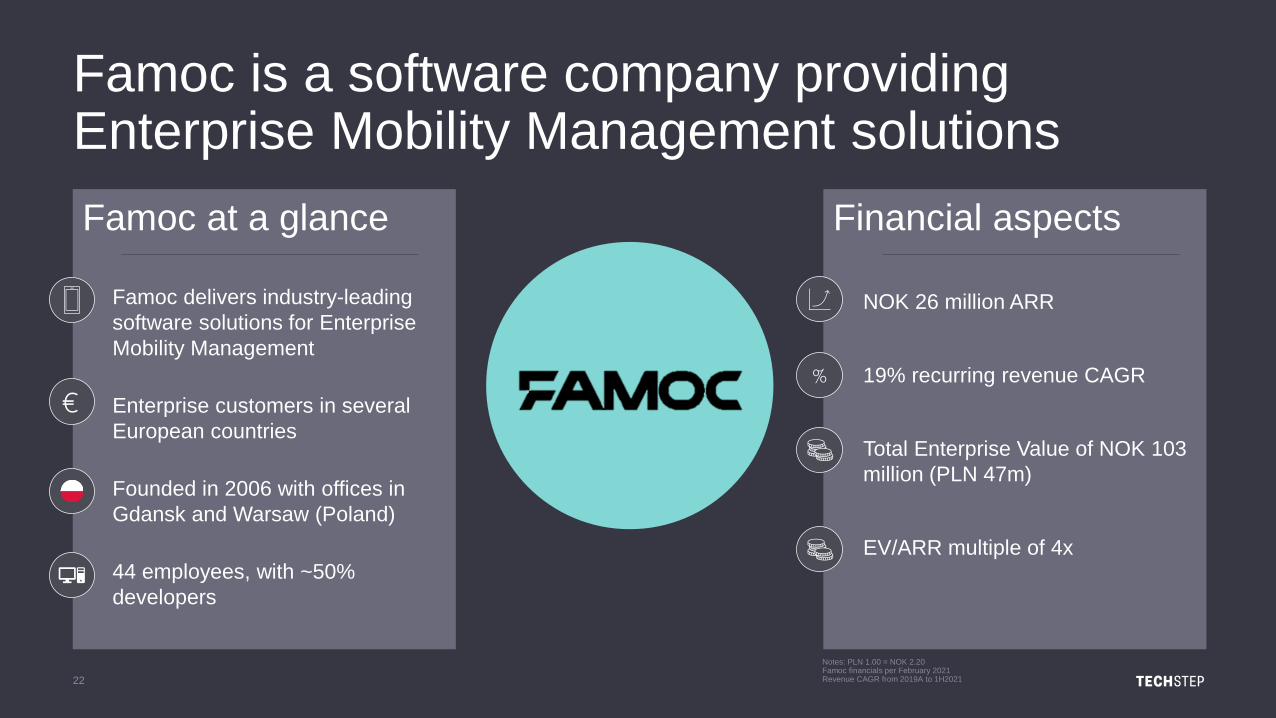
Famoc is a software company providing Enterprise Mobility Management solutions
22
Notes: PLN 1.00 = NOK 2.20Famoc financials per February 2021Revenue CAGR from 2019A to 1H2021
Famoc at a glance
• Famoc delivers industry-leading
software solutions for Enterprise
Mobility Management
• Enterprise customers in several
European countries
• Founded in 2006 with offices in
Gdansk and Warsaw (Poland)
• 44 employees, with ~50%
developers
Financial aspects
• NOK 26 million ARR
• 19% recurring revenue CAGR
• Total Enterprise Value of NOK 103
million (PLN 47m)
• EV/ARR multiple of 4x
%
+
0
1
2
3
4
5
6
7
8
9
10
Full MMSsolution
0
1
2
3
4
5
6
7
8
9
10
Standaloneservices
0
1
2
3
4
5
6
7
8
9
10
Today's full-service MMS
solution
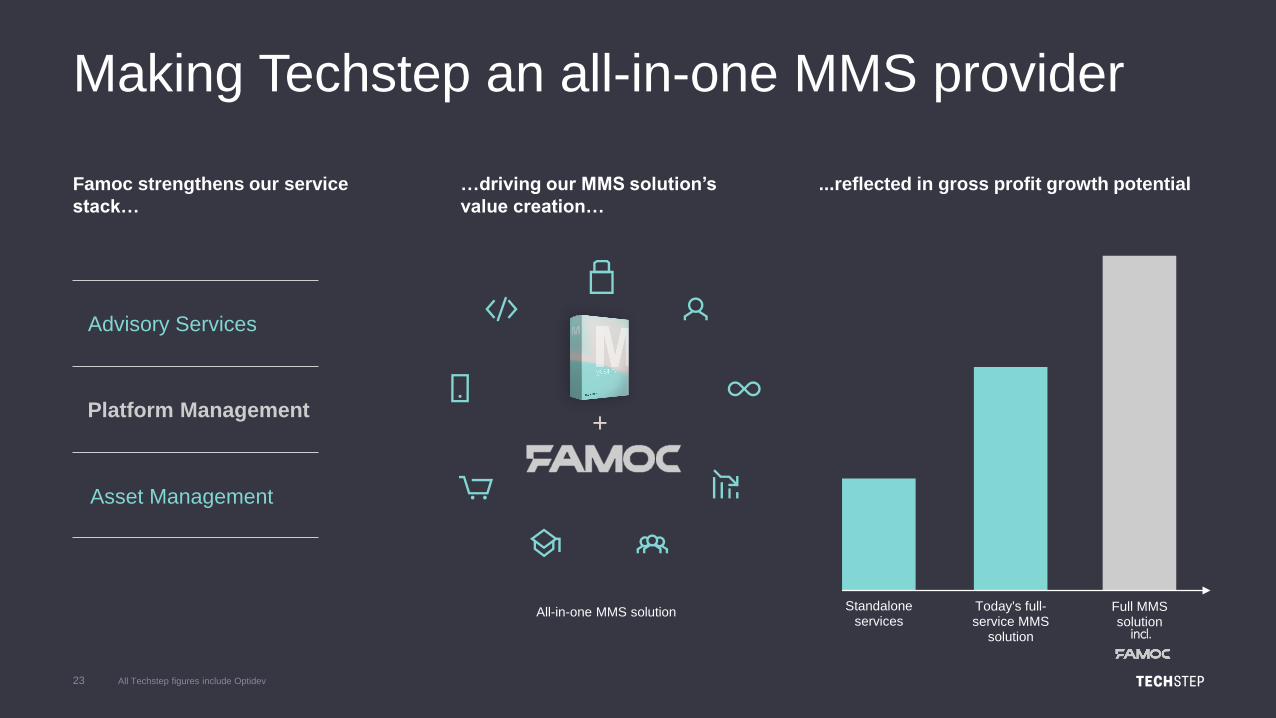
Famoc strengthens our service
stack…
...reflected in gross profit growth potential…driving our MMS solution’s
value creation…
All-in-one MMS solution
23
Making Techstep an all-in-one MMS provider
All Techstep figures include Optidev
incl.
Advisory Services
Platform Management
Asset Management
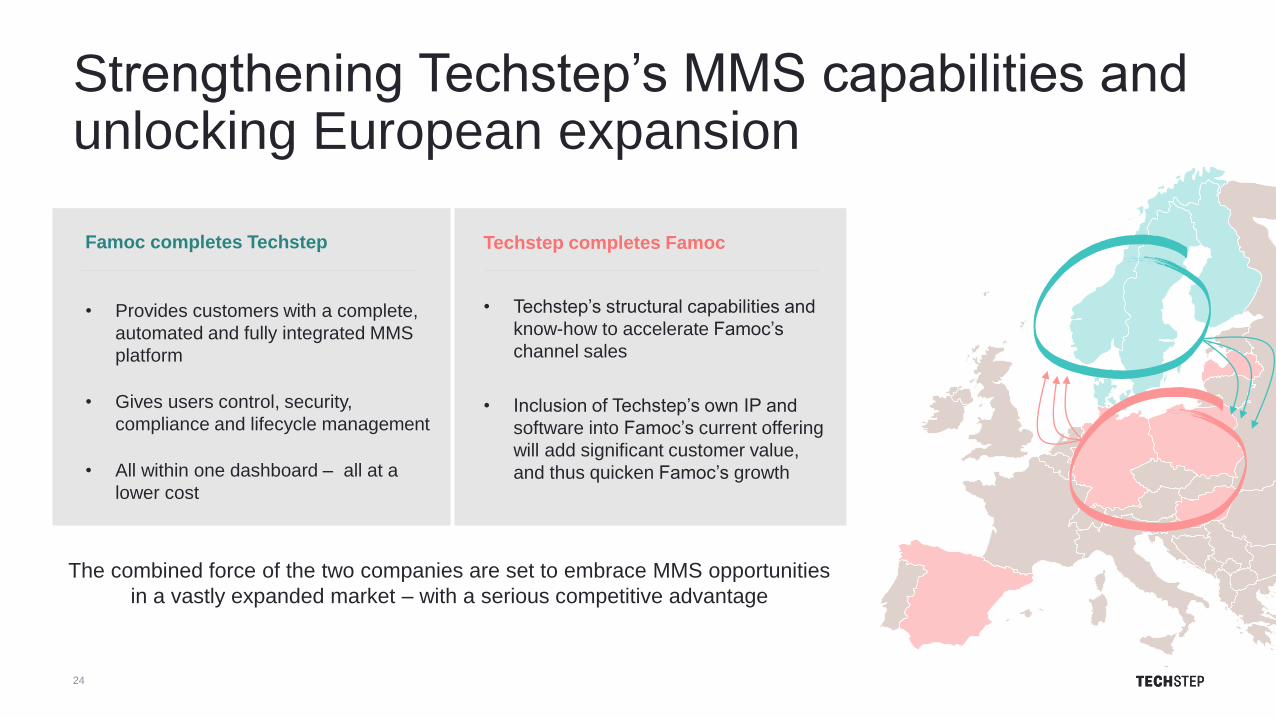
Strengthening Techstep’s MMS capabilities and unlocking European expansion
24
Famoc completes Techstep
• Provides customers with a complete,
automated and fully integrated MMS
platform
• Gives users control, security,
compliance and lifecycle management
• All within one dashboard – all at a
lower cost
Techstep completes Famoc
• Techstep’s structural capabilities and
know-how to accelerate Famoc’s
channel sales
• Inclusion of Techstep’s own IP and
software into Famoc’s current offering
will add significant customer value,
and thus quicken Famoc’s growth
The combined force of the two companies are set to embrace MMS opportunities
in a vastly expanded market – with a serious competitive advantage
25
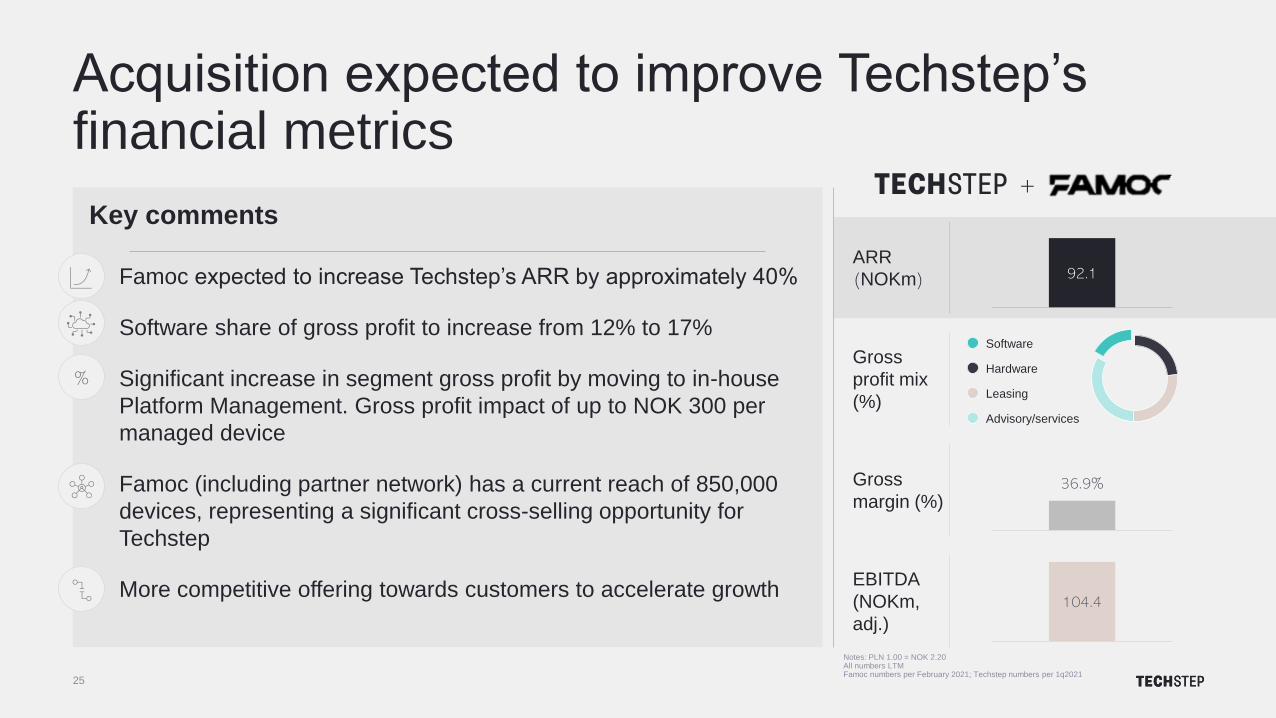
Notes: PLN 1.00 = NOK 2.20All numbers LTMFamoc numbers per February 2021; Techstep numbers per 1q2021
Acquisition expected to improve Techstep’s financial metrics
Key comments
• Famoc expected to increase Techstep’s ARR by approximately 40%
• Software share of gross profit to increase from 12% to 17%
• Significant increase in segment gross profit by moving to in-house
Platform Management. Gross profit impact of up to NOK 300 per
managed device
• Famoc (including partner network) has a current reach of 850,000
devices, representing a significant cross-selling opportunity for
Techstep
• More competitive offering towards customers to accelerate growth
%Gross
profit mix
(%)
Gross
margin (%)
EBITDA
(NOKm,
adj.)
36.9%
104.4
Software
Advisory/services
Leasing
Hardware
+
ARR
(NOKm) 92.1
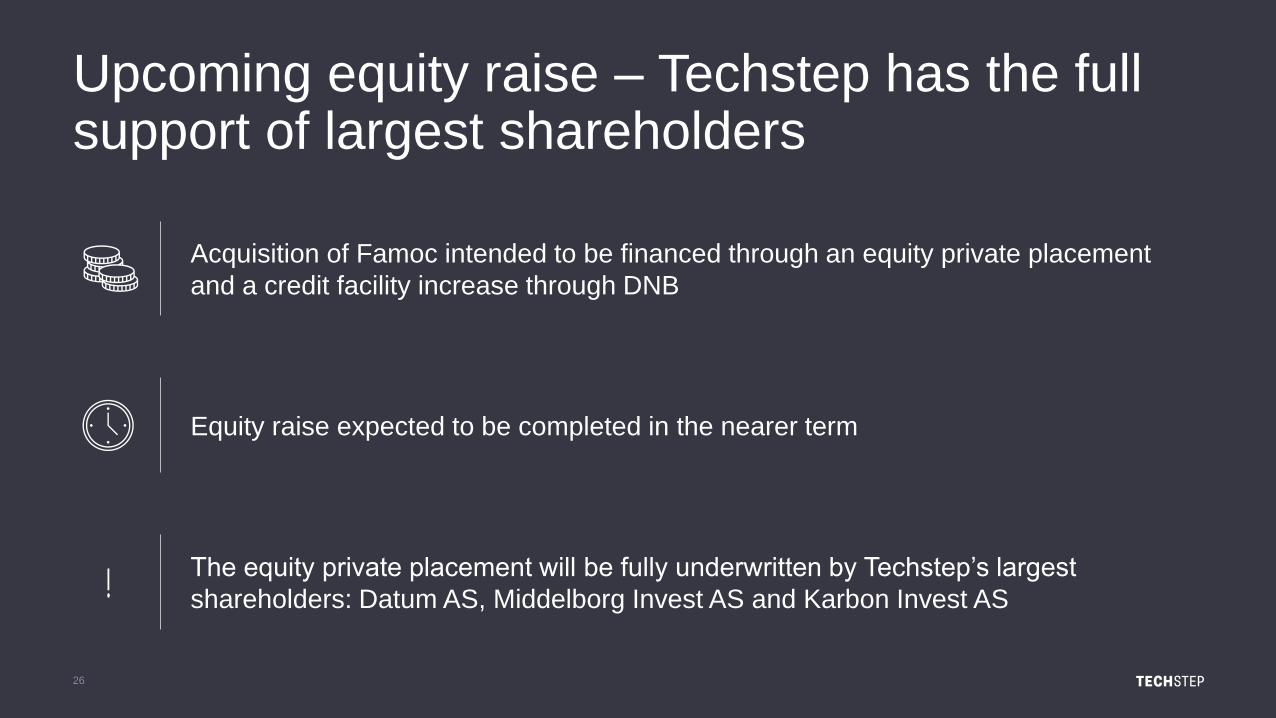
Upcoming equity raise – Techstep has the full support of largest shareholders
26
Acquisition of Famoc intended to be financed through an equity private placement
and a credit facility increase through DNB
Equity raise expected to be completed in the nearer term
The equity private placement will be fully underwritten by Techstep’s largest
shareholders: Datum AS, Middelborg Invest AS and Karbon Invest AS!
Outlook and
summary
Q1 2021
28
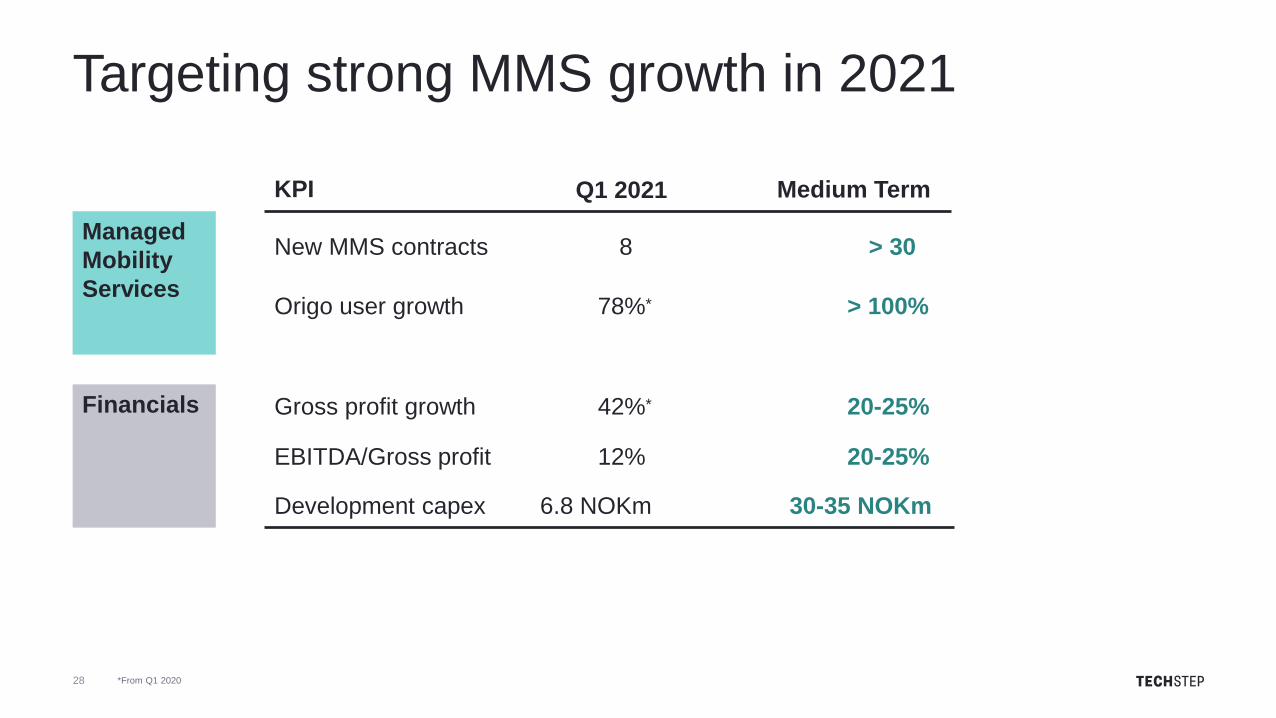
Targeting strong MMS growth in 2021
Managed
Mobility
Services
Financials
KPI
New MMS contracts
Origo user growth
Q1 2021 Medium Term
8
78%*
> 30
> 100%
Gross profit growth 42%* 20-25%
EBITDA/Gross profit 12% 20-25%
Development capex 6.8 NOKm 30-35 NOKm
*From Q1 2020
29
• Gross profit growth continues, stable results
in slow quarter
• Signed eight new managed mobility service
contracts
• Honourable mention in Gartner Magic
Quadrant for Managed Mobility Services
• Acquisition of software provider Famoc,
strengthening Techstep’s MMS capabilities
and unlocking European expansion
• Targeting strong MMS growth in 2021
Summary
Q&A10 May at 10:00 CET
Send your questions to [email protected]
Join us here https://techstep.zoom.us/j/82808508081
30

Appendix
31
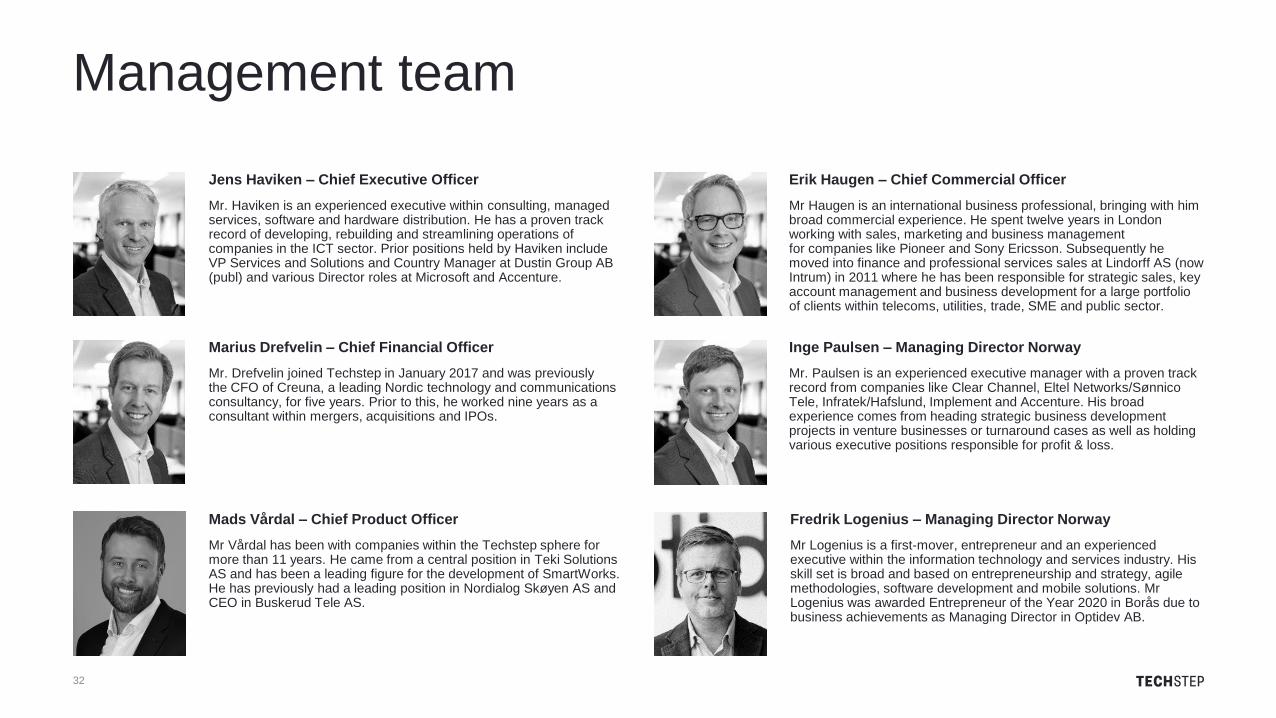
Management team
Erik Haugen – Chief Commercial Officer
Mr Haugen is an international business professional, bringing with him broad commercial experience. He spent twelve years in London working with sales, marketing and business management for companies like Pioneer and Sony Ericsson. Subsequently he moved into finance and professional services sales at Lindorff AS (now Intrum) in 2011 where he has been responsible for strategic sales, key account management and business development for a large portfolio of clients within telecoms, utilities, trade, SME and public sector.
Mads Vårdal – Chief Product Officer
Mr Vårdal has been with companies within the Techstep sphere for more than 11 years. He came from a central position in Teki Solutions AS and has been a leading figure for the development of SmartWorks. He has previously had a leading position in Nordialog Skøyen AS and CEO in Buskerud Tele AS.
Marius Drefvelin – Chief Financial Officer
Mr. Drefvelin joined Techstep in January 2017 and was previously the CFO of Creuna, a leading Nordic technology and communications consultancy, for five years. Prior to this, he worked nine years as a consultant within mergers, acquisitions and IPOs.
Jens Haviken – Chief Executive Officer
Mr. Haviken is an experienced executive within consulting, managed services, software and hardware distribution. He has a proven track record of developing, rebuilding and streamlining operations of companies in the ICT sector. Prior positions held by Haviken include VP Services and Solutions and Country Manager at Dustin Group AB (publ) and various Director roles at Microsoft and Accenture.
Inge Paulsen – Managing Director Norway
Mr. Paulsen is an experienced executive manager with a proven track record from companies like Clear Channel, Eltel Networks/SønnicoTele, Infratek/Hafslund, Implement and Accenture. His broad experience comes from heading strategic business development projects in venture businesses or turnaround cases as well as holding various executive positions responsible for profit & loss.
32
Fredrik Logenius – Managing Director Norway
Mr Logenius is a first-mover, entrepreneur and an experienced executive within the information technology and services industry. His skill set is broad and based on entrepreneurship and strategy, agile methodologies, software development and mobile solutions. MrLogenius was awarded Entrepreneur of the Year 2020 in Borås due to business achievements as Managing Director in Optidev AB.
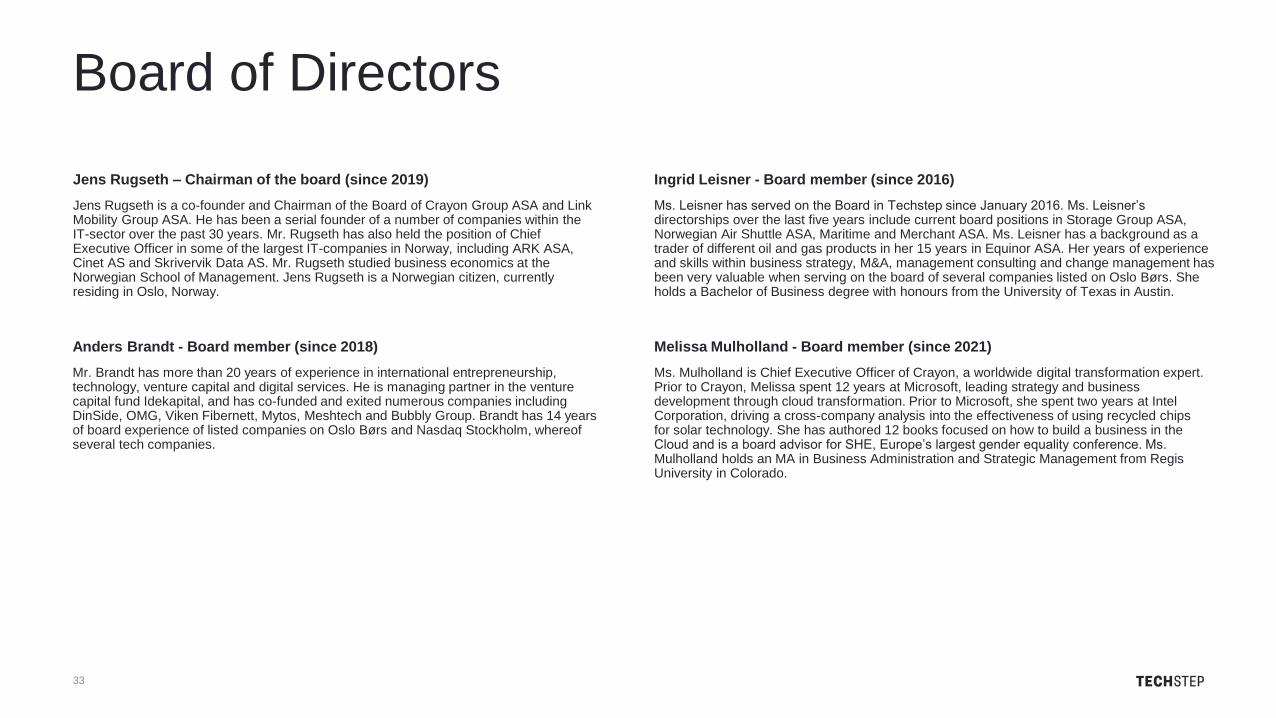
Board of Directors
Ingrid Leisner - Board member (since 2016)
Ms. Leisner has served on the Board in Techstep since January 2016. Ms. Leisner’s directorships over the last five years include current board positions in Storage Group ASA, Norwegian Air Shuttle ASA, Maritime and Merchant ASA. Ms. Leisner has a background as a trader of different oil and gas products in her 15 years in Equinor ASA. Her years of experience and skills within business strategy, M&A, management consulting and change management has been very valuable when serving on the board of several companies listed on Oslo Børs. She holds a Bachelor of Business degree with honours from the University of Texas in Austin.
Jens Rugseth – Chairman of the board (since 2019)
Jens Rugseth is a co-founder and Chairman of the Board of Crayon Group ASA and Link Mobility Group ASA. He has been a serial founder of a number of companies within the IT-sector over the past 30 years. Mr. Rugseth has also held the position of Chief Executive Officer in some of the largest IT-companies in Norway, including ARK ASA, Cinet AS and Skrivervik Data AS. Mr. Rugseth studied business economics at the Norwegian School of Management. Jens Rugseth is a Norwegian citizen, currently residing in Oslo, Norway.
Anders Brandt - Board member (since 2018)
Mr. Brandt has more than 20 years of experience in international entrepreneurship, technology, venture capital and digital services. He is managing partner in the venture capital fund Idekapital, and has co-funded and exited numerous companies including DinSide, OMG, Viken Fibernett, Mytos, Meshtech and Bubbly Group. Brandt has 14 years of board experience of listed companies on Oslo Børs and Nasdaq Stockholm, whereof several tech companies.
Melissa Mulholland - Board member (since 2021)
Ms. Mulholland is Chief Executive Officer of Crayon, a worldwide digital transformation expert. Prior to Crayon, Melissa spent 12 years at Microsoft, leading strategy and business development through cloud transformation. Prior to Microsoft, she spent two years at Intel Corporation, driving a cross-company analysis into the effectiveness of using recycled chips for solar technology. She has authored 12 books focused on how to build a business in the Cloud and is a board advisor for SHE, Europe’s largest gender equality conference. Ms. Mulholland holds an MA in Business Administration and Strategic Management from Regis University in Colorado.
33
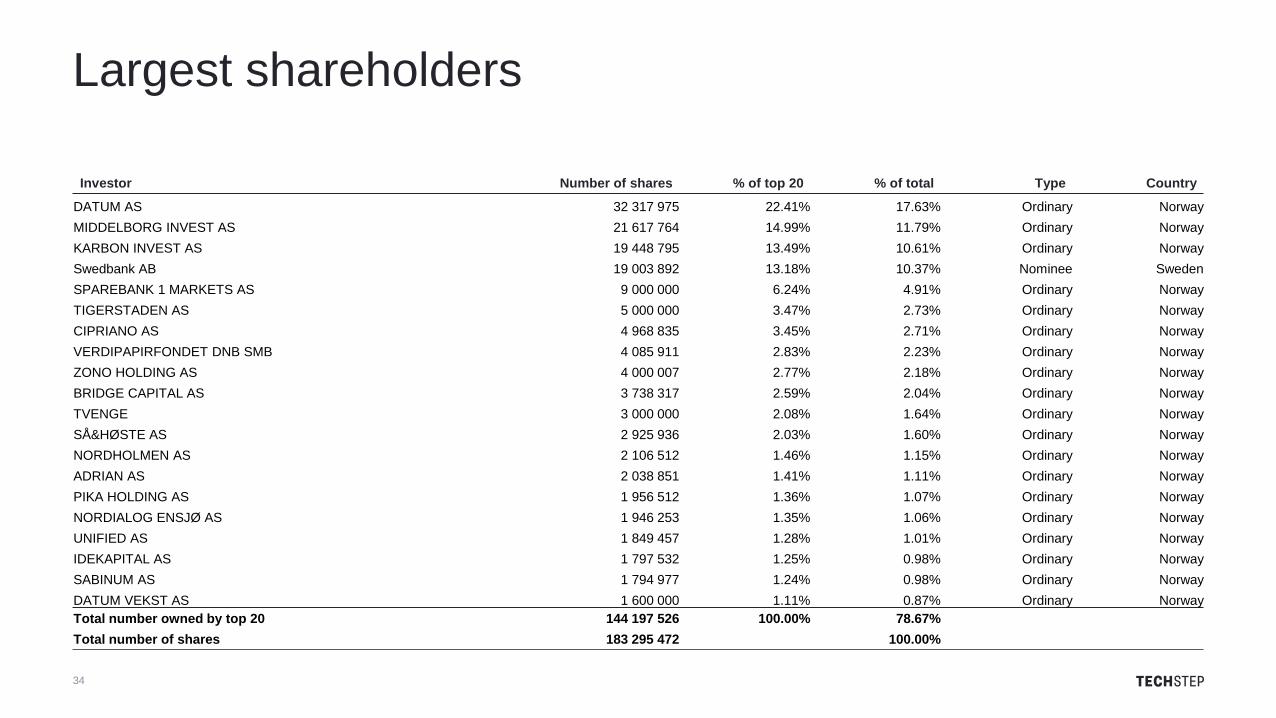
Largest shareholders
Investor Number of shares % of top 20 % of total Type Country
DATUM AS 32 317 975 22.41% 17.63% Ordinary Norway
MIDDELBORG INVEST AS 21 617 764 14.99% 11.79% Ordinary Norway
KARBON INVEST AS 19 448 795 13.49% 10.61% Ordinary Norway
Swedbank AB 19 003 892 13.18% 10.37% Nominee Sweden
SPAREBANK 1 MARKETS AS 9 000 000 6.24% 4.91% Ordinary Norway
TIGERSTADEN AS 5 000 000 3.47% 2.73% Ordinary Norway
CIPRIANO AS 4 968 835 3.45% 2.71% Ordinary Norway
VERDIPAPIRFONDET DNB SMB 4 085 911 2.83% 2.23% Ordinary Norway
ZONO HOLDING AS 4 000 007 2.77% 2.18% Ordinary Norway
BRIDGE CAPITAL AS 3 738 317 2.59% 2.04% Ordinary Norway
TVENGE 3 000 000 2.08% 1.64% Ordinary Norway
SÅ&HØSTE AS 2 925 936 2.03% 1.60% Ordinary Norway
NORDHOLMEN AS 2 106 512 1.46% 1.15% Ordinary Norway
ADRIAN AS 2 038 851 1.41% 1.11% Ordinary Norway
PIKA HOLDING AS 1 956 512 1.36% 1.07% Ordinary Norway
NORDIALOG ENSJØ AS 1 946 253 1.35% 1.06% Ordinary Norway
UNIFIED AS 1 849 457 1.28% 1.01% Ordinary Norway
IDEKAPITAL AS 1 797 532 1.25% 0.98% Ordinary Norway
SABINUM AS 1 794 977 1.24% 0.98% Ordinary Norway
DATUM VEKST AS 1 600 000 1.11% 0.87% Ordinary Norway
Total number owned by top 20 144 197 526 100.00% 78.67%
Total number of shares 183 295 472 100.00%
34
This presentation (the “Presentation”) has been prepared by Techstep ASA (“Techstep” or the “Company” and together with its subsidiaries the "Techstep Group"). The Presentation has been prepared
and is delivered for information purposes only. It has not been reviewed or registered with, or approved by, any public authority, stock exchange or regulated market place.
The contents of the Presentation are not to be construed as financial, legal, business, investment, tax or other professional advice. Each recipient should consult with its own professional
advisors for any such matter and advice.
The Company makes no representation or warranty (whether express or implied) as to the correctness or completeness of the information contained herein, and neither the Company nor any of its
subsidiaries, directors, employees or advisors assume any liability connected to the Presentation and/or the statements set out herein. This Presentation is not and does not purport to be complete in any
way. By receiving this Presentation you acknowledge that you will be solely responsible for your own assessment of the Company, its financial position and prospects and that you will conduct your own
analysis and be solely responsible for forming your own view of any refinancing and the potential future performance of the Company’s business.
The information included in this Presentation may contain certain forward-looking statements relating to the business, financial performance and results of the Techstep Group and/or the industry in which it
operates. Forward-looking statements concern future circumstances and results and other statements that are not historical facts, sometimes identified by the words “believes”, “expects”, “predicts”,
“intends”, “projects”, “plans”, “estimates”, “aims”, “foresees”, “anticipates”, “targets”, and similar expressions. The forward-looking statements contained in this Presentation, including assumptions, opinions
and views of the Company or cited from third party sources are solely views and forecasts which are subject to risks, uncertainties and other factors that may cause actual events to differ materially from
any anticipated development. None of the Company or any other company in the Techstep Group, or any of its advisors or any of their parent or subsidiary undertakings or any such person’s affiliates,
officers or employees provides any assurance that the assumptions underlying such forward-looking statements are free from errors nor does any of them accept any responsibility for the future accuracy
of the opinions expressed in this Presentation or the actual occurrence of the forecasted developments. The Company and its advisors assume no obligation to update any forward-looking statements or to
conform these forward-looking statements to the Techstep Group's actual results. Investors are advised, however, to inform themselves about any further public disclosures made by the Company, such as
filings made with Oslo Børs or press releases.
This Presentation does not constitute any solicitation for any offer to purchase or subscribe any securities and is not an offer or invitation to sell or issue securities for sale in any jurisdiction, including the
United States. Distribution of the Presentation in or into any jurisdiction where such distribution may be unlawful, is prohibited. The Company and its advisors require persons in possession of this
Presentation to inform themselves about, and to observe, any such restrictions.
This Presentation speaks as of the date set out on the front page, and there may have been changes in matters which affect the Techstep Group subsequent to the date of this Presentation. Neither the
issue nor delivery of this Presentation shall under any circumstance create any implication that the information contained herein is correct as of any time subsequent to the date hereof or that the affairs of
the Techstep Group have not since changed, and the Company does not intend, and does not assume any obligation, to update or correct any information included in this Presentation.
This Presentation is subject to Norwegian law, and any dispute arising in respect of this Presentation is subject to the exclusive jurisdiction of Norwegian courts with Oslo City Court as exclusive venue.
By receiving this Presentation, you accept to be bound by the terms above.
35
Disclaimer