Embed Size (px)
Citation preview
Making Uncertainty ValuableMaking Uncertainty Valuable not Risky
2
About KCA
Management Consultancy focused on Energy, Technology, and Related Markets.
Work with clients to develop and implement game-changing strategies, improve operational efficiencies, and reduce costs through long-term competitive advantage.
Principals have worked with start-ups to Fortune 100 clients on over $400 billion in investments.
Headquartered in Houston, TX
3
Wise advice…
“To be absolutely certain about something, one must know everything or nothing about it.”
- Olin Miller
4
Agenda
Some basics Good decisions do not guarantee good outcomes There is a process for ensuring decision quality
Our own risk profiles and how they change and why Ebola and money
Stopping our biggest handicaps Biases Thinking the future is certain
Gaining confidence in our decisions Embracing uncertainty Use appropriate tools and processes
Creating value from uncertainty The Clairvoyant and the Wizard
5
The Decision Spectrum
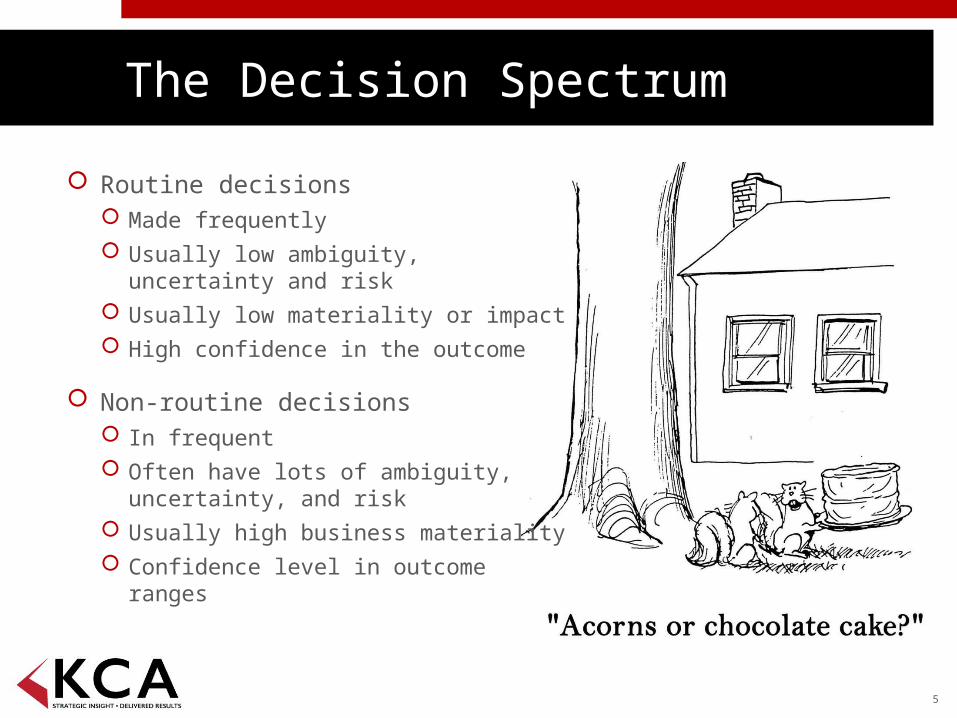
Routine decisions Made frequently Usually low ambiguity, uncertainty
and risk Usually low materiality or impact High confidence in the outcome
Non-routine decisions In frequent Often have lots of ambiguity,
uncertainty, and risk Usually high business materiality Confidence level in outcome ranges
Decision making becomes difficult when…
The real decision-maker is hidden
Dealing with multiple decision-makers
Identifying and clarifying objectives
Making trade-offs
Understanding the key uncertainties
Developing and quantifying unique options
Agreeing on the measures of merit
6
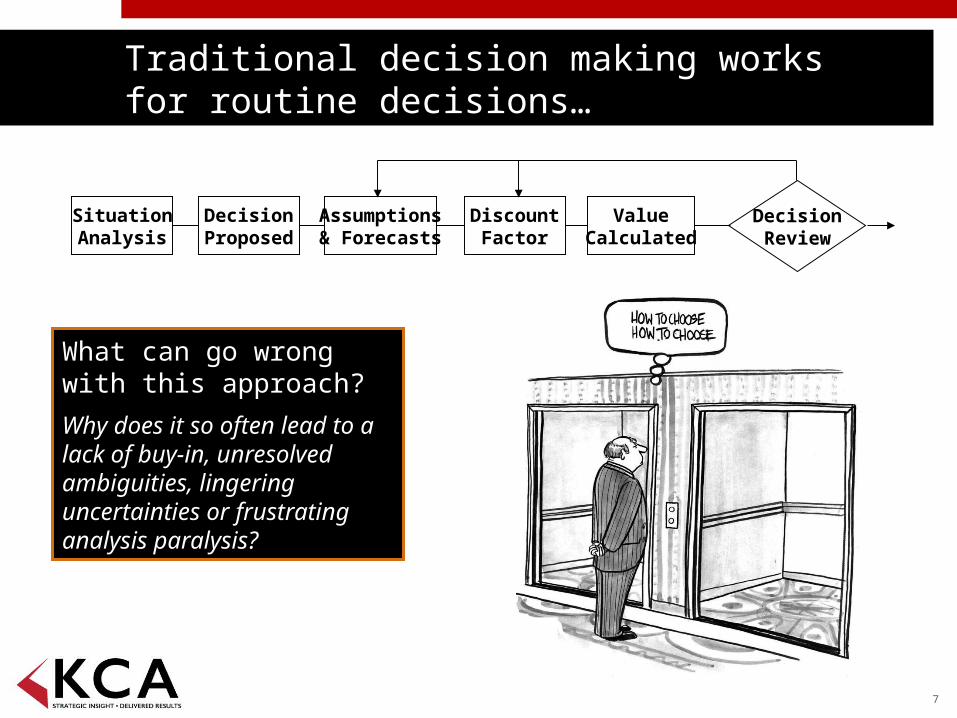
Traditional decision making works for routine decisions…
7
What can go wrongwith this approach?
Why does it so often lead to a lack of buy-in, unresolved ambiguities, lingering uncertainties or frustrating analysis paralysis?
SituationAnalysis
Assumptions& Forecasts
DecisionProposed
DiscountFactor
ValueCalculated
DecisionReview
8
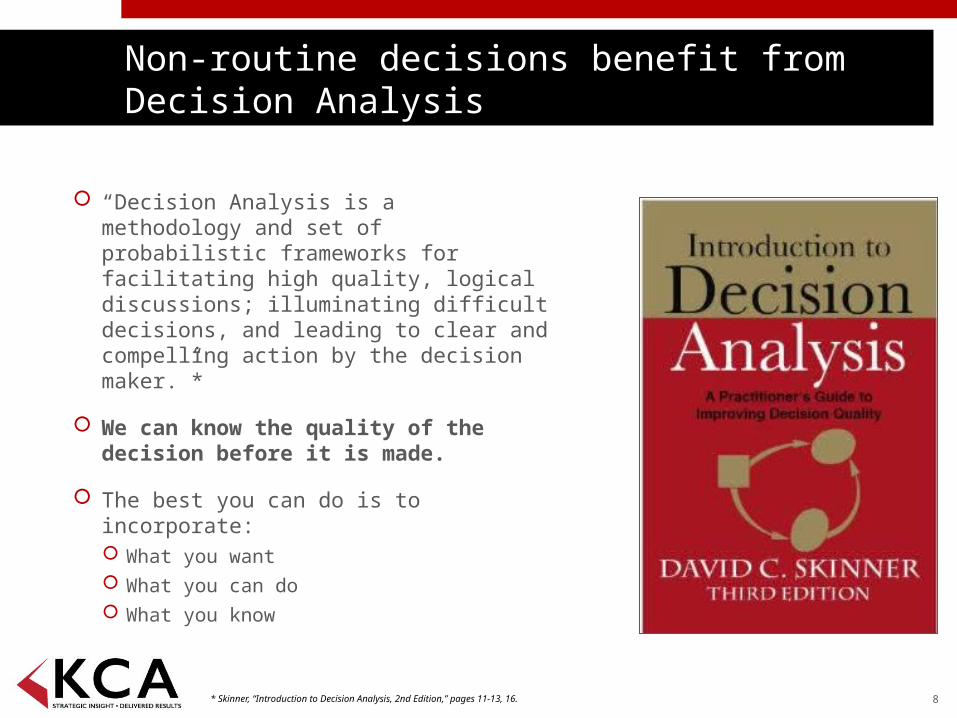
Non-routine decisions benefit from Decision Analysis
“Decision Analysis is a methodology and set of probabilistic frameworks for facilitating high quality, logical discussions; illuminating difficult decisions, and leading to clear and compelling action by the decision maker.”*
We can know the quality of the decision before it is made.
The best you can do is to incorporate: What you want What you can do What you know
* Skinner, “Introduction to Decision Analysis, 2nd Edition,” pages 11-13, 16.
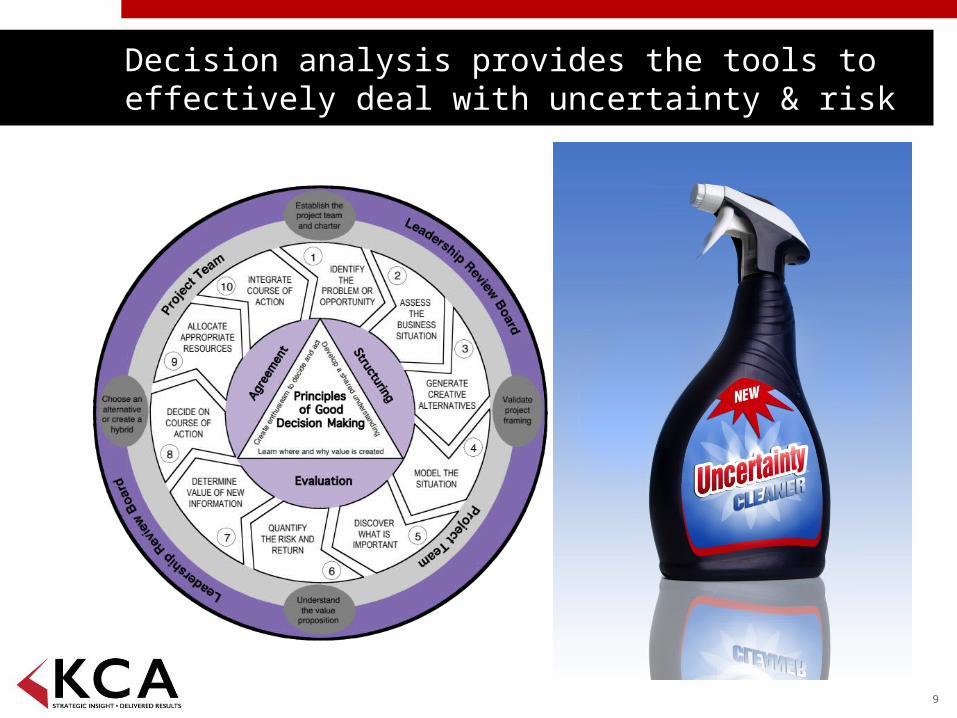
Decision analysis provides the tools to effectively deal with uncertainty & risk
9
10
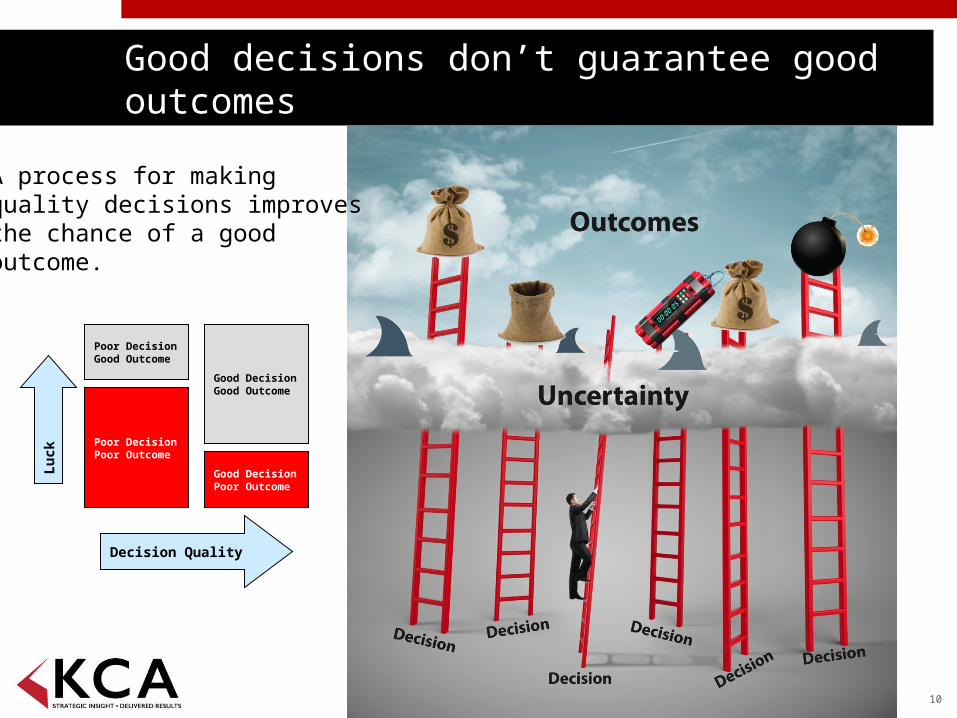
Good decisions don’t guarantee good outcomes
Good DecisionPoor Outcome
Good DecisionGood Outcome
Poor DecisionPoor Outcome
Poor DecisionGood Outcome
Lu
ck
Decision Quality
A process for makingquality decisions improvesthe chance of a goodoutcome.
11
Is Decision Analysis Effective?
Paul Nutt (London Business School) studied 127 major decisions in North America.
He found that the probability of success almost doubled (from about 40% to about 80%) when DA process were utilized.
He saw dramatic improvement in understanding, participant buy-in, use of creative ideas and achievement of business results.
Other studies show similar results.
Paul Nutt, London Business School, Business Strategy Review 1997, Volume 8, Issue 4, PP 44-52.
12
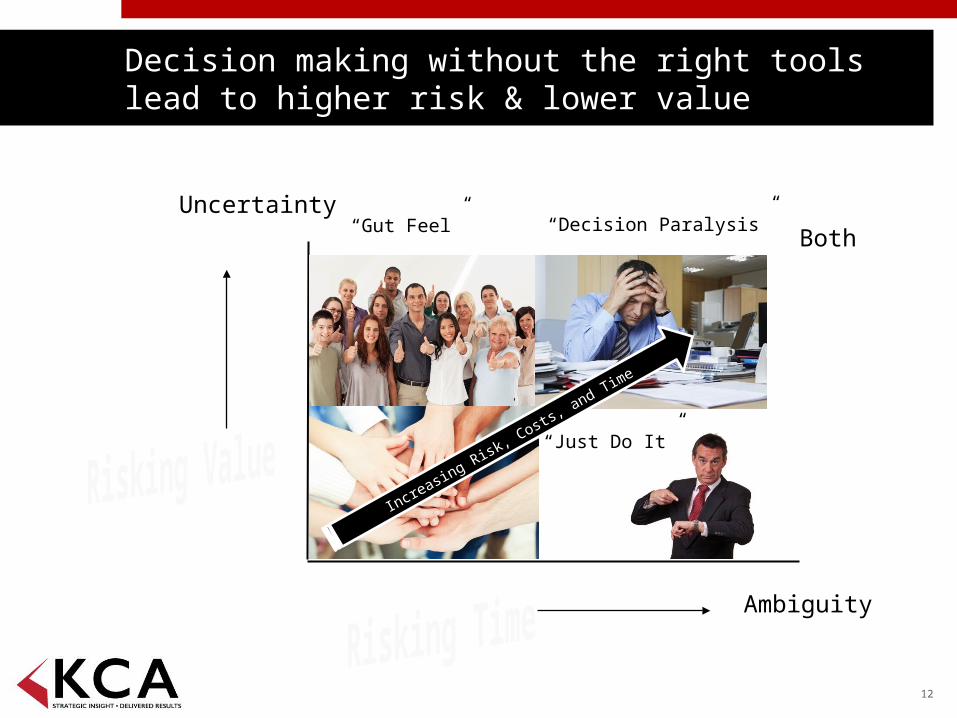
Decision making without the right tools lead to higher risk & lower value
Uncertainty
Ambiguity
Both
Increasing Risk
, Costs
, and Tim
e
“Gut Feel” “Decision Paralysis”
“Just Do It”
13
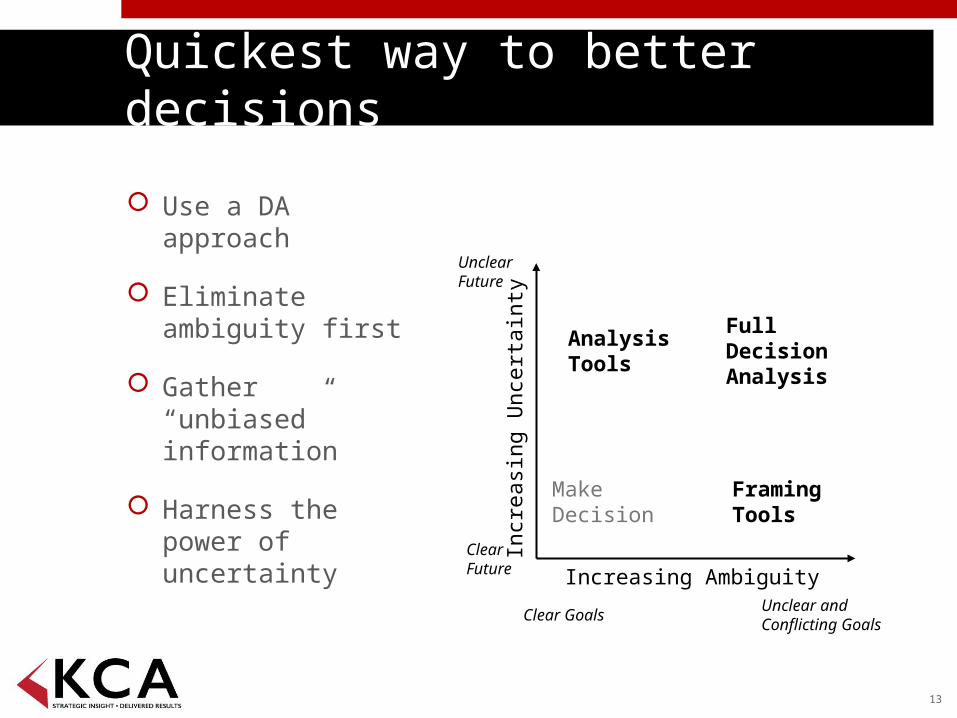
Quickest way to better decisions
Use a DA approach
Eliminate ambiguity first
Gather “unbiased” information
Harness the power of uncertainty
Increasing Ambiguity
Incr
easi
ng U
ncer
tain
tyMakeDecision
FramingTools
AnalysisTools
FullDecisionAnalysis
Clear GoalsUnclear andConflicting Goals
ClearFuture
UnclearFuture
14
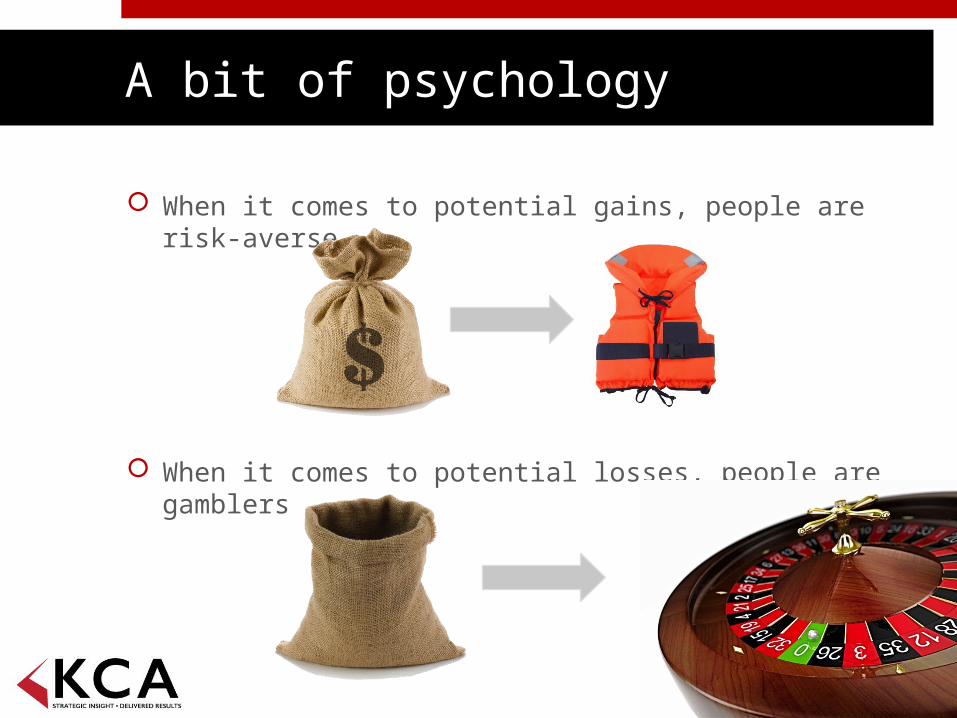
A bit of psychology
When it comes to potential gains, people are risk-averse
When it comes to potential losses, people are gamblers
Page 15
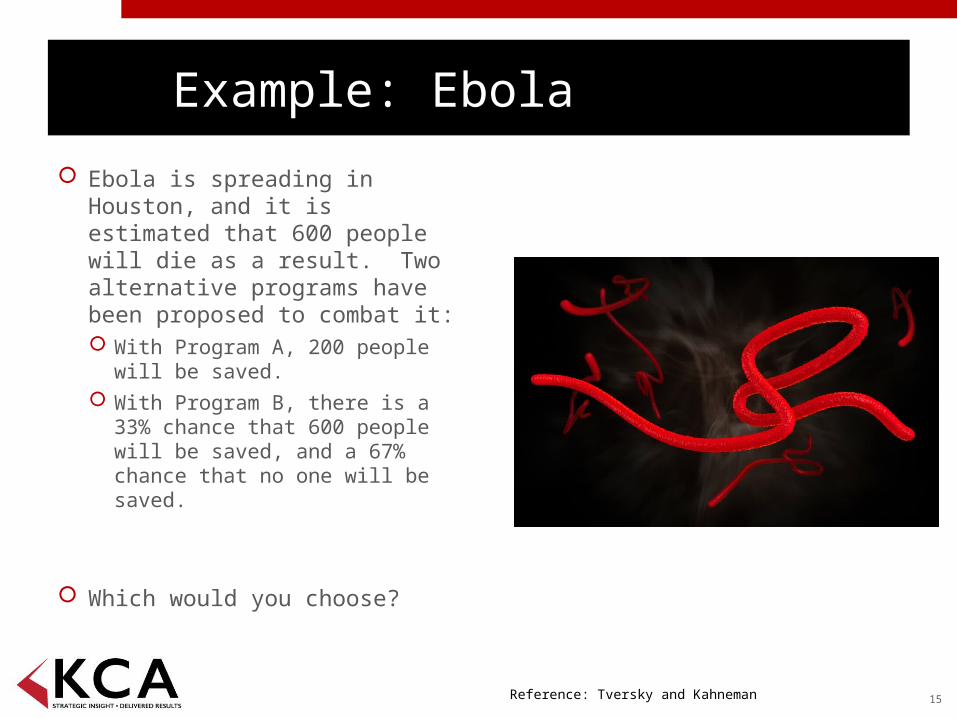
Example: Ebola
Ebola is spreading in Houston, and it is estimated that 600 people will die as a result. Two alternative programs have been proposed to combat it: With Program A, 200 people
will be saved. With Program B, there is a 33%
chance that 600 people will be saved, and a 67% chance that no one will be saved.
Which would you choose?
Reference: Tversky and Kahneman
Page 16
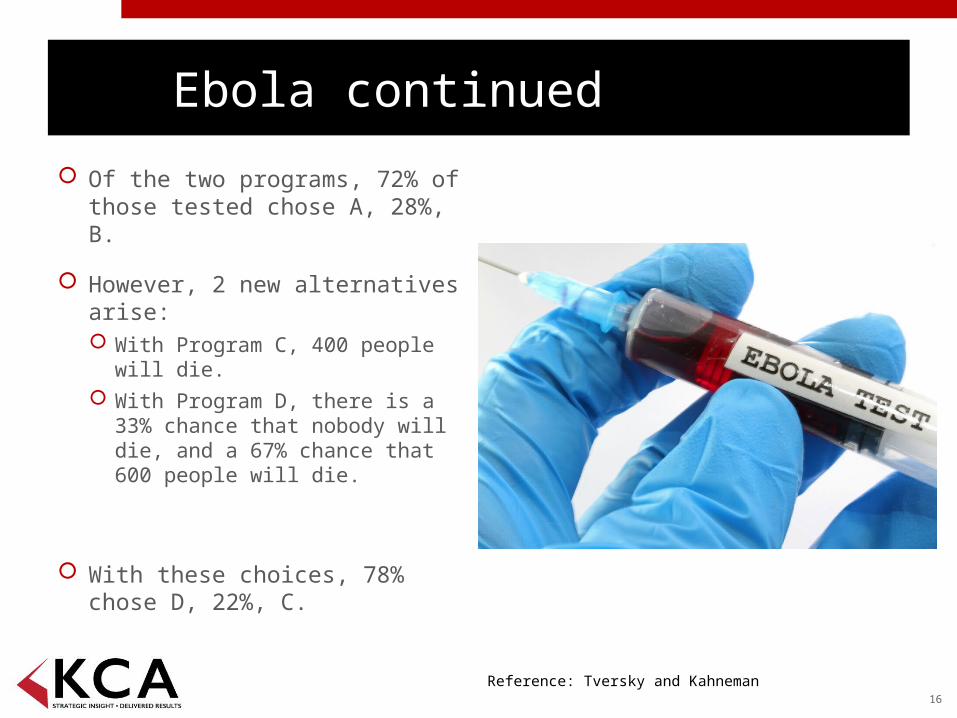
Ebola continued
Of the two programs, 72% of those tested chose A, 28%, B.
However, 2 new alternatives arise: With Program C, 400 people
will die. With Program D, there is a
33% chance that nobody will die, and a 67% chance that 600 people will die.
With these choices, 78% chose D, 22%, C.
Reference: Tversky and Kahneman
17
The Framing phenomenon
If a project, decision, choice, situation, etc. is framed in terms of potential gains, most people are risk-averse
If the exact same project, decision, etc. is framed in terms of potential losses, most people become risk-seeking
Page 18
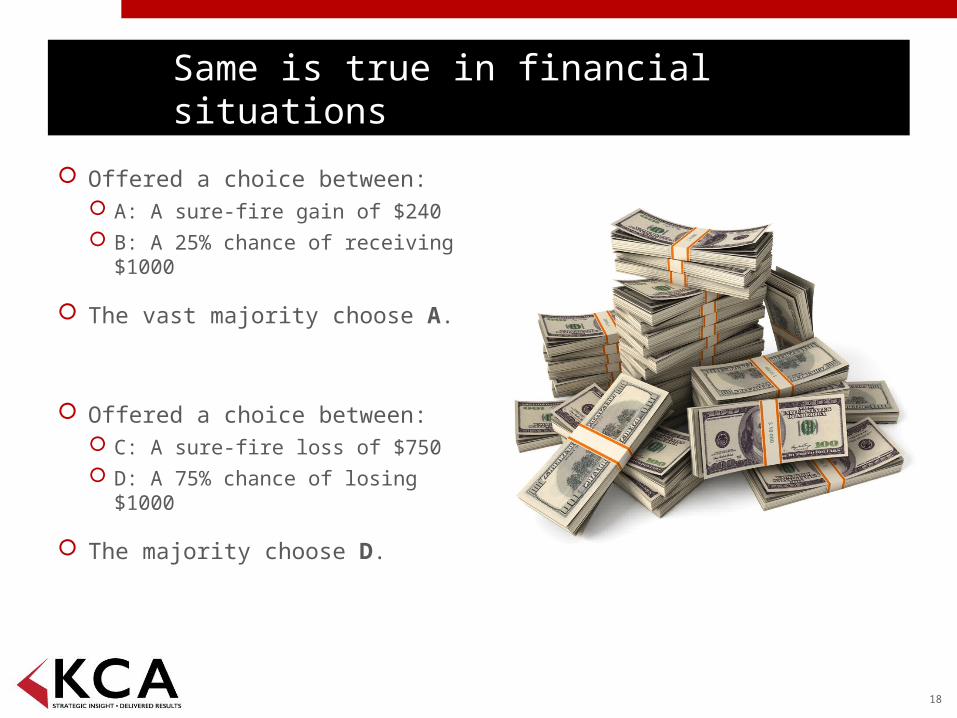
Same is true in financial situations
Offered a choice between: A: A sure-fire gain of $240 B: A 25% chance of receiving
$1000
The vast majority choose A.
Offered a choice between: C: A sure-fire loss of $750 D: A 75% chance of losing
$1000
The majority choose D.
19
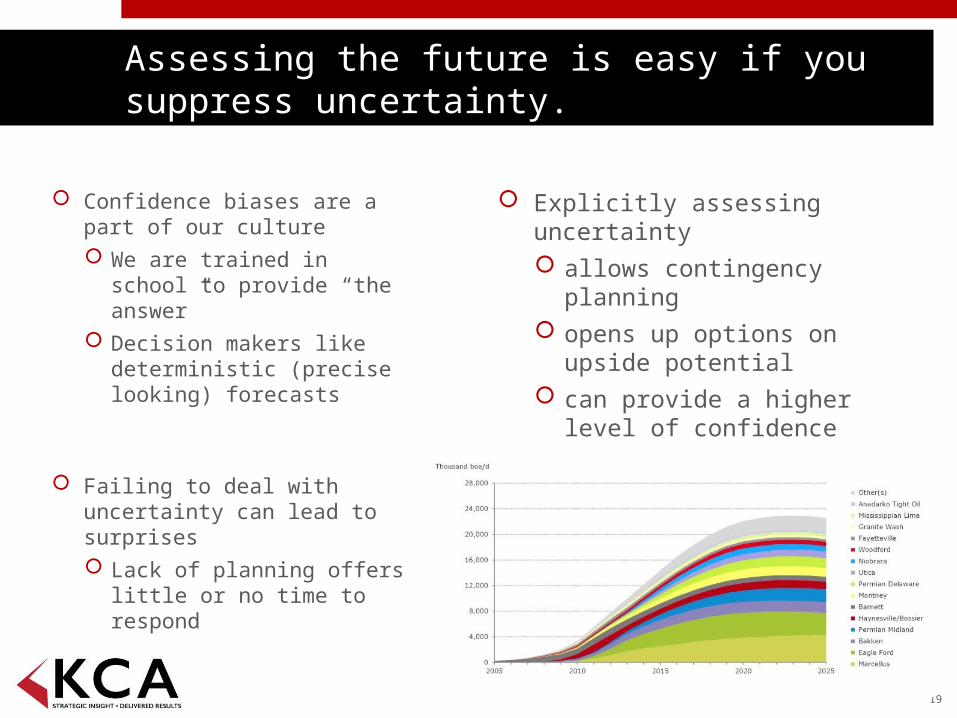
Assessing the future is easy if you suppress uncertainty.
Confidence biases are a part of our culture We are trained in school
to provide “the answer” Decision makers like
deterministic (precise looking) forecasts
Failing to deal with uncertainty can lead to surprises Lack of planning offers
little or no time to respond
Explicitly assessing uncertainty allows contingency
planning opens up options on
upside potential can provide a higher
level of confidence
20
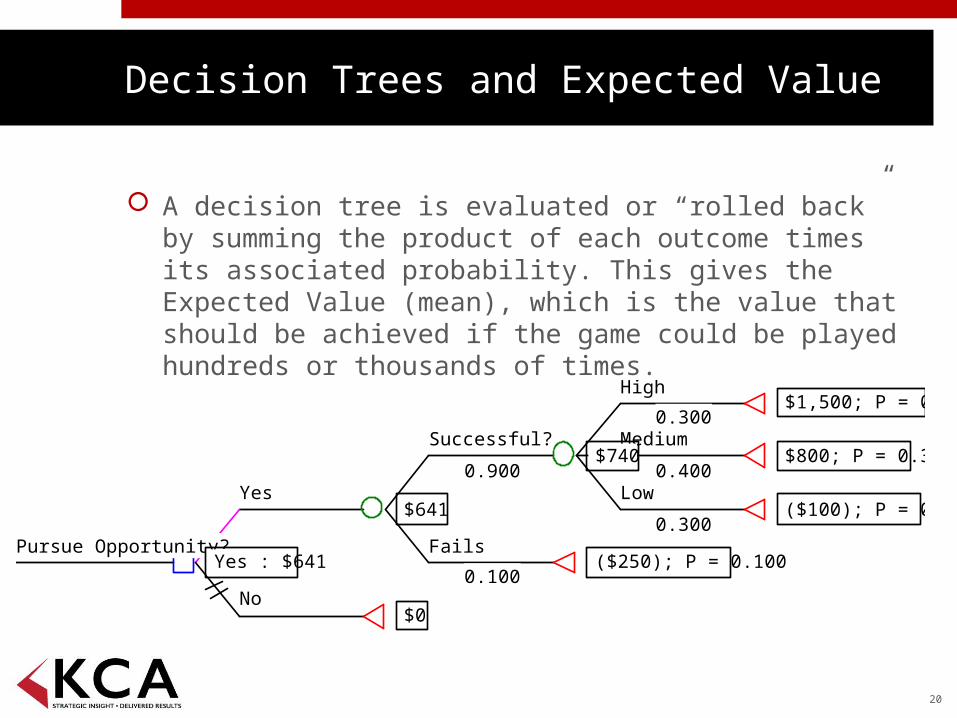
Decision Trees and Expected Value
A decision tree is evaluated or “rolled back” by summing the product of each outcome times its associated probability. This gives the Expected Value (mean), which is the value that should be achieved if the game could be played hundreds or thousands of times.
High
0.300$1,500; P = 0.270
Medium
0.400$800; P = 0.360
Low
0.300($100); P = 0.270
Successful?
0.900$740
Fails
0.100($250); P = 0.100
Yes$641
No$0
Pursue Opportunity?Yes : $641
21
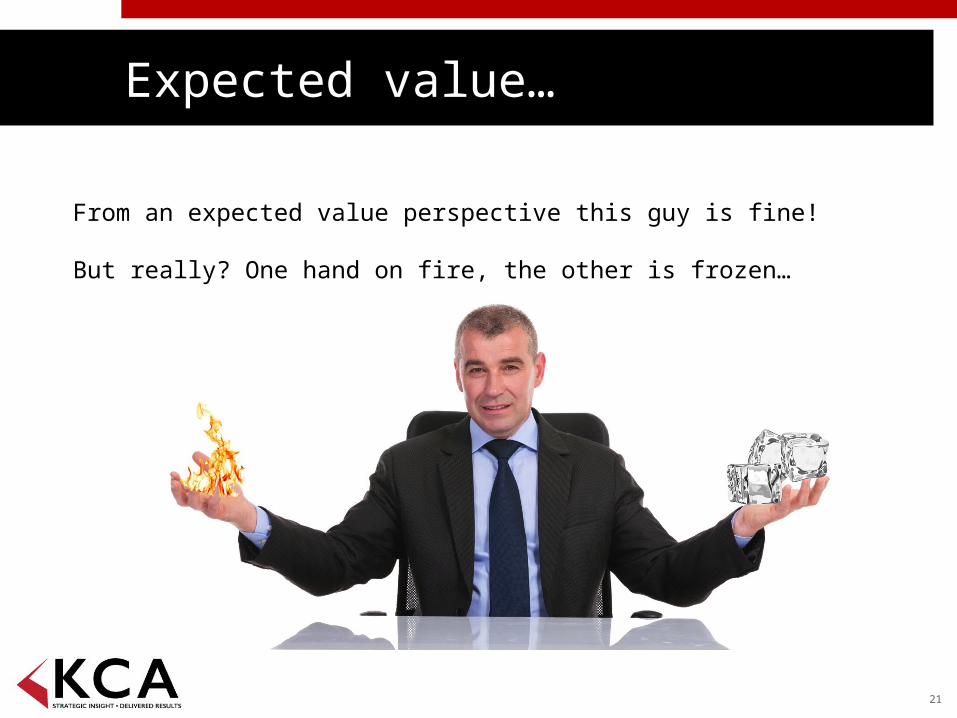
Expected value…
From an expected value perspective this guy is fine!
But really? One hand on fire, the other is frozen…
22
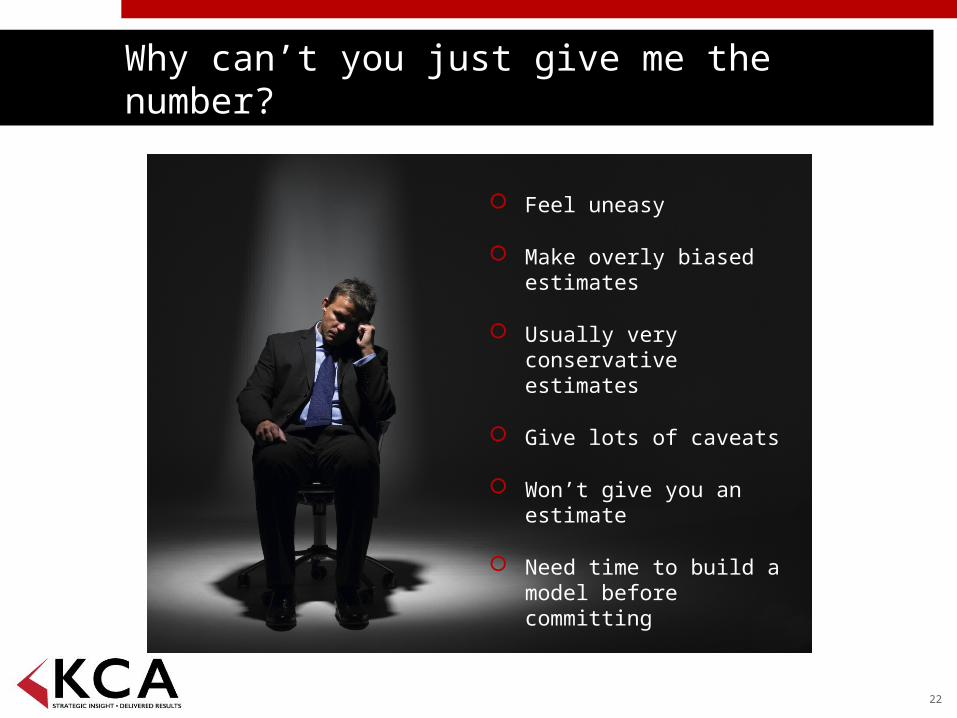
Why can’t you just give me the number?
Feel uneasy
Make overly biased estimates
Usually very conservative estimates
Give lots of caveats
Won’t give you an estimate
Need time to build a model before committing
23
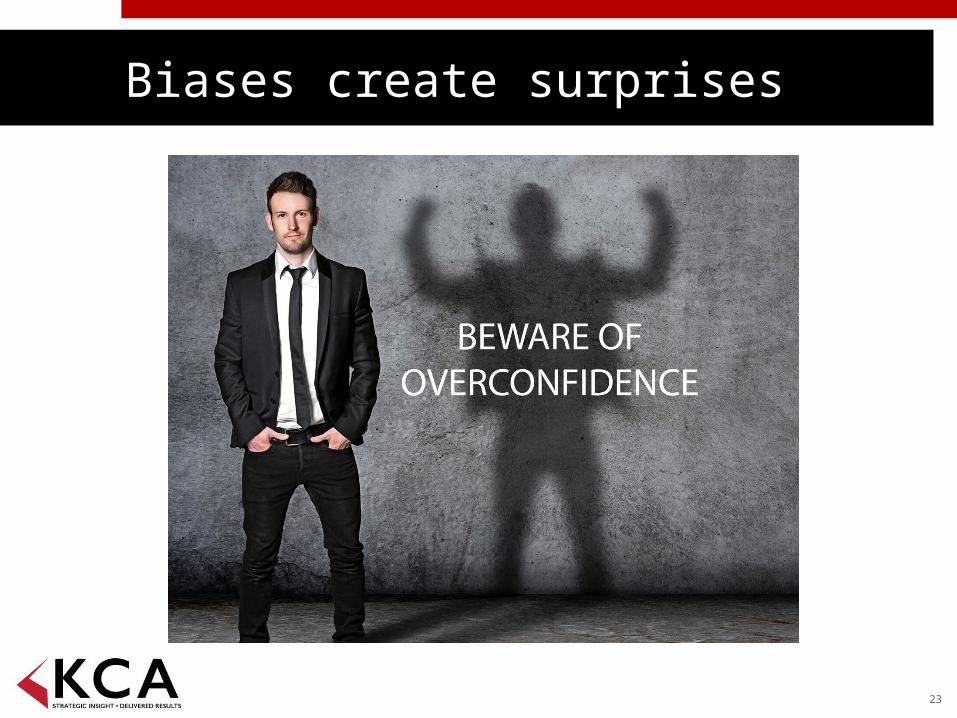
Biases create surprises
24
Anchoring is the worst bias
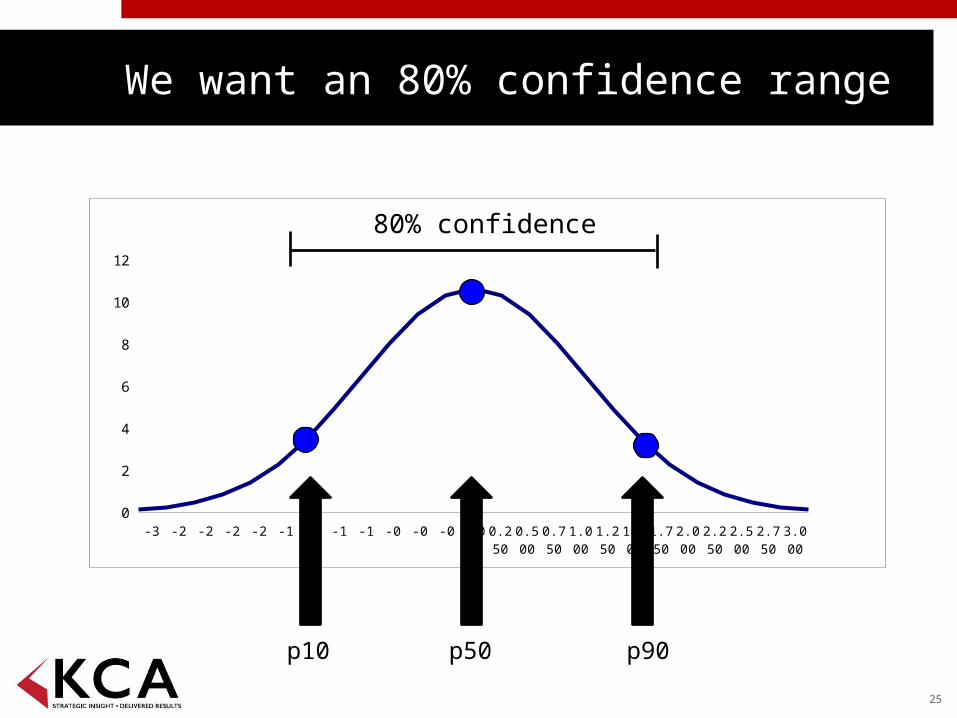
We want an 80% confidence range
25
-3.00
0
-2.75
0
-2.50
0
-2.25
0
-2.00
0
-1.75
0
-1.50
0
-1.25
0
-1.00
0
-0.75
0
-0.50
0
-0.25
0
0.000
0.250
0.500
0.750
1.000
1.250
1.500
1.750
2.000
2.250
2.500
2.750
3.000
0
2
4
6
8
10
12
80% confidence
p10 p50 p90
26
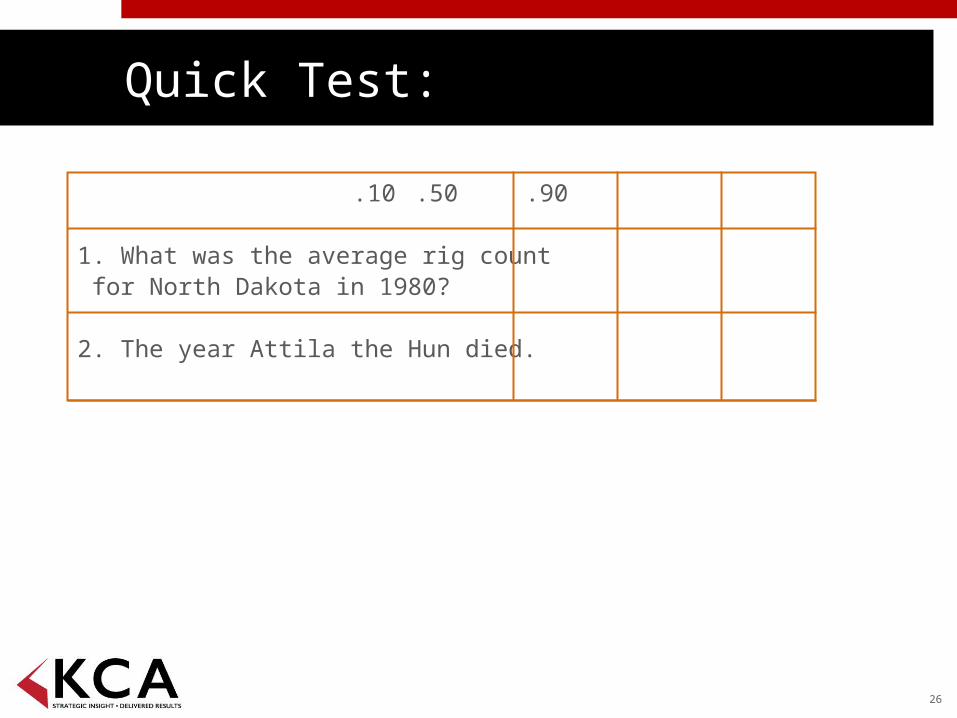
Quick Test:
.10 .50 .90
1. What was the average rig count for North Dakota in 1980?
2. The year Attila the Hun died.
27
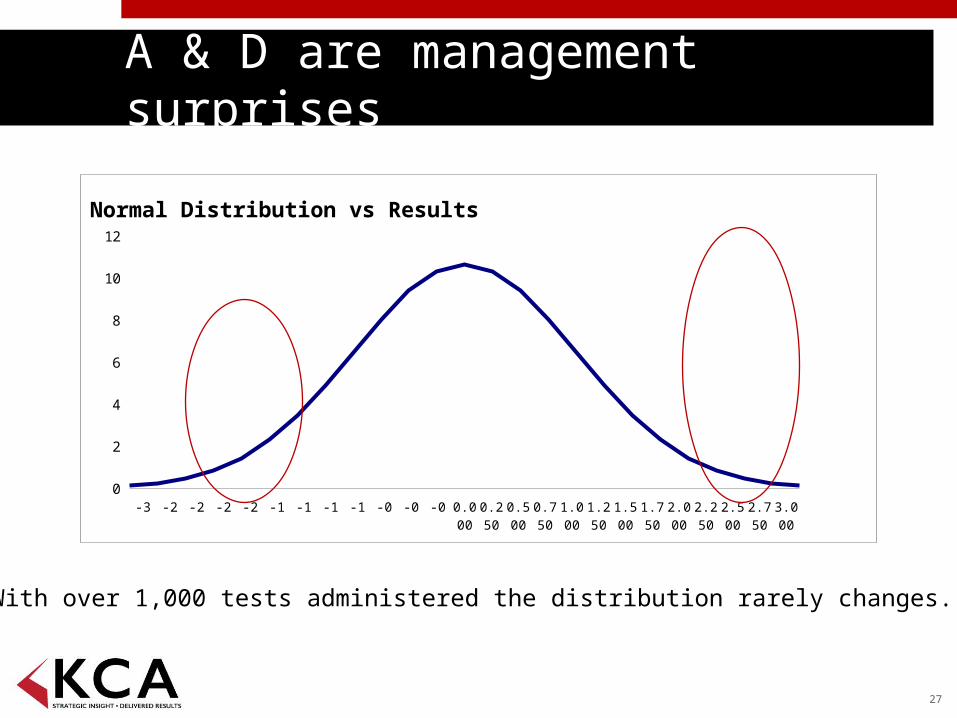
A & D are management surprises
-3.00
0
-2.75
0
-2.50
0
-2.25
0
-2.00
0
-1.75
0
-1.50
0
-1.25
0
-1.00
0
-0.75
0
-0.50
0
-0.25
0
0.000
0.250
0.500
0.750
1.000
1.250
1.500
1.750
2.000
2.250
2.500
2.750
3.000
0
2
4
6
8
10
12
Normal Distribution vs Results
With over 1,000 tests administered the distribution rarely changes.
28
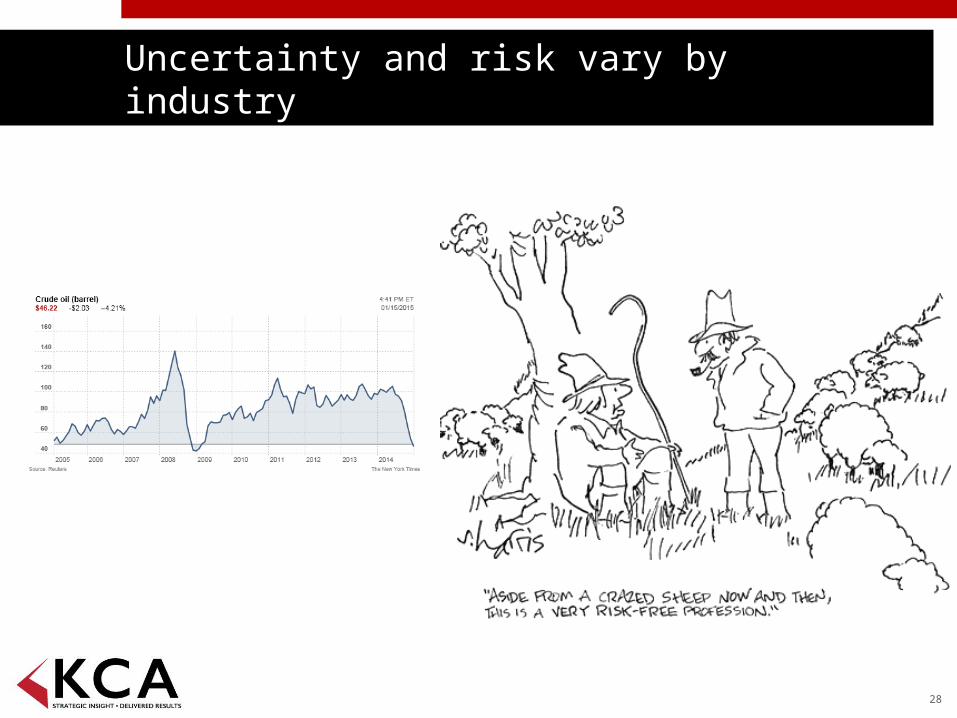
Uncertainty and risk vary by industry
29
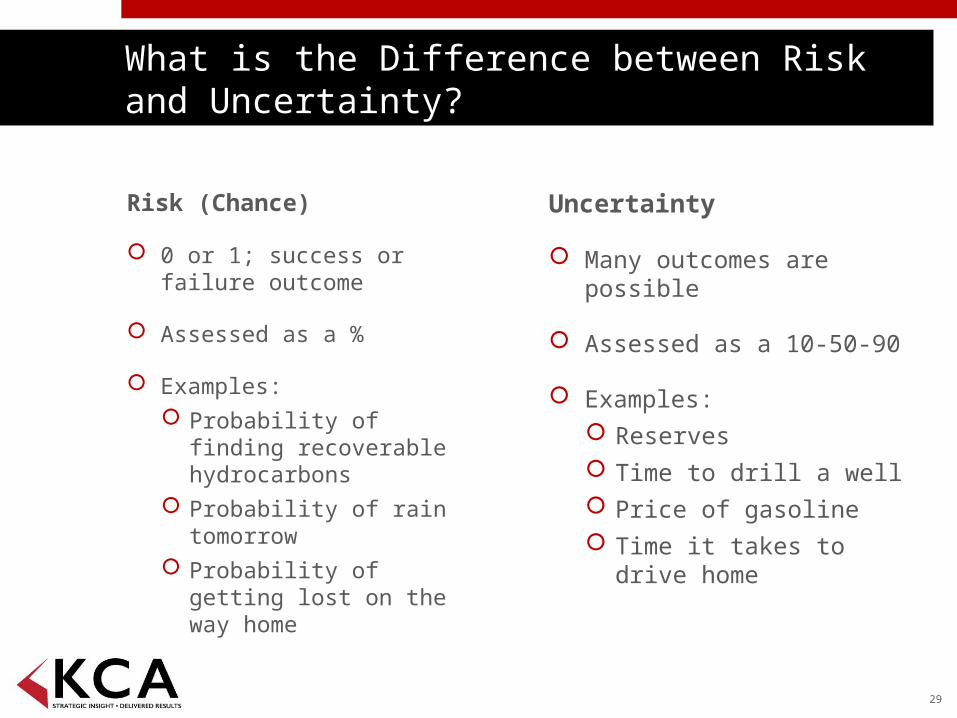
What is the Difference between Risk and Uncertainty?
Risk (Chance)
0 or 1; success or failure outcome
Assessed as a %
Examples: Probability of finding
recoverable hydrocarbons
Probability of rain tomorrow
Probability of getting lost on the way home
Uncertainty
Many outcomes are possible
Assessed as a 10-50-90
Examples: Reserves Time to drill a well Price of gasoline Time it takes to drive
home
30
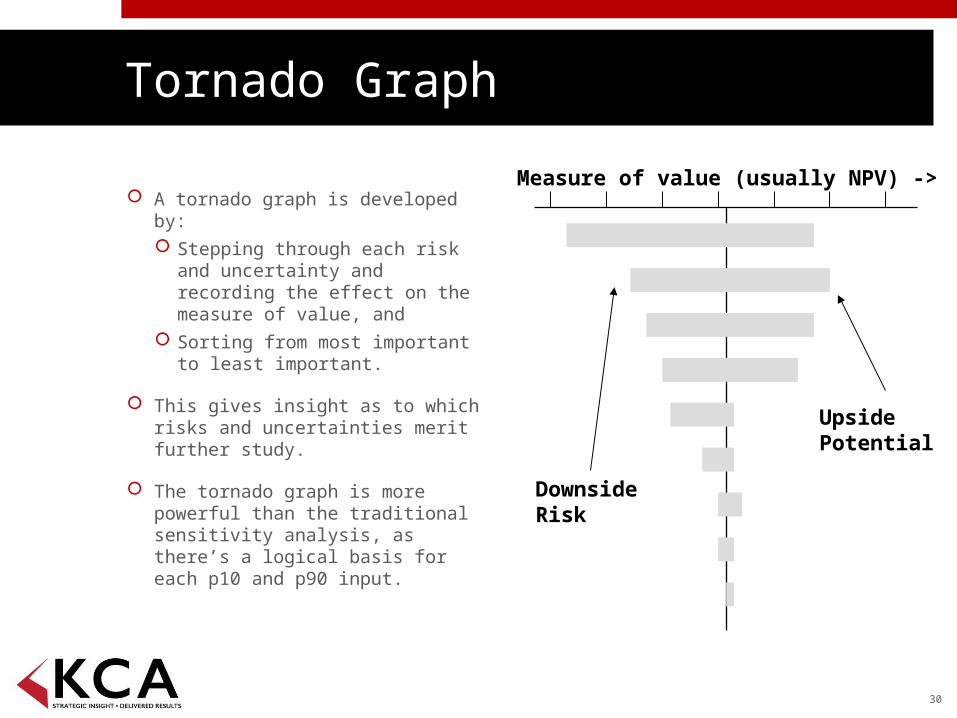
Tornado Graph
A tornado graph is developed by: Stepping through each risk
and uncertainty and recording the effect on the measure of value, and
Sorting from most important to least important.
This gives insight as to which risks and uncertainties merit further study.
The tornado graph is more powerful than the traditional sensitivity analysis, as there’s a logical basis for each p10 and p90 input.
Measure of value (usually NPV) ->
DownsideRisk
UpsidePotential
31
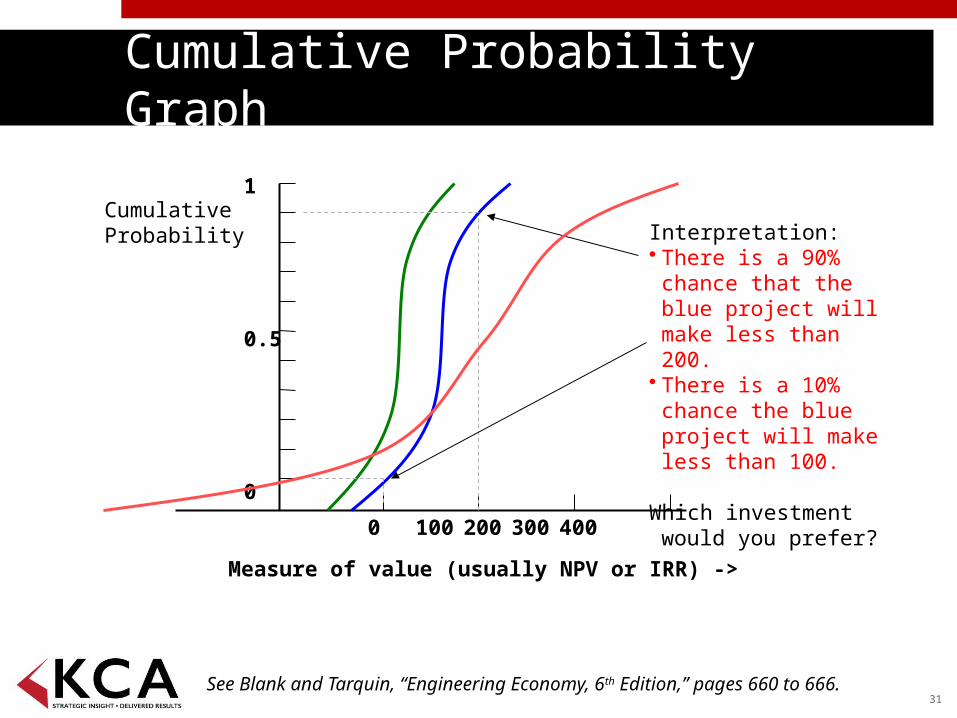
Cumulative Probability Graph
Measure of value (usually NPV or IRR) ->
1
0.5
0
0 100 200 300 400
Interpretation:• There is a 90% chance
that the blue project will make less than 200.
• There is a 10% chance the blue project will make less than 100.
Which investment would you prefer?
CumulativeProbability
See Blank and Tarquin, “Engineering Economy, 6th Edition,” pages 660 to 666.
32
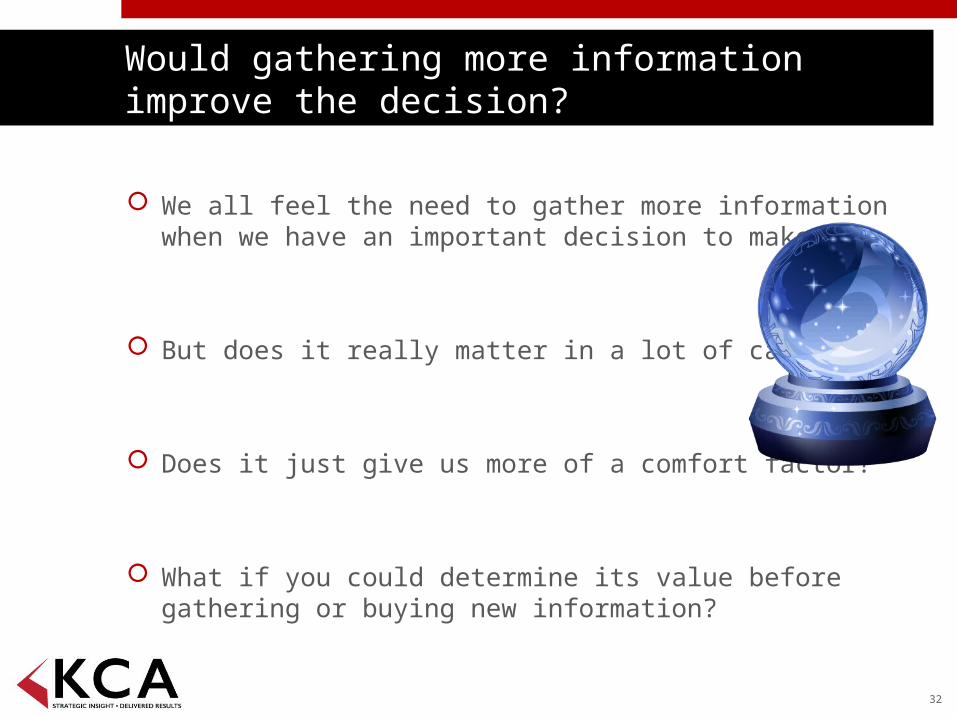
Would gathering more information improve the decision?
We all feel the need to gather more information when we have an important decision to make.
But does it really matter in a lot of cases?
Does it just give us more of a comfort factor?
What if you could determine its value before gathering or buying new information?
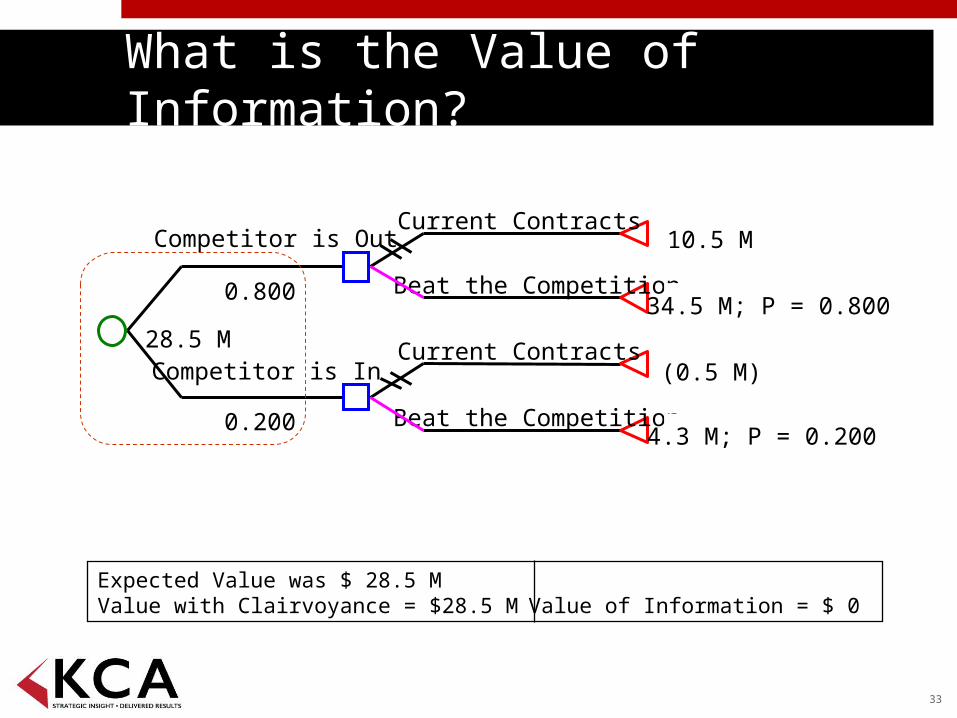
What is the Value of Information?
33
Expected Value was $ 28.5 MValue with Clairvoyance = $28.5 M Value of Information = $ 0
Current Contracts10.5 M
Beat the Competition34.5 M; P = 0.800
Competitor is Out
0.800
Current Contracts(0.5 M)
Beat the Competition4.3 M; P = 0.200
Competitor is In
0.200
28.5 M
While it is good to know the future, it is even better to control it.
34
Value of Information can help you to understand the trade-offs of gathering more information.
Value of Control can provide you with a quantitative value for taking certain actions to control your outcome.
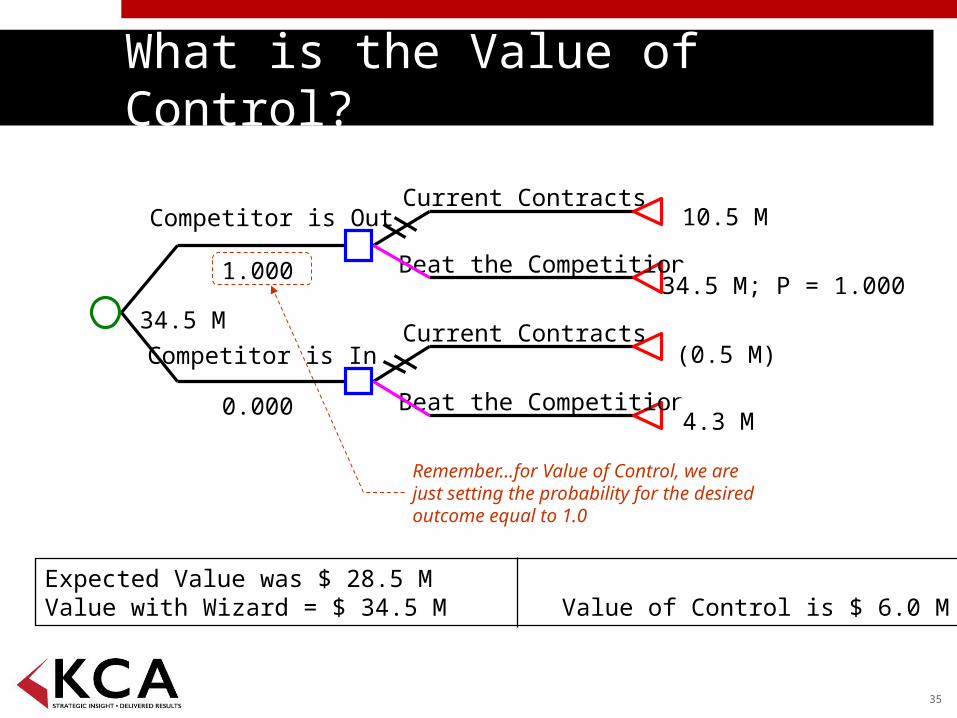
What is the Value of Control?
35
Expected Value was $ 28.5 MValue with Wizard = $ 34.5 M Value of Control is $ 6.0 M
Remember…for Value of Control, we are just setting the probability for the desired outcome equal to 1.0
Current Contracts10.5 M
Beat the Competition34.5 M; P = 1.000
Competitor is Out
1.000
Current Contracts(0.5 M)
Beat the Competition4.3 M
Competitor is In
0.000
34.5 M