Embed Size (px)
Citation preview

Making science speak to policy and practice:
An introduction to the difficulties that exist on the road from scientific evidence to practice outlining current
developments, challenges and opportunities. Speaker: Michael Farrell, National Addiction Centre,
London, UK

… from Faith to Science …

Political and moral values of the social system
Research Evidence
SERVICE Provider AND USER VIEW
A model for evidence-based clinical decisions(from Haynes et al, 1996)

Policy Development
• Identifying Need, • Identify options for effective interventions• No single option effective• Define balance of options• Consultation process with stakeholders to
develop new approaches.• Translate new knowledge into developmental
practice• Into mainstream clinical practice

Scientific Development
• Importance of investment in basic biological research, neuroscience, molecular genetics, development of new agents for treatment.
• Investment in other types of treatment,
• And psychosocial interventions.
• Social policy evaluation

Challenge of technology transfer
• Some basic science increases theoretical understanding but gap when it comes to application, thus the bench to bedside gap can be very large
• Application of new policies and treatment can take a very long time to be put in place, anything from 10 years to 30 years
• Problem that life span of policy officials often much shorter than that

Copyright ©2000 BMJ Publishing Group Ltd.
Peto, R. et al. BMJ 2000;321:323-329
Prevalence of smoking, 1950 thru 2000

Copyright ©1994 BMJ Publishing Group Ltd.
Townsend, J et al. BMJ 1994;309:923-927
FIG 2 - Prevalence of smoking in British men and women during 1961-91 by socioeconomic group. (From Wald and Nicolaides Bouman3

Copyright ©1994 BMJ Publishing Group Ltd.
Townsend, J et al. BMJ 1994;309:923-927
FIG 1 - Relation between consumption (pounds sterling billion at 1992 prices) and real price (1992=1.0) of cigarettes in Britain during 1972-92. (From Office of Population Censuses and
Surveys2)

0
1
2
3
4
5
6
7
8
9
10
Lit
res
pu
re a
lco
ho
l
1948 1952 1956 1960 1964 1968 1972 1976 1980 1984 1988 1992 1998 2002
UK per capita alcohol consumption 1948-2003: on the watch of the NHS
Spirits
PreMix
Wine
Cider
Beer

a) Males age 15-44 years
0
2
4
6
8
10
12
14
16
18
1950 1960 1970 1980 1990 2000
Time-trends in liver cirrhosis age-standardised mortality rates per 100,000 by age group, sex and country 1950-2002 (Leon & McCambridge, Lancet, 2006)
c) Males age 45-64 years
0
10
20
30
40
50
60
70
80
1950 1960 1970 1980 1990 2000
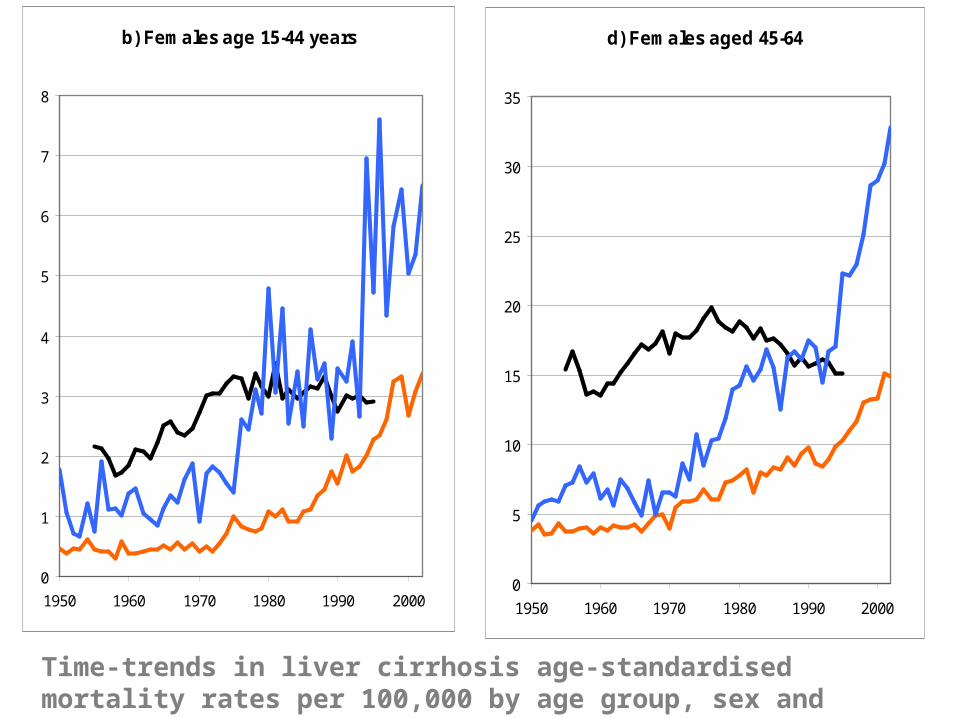
b) Females age 15-44 years
0
1
2
3
4
5
6
7
8
1950 1960 1970 1980 1990 2000
Time-trends in liver cirrhosis age-standardised mortality rates per 100,000 by age group, sex and country 1950-2002 (Leon & McCambridge, Lancet, 2006)
d) Females aged 45-64
0
5
10
15
20
25
30
35
1950 1960 1970 1980 1990 2000

Options in drug policy
• Prevention
• Demand Reduction
• Supply Reduction
• Treatment
• Demand Reduction

Implementation of Substitution Treatment
• Dole studies published 1968• First roll out US 1973, faltered• Low level provision until late 1980s AIDs
driven change especially Spain• France obstacle 73 people in treatment
from 68 to 93 intoduced Buprenorphine• Slow change in Asia• Heroin prescription Swiss studies, gradual
change Germany, Netherlands, UK

Implementation
• Mass public health provision versus pilot level small population provision
• Challenge to Implement properly• Need for outcome data to convince • After implmentation need for outcome data
to determine impact, limited information on most effective approach to large scale delivery,
• Prisons major challenge

10-year trend in the number of substitution treatment clients in Europe (EU-15)
73,400
207,000
265,000
351,000
537,000
0
100,000
200,000
300,000
400,000
500,000
600,000
1993 1995 1997 2000 2003
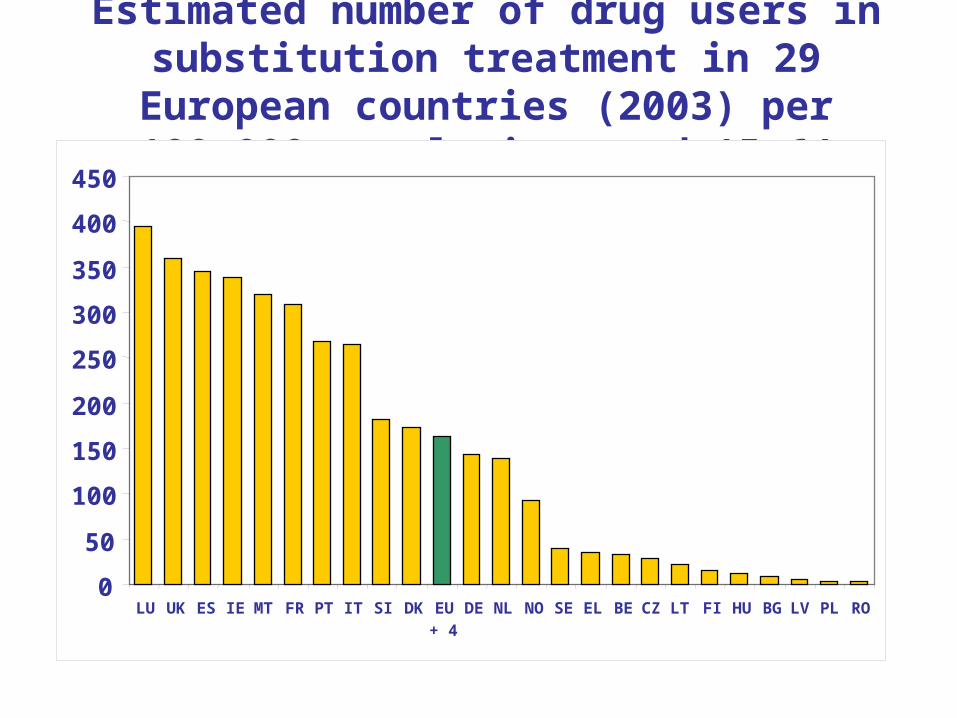
Estimated number of drug users in substitution treatment in 29 European
countries (2003) per 100.000 population aged 15-64
0
50
100
150
200
250
300
350
400
450
LU UK ES IE MT FR PT IT SI DK EU
+ 4
DE NL NO SE EL BE CZ LT FI HU BG LV PL RO
QUESTION
• WHAT IS THE TIME PERIOD OF INCREASED RISK FOR DRUG RELATED DEATH AFTER RELEASE FROM PRISON
• FOR MALES AND SEPARATELY FOR FEMALES
• 2WEEKS• ONE MONTH• THREE MONTHS

Post-release mortality rates (males)Farrell & Marsden [2008] n = 36,515
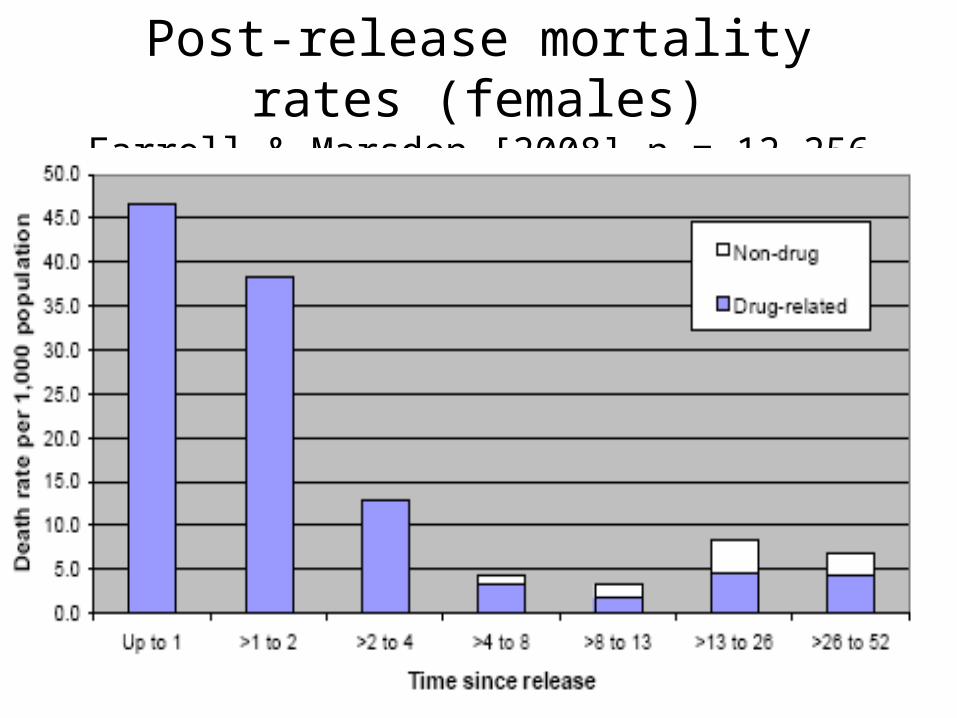
Post-release mortality rates (females)Farrell & Marsden [2008] n = 12,256

Post-release mortality
• 20- to 50-fold increase in drug-related deaths in the 1st week after release– drops by 50% / week – plateaus at 4 weeks
• Odds of drug-related death in 1st wk post-release– Among women
• > 10 x that observed at 52 wks (OR 10.6; 95 %CI 4.8-22.0) • 70 x that in age-matched population
– Among men• ~ 8 x that observed at 52 weeks (OR 8.3: 95 %CI 5.0-13.3). • 30 x that in age-matched population
Seaman et al 1996; Bird et al 2003; Singleton, Farrell, Marsden et al 2003; Farrell, Marsden (50,000 releases). Addiction 2008; Stewart et al (2004) Western Aus; Graham (2004) Victoria; Singleton, Farrell et al


Countries involved in prison substitution Treatment
Spain France Germany Denmark Ireland

NHS STRUCTURES
• NIHR Health Technology Assessment
• National Institute for Clinical Effectiveness
• National Treatment Agency
• Clinical Guidelines for the management of Drug Dependence

NICE
• NICE produces guidance in three areas of health:
• public health - guidance on the promotion of good health and the prevention of ill health for those working in the NHS, local authorities and the wider public and voluntary sector
• health technologies - guidance on the use of new and existing medicines, treatments and procedures within the NHS
• clinical practice - guidance on the appropriate treatment and care of people with specific diseases and conditions within the NHS.

NICE
Decision making process
Incorporates Cochrane Evidence Base
Conducts on metanalysis
Becomes more complex as areas of review broaden,
Major controversies, on oncology care and dementiae care.