Embed Size (px)
Citation preview
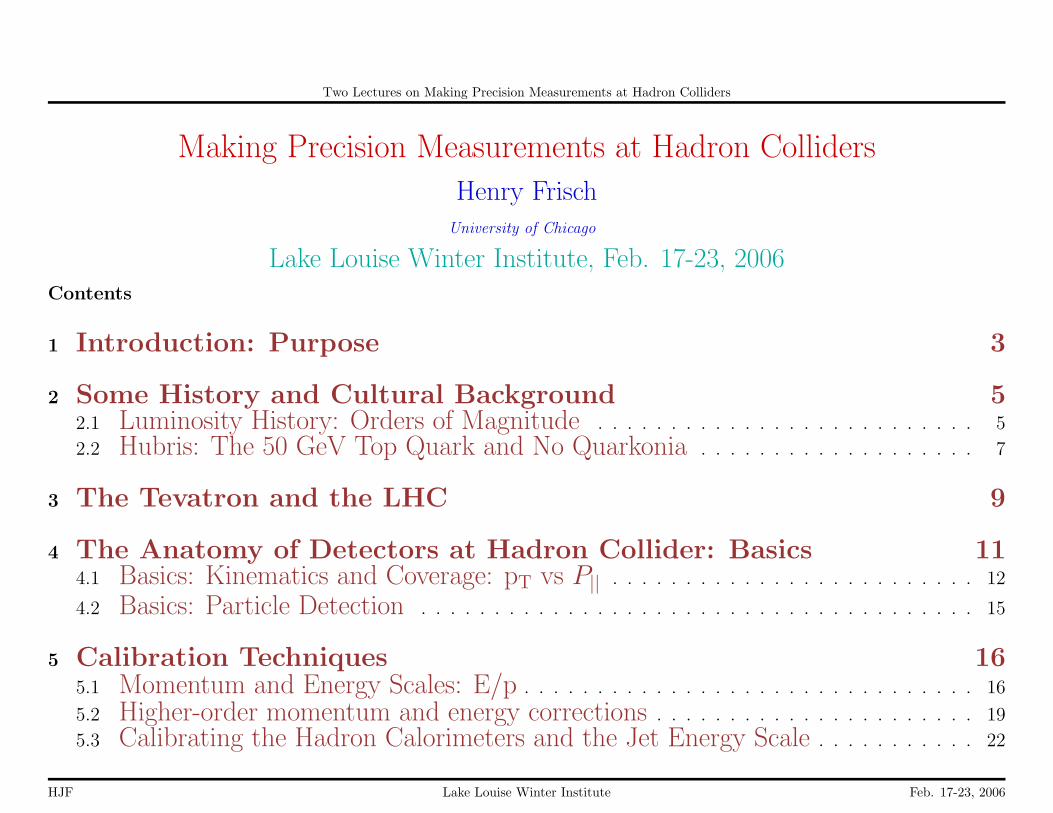
Two Lectures on Making Precision Measurements at Hadron Colliders
Making Precision Measurements at Hadron Colliders
Henry FrischUniversity of Chicago
Lake Louise Winter Institute, Feb. 17-23, 2006Contents
1 Introduction: Purpose 3
2 Some History and Cultural Background 52.1 Luminosity History: Orders of Magnitude . . . . . . . . . . . . . . . . . . . . . . . . . . 5
2.2 Hubris: The 50 GeV Top Quark and No Quarkonia . . . . . . . . . . . . . . . . . . . 7
3 The Tevatron and the LHC 9
4 The Anatomy of Detectors at Hadron Collider: Basics 114.1 Basics: Kinematics and Coverage: pT vs P|| . . . . . . . . . . . . . . . . . . . . . . . . . 12
4.2 Basics: Particle Detection . . . . . . . . . . . . . . . . . . . . . . . . . . . . . . . . . . . . . . 15
5 Calibration Techniques 165.1 Momentum and Energy Scales: E/p . . . . . . . . . . . . . . . . . . . . . . . . . . . . . . . 16
5.2 Higher-order momentum and energy corrections . . . . . . . . . . . . . . . . . . . . . . 19
5.3 Calibrating the Hadron Calorimeters and the Jet Energy Scale . . . . . . . . . . . 22
HJF Lake Louise Winter Institute Feb. 17-23, 2006
Two Lectures on Making Precision Measurements at Hadron Colliders
6 W and Z0Production as Archetypes 25
7 ‘QCD’- Jet Production, Quark and Gluons, ISR, FSR 28
8 The MTop −MW Plane and the Higgs Mass 348.1 Motivation . . . . . . . . . . . . . . . . . . . . . . . . . . . . . . . . . . . . . . . . . . . . . . . . . . 348.2 What limits the precision on the W mass and the top mass measurements? . 34
9 Measuring the Top Quark Mass and Cross-section 399.1 tt̄ Production: Measuring the Top Cross-section Precisely . . . . . . . . . . . . . . . 39
9.2 Total Cross-section for tt̄ Production: Parsing the CDF and DØ Plots . . . . . 41
9.3 Properties of the tt̄ system . . . . . . . . . . . . . . . . . . . . . . . . . . . . . . . . . . . . . . 46
9.4 Precision Measurement of the Top Mass . . . . . . . . . . . . . . . . . . . . . . . . . . . . 48
9.5 CDF Templates in Mtop and Mjj (2D) in Lepton+Jets . . . . . . . . . . . . . . . . 49
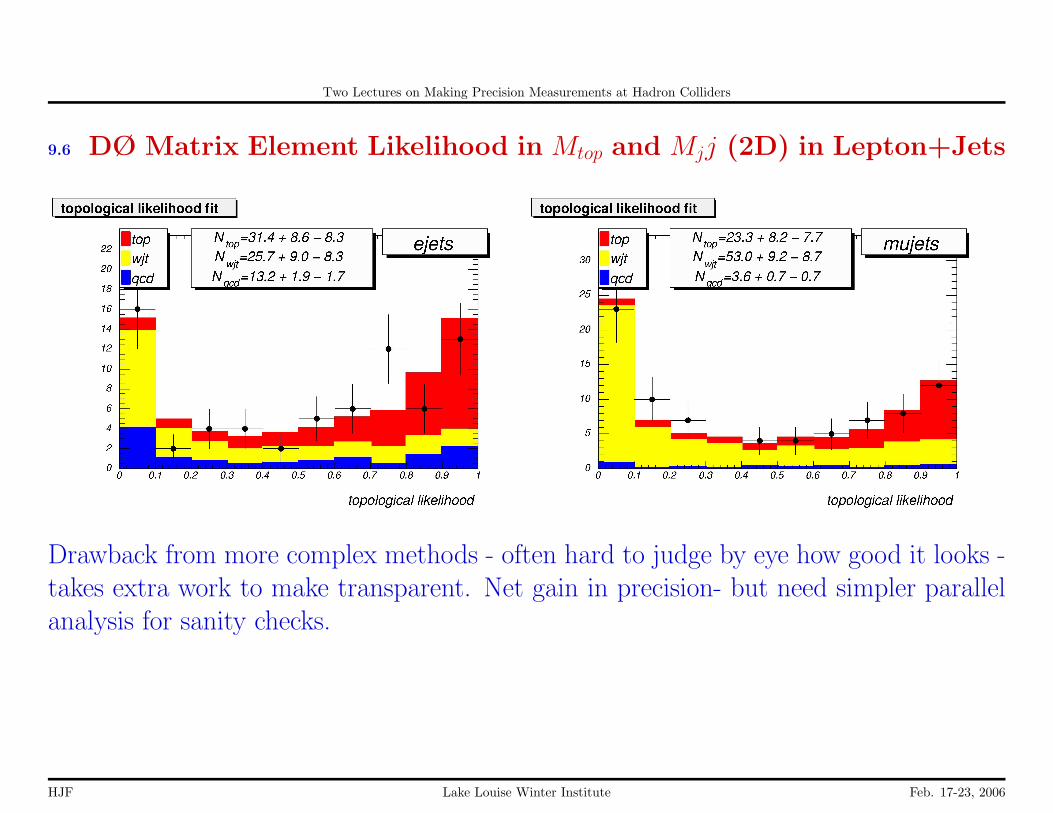
9.6 DØ Matrix Element Likelihood in Mtop and Mjj (2D) in Lepton+Jets . . . . . 51
10 Credits 55
HJF Lake Louise Winter Institute Feb. 17-23, 2006
Two Lectures on Making Precision Measurements at Hadron Colliders
Lecture I: The Electroweak Scale: Top, the W and Z, and the Higgs via MW and Mtop
1 Introduction: Purpose
These two lectures are purely pedagogical. My intent is to enable non-experts to getsomething out of the individual presentations on collider physics that will follow- theHiggs, the W,Z, top, searches for SUSY, LED’s, etc. We are presented with so manymeasurements and so much detail that we often forget that we are talking about instru-ments and the measurements they have made. The suprise is how precise the detectorsthemselves are; the challenge will be to exploit that precision in the regime where statis-tics is no longer a problem, and everything is dominated by the performance of thedetector (‘systematics’).
This challenge also extends to the theoretical community- to look for something newwe will need to understand the non-new, i.e. the SM predictions, at an unprecedentedlevel of precision. Some amount of this can be done with control samples- it is alwaysbest to use data rather than Monte Carlo, but it’s not always possible. The detectorsare already better than the theoretical predictions- the theory community needs to catchup.
HJF Lake Louise Winter Institute Feb. 17-23, 2006

Two Lectures on Making Precision Measurements at Hadron Colliders
Problems in Making Precision Measurements
The emphasis here will be more on problems to be addressed than on new results.I work on CDF, and have used mostly CDF plots just because I know the details better-the problems however are more general. No slight to DØ or the LHC experiments ismeant. I have cut some corners in places and been a little provocative in others, asteachers will. All views presented here are my own, as is the amateur presentation.
I have intentionally used older public results from CDF and DØ instead of thehot-off-the-press results generated for the 2006 ‘winter conferences’ so as not to stealthe thunder of the invited speakers who are here to present new results from CDF andD0. The idea is to provide the understanding so that you can recognize the evolution ofthe results, ask the hard questions, and to provoke discussion. This is going to be reallydifferent from a raporteur’s talk...
HJF Lake Louise Winter Institute Feb. 17-23, 2006
Two Lectures on Making Precision Measurements at Hadron Colliders
2 Some History and Cultural Background
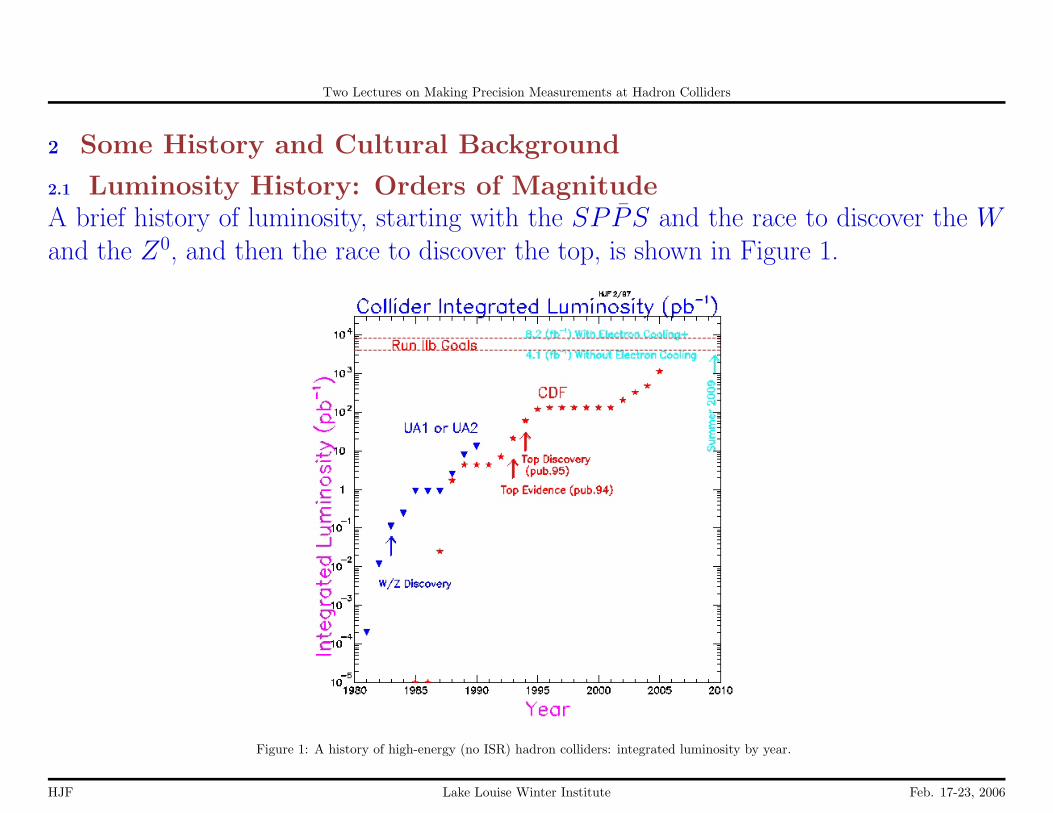
2.1 Luminosity History: Orders of MagnitudeA brief history of luminosity, starting with the SPP̄S and the race to discover the Wand the Z0, and then the race to discover the top, is shown in Figure 1.
Figure 1: A history of high-energy (no ISR) hadron colliders: integrated luminosity by year.
HJF Lake Louise Winter Institute Feb. 17-23, 2006
Two Lectures on Making Precision Measurements at Hadron Colliders
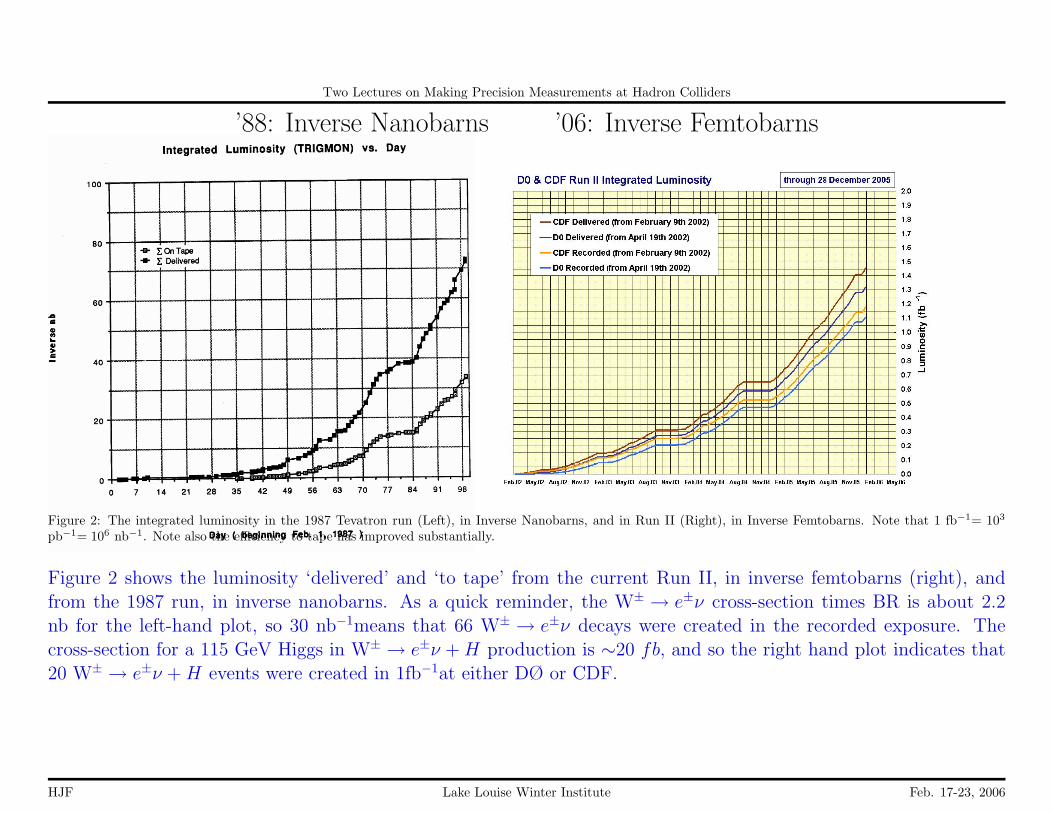
’88: Inverse Nanobarns ’06: Inverse Femtobarns
Figure 2: The integrated luminosity in the 1987 Tevatron run (Left), in Inverse Nanobarns, and in Run II (Right), in Inverse Femtobarns. Note that 1 fb−1= 103
pb−1= 106 nb−1. Note also the efficiency to tape has improved substantially.
Figure 2 shows the luminosity ‘delivered’ and ‘to tape’ from the current Run II, in inverse femtobarns (right), andfrom the 1987 run, in inverse nanobarns. As a quick reminder, the W± → e±ν cross-section times BR is about 2.2nb for the left-hand plot, so 30 nb−1means that 66 W± → e±ν decays were created in the recorded exposure. Thecross-section for a 115 GeV Higgs in W± → e±ν +H production is ∼20 fb, and so the right hand plot indicates that20 W± → e±ν +H events were created in 1fb−1at either DØ or CDF.
HJF Lake Louise Winter Institute Feb. 17-23, 2006

Two Lectures on Making Precision Measurements at Hadron Colliders
2.2 Hubris: The 50 GeV Top Quark and No Quarkonia
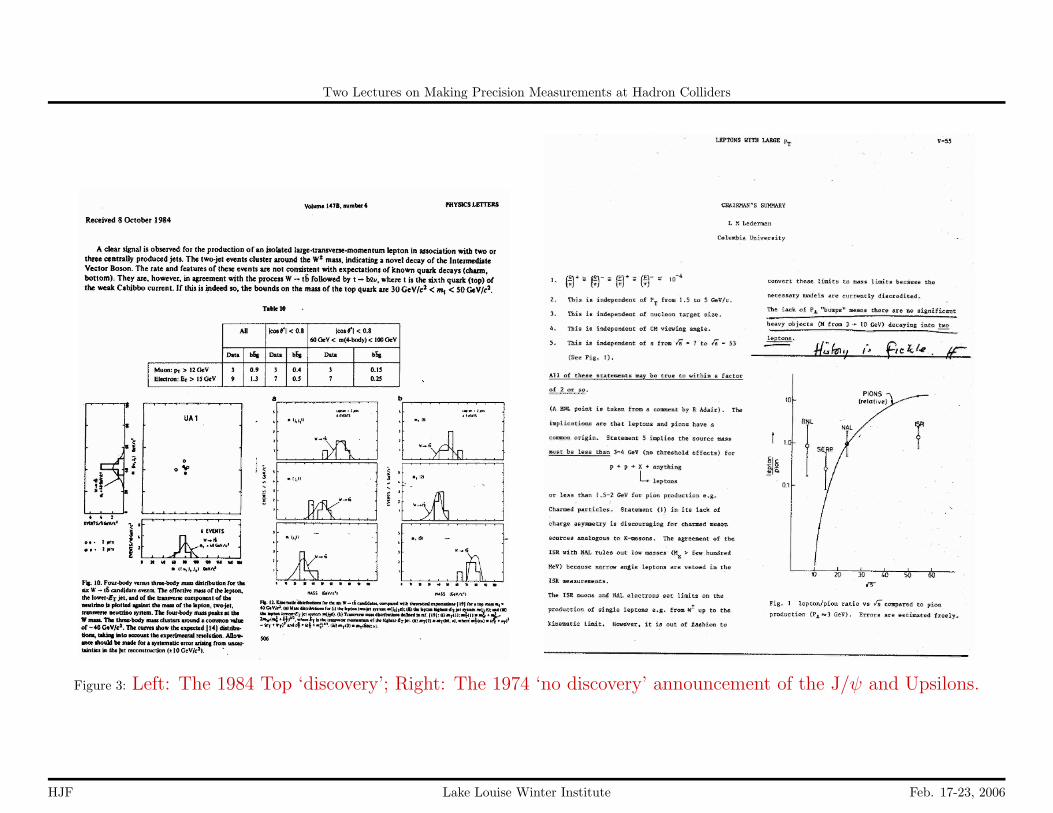
Figure 3 (on next page) is an historical reminder both that we should notbe over-confident about what we know, and that Nature has a rich menuof surprises. The left-hand page is the discovery of something that did notexist- a top quark with mass less than 50 GeV (it was largely W+jets, asshown by Steve Ellis). The right-hand page is a prediction that there areno narrow states with masses between 3 and 10 GeV decaying into leptonpairs (note both these guys did well- they kept looking, and Nature gavethem both more chances!).
(Tell Lederman, Richter and Rubbia story if there’s time... or a question.)
HJF Lake Louise Winter Institute Feb. 17-23, 2006
Two Lectures on Making Precision Measurements at Hadron Colliders
Figure 3: Left: The 1984 Top ‘discovery’; Right: The 1974 ‘no discovery’ announcement of the J/ψ and Upsilons.
HJF Lake Louise Winter Institute Feb. 17-23, 2006

Two Lectures on Making Precision Measurements at Hadron Colliders
3 The Tevatron and the LHC
By now everybody should know about the Tevatron and LHC. I willspare you pictures and boilerplate; The main differences that everybody,including theorists, should know are:
Tevatron LHCParton Source Antiproton-Proton Proton-protonEnergy (TeV) 1.96 (not 2!) 14Peak Luminosity (cm−2s−1) 2× 1032 1× 1034
Crossing Spacing (ns) 396 24.95Peak Interactions/Crossing 5 19Luminous Line σ (cm) 30 4.5 [?]Luminosity Lifetime (hours) 3.8/23 [?] 15< x > at MW 0.04 0.006< x > at 2MT 0.18 0.025
An LHC upgrade to 1× 1035 is planned.
HJF Lake Louise Winter Institute Feb. 17-23, 2006
Two Lectures on Making Precision Measurements at Hadron Colliders
Top
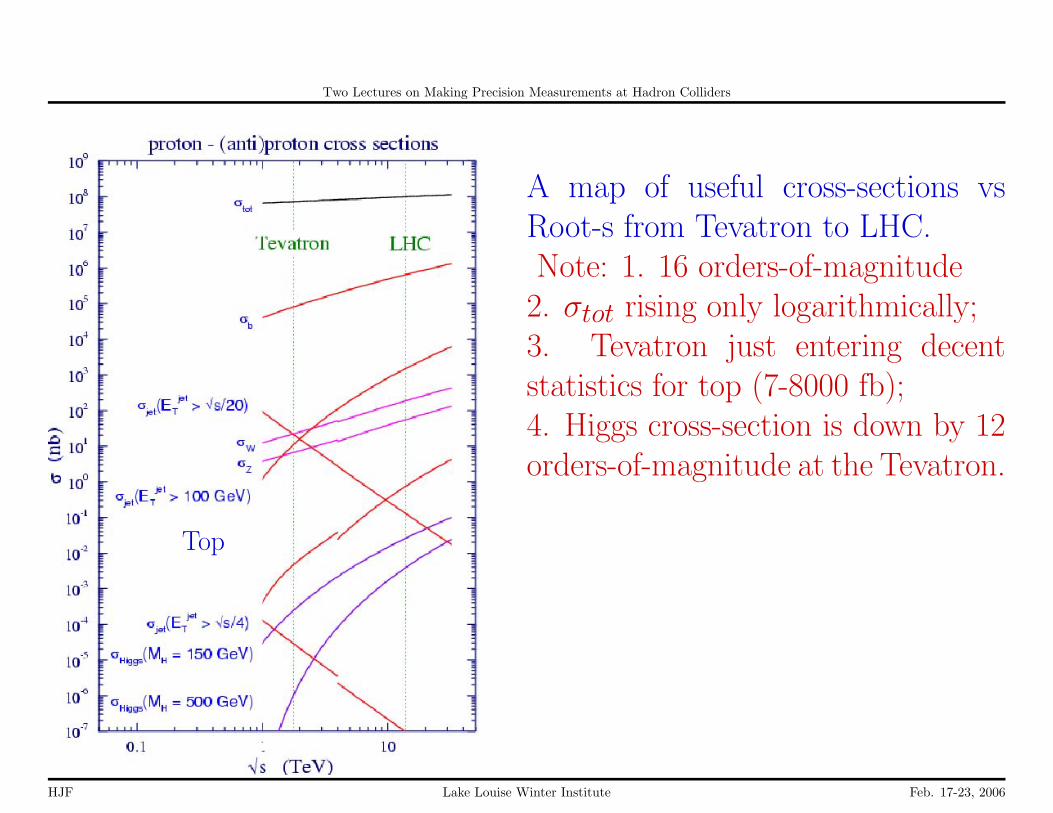
A map of useful cross-sections vsRoot-s from Tevatron to LHC.Note: 1. 16 orders-of-magnitude
2. σtot rising only logarithmically;3. Tevatron just entering decentstatistics for top (7-8000 fb);4. Higgs cross-section is down by 12orders-of-magnitude at the Tevatron.
HJF Lake Louise Winter Institute Feb. 17-23, 2006
Two Lectures on Making Precision Measurements at Hadron Colliders
4 The Anatomy of Detectors at Hadron Collider: Basics
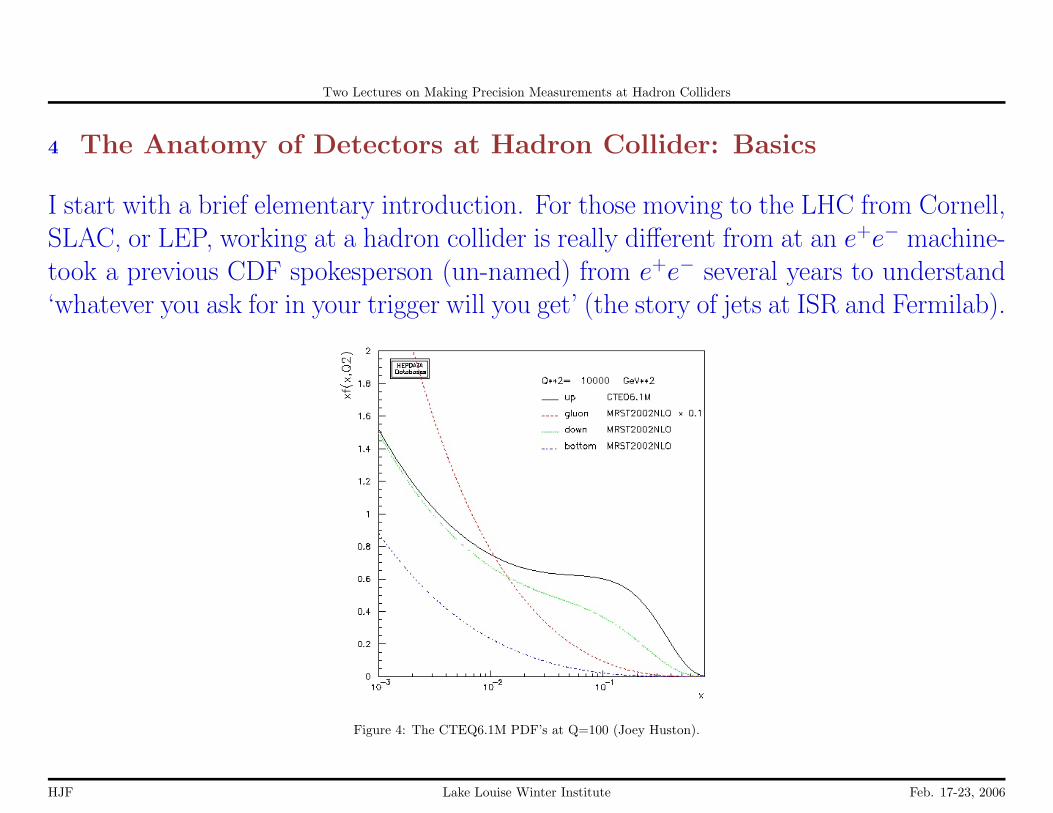
I start with a brief elementary introduction. For those moving to the LHC from Cornell,SLAC, or LEP, working at a hadron collider is really different from at an e+e− machine-took a previous CDF spokesperson (un-named) from e+e− several years to understand‘whatever you ask for in your trigger will you get’ (the story of jets at ISR and Fermilab).
Figure 4: The CTEQ6.1M PDF’s at Q=100 (Joey Huston).
HJF Lake Louise Winter Institute Feb. 17-23, 2006
Two Lectures on Making Precision Measurements at Hadron Colliders
4.1 Basics: Kinematics and Coverage: pT vs P||
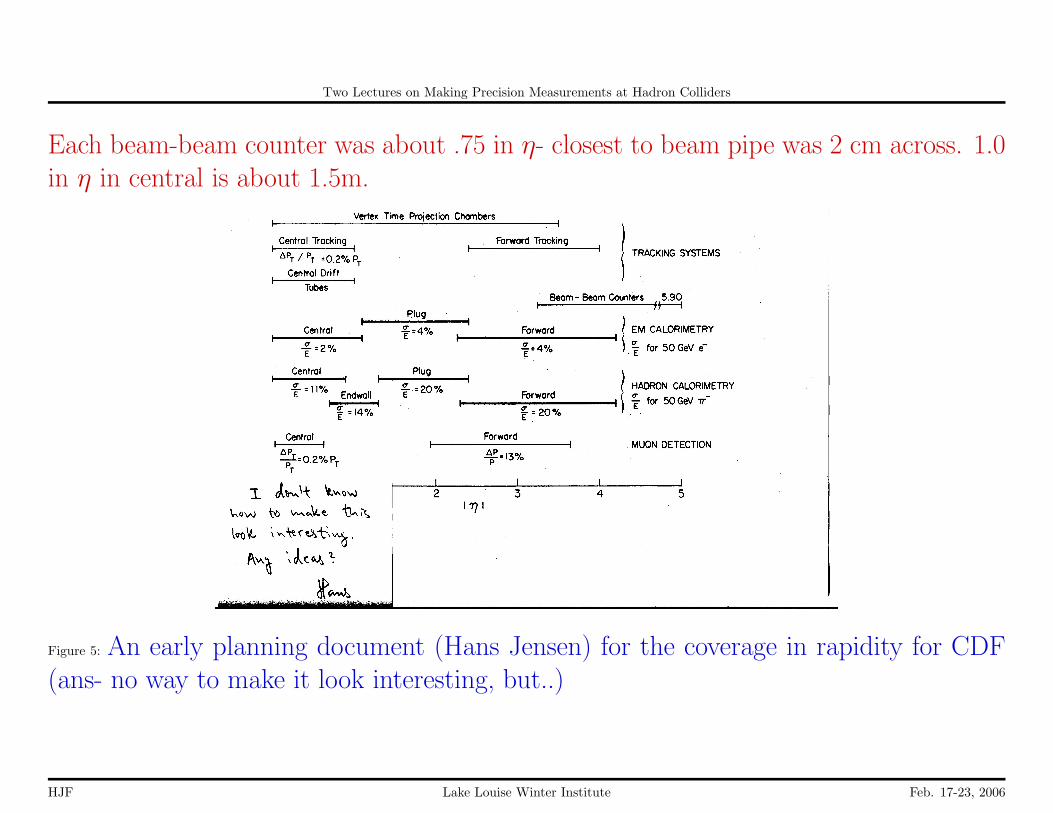
The phase space for particle production at a hadron collider is traditionally describedin cylindrical coordinates with the z axis along the beam direction, the radial directioncalled ‘transverse’, as in ‘Transverse Momentum’ (pT), and the polar angle expressedas Pseudo-rapidity η, where η ≡ −ln(tanθ/2)). Pseudo-rapidity is a substitute forthe Lorentz-boost variable, y, where y ≡ 1/2ln(E + pz)/(E − pz) ≡ tanh−1(pz/E).Since in most cases one does not know the mass of a particle produced in a hadroncollision (most are light- pions, kaons, baryons,..), we use pseudo-rapidity. (This is acommon trap when doing complex kinematics with W’s, Z’s, and top, where the masstruly matters). Figure 5 shows an early sketch of the proposed coverage in η for CDF;note that the big central detector seems very small, while the little luminosity monitorsseem big. Note that typical particle production is 4-6 particles per unit-rapidity; in thecentral region one unit at CDF is about 14 m2; the density in a min-bias event is verylow. Hadron colliders are not intrinsically ‘dirty’- only complex.
HJF Lake Louise Winter Institute Feb. 17-23, 2006
Two Lectures on Making Precision Measurements at Hadron Colliders
Each beam-beam counter was about .75 in η- closest to beam pipe was 2 cm across. 1.0in η in central is about 1.5m.
Figure 5: An early planning document (Hans Jensen) for the coverage in rapidity for CDF(ans- no way to make it look interesting, but..)
HJF Lake Louise Winter Institute Feb. 17-23, 2006

Two Lectures on Making Precision Measurements at Hadron Colliders
Two simple equations contain much of the physics for the production ofheavy states at a collider: the mass and longitudinal momentum of theheavy state (e.g. a W, Z, tt̄ pair, or WH) are determined by the fractionof the beam momentum carried by the interacting partons. Note thatfor a heavy object typically has a velocity β << 1, even though thelongitudinal momentum is typically not small (we’re not in the c.m! ofthe collision.). Note also that the transverse momentum of the systemis determined by the competition of falling parton distribution functions(PDF’s- also known as structure functions) as the total invariant mass ofthe system rises, and the increase in phase space as the momentum of thesystem increases. The production thus peaks with a total system energyabove threshold by an amount characteristic of the slope in x1 ∗ x2.
m2 = x1 ∗ x2s pz = (x1 − x2)pbeam (1)
HJF Lake Louise Winter Institute Feb. 17-23, 2006

Two Lectures on Making Precision Measurements at Hadron Colliders
4.2 Basics: Particle Detection
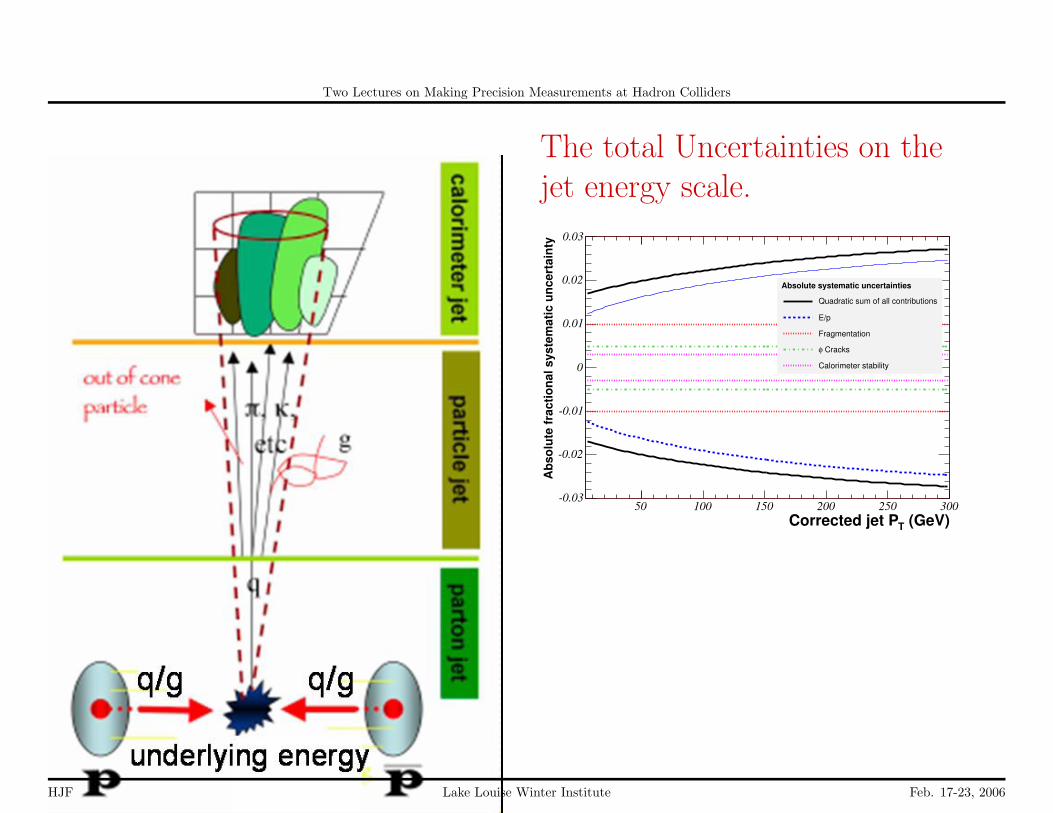
While low-momentum– typically up to a few GeV– charged particles can be identified byprocesses that depend on their velocity, β, as a simultaneous measurement of p = βγmand β allows extracting the mass, for momenta above a few GeV, pions, kaons, andprotons cannot be separated. However electrons, muons, hadrons, and neutrinos interactdifferently, as shown in Figure 4.2. The measurement of their energies and/or momentastem from their different modes of interaction.
HJF Lake Louise Winter Institute Feb. 17-23, 2006
Two Lectures on Making Precision Measurements at Hadron Colliders
5 Calibration Techniques
5.1 Momentum and Energy Scales: E/p
The Tevatron and the LHC are as different from LEP and other e+e− colliders as nightand day- it is a big disadvantage to have worked at LEP(!). One key difference is thatthe overall mass (energy) scale is not set by the beam energy- there is a continuumof c.m. energies in the parton-parton collisions. Moreover the hard scattering is notat rest either longitudinally nor transverse in the lab system- there is ‘intrinsic Kt’ aswell as initial-state radiation (ISR). Finally, the beam spot is a line and not a spot- thevertex point, used to calculate transverse energies, has to be determined from the event,including for neutrinos and photons for which no track is observed.Dealing first with the issue of setting the scale for momentum, energy, and mass measure-ments. All current detectors consist of a magnetic spectrometer followed by calorimeters.The magnetic spectrometer uses a precisely measured (NMR) magnetic field and theprecise geometry of the tracking chambers to measure the curvature (1/PT )of the tracksof charged particles. This is an absolute measurement- if perfect one has the momentumscale. One can then use particles with measured momentum as an in situ ‘test beam’to calibrate the energy scale of the calorimeters.
HJF Lake Louise Winter Institute Feb. 17-23, 2006
Two Lectures on Making Precision Measurements at Hadron Colliders
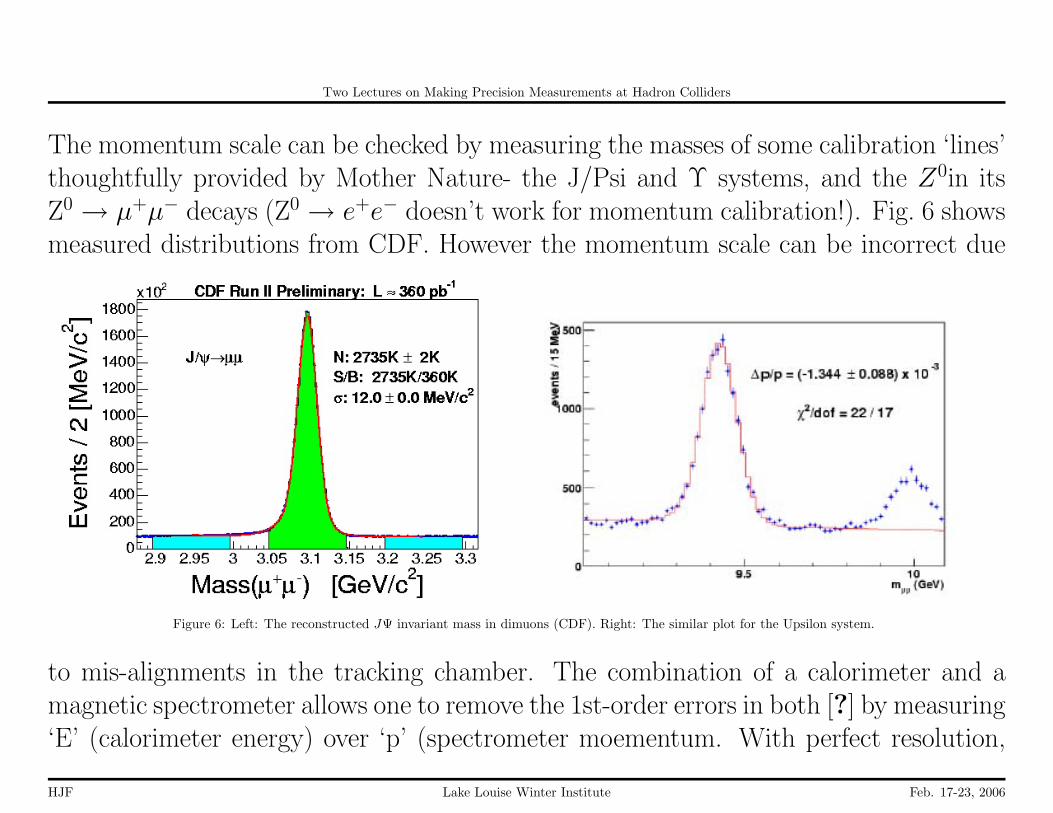
The momentum scale can be checked by measuring the masses of some calibration ‘lines’thoughtfully provided by Mother Nature- the J/Psi and Υ systems, and the Z0in itsZ0 → µ+µ− decays (Z0 → e+e− doesn’t work for momentum calibration!). Fig. 6 showsmeasured distributions from CDF. However the momentum scale can be incorrect due
Figure 6: Left: The reconstructed JΨ invariant mass in dimuons (CDF). Right: The similar plot for the Upsilon system.
to mis-alignments in the tracking chamber. The combination of a calorimeter and amagnetic spectrometer allows one to remove the 1st-order errors in both [?] by measuring‘E’ (calorimeter energy) over ‘p’ (spectrometer moementum. With perfect resolution,
HJF Lake Louise Winter Institute Feb. 17-23, 2006

Two Lectures on Making Precision Measurements at Hadron Colliders
no energy loss, and no radiation these two should be equal: E/p = 1.0. Figure 7 showsthe measured spectrum in E/p for electrons.The 1st-order error in momentum is due to a ‘false-curvature’- that is that a straight line(zero-curvature= ∞ momentum) is reconstructed with a finite momentum. The 1st-order error in calorimeter energy is an offset in the energy scale, and does not depend onthe sign (±) of the particle [?]. Expanding both the curvature and calorimeter energiesto first order:
1/p = 1/ptrue + 1/pfalse (µ+) 1/p = 1/ptrue − 1/pfalse (µ−) (2)
E = Etrue ∗ (1 + ε) (e+) E = Etrue ∗ (1− ε) (e−) (3)
The first-order false curvature pfalse then is derived by measuring E/p for positive andnegative electrons with the same E
1/pfalse = ((E/p(e+)− E/p(e−))/2E (4)
The first-order calibration scale error ε then is removed by setting the calorimeter scalefor electrons so that E/p agrees with expectations. In CDF, this is done initially tomake the calorimeter response uniform in φ− η.
1/pfalse = ((E/p(e+) + E/p(e−))/2 (5)
HJF Lake Louise Winter Institute Feb. 17-23, 2006

Two Lectures on Making Precision Measurements at Hadron Colliders
Figure 7:
5.2 Higher-order momentum and energy corrections
The momentum and energy calibrations at this point are good enough for everything atpresent exposures except the W mass measurement. There are three higher-order effectsthat are taken care of at present:
1. ‘Twist’ between the 2 end-plates of the tracking chamber;2. Systematic scale change in the z-measurements in the chamber;3. Non-linearity of the calorimeter due to e(E/2) + γ(E/2) 6= e(E)
HJF Lake Louise Winter Institute Feb. 17-23, 2006
Two Lectures on Making Precision Measurements at Hadron Colliders
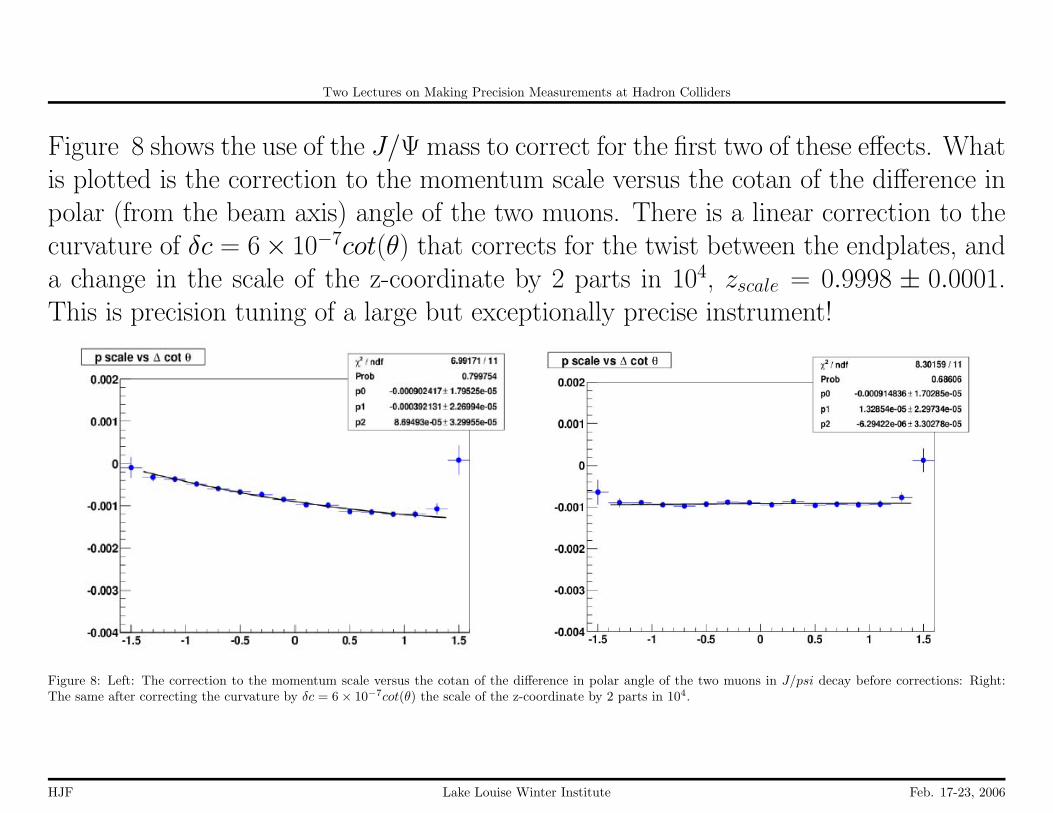
Figure 8 shows the use of the J/Ψ mass to correct for the first two of these effects. Whatis plotted is the correction to the momentum scale versus the cotan of the difference inpolar (from the beam axis) angle of the two muons. There is a linear correction to thecurvature of δc = 6× 10⁻⁷cot(θ) that corrects for the twist between the endplates, anda change in the scale of the z-coordinate by 2 parts in 104, zscale = 0.9998 ± 0.0001.This is precision tuning of a large but exceptionally precise instrument!
Figure 8: Left: The correction to the momentum scale versus the cotan of the difference in polar angle of the two muons in J/psi decay before corrections: Right:The same after correcting the curvature by δc = 6× 10⁻⁷cot(θ) the scale of the z-coordinate by 2 parts in 104.
HJF Lake Louise Winter Institute Feb. 17-23, 2006

Two Lectures on Making Precision Measurements at Hadron Colliders
Figure 9: Measuring a higher-order correction to track curvature: the calorimeter to momentum ratio E/p versus cotθ for e+ and e−, before and after the curvatureand z-scale corrections.
HJF Lake Louise Winter Institute Feb. 17-23, 2006
Two Lectures on Making Precision Measurements at Hadron Colliders
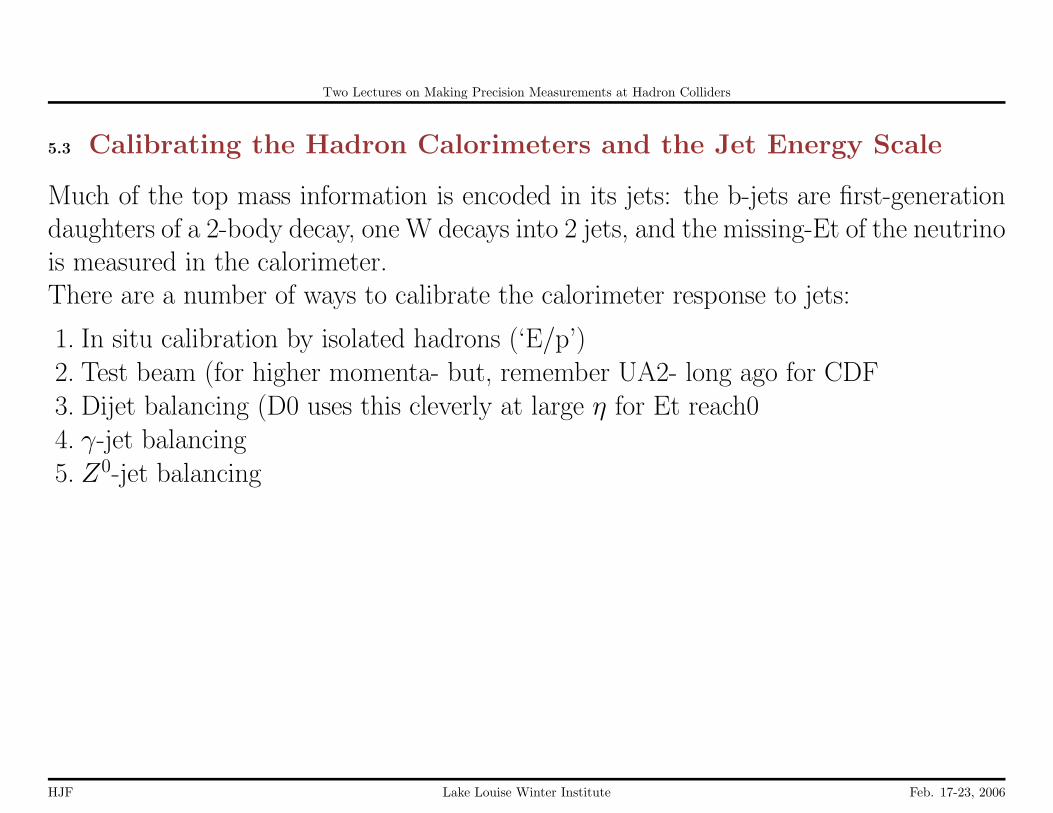
5.3 Calibrating the Hadron Calorimeters and the Jet Energy Scale
Much of the top mass information is encoded in its jets: the b-jets are first-generationdaughters of a 2-body decay, one W decays into 2 jets, and the missing-Et of the neutrinois measured in the calorimeter.There are a number of ways to calibrate the calorimeter response to jets:
1. In situ calibration by isolated hadrons (‘E/p’)2. Test beam (for higher momenta- but, remember UA2- long ago for CDF3. Dijet balancing (D0 uses this cleverly at large η for Et reach04. γ-jet balancing5. Z0-jet balancing
HJF Lake Louise Winter Institute Feb. 17-23, 2006
Two Lectures on Making Precision Measurements at Hadron Colliders
The total Uncertainties on thejet energy scale.
(GeV)TCorrected jet P50 100 150 200 250 300
Abso
lute
frac
tiona
l sys
tem
atic
unc
erta
inty
-0.03
-0.02
-0.01
0
0.01
0.02
0.03
Absolute systematic uncertainties
Quadratic sum of all contributions
E/p
Fragmentation
Cracksφ
Calorimeter stability
Absolute systematic uncertainties
Quadratic sum of all contributions
E/p
Fragmentation
Cracksφ
Calorimeter stability
HJF Lake Louise Winter Institute Feb. 17-23, 2006
Two Lectures on Making Precision Measurements at Hadron Colliders
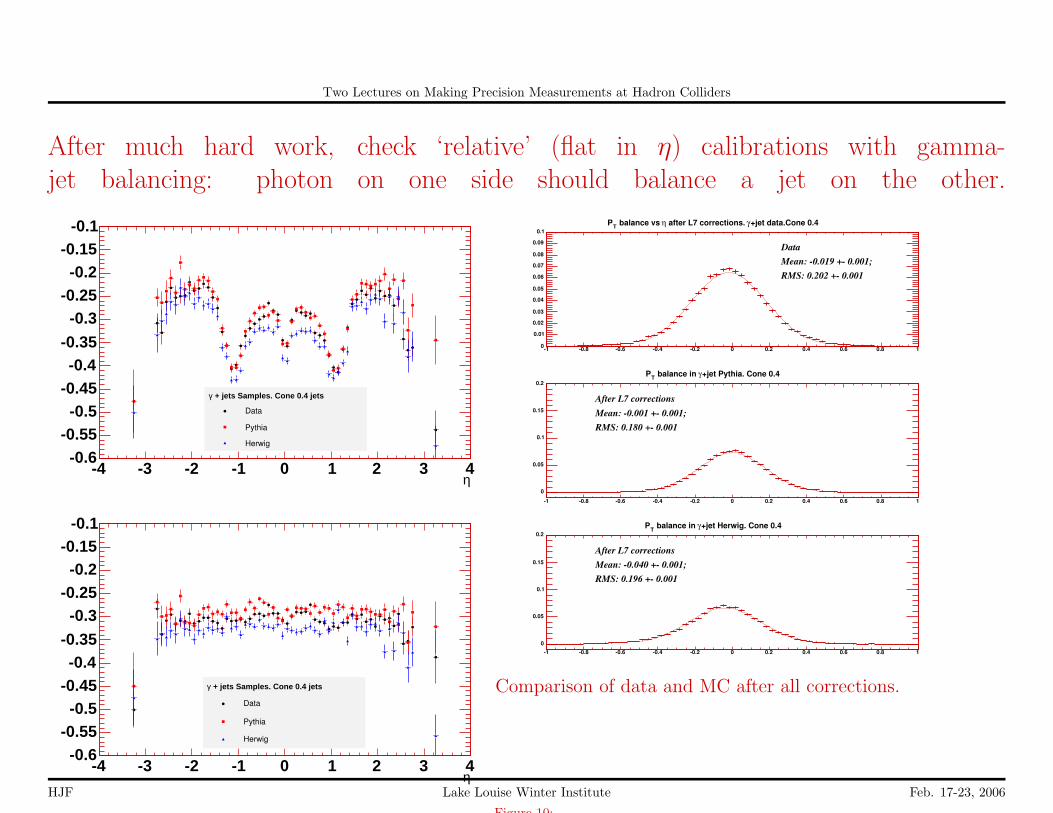
After much hard work, check ‘relative’ (flat in η) calibrations with gamma-jet balancing: photon on one side should balance a jet on the other.
η-4 -3 -2 -1 0 1 2 3 4
-0.6-0.55-0.5
-0.45-0.4
-0.35
-0.3-0.25-0.2
-0.15-0.1
+ jets Samples. Cone 0.4 jetsγ
Data
Pythia
Herwig
+ jets Samples. Cone 0.4 jetsγ
Data
Pythia
Herwig
η-4 -3 -2 -1 0 1 2 3 4
-0.6-0.55-0.5
-0.45-0.4
-0.35
-0.3-0.25-0.2
-0.15-0.1
+ jets Samples. Cone 0.4 jetsγ
Data
Pythia
Herwig
+ jets Samples. Cone 0.4 jetsγ
Data
Pythia
Herwig
-1 -0.8 -0.6 -0.4 -0.2 0 0.2 0.4 0.6 0.8 10
0.01
0.02
0.03
0.04
0.05
0.06
0.07
0.08
0.09
0.1
Data Mean: -0.019 +- 0.001; RMS: 0.202 +- 0.001
+jet data.Cone 0.4γ after L7 corrections. η balance vs TP
-1 -0.8 -0.6 -0.4 -0.2 0 0.2 0.4 0.6 0.8 10
0.05
0.1
0.15
0.2
After L7 corrections Mean: -0.001 +- 0.001; RMS: 0.180 +- 0.001
+jet Pythia. Cone 0.4γ balance in TP
-1 -0.8 -0.6 -0.4 -0.2 0 0.2 0.4 0.6 0.8 10
0.05
0.1
0.15
0.2
After L7 corrections Mean: -0.040 +- 0.001; RMS: 0.196 +- 0.001
+jet Herwig. Cone 0.4γ balance in TP
Comparison of data and MC after all corrections.
Figure 10:
HJF Lake Louise Winter Institute Feb. 17-23, 2006
Two Lectures on Making Precision Measurements at Hadron Colliders
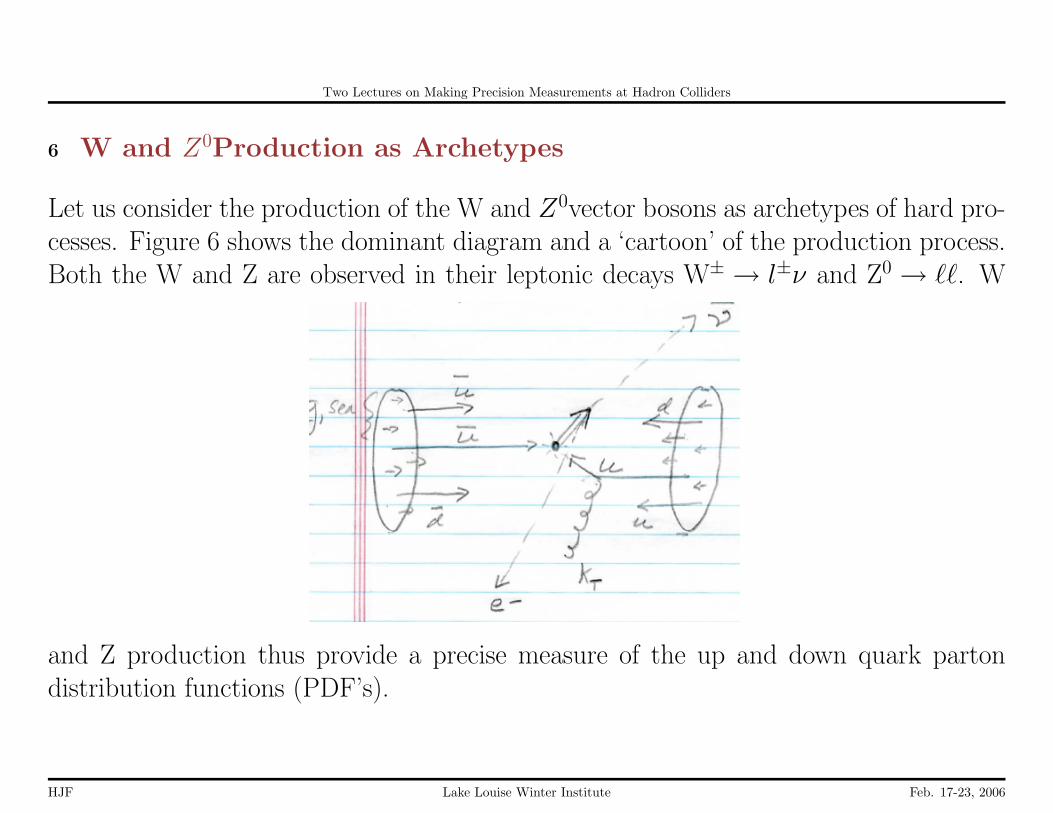
6 W and Z0Production as Archetypes
Let us consider the production of the W and Z0vector bosons as archetypes of hard pro-cesses. Figure 6 shows the dominant diagram and a ‘cartoon’ of the production process.Both the W and Z are observed in their leptonic decays W± → l±ν and Z0 → ``. W
and Z production thus provide a precise measure of the up and down quark partondistribution functions (PDF’s).
HJF Lake Louise Winter Institute Feb. 17-23, 2006
Two Lectures on Making Precision Measurements at Hadron Colliders
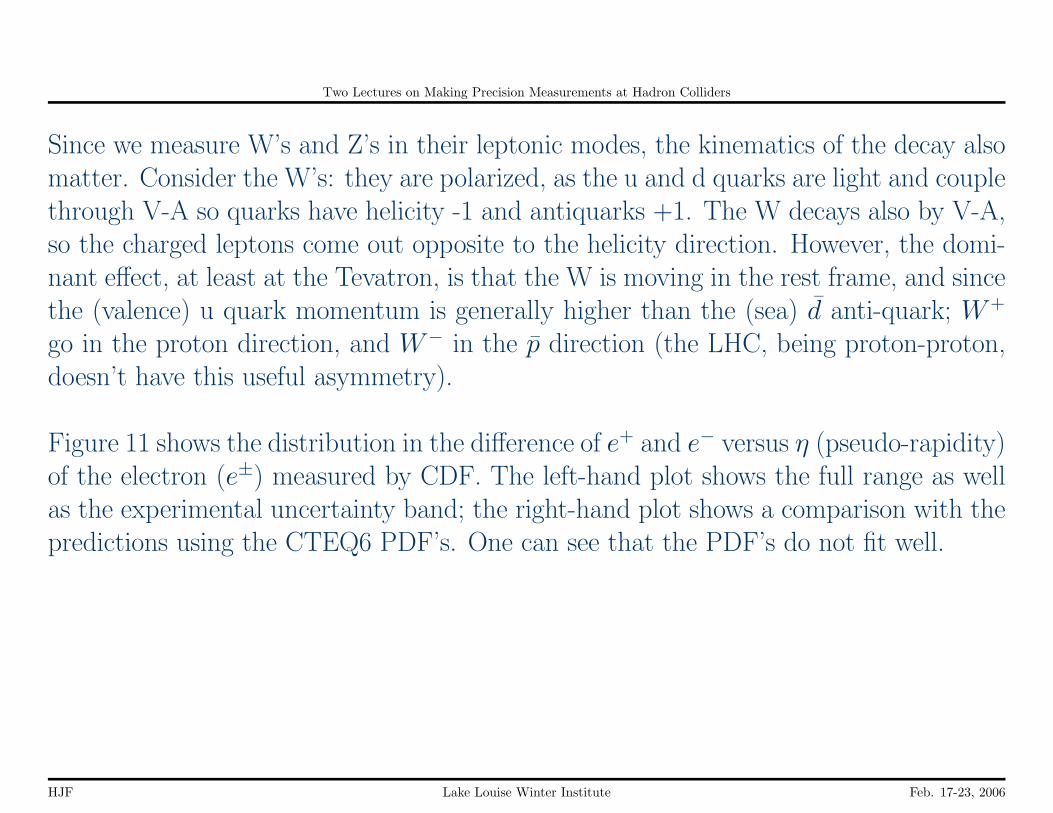
Since we measure W’s and Z’s in their leptonic modes, the kinematics of the decay alsomatter. Consider the W’s: they are polarized, as the u and d quarks are light and couplethrough V-A so quarks have helicity -1 and antiquarks +1. The W decays also by V-A,so the charged leptons come out opposite to the helicity direction. However, the domi-nant effect, at least at the Tevatron, is that the W is moving in the rest frame, and sincethe (valence) u quark momentum is generally higher than the (sea) d̄ anti-quark; W+
go in the proton direction, and W− in the p̄ direction (the LHC, being proton-proton,doesn’t have this useful asymmetry).
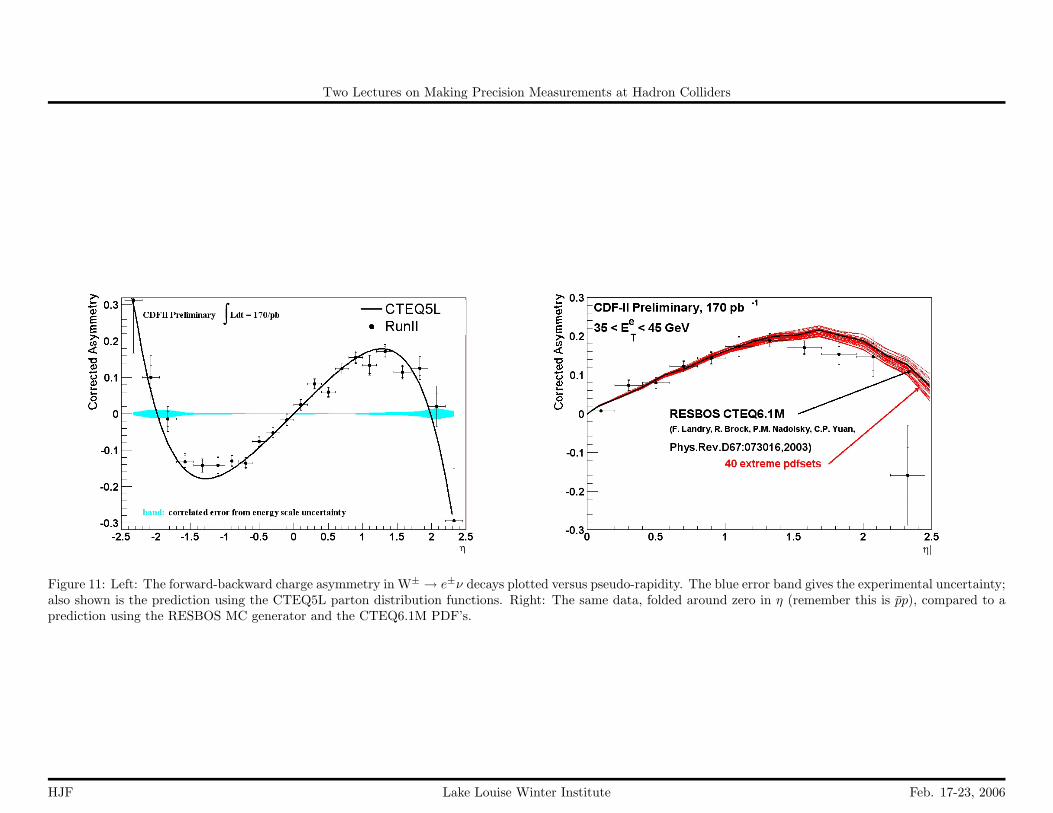
Figure 11 shows the distribution in the difference of e+ and e− versus η (pseudo-rapidity)of the electron (e±) measured by CDF. The left-hand plot shows the full range as wellas the experimental uncertainty band; the right-hand plot shows a comparison with thepredictions using the CTEQ6 PDF’s. One can see that the PDF’s do not fit well.
HJF Lake Louise Winter Institute Feb. 17-23, 2006
Two Lectures on Making Precision Measurements at Hadron Colliders
Figure 11: Left: The forward-backward charge asymmetry in W± → e±ν decays plotted versus pseudo-rapidity. The blue error band gives the experimental uncertainty;also shown is the prediction using the CTEQ5L parton distribution functions. Right: The same data, folded around zero in η (remember this is p̄p), compared to aprediction using the RESBOS MC generator and the CTEQ6.1M PDF’s.
HJF Lake Louise Winter Institute Feb. 17-23, 2006

Two Lectures on Making Precision Measurements at Hadron Colliders
7 ‘QCD’- Jet Production, Quark and Gluons, ISR, FSR
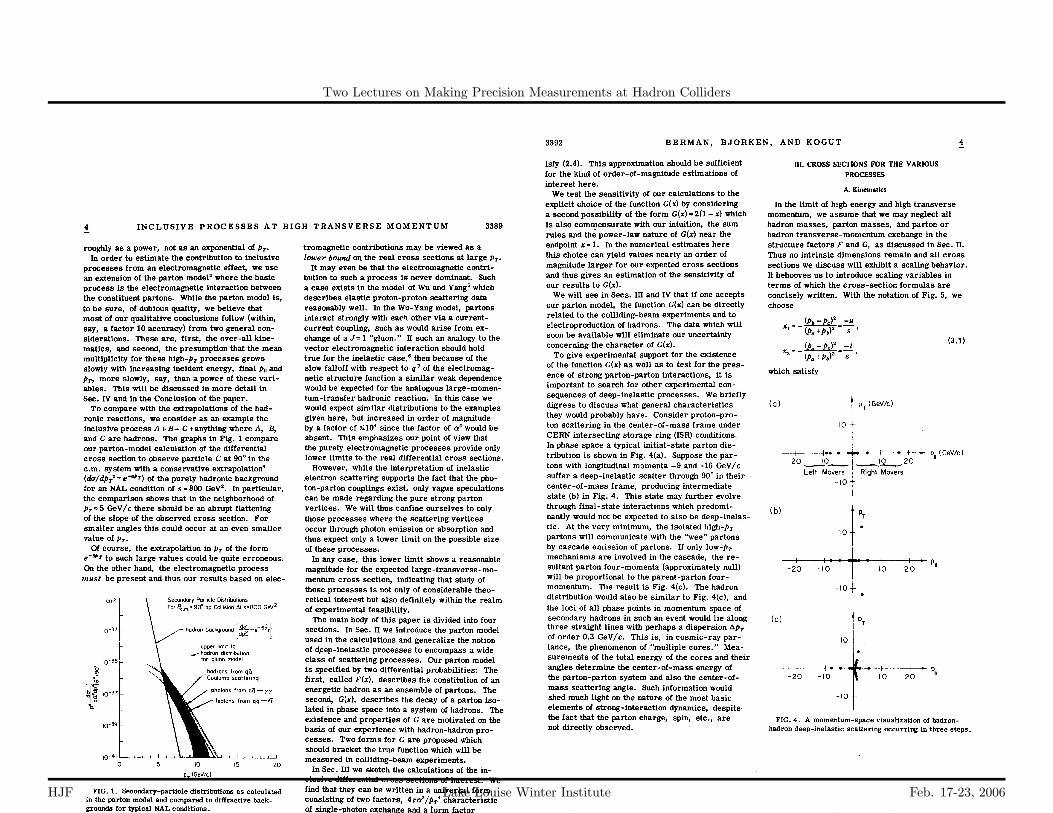
The dominant feature in thehadron collider landscape is theproduction of jets- the hard scat-tering of partons. Figure 7 repro-duces two pages from a seminal pa-per in 1971, when the idea of par-tons was brand new, by Berman,Bjorken, and Kogut, pointing outthat the existence of partons wouldlead to point-like scatterings andhence high pT phenomena, includ-ing ‘cores’ (jets). Note the Peyrouplot on the next page...
HJF Lake Louise Winter Institute Feb. 17-23, 2006
Two Lectures on Making Precision Measurements at Hadron Colliders
HJF Lake Louise Winter Institute Feb. 17-23, 2006
Two Lectures on Making Precision Measurements at Hadron Colliders
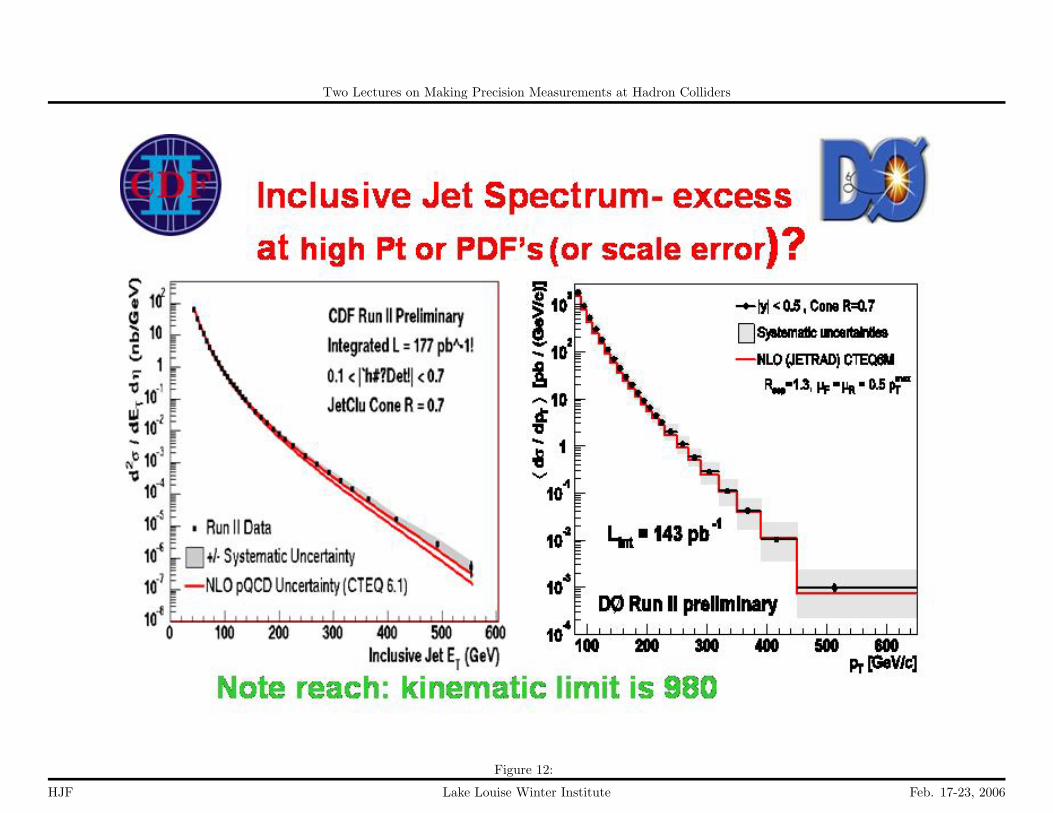
Figure 12:
HJF Lake Louise Winter Institute Feb. 17-23, 2006
Two Lectures on Making Precision Measurements at Hadron Colliders
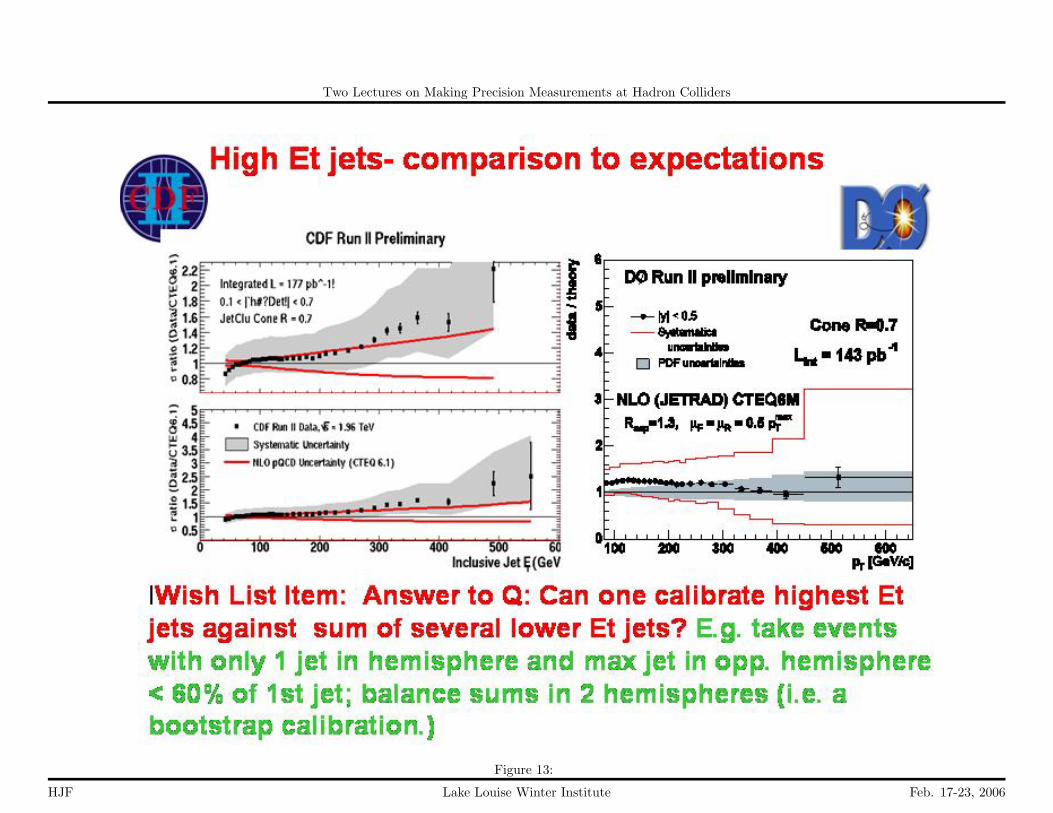
Figure 13:
HJF Lake Louise Winter Institute Feb. 17-23, 2006
Two Lectures on Making Precision Measurements at Hadron Colliders
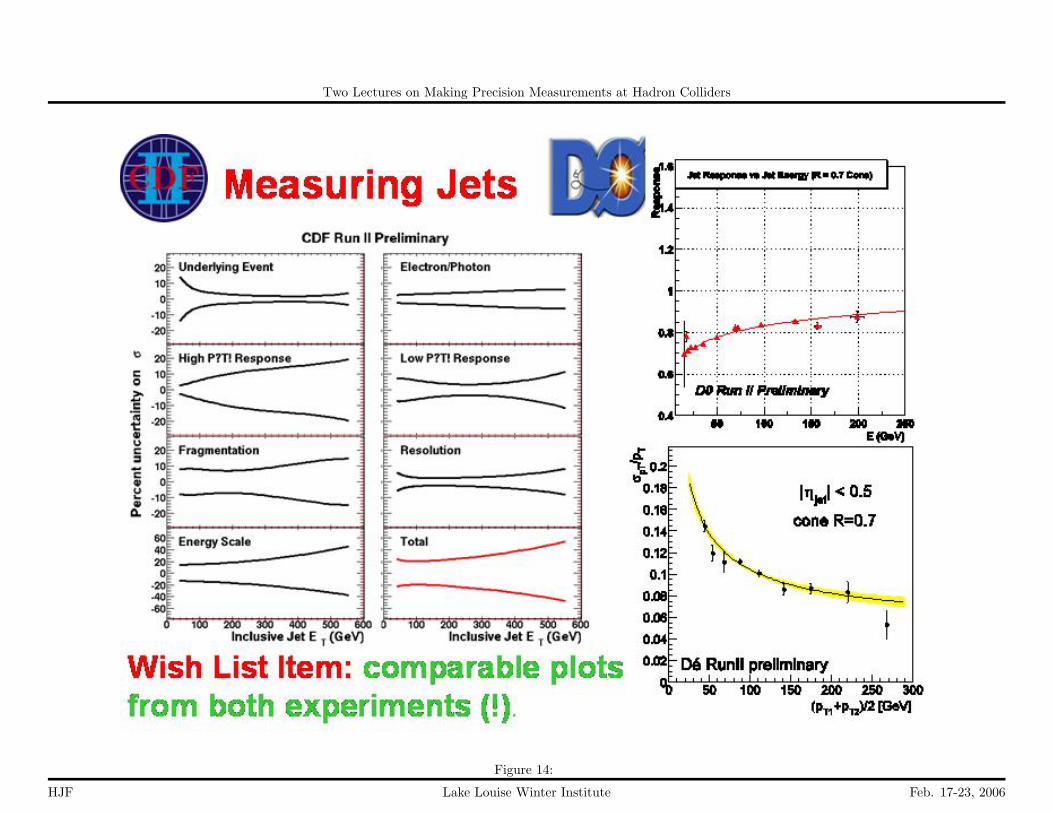
Figure 14:
HJF Lake Louise Winter Institute Feb. 17-23, 2006
Two Lectures on Making Precision Measurements at Hadron Colliders
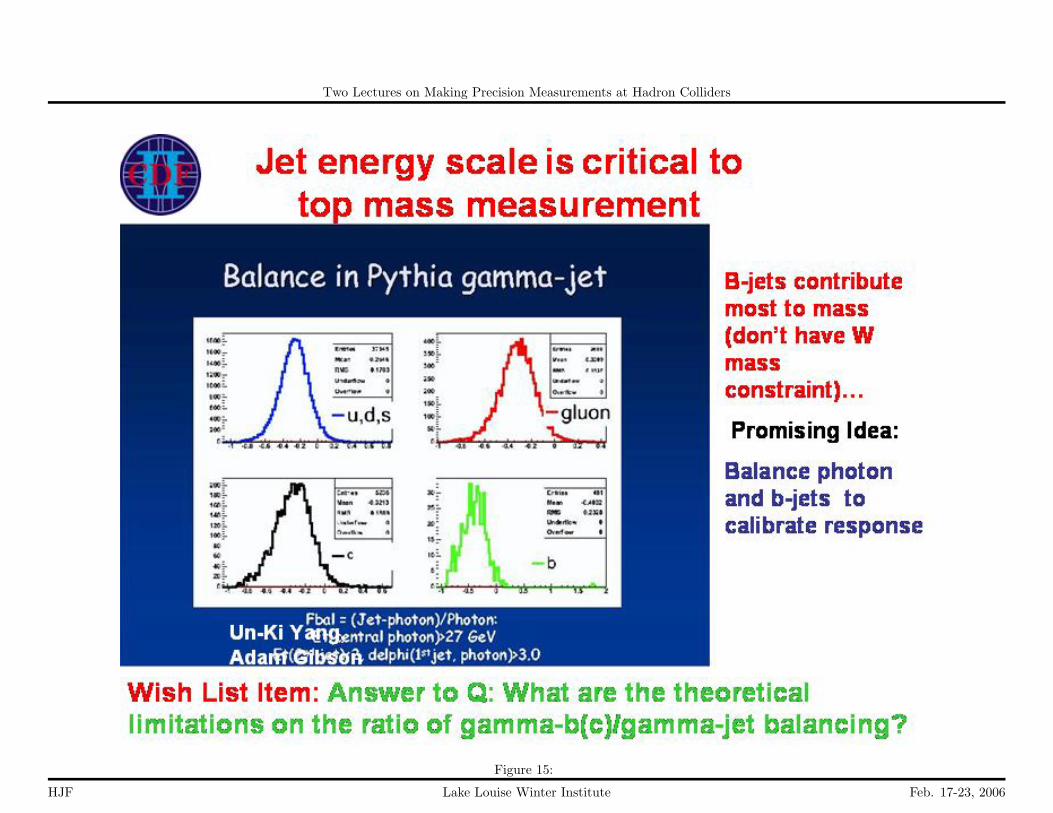
Figure 15:
HJF Lake Louise Winter Institute Feb. 17-23, 2006
Two Lectures on Making Precision Measurements at Hadron Colliders
8 The MTop −MW Plane and the Higgs Mass
8.1 Motivation
The top quark is remarkable for its physics and useful as a tool for calibration. It mayalso be a window into the world of heavy weakly-interacting particles (such as a Higgs ofone sort or another) in that it is produced strongly (i.e with coupling Oαs) in pairs, butdue to its strongly-conserved flavor quantum number (top-ness), has to decay electro-weakly. Due to radiative corrections, the masses of the W, Z, Higgs, and top quark arerelated in the SM; precise measurements of the W and top quark masses determine thepredicted Higgs mass.
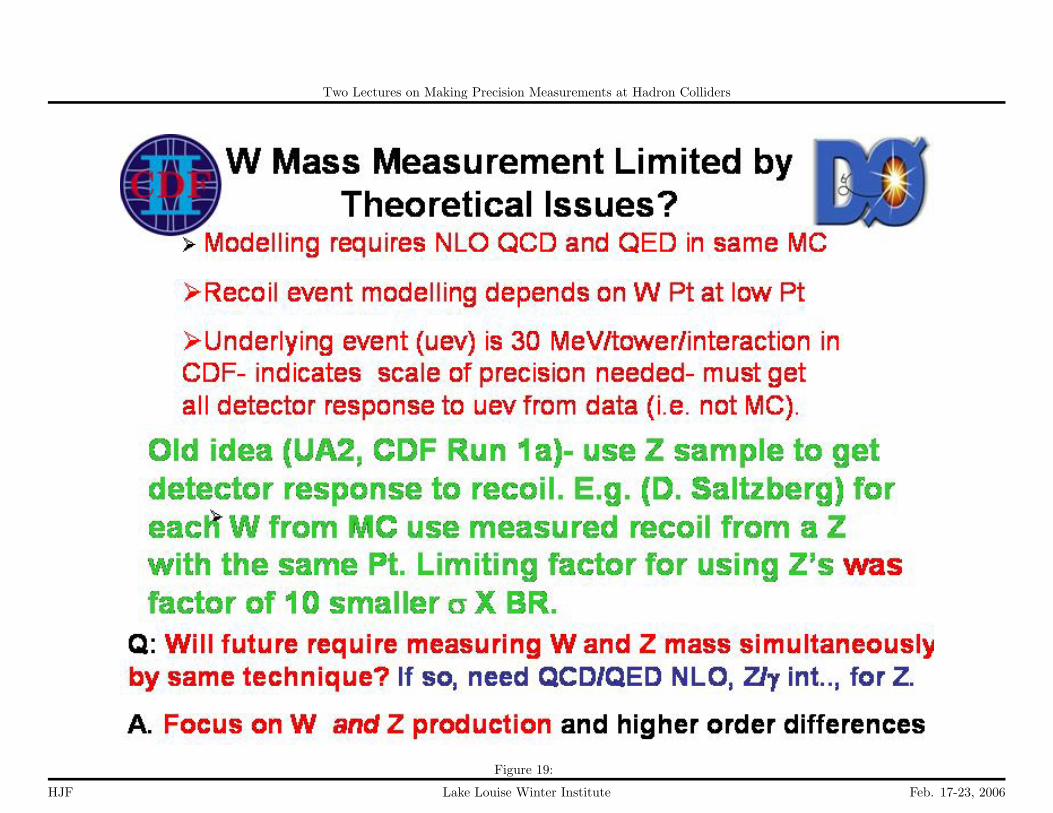
8.2 What limits the precision on the W mass and the top mass measure-ments?
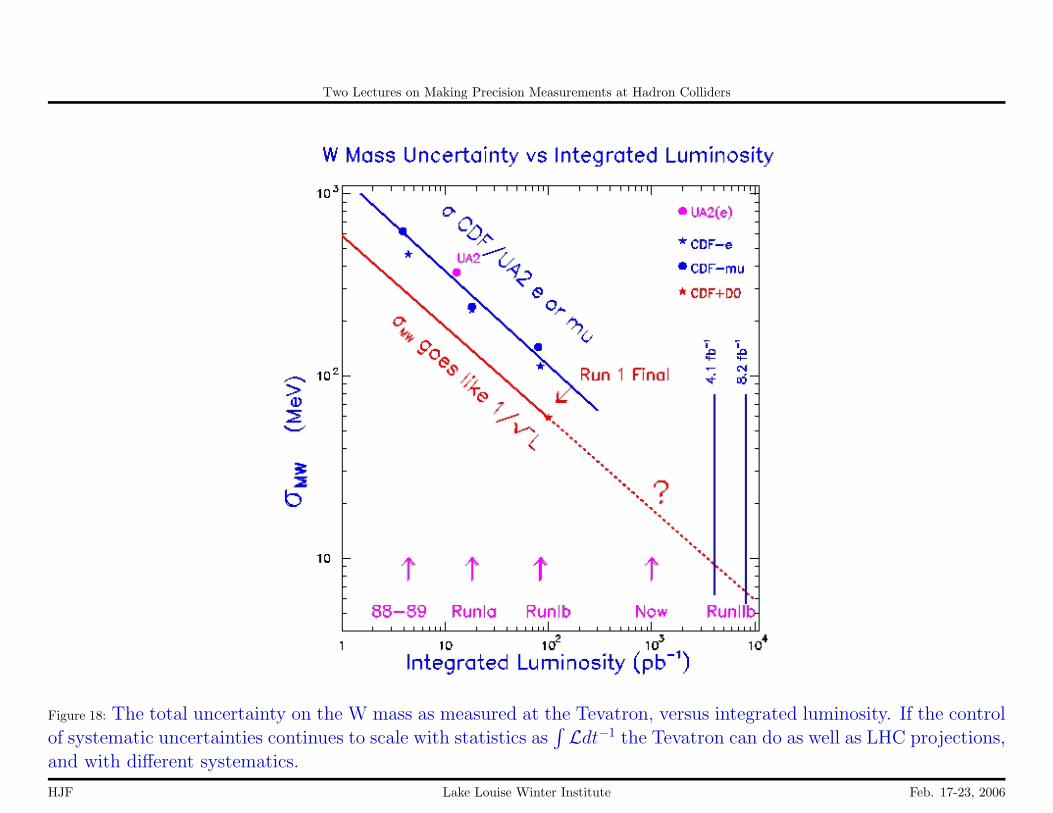
Figure 18 gives the history of the uncertainty on the W mass as a function of thesquare-root of luminosity. The statistical uncertainty is expected to scale as
∫Ldt−1.
The systematic uncertainties will be discussed below when we get to the measurementof the W mass; however it is interesting to note that since the systematics are studiedwith data, they also seem to scale with luminosity. If the control of systematic uncer-
HJF Lake Louise Winter Institute Feb. 17-23, 2006
Two Lectures on Making Precision Measurements at Hadron Colliders
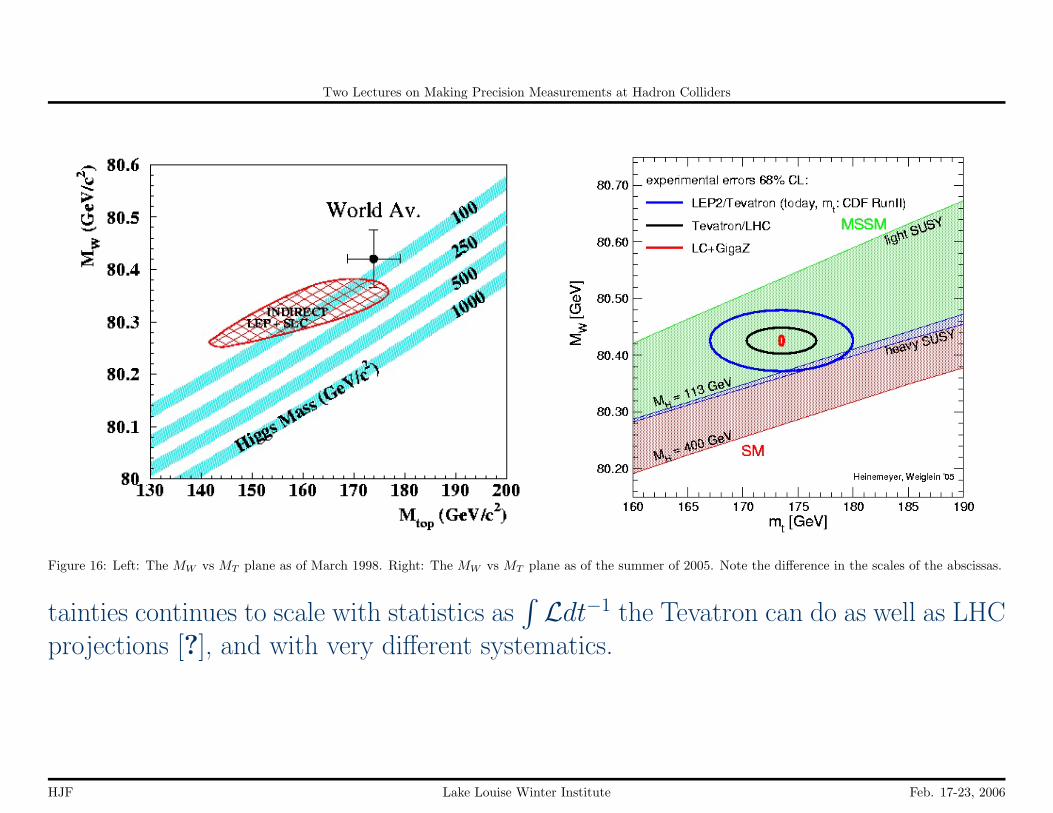
Figure 16: Left: The MW vs MT plane as of March 1998. Right: The MW vs MT plane as of the summer of 2005. Note the difference in the scales of the abscissas.
tainties continues to scale with statistics as∫Ldt−1 the Tevatron can do as well as LHC
projections [?], and with very different systematics.
HJF Lake Louise Winter Institute Feb. 17-23, 2006
Two Lectures on Making Precision Measurements at Hadron Colliders
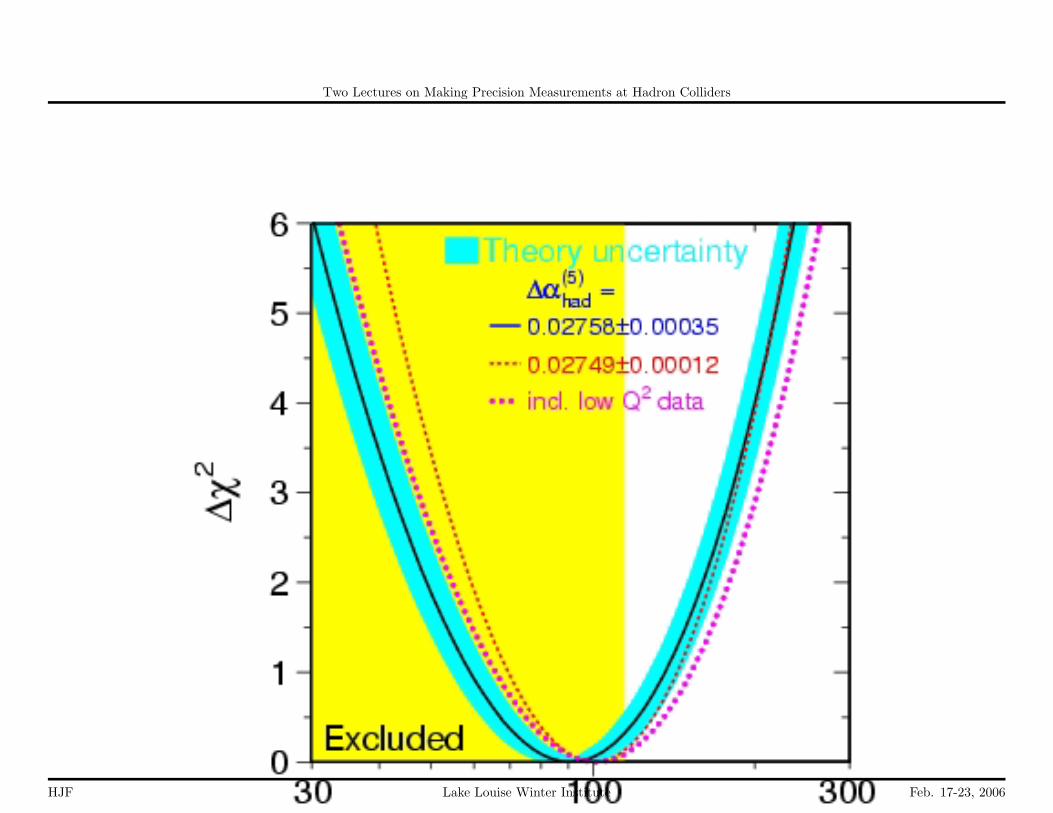
Figure 17: Left: The measured allowed region at 68% (1σ) in the MW −Mtop plane (the intersection of inside the blue and solid-red contours), and the predicteddependence of the MW and Mtop on the SM Higgs mass. Right: The fit for the mass of the SM Higgs, showing the region excluded at 68% C.L.
HJF Lake Louise Winter Institute Feb. 17-23, 2006
Two Lectures on Making Precision Measurements at Hadron Colliders
Figure 18: The total uncertainty on the W mass as measured at the Tevatron, versus integrated luminosity. If the controlof systematic uncertainties continues to scale with statistics as
∫Ldt−1 the Tevatron can do as well as LHC projections,
and with different systematics.
HJF Lake Louise Winter Institute Feb. 17-23, 2006
Two Lectures on Making Precision Measurements at Hadron Colliders
Figure 19:
HJF Lake Louise Winter Institute Feb. 17-23, 2006

Two Lectures on Making Precision Measurements at Hadron Colliders
9 Measuring the Top Quark Mass and Cross-section
I will discuss two specific measurements as pedagogic examples of some specific difficul-ties (challenges is the polite word) of doing precision measurements - the measurementsof the top cross-section and the top mass. The idea is make it possible for you to askreally hard questions when you see the beautiful busy plots that we all usually just letgo by. First some basics.
9.1 tt̄ Production: Measuring the Top Cross-section Precisely
The prime motivation for a precise measurement of the top cross-section is that newphysics could provide an additional source for the production (leading to a larger cross-section than expected) or additional decay channels (leading to a smaller measured cross-section into b̄) [?]. More prosaically, the cross-section is a well-defined and in-principleeasy-to-measure quantity that tests many aspects of QCD and the underlying universeof hadron collider physics- the PDF’s, LO, NLO and NNLO calculations, and providesa calibration point for calorimeters and the energy scale (will be a key calibration forLHC). Lastly, and less defensible scientifically, is the uneasy feeling that too low a cross-section (e.g.) means that the top mass is really lighter than we measure, and the crucial
HJF Lake Louise Winter Institute Feb. 17-23, 2006
Two Lectures on Making Precision Measurements at Hadron Colliders
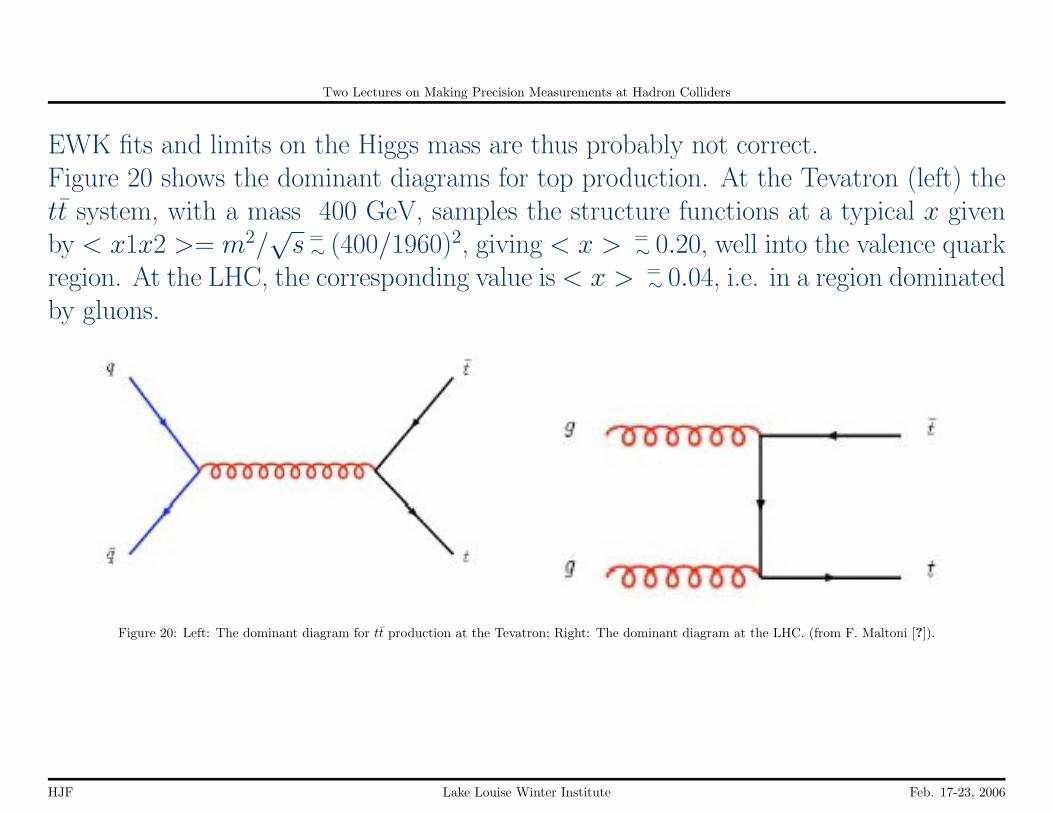
EWK fits and limits on the Higgs mass are thus probably not correct.Figure 20 shows the dominant diagrams for top production. At the Tevatron (left) thett̄ system, with a mass 400 GeV, samples the structure functions at a typical x givenby < x1x2 >= m2/
√s =∼ (400/1960)2, giving < x > =
∼ 0.20, well into the valence quarkregion. At the LHC, the corresponding value is < x > =
∼ 0.04, i.e. in a region dominatedby gluons.
Figure 20: Left: The dominant diagram for tt̄ production at the Tevatron; Right: The dominant diagram at the LHC. (from F. Maltoni [?]).
HJF Lake Louise Winter Institute Feb. 17-23, 2006
Two Lectures on Making Precision Measurements at Hadron Colliders
9.2 Total Cross-section for tt̄ Production: Parsing the CDF and DØPlots
A brief history of theoretical predictions for σtop:
HJF Lake Louise Winter Institute Feb. 17-23, 2006
Two Lectures on Making Precision Measurements at Hadron Colliders
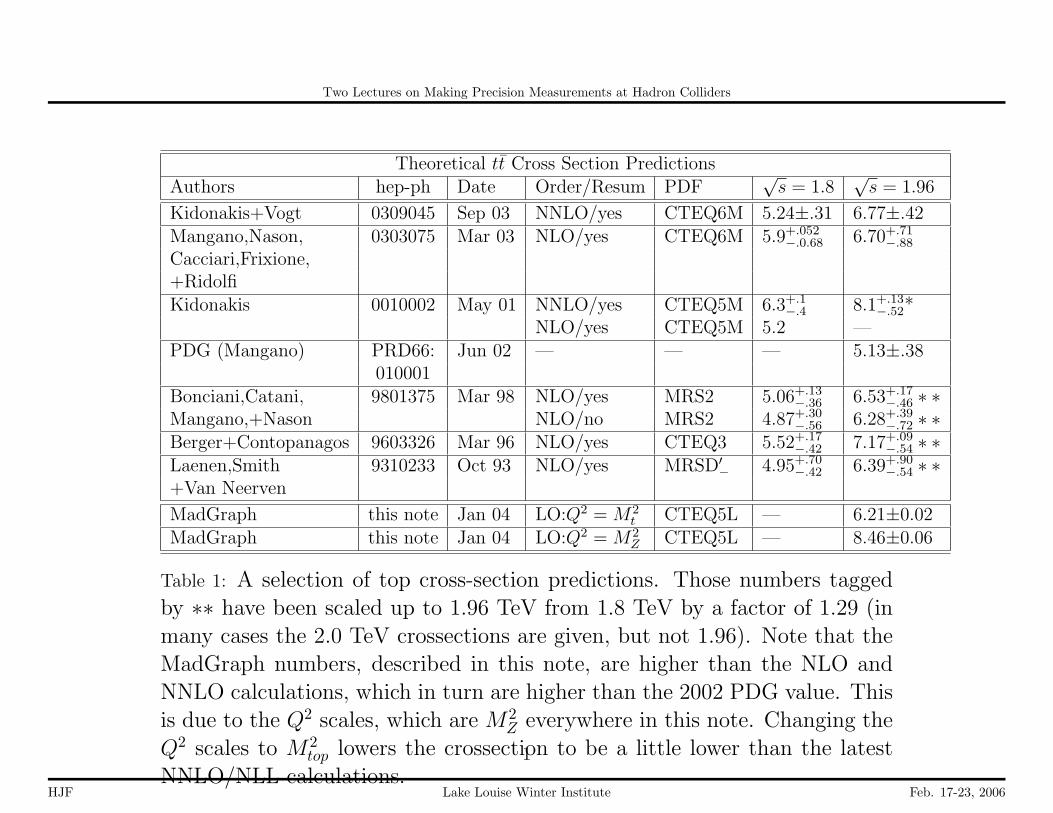
Theoretical tt̄ Cross Section PredictionsAuthors hep-ph Date Order/Resum PDF
√s = 1.8
√s = 1.96
Kidonakis+Vogt 0309045 Sep 03 NNLO/yes CTEQ6M 5.24±.31 6.77±.42Mangano,Nason, 0303075 Mar 03 NLO/yes CTEQ6M 5.9+.052
−.0.68 6.70+.71−.88
Cacciari,Frixione,+RidolfiKidonakis 0010002 May 01 NNLO/yes CTEQ5M 6.3+.1
−.4 8.1+.13−.52*
NLO/yes CTEQ5M 5.2 —PDG (Mangano) PRD66: Jun 02 — — — 5.13±.38
010001Bonciani,Catani, 9801375 Mar 98 NLO/yes MRS2 5.06+.13
−.36 6.53+.17−.46 ∗ ∗
Mangano,+Nason NLO/no MRS2 4.87+.30−.56 6.28+.39
−.72 ∗ ∗Berger+Contopanagos 9603326 Mar 96 NLO/yes CTEQ3 5.52+.17
−.42 7.17+.09−.54 ∗ ∗
Laenen,Smith 9310233 Oct 93 NLO/yes MRSD′− 4.95+.70
−.42 6.39+.90−.54 ∗ ∗
+Van Neerven
MadGraph this note Jan 04 LO:Q2 = M2t CTEQ5L — 6.21±0.02
MadGraph this note Jan 04 LO:Q2 = M2Z CTEQ5L — 8.46±0.06
Table 1: A selection of top cross-section predictions. Those numbers taggedby ∗∗ have been scaled up to 1.96 TeV from 1.8 TeV by a factor of 1.29 (inmany cases the 2.0 TeV crossections are given, but not 1.96). Note that theMadGraph numbers, described in this note, are higher than the NLO andNNLO calculations, which in turn are higher than the 2002 PDG value. Thisis due to the Q2 scales, which are M 2
Z everywhere in this note. Changing theQ2 scales to M 2
top lowers the crossection to be a little lower than the latestNNLO/NLL calculations.
1
HJF Lake Louise Winter Institute Feb. 17-23, 2006
Two Lectures on Making Precision Measurements at Hadron Colliders
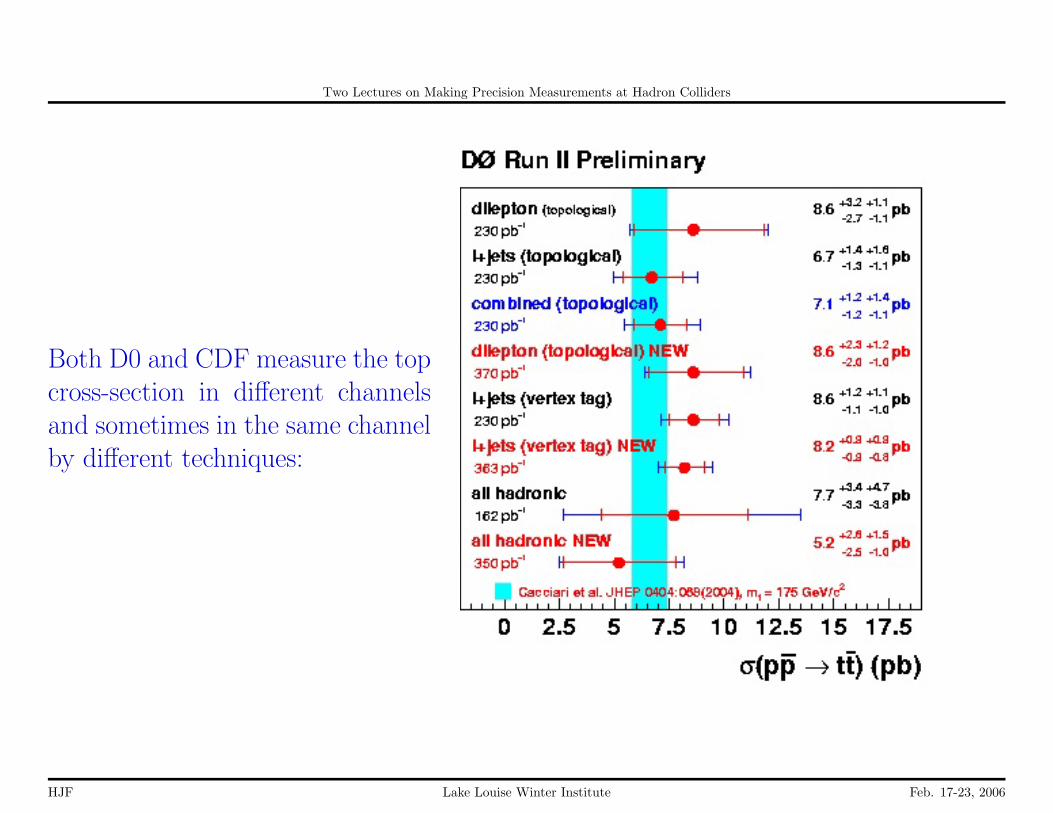
Both D0 and CDF measure the topcross-section in different channelsand sometimes in the same channelby different techniques:
HJF Lake Louise Winter Institute Feb. 17-23, 2006
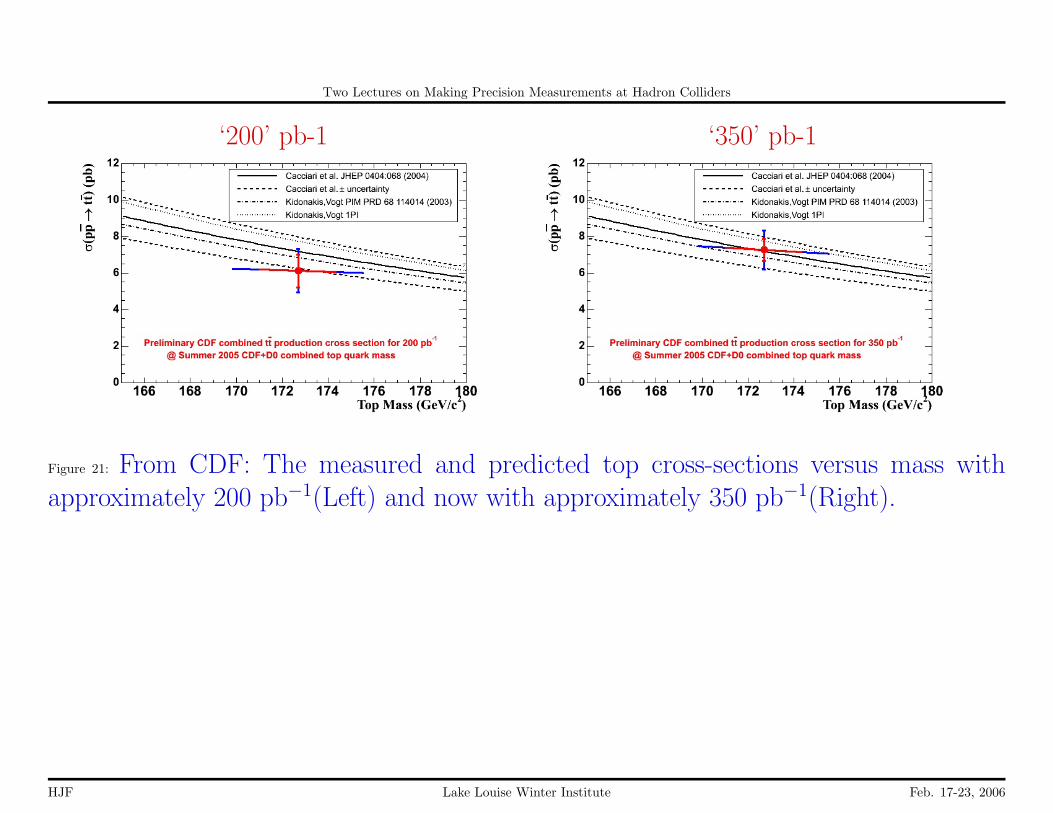
Two Lectures on Making Precision Measurements at Hadron Colliders
Figure 21: From CDF: The measured and predicted top cross-sections versus mass withapproximately 200 pb−1(Left) and now with approximately 350 pb−1(Right).
‘200’ pb-1 ‘350’ pb-1
‘200’ pb-1 ‘350’ pb-1
HJF Lake Louise Winter Institute Feb. 17-23, 2006
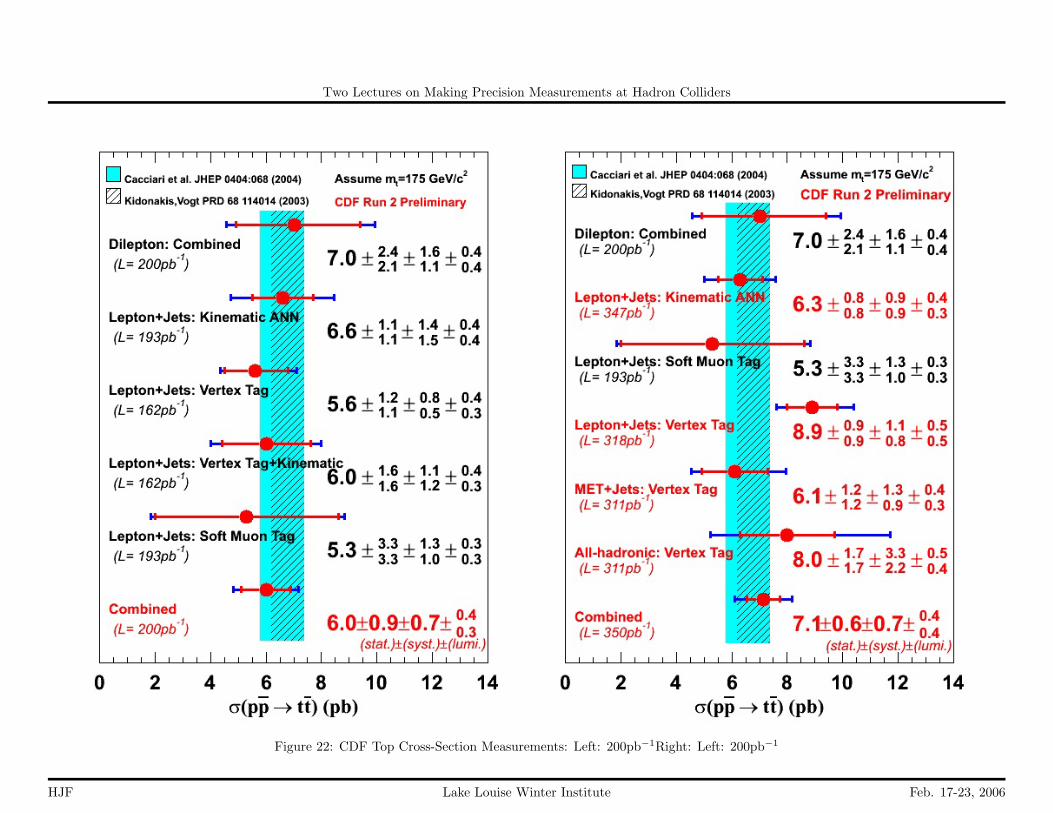
Two Lectures on Making Precision Measurements at Hadron Colliders
Figure 22: CDF Top Cross-Section Measurements: Left: 200pb−1Right: Left: 200pb−1
HJF Lake Louise Winter Institute Feb. 17-23, 2006
Two Lectures on Making Precision Measurements at Hadron Colliders
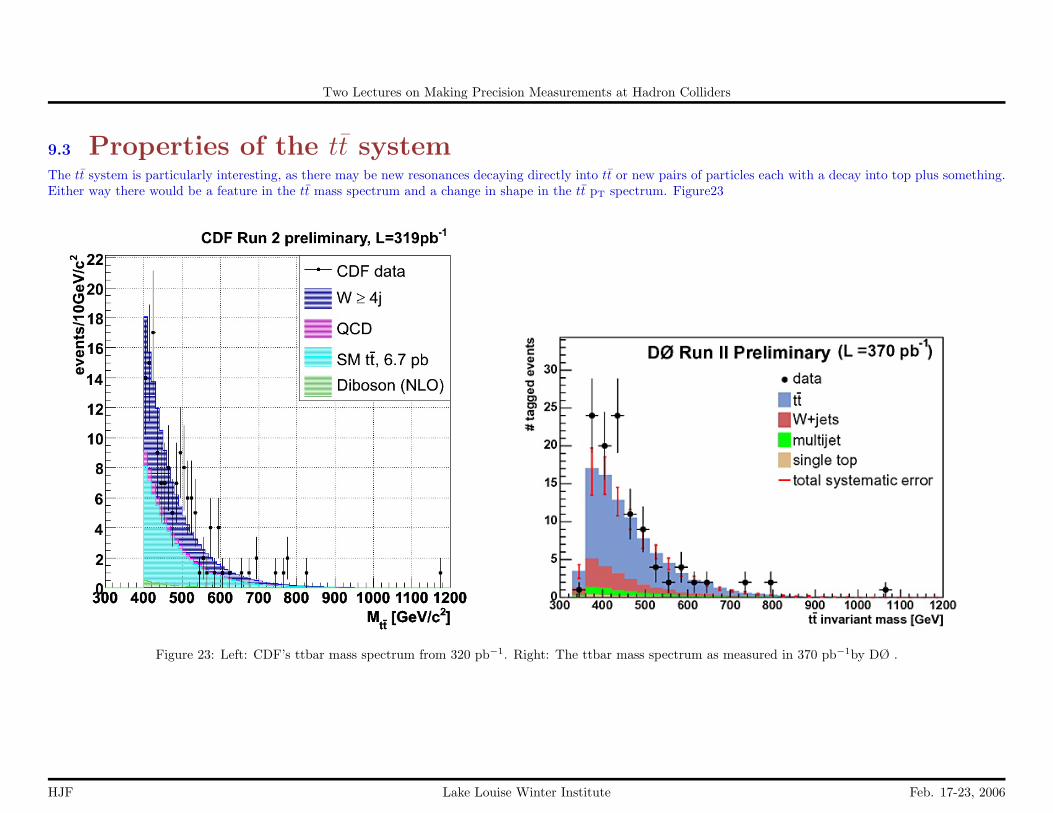
9.3 Properties of the tt̄ systemThe tt̄ system is particularly interesting, as there may be new resonances decaying directly into tt̄ or new pairs of particles each with a decay into top plus something.Either way there would be a feature in the tt̄ mass spectrum and a change in shape in the tt̄ pT spectrum. Figure23
Figure 23: Left: CDF’s ttbar mass spectrum from 320 pb−1. Right: The ttbar mass spectrum as measured in 370 pb−1by DØ .
HJF Lake Louise Winter Institute Feb. 17-23, 2006

Two Lectures on Making Precision Measurements at Hadron Colliders
Mass Templates for tt̄ system:What is the probability for a lower-mass pair to be reconstructed at a higher mass?Input a mean value for the pair, and look at the output. Abcissa runs from 0 to 1200GeV.
Figure 24: The output templates for an input ttbar pair mass; the abscissa runs between 0 and 1200 GeV in each plot (CDF).
450 GeV 500 GeV
550 GeV 600 GeV
650 GeV 700 GeV
750 GeV 800 GeV
850 GeV 900 GeV
HJF Lake Louise Winter Institute Feb. 17-23, 2006

Two Lectures on Making Precision Measurements at Hadron Colliders
9.4 Precision Measurement of the Top Mass
Summary of Top mass Measure-ments as of July 05. Notethe dilepton measurements tendto be systematically lower. Acomment- the D0 Run I measure-ment when analyzed by a differenttechnique (same data, same cali-bration) moved from 173.3±7.8 to180.1±5.3. A challenge- how bettershould we quantify the systematicson data selection and technique?
HJF Lake Louise Winter Institute Feb. 17-23, 2006
Two Lectures on Making Precision Measurements at Hadron Colliders
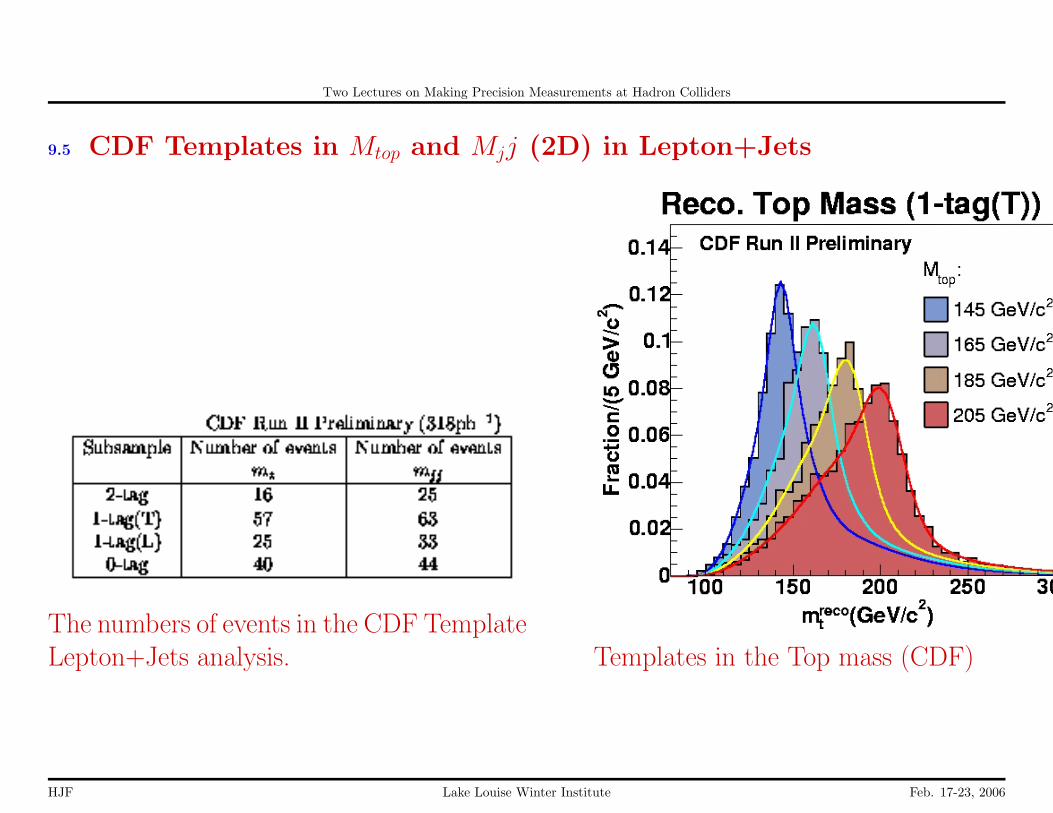
9.5 CDF Templates in Mtop and Mjj (2D) in Lepton+Jets
The numbers of events in the CDF TemplateLepton+Jets analysis. Templates in the Top mass (CDF)
HJF Lake Louise Winter Institute Feb. 17-23, 2006

Two Lectures on Making Precision Measurements at Hadron Colliders
CDF final fit to Mt in lepton+jets CDF final fit to MW (2-jet invariant mass) in lepton+jets
HJF Lake Louise Winter Institute Feb. 17-23, 2006
Two Lectures on Making Precision Measurements at Hadron Colliders
9.6 DØ Matrix Element Likelihood in Mtop and Mjj (2D) in Lepton+Jets
Drawback from more complex methods - often hard to judge by eye how good it looks -takes extra work to make transparent. Net gain in precision- but need simpler parallelanalysis for sanity checks.
HJF Lake Louise Winter Institute Feb. 17-23, 2006
Two Lectures on Making Precision Measurements at Hadron Colliders
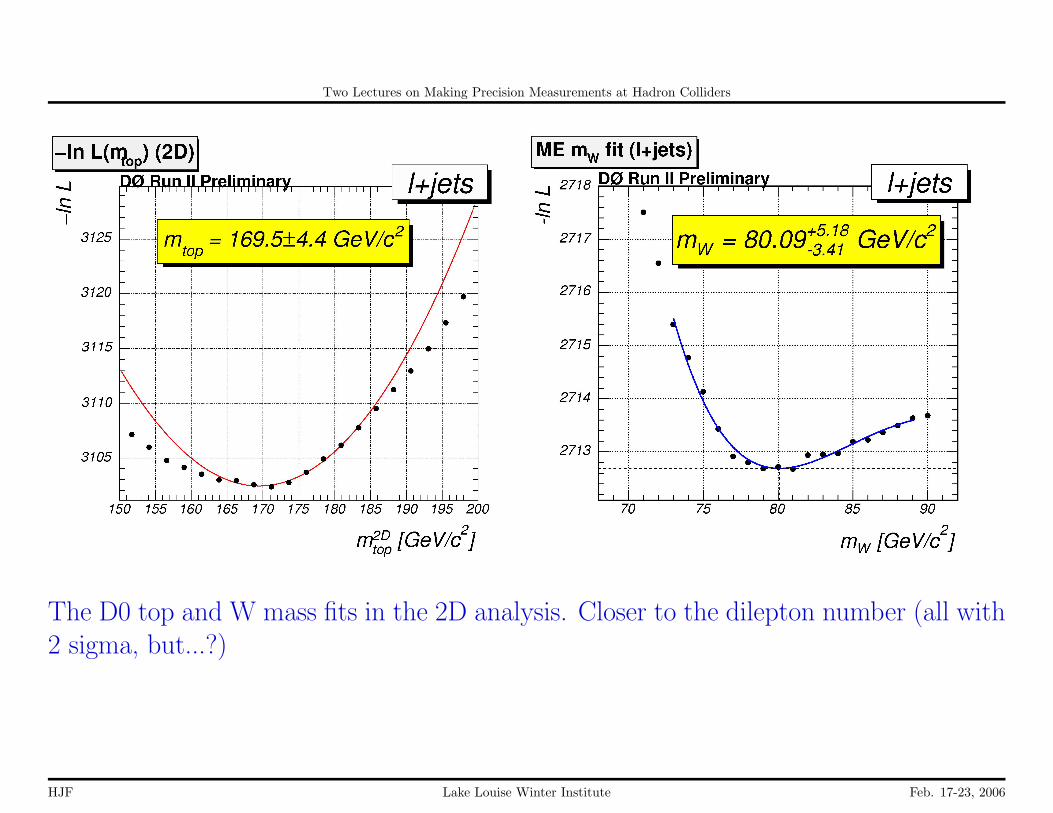
The D0 top and W mass fits in the 2D analysis. Closer to the dilepton number (all with2 sigma, but...?)
HJF Lake Louise Winter Institute Feb. 17-23, 2006

Two Lectures on Making Precision Measurements at Hadron Colliders
HJF Lake Louise Winter Institute Feb. 17-23, 2006
Two Lectures on Making Precision Measurements at Hadron Colliders
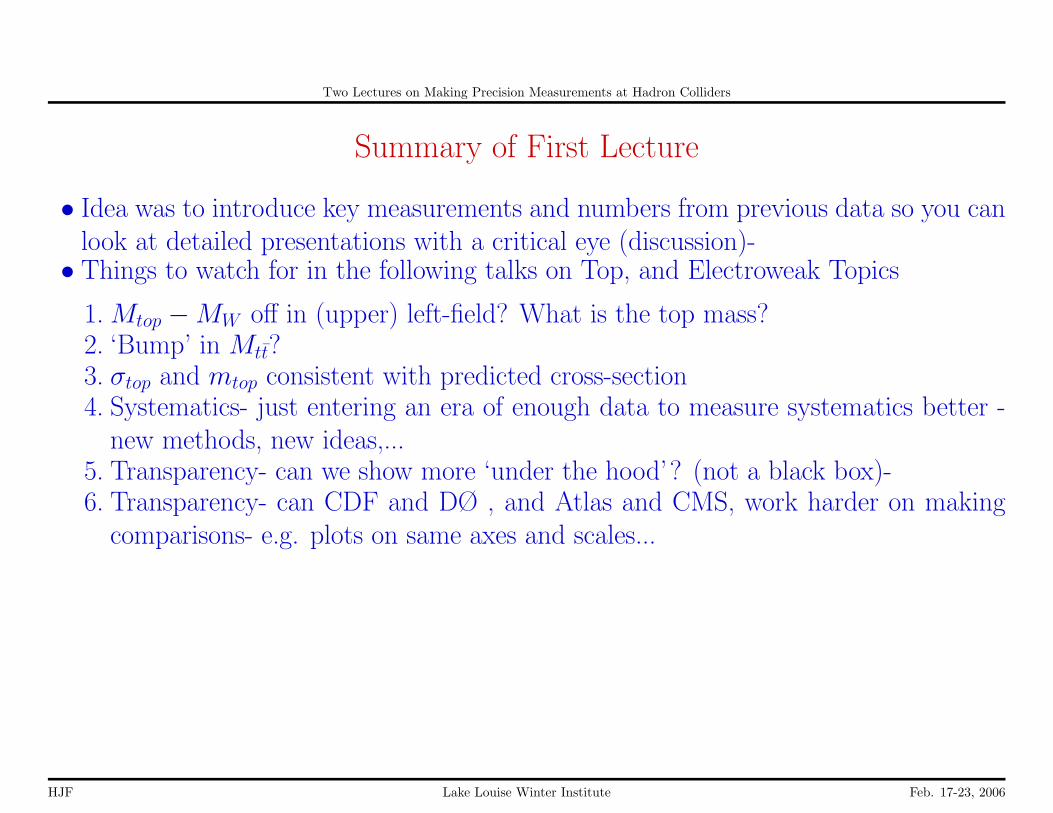
Summary of First Lecture
• Idea was to introduce key measurements and numbers from previous data so you canlook at detailed presentations with a critical eye (discussion)-
• Things to watch for in the following talks on Top, and Electroweak Topics
1. Mtop −MW off in (upper) left-field? What is the top mass?2. ‘Bump’ in Mtt̄?3. σtop and mtop consistent with predicted cross-section4. Systematics- just entering an era of enough data to measure systematics better -
new methods, new ideas,...5. Transparency- can we show more ‘under the hood’? (not a black box)-6. Transparency- can CDF and DØ , and Atlas and CMS, work harder on making
comparisons- e.g. plots on same axes and scales...
HJF Lake Louise Winter Institute Feb. 17-23, 2006
Two Lectures on Making Precision Measurements at Hadron Colliders
10 Credits
Talks I have found very useful and/or taken plots from:Florencia Canelli (UCLA), QCD and the Importance of Hadron Calibration at theTevatron, Feb. 2005, Tev4LHCRick Field (Florida) Jet Physics and the Underlying Event at the Tevatron, XXXVSymposium on Multiparticle Dynamics, Kromericz, Czech RepublicKenichi Hatakeyama (Rockefeller), How to Calibrate Jet Energy Scale, Coimbra, Por-tugal; Jan, 2006Aurelio Juste (FNAL) Lepton-Photon, July, 2005Cheng-Ju S. Lin, Heavy Flavor Physics at the Tevatron, Aspen Winter Conference,Feb. 2006Fabio Maltoni (CERN, Louvain) Theoretical Issues and Aims at the Tevatron andLHC, HCP2005, Les Diableret, Switz., July 2005Vaia Papadimitriou, B S, B C and b-baryons, XXXV Symposium on MultiparticleDynamics, Kromericz, Czech RepublicEric Varnes (Arizona), Measurement of Top Quark Decay Properties at Run II ofthe Tevatron, Top2006, Coimbra, Portugal; Jan, 2006Evelyn Thompson (Penn) Experimental Methods, Top2006, Coimbra, Portugal; Jan,
HJF Lake Louise Winter Institute Feb. 17-23, 2006
Two Lectures on Making Precision Measurements at Hadron Colliders
2006Carlos Wagner (ANL,UC) EFI Presentation, February 2006
Many thanks to: Eric Brubaker, Robin Erbacher, Ivan Furic, Chris Hays, Matt Hern-don, John Hobbs, Joey Huston, Steve Levy, Andrei Loginov, Ashutosh Kotwal, VaiaPapadimitriou, Jon Rosner, Jim Strait, Evelyn Thompson, Carlos Wagner
HJF Lake Louise Winter Institute Feb. 17-23, 2006