Embed Size (px)
Citation preview
Youth & Society2018, Vol. 50(6) 841 –866
© The Author(s) 2016Reprints and permissions:
sagepub.com/journalsPermissions.nav DOI: 10.1177/0044118X16658221
journals.sagepub.com/home/yas
Article
Making My Future Work: Evaluation of a New College and Career Readiness Curriculum
Justin C. Perry1, Eric W. Wallace1, and Meghan P. McCormick2
AbstractThe college and career readiness movement figures prominently in the nation’s educational reform and policies, including strategies to increase graduation rates among disadvantaged students in urban schools. As part of a multi-pronged approach to help youth transition to post-secondary education and the workforce, the present study evaluated a new career intervention, Making My Future Work, designed to serve as a comprehensive, flexible career curriculum. Based on a quasi-experimental design among a sample of urban youth (N = 429), multilevel modeling revealed promising evidence for its impact across a range of outcomes, including grade point average, school engagement, career preparation, self-determination, and self-awareness. The implications of the findings, limitations, and future directions for research are discussed.
Keywordscollege and career readiness, career education, urban youth
The so-called “dropout factories” across America face an ongoing crisis in urban schools (Balfanz & Legters, 2004). In 2008, nearly half of all students
1Cleveland State University, Cleveland, OH, USA2MDRC, New York, NY, USA
Corresponding Author:Justin C. Perry, Department of Counseling, Administration, Supervision, and Adult Learning, Cleveland State University, Julka Hall 278, 2121 Euclid Ave., Cleveland, OH 44115, USA. Email: [email protected]
658221 YASXXX10.1177/0044118X16658221Youth & SocietyPerry et al.research-article2016
842 Youth & Society 50(6)
(47%) in urban districts of the 50 largest cities failed to graduate from high school (Swanson, 2009). Nationwide, the average freshmen graduation rate in public schools during the 2011-2012 year was 76% among Hispanics and 68% among Blacks and American Indians/Alaska Natives (Kena et al., 2014). In response to this crisis, the Grad Nation campaign, launched in 2010, led to the creation of a “Civic Marshall Plan” to reach the national goal of a 90% high school graduation rate with at least 1 year of post-secondary education or training by 2020. College and career readiness figures prominently in the plan. To this end, career interventions (e.g., career academies, tech prep pro-grams, after-school programs, work-based learning) have captured increasing attention in educational policy, even though such approaches have been in existence for decades (Hynes & Hirsch, 2012; Jackson & Hasak, 2014).
Within the broad spectrum of K-12 career interventions, a wide range of approaches can serve to help prevent school dropout and promote college and career readiness, either in schools or in connection with schools through community-based partnerships (Perry & Wallace, 2012). When framed within a multi-pronged approach to helping youth transition to post-secondary education and the workforce, the present study evaluated an innovative program, Making My Future Work (MMFW). Although MMFW can benefit any population, it addresses the needs and experiences of low-income urban youth, who must often contend with an array of economic disparities, ecological risk factors, and structural barriers placing them at a disadvantage (Anyon, 1997; Oakes, 1985; Stephan & Rosenbaum, 2013). Over the past decade, the role of career and tech-nical education and approaches to learning embodied by the School-to-Work Opportunities Act of 1996 has gained renewed interest in educational policy, as strengthening the linkages between labor market needs and the preparation of secondary students has risen in national urgency (Stone, 2014).
School-Based Career Interventions: An Overview of Theory, Research, and Practice
Drawing from the disciplines of career development and vocational psychol-ogy, fostering a psychological connection between success in school and the world of work has stood as a key principle in explaining school engagement and academic motivation (Perry, Liu, & Pabian, 2010). In essence, students are posited to develop meaningful reasons for engaging in what they learn in school to the extent that they can form a plausible, sophisticated roadmap of their future, connecting school and other facets of their lives with their goals, career interests, and aspirations. Consequently, they become increasingly invested in their academic performance and persist in school (see Halpern, 2012). One of the most well-known theories of human motivation,
Perry et al. 843
self-determination theory (SDT; Deci & Ryan, 1985, 2000), has garnered a strong body of evidence for understanding the salience of career preparation during adolescence (Perry & Wallace, 2015).
SDT
SDT is a model of well-being and development that views humans as endowed with propensities that strive to meet three basic psychological needs: (a) autonomy, (b) competence, and (c) relatedness (see Deci & Ryan, 2000). When this triumvirate of needs is satisfied, people function in a more optimal, vigorous, and self-regulating manner (Reeve, 2012). A major principle of motivation espoused in SDT, internalization, refers to a process of becoming more autonomous in decision making and goal-directed behavior, ranging along a continuum from intrinsic to extrinsic motivation. In intrinsic states, people engage in an activity for its own sake (e.g., fun), representing the high-est level of autonomy. However, extrinsic states of motivation occur when people behave as a means to an end (e.g., earn rewards, avoid punishment). In SDT, extrinsic motivation can become more internalized depending on how the three needs are supported (Ryan, Lynch, Vansteenkiste, & Deci, 2011).
The impact of helping youth become more self-determined in school can be understood through the principles of SDT. In particular, three conditions of change which support the autonomy to learn are manifested when (a) a meaningful rationale is constructed about the relevance or instrumental value of school, (b) students’ perspectives are validated as they pertain to the con-nection between what they are learning and their life experiences, and (c) a sense of agency in pursuing goals and aspirations is cultivated (Deci & Ryan, 2000). An overlooked mechanism by which these conditions can be enhanced is through the motivational vehicle of career interventions, which connect what youth learn in school with two key developmental processes: (a) the “Who Am I?” question of self-exploration and (b) vocational exploration, or the examination of goals, hopes, expectations, and fears, including plans on how to achieve or overcome them. A purposeful and realistic approach to exploring career pathways and interests reinforces these processes, facilitat-ing a self-regulated style of motivation (Perry et al., 2010).
School Engagement as a Key Process of Change
The multidimensional construct known as school engagement (also referred to as student engagement) has witnessed a proliferation of theoretical, empirical, and public policy attention as an outcome of interest underlying school com-pletion and dropout, while acting as a mediator of academic achievement and
844 Youth & Society 50(6)
performance (Christenson, Reschly, & Wylie, 2012; Lawson & Lawson, 2013; Turner, Christensen, Kackar-Cam, Trucano, & Fulmer, 2014). A potent source of school engagement includes career interventions, though such interventions are conspicuously absent in the literature (Perry & Wallace, 2015).
Although conceptual variations of school engagement exist, Fredricks, Blumenfeld, and Paris’s (2004) framework has reached a general consensus among researchers investigating the relationships between motivation and engagement (Reeve, 2012). In brief, Fredricks et al. classified school engage-ment into three categories: (a) behavioral engagement, (b) emotional engage-ment, and (c) cognitive engagement. From a psychological perspective, the participation–identification model proposed by Finn (1989) aligns with emo-tional engagement; this model was designed to explain the process of bore-dom, withdrawal, and school dropout. Finn asserted that unless students value the purpose of school, feel they belong in school, and feel they are respected in school, they will decline in their cognitive and behavioral engagement. According to Perry (2008), the tenets of career development dovetail with Finn’s model with regard to the role that vocational and self-exploration play in providing a rationale to be engaged in school.
Given the clear linkages between career, academic, and socioemotional domains of youth development, interventions like MMFW possess a solid theoretical and empirical basis for their promise as an intervention to increase the likelihood of succeeding in secondary education and beyond. Compared with other approaches, a natural advantage of school-based interventions like MMFW is that they are accessible to all students. Thus, MMFW was designed to be integrated into regular classroom instruction.
MMFW: A College and Career Readiness Curriculum
A detailed description of the school–university partnership that resulted in the creation of MMFW, including its initial phases of program design and development, is provided by Perry, Cusner, and Pickett (2015). For the pur-poses of this study, the program’s structure, content, goals, and methods of delivery is briefly described. The curriculum manual (Perry et al., 2014) can be downloaded at no cost on its website.
Modules and Goals
MMFW is structured in four modules that, in total, consist of more than 80 les-son plans and activities that users can choose from based on their own needs, student population, settings, and objectives. Module 1 (Exploring Self and
Perry et al. 845
Identity) has a total of 11 lessons that focus, as the name implies, on the devel-opmental process of self-awareness and exploration in adolescence. Module 2 (Career Exploration, Planning, and Post-Secondary Pathways) contains 24 les-sons that focus on the developmental theme of answering the question, “Where am I going?” In doing so, youth engage in what is the traditional bread-and-butter of career programming, such as taking an interest inventory, exploring occupational interests, enlisting support from family and friends, interviewing employed adults, considering barriers in the workforce, and much more.
In comparison with the exploratory nature of Modules 1 and 2, Module 3 (My 21st-Century Skills Toolkit), consists of 26 lessons focusing on more concrete behaviors and skills dealing with the theme, “How will I get there?” In this module, youth develop assets and skills that help prepare them for the transition to post-secondary education/training and the labor market. These lessons represent a broad spectrum of skills and coping strategies commonly referred to as socioemotional learning, life skills, or positive youth develop-ment (Perry et al., 2015). Hence, the term 21st-century skills captures a wide range of characteristics (e.g., communication, time management, mock inter-views, stress management, resume writing). Finally, Module 4 (College Entry, Survival, and Success) contains 10 lessons focusing on the question, “What do I do once I’m in college?” These lessons help students prepare for the transition into higher education with respect to social, academic, and financial adjustments, as well as opportunities for development. Given the objectives of this module, most of the lessons are designed for seniors.
Methods of Delivery and Organization
The curriculum was made to be flexible so that users have the freedom to choose which lessons they deem to be most appropriate for their needs, while providing clear guidelines for organizing and delivering MMFW based on two models: (a) a sequential approach and (b) a menu-item, rotational approach. According to the latter, a lesson from one module is selected fol-lowing the completion of a lesson from a different model, rather than com-pleting lessons from one module before proceeding to the next set of lessons found in another module. Some lessons can be implemented for an extended duration, or be repeated in the same grade or future grades.
Summary
MMFW was designed to improve academic outcomes in a way that increases the odds of graduating from school on time and, simultaneously, reducing the risk of school dropout. The interrelated mechanisms of change (i.e., lessons
846 Youth & Society 50(6)
contained in Modules 1-4) reinforce each other’s promotion of the three tar-geted processes of school engagement, self-determination, and career prepa-ration (Perry & Wallace, 2015). These processes are posited to lead to the improvement of academic outcomes which, in turn, increase the likelihood of graduating and reduce the risk of dropout (see also, Rumberger & Rotermund, 2012). When youth engage in vocational exploration and acquire an internal locus of control over their future career choices, they become more engaged in school through the internalization of a self-regulated learning style. As the connections between school, self, and careers are crystallized, the roadmap toward achieving their goals becomes more realistic and mature.
Testing for Grade-Specific Impact
Youth of all backgrounds in the United States, especially students in urban schools, often decline in achievement, intrinsic motivation, and school engagement, starting in middle school and continuing through high school (e.g., Balfanz, Herzog, & Mac Iver, 2007; Rumberger & Rotermund, 2012; Wang & Eccles, 2012). Moving from middle school to high school (eighth-ninth grade transition) is a decisive point that can determine the odds of grad-uating (Charmaraman & Hall, 2011; McCallumore & Sparapani, 2010). During the freshman year, many urban youth are vulnerable to dropping out as they enter into a new environment with greater academic demands, increased sources of social stress, and potentially having to assume family responsibilities. By the 11th grade, most have made the decision to dropout, though youth at any grade may do so (Charmaraman & Hall, 2011). With these considerations in mind, the evaluation was designed to test for treat-ment impacts hypothesized to result in higher levels of school engagement, self-determination, career preparation, self-awareness, and grade point aver-age (GPA). The main analyses were organized by examining impact on out-comes within each grade. Given the developmental differences between youth transitioning into high school and, for example, youth transitioning into post-secondary education, examining outcomes within each specific grade also addressed the confounding effects of age and grade level.
Method
Participants
The total aggregate sample consisted of 429 students evenly represented by gender (51% male; 49% female), with 213 in the treatment group and 216 in the comparison group. The mean age was 15.61 (SD = 1.40 years). They were
Perry et al. 847
distributed across all grades in high school (nine through 12), with 45.46% (n = 195; 126 treatment, 69 comparison) enrolled as freshmen, 4.73% (n = 20; 13 treatment, seven comparison) as sophomores, 10.72% (n = 46; 22 treatment, 24 comparison) as juniors, and 39.16% (n = 168; 52 treatment, 116 comparison) as seniors.
Parental education was measured by student self-report, ranging from 1 (elementary school) to 8 (doctorate). On average, 16.4% of mothers in the total sample had less than a high school education, 25.8% a high school diploma, 24.9% a 2-year college degree or attended a business/trade school, 16.8% a 4-year college degree, and 7.1% a master’s degree or doctorate. In terms of race/ethnicity, the total sample identified predominantly as Black/African American (55%), followed by White (19%), Puerto Rican (15%), bi/multi-ethnic (6%), Asian American (1%), Middle Eastern (1%), and Other (1%). The remaining 3% identified as Caribbean, Mexican, Central American, and American Indian.
Participants attended one of four public high schools located in a major urban city in the Midwest. According to state public records, the students enrolled in School A (37.30%; n = 160) consist of 62.5% designated as eco-nomically disadvantaged (reduced/free lunch eligible), with a 4-year gradua-tion rate of 73.5% and a 93.5% attendance rate. In School B (42.42%; n = 182), 100% students are economically disadvantaged, with a 4-year gradua-tion rate of 72.5% and 83.5% attendance rate. In School C (12.82%; n = 55), 100% students are economically disadvantaged, with a 4-year graduation rate of 100% and a 94.9% attendance rate. Finally, School D (0.07%; n = 32) was represented by 100% economic disadvantage, with a 100% graduation rate and 96.7% attendance rate. There were 18 total classrooms (clusters) across the four schools. On average, there were 24 students enrolled in each classroom.
Design and Analytic Approach
Participating teachers at each school were those who volunteered to imple-ment MMFW in their English/language arts classes. Given that the purpose was to pilot test the efficacy of MMFW, a quasi-experimental design was appropriate. For a comparison group, teachers agreed to use at least one of their classes in the study according to “business as usual.” In other words, teachers were requested to select another class section(s) in the same subject matter that they determined to be as similar as possible in student character-istics to the treatment classroom(s). School C included only one teacher in the 12th grade; this particular teacher did not implement the intervention, and thus, her senior classes served as comparison groups.
848 Youth & Society 50(6)
Given that students were nested in classrooms, which were nested in high schools, our main analytic strategy was to model change in outcomes across the school year as a function of assignment to treatment. We regressed the level of Time 2 (T2) outcomes on the baseline value, adjusting for treatment status and covariates. We performed preliminary analyses consisting of three-level unconditional models to determine if there was significant between-classroom and between-school variation change in outcomes (separately for Times 1 and 2).
Intraclass correlations (ICCs) were calculated to identify the amount of variation in outcomes attributed to classroom and school membership. ICCs for the survey outcomes at both the school and classroom level were negli-gible, ranging from .00 to .05. In terms of GPA, the school-level ICC was .03 and .14 at the classroom level; in terms of number of days absent, the school-level ICC was .06 and .16 at the classroom level. The unconditional means model thus revealed small but non-negligible levels of between-classroom variation. However, there was very little between-school variation. As such, we used two-level models (students at Level 1, classrooms at Level 2) with school-fixed effects in subsequent conditional analyses. In Model 1, a ran-dom effect was included at Level 2 to allow the intercept to vary for class-room nesting (Raudenbush, 2009).
After running the unconditional models, we examined a series of condi-tional models, regressing the outcomes on a dummy variable for treatment status, race/ethnicity (1 = Black; 0 = non-Black), gender (1 = male; 0 = female), maternal level of education (1 = more than high school; 0 = less than high school), baseline levels of outcome of interest, and baseline levels of mastery orientation, disruptive behaviors, and academic self-efficacy. We adjusted for a number of these covariates to account for the fact that they were significantly correlated with outcomes. Theoretically, we also selected them based on past and present literature, which indicates that school behav-iors such as classroom disruption, self-regulated learning, and various demo-graphic factors (e.g., socioeconomic status, gender) are consistent predictors of academic performance (Perry & Wallace, 2015; Rumberger & Rotermund, 2012; Weinstein, Acee, & Jung, 2011).
To examine differential impact by grade, we divided the sample into grade-level groups and reran all analyses specifically within grade level. We made this decision, rather than including grade by treatment interactions in models, given limited power to detect statistically significant interactions and the need to clarify the specific level of the impact within grade level. As such, we determined that examining the total sample alone might mask or overlook important developmental differences in how students may or may not respond to the intervention.
Perry et al. 849
Missing data and attrition analyses. Student data from administrative records, survey items, and scales were examined. In terms of academic data, 123 were missing all academic data because only two schools (School A and B) pro-vided such data. These students were excluded from analyses. Of the 429 who completed baseline surveys, 258 participated in data collection at T2; thus, about 40% of the students attrited on survey measures. Attrition did not vary by treatment group status.
Students who were missing data points were compared with students who were not missing data points on all baseline variables. Analyses revealed that students missing survey follow-up data were not systematically different from those who had follow-up data on the vast majority of variables; those with missing data, however, were more likely to be assigned to School A and to have reported a higher number of absences. Given these overall findings, we assumed that the data were missing at random (MAR), conditional on being assigned to School A.
Based on Rubin’s (1987) criteria for identifying the relative increase in variance due to nonresponse, Yuan (2010) argues that with 10% to 30% miss-ingness and 10 data imputations, 97% efficiency can be reached with a mul-tiple data imputation in SAS PROC MI. As such, a multiple data imputation method was used and 10 separate data sets were imputed by chained equa-tions, using SAS PROC MI in SAS Version 9.3 (Yuan, 2011). All uncondi-tional and conditional analyses were run 10 separate times using the SAS PROC MIANALYZE function. Final parameter estimates were generated by calculating the mean of these 10 estimates.
Procedure
The research proposal was approved by the university human subjects review board, the principals, and school district administrators. The permission of teachers was obtained. Students who returned a signed informed consent form from their parent(s)/legal guardian were allowed to participate in the study. Data were collected from classes in language arts/English for survey measures and from the administrative/research offices of the participating schools for student academic data. The students completed a demographic sheet and series of ques-tionnaires during two class periods at baseline and post-test; they read and signed an assent form and were given a small snack for completing the question-naires. Portions of the questionnaires were not analyzed in this study, as they were part of a broader survey addressing other independent studies.
The intervention started according to each teacher’s schedule, beginning in September to concluding the program in May. Five teachers delivered MMFW conjointly with a classroom facilitator, whereas one teacher did not. Classroom
850 Youth & Society 50(6)
facilitators were graduate students in an urban secondary teacher preparation program and a doctoral-level counseling psychology program. The project director provided group supervision to the facilitators 1 hr per week.
Measures
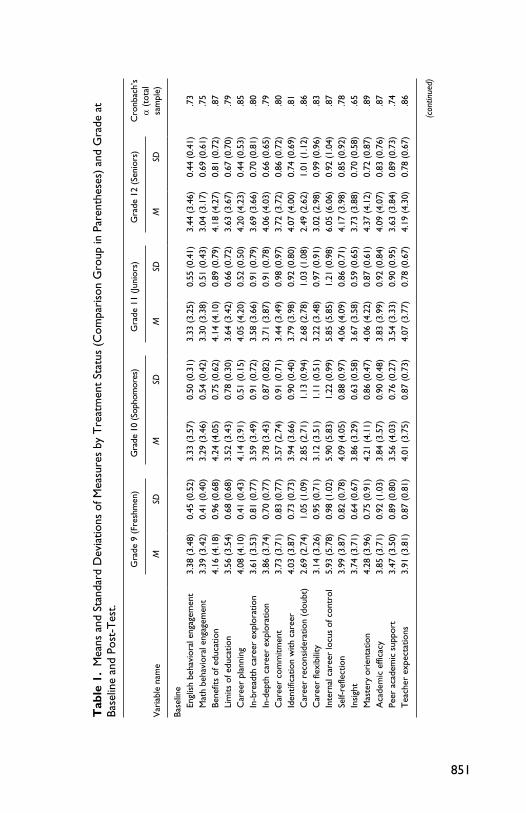
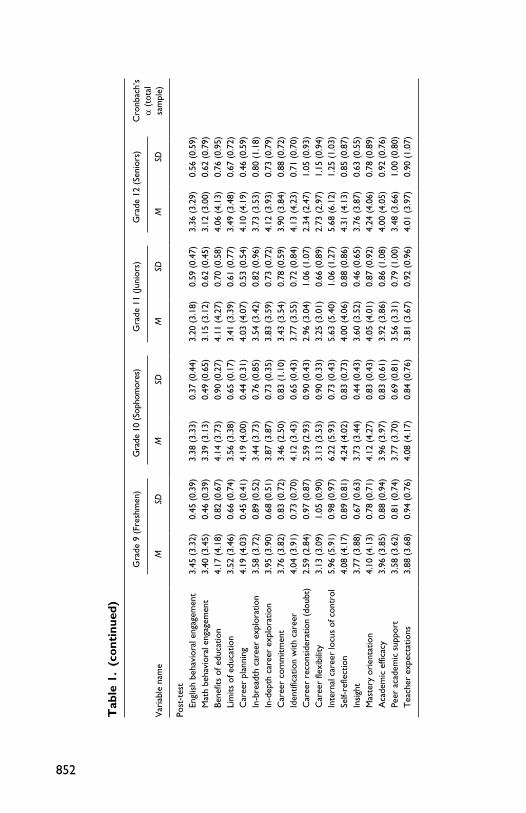
In this section, the measures are briefly described. Due to space limitations, sample items and scoring procedures for measures are not provided. The Cronbach’s αs are listed in Table 1.
Academic outcomes. Two academic indicators were assessed. Student GPA (on a 4-point scale) was obtained from school administrative records at the end of the school year when the intervention was delivered (T2) and at the end of the previous academic year before the study began (T1). Second, records of student absences (out of 180 days) were obtained for T1 and T2.
School engagement. This study used two indicators of school engagement. The first measure assesses the emotional dimension, whereas the second measure is designed to assess behavioral dimensions. The measure of emo-tional engagement is based on four subscales drawn from three motivational measures used by Murdock (1999) and Murdock, Anderman, and Hodge (2000). All items are rated on a Likert-type scale (1 = strongly agree; 5 = strongly disagree). Two of these subscales constitute the Economic Value of Education Scale (EVES; Murdock, 1999). The first subscale from the EVES, Limitations of Education, assesses perceptions of the relevance/utility for succeeding in school; it consists of 10 items. The second subscale, Benefits of Education, measures a positive belief system in the value of working hard in school as a vehicle toward gaining access to the opportunity structure; it contains five items.
Two other subscales from the EVES were used to measure perceptions of teachers and peers. Teachers’ Long-Term Expectations assesses youths’ per-ceptions of teachers’ beliefs and expectations of them to succeed in school; it contains five items. The fourth and final subscale, Peers’ Academic Support, measures perceptions of peers with respect to how much they value school and provide their support for academic efforts; it consists of five items.
In terms of behavioral engagement, the second instrument used, the School Engagement Questionnaire (SEQ; Dornbusch & Steinberg, 1990), is a self-report scale consisting of 12 items designed to assess the degree to which students are committed to school based on four factors: (a) homework, (b) classroom attention, (c) attendance, and (d) classroom concentration. Items are rated using a Likert-type scale, ranging from a value of 1 to either 5 or 6.
851
Tab
le 1
. M
eans
and
Sta
ndar
d D
evia
tions
of M
easu
res
by T
reat
men
t St
atus
(C
ompa
riso
n G
roup
in P
aren
thes
es)
and
Gra
de a
t Ba
selin
e an
d Po
st-T
est.
Var
iabl
e na
me
Gra
de 9
(Fr
eshm
en)
Gra
de 1
0 (S
opho
mor
es)
Gra
de 1
1 (Ju
nior
s)G
rade
12
(Sen
iors
)C
ronb
ach’
s α
(to
tal
sam
ple)
MSD
MSD
MSD
MSD
Base
line
Engl
ish
beha
vior
al e
ngag
emen
t3.
38 (
3.48
)0.
45 (
0.52
)3.
33 (
3.57
)0.
50 (
0.31
)3.
33 (
3.25
)0.
55 (
0.41
)3.
44 (
3.46
)0.
44 (
0.41
).7
3
Mat
h be
havi
oral
eng
agem
ent
3.39
(3.
42)
0.41
(0.
40)
3.29
(3.
46)
0.54
(0.
42)
3.30
(3.
38)
0.51
(0.
43)
3.04
(3.
17)
0.69
(0.
61)
.75
Be
nefit
s of
edu
catio
n4.
16 (
4.18
)0.
96 (
0.68
)4.
24 (
4.05
)0.
75 (
0.62
)4.
14 (
4.10
)0.
89 (
0.79
)4.
18 (
4.27
)0.
81 (
0.72
).8
7
Lim
its o
f edu
catio
n3.
56 (
3.54
)0.
68 (
0.68
)3.
52 (
3.43
)0.
78 (
0.30
)3.
64 (
3.42
)0.
66 (
0.72
)3.
63 (
3.67
)0.
67 (
0.70
).7
9
Car
eer
plan
ning
4.08
(4.
10)
0.41
(0.
43)
4.14
(3.
91)
0.51
(0.
15)
4.05
(4.
20)
0.52
(0.
50)
4.20
(4.
23)
0.44
(0.
53)
.85
In
-bre
adth
car
eer
expl
orat
ion
3.61
(3.
53)
0.81
(0.
77)
3.59
(3.
49)
0.91
(0.
72)
3.58
(3.
66)
0.91
(0.
79)
3.69
(3.
66)
0.70
(0.
81)
.80
In
-dep
th c
aree
r ex
plor
atio
n3.
86 (
3.74
)0.
70 (
0.77
)3.
78 (
3.43
)0.
87 (
0.82
)3.
71 (
3.87
)0.
91 (
0.78
)4.
06 (
4.03
)0.
66 (
0.65
).7
9
Car
eer
com
mitm
ent
3.73
(3.
71)
0.83
(0.
77)
3.57
(2.
74)
0.91
(0.
71)
3.44
(3.
49)
0.98
(0.
97)
3.72
(3.
72)
0.86
(0.
72)
.80
Id
entif
icat
ion
with
car
eer
4.03
(3.
87)
0.73
(0.
73)
3.94
(3.
66)
0.90
(0.
40)
3.79
(3.
98)
0.92
(0.
80)
4.07
(4.
00)
0.74
(0.
69)
.81
C
aree
r re
cons
ider
atio
n (d
oubt
)2.
69 (
2.74
)1.
05 (
1.09
)2.
85 (
2.71
)1.
13 (
0.94
)2.
68 (
2.78
)1.
03 (
1.08
)2.
49 (
2.62
)1.
01 (
1.12
).8
6
Car
eer
flexi
bilit
y3.
14 (
3.26
)0.
95 (
0.71
)3.
12 (
3.51
)1.
11 (
0.51
)3.
22 (
3.48
)0.
97 (
0.91
)3.
02 (
2.98
)0.
99 (
0.96
).8
3
Inte
rnal
car
eer
locu
s of
con
trol
5.93
(5.
78)
0.98
(1.
02)
5.90
(5.
83)
1.22
(0.
99)
5.85
(5.
85)
1.21
(0.
98)
6.05
(6.
06)
0.92
(1.
04)
.87
Se
lf-re
flect
ion
3.99
(3.
87)
0.82
(0.
78)
4.09
(4.
05)
0.88
(0.
97)
4.06
(4.
09)
0.86
(0.
71)
4.17
(3.
98)
0.85
(0.
92)
.78
In
sigh
t3.
74 (
3.71
)0.
64 (
0.67
)3.
86 (
3.29
)0.
63 (
0.58
)3.
67 (
3.58
)0.
59 (
0.65
)3.
73 (
3.88
)0.
70 (
0.58
).6
5
Mas
tery
ori
enta
tion
4.28
(3.
96)
0.75
(0.
91)
4.21
(4.
11)
0.86
(0.
47)
4.06
(4.
22)
0.87
(0.
61)
4.37
(4.
12)
0.72
(0.
87)
.89
A
cade
mic
effi
cacy
3.85
(3.
71)
0.92
(1.
03)
3.84
(3.
57)
0.90
(0.
48)
3.83
(3.
99)
0.92
(0.
84)
4.09
(4.
07)
0.83
(0.
76)
.87
Pe
er a
cade
mic
sup
port
3.47
(3.
50)
0.89
(0.
80)
3.56
(4.
03)
0.76
(0.
27)
3.54
(3.
33)
0.90
(0.
95)
3.63
(3.
84)
0.89
(0.
73)
.74
T
each
er e
xpec
tatio
ns3.
91 (
3.81
)0.
87 (
0.81
)4.
01 (
3.75
)0.
87 (
0.73
)4.
07 (
3.77
)0.
78 (
0.67
)4.
19 (
4.30
)0.
78 (
0.67
).8
6
(con
tinue
d)
852
Var
iabl
e na
me
Gra
de 9
(Fr
eshm
en)
Gra
de 1
0 (S
opho
mor
es)
Gra
de 1
1 (Ju
nior
s)G
rade
12
(Sen
iors
)C
ronb
ach’
s α
(to
tal
sam
ple)
MSD
MSD
MSD
MSD
Post
-tes
t
Engl
ish
beha
vior
al e
ngag
emen
t3.
45 (
3.32
)0.
45 (
0.39
)3.
38 (
3.33
)0.
37 (
0.44
)3.
20 (
3.18
)0.
59 (
0.47
)3.
36 (
3.29
)0.
56 (
0.59
)
M
ath
beha
vior
al e
ngag
emen
t3.
40 (
3.45
)0.
46 (
0.39
)3.
39 (
3.13
)0.
49 (
0.65
)3.
15 (
3.12
)0.
62 (
0.45
)3.
12 (
3.00
)0.
62 (
0.79
)
Be
nefit
s of
edu
catio
n4.
17 (
4.18
)0.
82 (
0.67
)4.
14 (
3.73
)0.
90 (
0.27
)4.
11 (
4.27
)0.
70 (
0.58
)4.
06 (
4.13
)0.
76 (
0.95
)
Li
mits
of e
duca
tion
3.52
(3.
46)
0.66
(0.
74)
3.56
(3.
38)
0.65
(0.
17)
3.41
(3.
39)
0.61
(0.
77)
3.49
(3.
48)
0.67
(0.
72)
Car
eer
plan
ning
4.19
(4.
03)
0.45
(0.
41)
4.19
(4.
00)
0.44
(0.
31)
4.03
(4.
07)
0.53
(0.
54)
4.10
(4.
19)
0.46
(0.
59)
In-b
read
th c
aree
r ex
plor
atio
n3.
58 (
3.72
)0.
89 (
0.52
)3.
44 (
3.73
)0.
76 (
0.85
)3.
54 (
3.42
)0.
82 (
0.96
)3.
73 (
3.53
)0.
80 (
1.18
)
In
-dep
th c
aree
r ex
plor
atio
n3.
95 (
3.90
)0.
68 (
0.51
)3.
87 (
3.87
)0.
73 (
0.35
)3.
83 (
3.59
)0.
73 (
0.72
)4.
12 (
3.93
)0.
73 (
0.79
)
C
aree
r co
mm
itmen
t3.
76 (
3.82
)0.
83 (
0.72
)3.
46 (
2.50
)0.
83 (
1.10
)3.
43 (
3.54
)0.
78 (
0.59
)3.
90 (
3.84
)0.
88 (
0.72
)
Id
entif
icat
ion
with
car
eer
4.04
(3.
91)
0.73
(0.
70)
4.12
(3.
43)
0.65
(0.
43)
3.77
(3.
55)
0.72
(0.
84)
4.13
(4.
23)
0.71
(0.
70)
Car
eer
reco
nsid
erat
ion
(dou
bt)
2.59
(2.
84)
0.97
(0.
87)
2.59
(2.
93)
0.90
(0.
43)
2.96
(3.
04)
1.06
(1.
07)
2.34
(2.
47)
1.05
(0.
93)
Car
eer
flexi
bilit
y3.
13 (
3.09
)1.
05 (
0.90
)3.
13 (
3.53
)0.
90 (
0.33
)3.
25 (
3.01
)0.
66 (
0.89
)2.
73 (
2.97
)1.
15 (
0.94
)
In
tern
al c
aree
r lo
cus
of c
ontr
ol5.
96 (
5.91
)0.
98 (
0.97
)6.
22 (
5.93
)0.
73 (
0.43
)5.
63 (
5.40
)1.
06 (
1.27
)5.
68 (
6.12
)1.
25 (
1.03
)
Se
lf-re
flect
ion
4.08
(4.
17)
0.89
(0.
81)
4.24
(4.
02)
0.83
(0.
73)
4.00
(4.
06)
0.88
(0.
86)
4.31
(4.
13)
0.85
(0.
87)
Insi
ght
3.77
(3.
88)
0.67
(0.
63)
3.73
(3.
44)
0.44
(0.
43)
3.60
(3.
52)
0.46
(0.
65)
3.76
(3.
87)
0.63
(0.
55)
Mas
tery
ori
enta
tion
4.10
(4.
13)
0.78
(0.
71)
4.12
(4.
27)
0.83
(0.
43)
4.05
(4.
01)
0.87
(0.
92)
4.24
(4.
06)
0.78
(0.
89)
Aca
dem
ic e
ffica
cy3.
96 (
3.85
)0.
88 (
0.94
)3.
96 (
3.97
)0.
83 (
0.61
)3.
92 (
3.86
)0.
86 (
1.08
)4.
00 (
4.05
)0.
92 (
0.76
)
Pe
er a
cade
mic
sup
port
3.58
(3.
62)
0.81
(0.
74)
3.77
(3.
70)
0.69
(0.
81)
3.56
(3.
31)
0.79
(1.
00)
3.48
(3.
66)
1.00
(0.
80)
Tea
cher
exp
ecta
tions
3.88
(3.
68)
0.94
(0.
76)
4.08
(4.
17)
0.84
(0.
76)
3.81
(3.
67)
0.92
(0.
96)
4.01
(3.
97)
0.90
(1.
07)
Tab
le 1
. (c
ont
inue
d)
Perry et al. 853
Eight items for math and English class were used only, as not every student took social studies.
Career planning. This construct was assessed by the school form of a subscale from the Career Development Inventory (CDI; Super, Thompson, Lindeman, Jordaan, & Myers, 1981). The Career Planning subscale is an 11-item scale that measures exploratory actions and thought processes concerning planning about future career interests and preferred occupations; the items are rated on a 4-point scale ranging from 1 (strongly disagree) to 4 (strongly agree).
Career locus of control. This construct was assessed by the Career Locus of Control Scale for Adolescents (CLCS; Millar & Shevlin, 2007). The CLCS measures two basic loci of control: internal and external. Millar and Shevlin (2007) found that a two-factor model (Internality and Externality) was the most useful solution for 20 self-report items. For the purposes of this study, only one of the subscales was used: Internality (five items). A 7-point scale ranging from 1 (strongly disagree) to 7 (strongly agree) was used.
Vocational identity status. This construct represents the exploration and com-mitment dimensions of career preparation. The instrument used to measure these two dimensions, the Vocational Identity Status Assessment (VISA; Por-feli, Lee, Vondracek, & Weigold, 2011), is a 30-item Likert-type scale rang-ing from 1 (strongly disagree) to 5 (strongly agree). The VISA consists of six subscales, each of which contains five self-report items: (a) In-Breadth Career Exploration, which assesses a broad approach to exploring or “trying out” a range of career options; (b) In-Depth Career Exploration, designed to measure a more focused exploration of a narrower range of choices; (c) Career Commitment Making, which taps the extent to which youth are certain about a career; (d) Identification With Career Commitment, assessing the extent to which youth are attached to their career choice as an outlet for expression; (e) Career Self-Doubt, which measures ambivalence or skepti-cism about choosing a career, and (f) Career Flexibility, which taps the extent to which youth are open to career alternatives.
Psychological mindedness. This construct refers to the capacity to explore one’s own thoughts, feelings, and behaviors, while gaining an understanding of how and why they occur. The Self-Reflection and Insight Scale for Youth (SRIS-Y; Sauter, Heyne, Blöte, van Widenfelt, & Westenberg, 2010) was used, consisting of 17 self-report Likert-type scale items ranging from 1 (strongly disagree) to 6 (strongly agree). The Self-Reflection subscale con-tains 11 items; the Insight subscale is comprised of six items.
854 Youth & Society 50(6)
Self-determination. Self-determined (autonomous) learning was assessed by two scales from the Patterns of Adaptive Learning Scales (PALS; Midgley et al., 2000): (a) Mastery Goal Orientation (Revised) and (b) Academic Effi-cacy. The first scale is designed to assess the extent to which students’ pur-pose or goal in school is to master academic content, learn new concepts, and develop new skills; it consists of five Likert-type items asking youth to rate how each statement best describes them, ranging from 1 (not at all true) to 5 (very true). The second scale measures perceptions of how competent stu-dents believe they are in mastering or learning their schoolwork; it consists of five items using the same Likert-type scale.
Disruptive behavior. This construct was treated as a relevant covariate because of its relationship with behavioral engagement and other indicators of aca-demic performance. The Disruptive Behavior scale was drawn from PALS (Midgley et al., 2000), consisting of five Likert-type self-report items with the same response options as other PALS scales. This measure is not listed in Table 1; as such, a Cronbach’s α of .91 was found in the current study.
Fidelity of implementation and dosage. A rating sheet constructed by the research-ers was used following the completion of a lesson; every lesson has a fidelity measure that enlists users to indicate on a dichotomous rating scale (yes; no) whether a procedure was carried out as intended. The proportion of “yes” responses represents the degree to which a lesson is implemented with fidelity. In terms of dosage levels, attendance records for each day of class that imple-mented a lesson were used, indicating if a student was present or absent; the proportion of days present out of the total sessions held was calculated.
Results
The means and standard deviations at baseline (T1) for all survey measures are presented in Table 1 according to treatment status and grade level (comparison group statistics are denoted in parentheses). The reliabilities reported for each measure were based on multiply imputed data (10 data sets). Similarly, the descriptive statistics are based on findings generated from multiply imputed data sets; at post-imputation, however, these values did not significantly differ from the descriptive statistics calculated using listwise deletion techniques. It was decided to use average scores of items when computing the means of mea-sures, rather than average total scores of scales. Using a mean scale score facili-tates interpretation of the regression coefficients.
In terms of baseline GPA, the descriptive statistics were similar across grade level, falling in the C to B range. For the ninth grade (freshmen), the mean was
Perry et al. 855
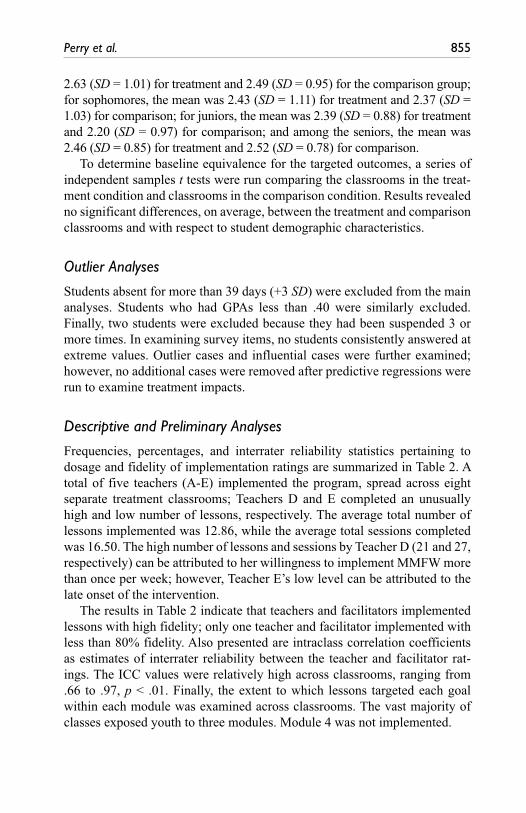
2.63 (SD = 1.01) for treatment and 2.49 (SD = 0.95) for the comparison group; for sophomores, the mean was 2.43 (SD = 1.11) for treatment and 2.37 (SD = 1.03) for comparison; for juniors, the mean was 2.39 (SD = 0.88) for treatment and 2.20 (SD = 0.97) for comparison; and among the seniors, the mean was 2.46 (SD = 0.85) for treatment and 2.52 (SD = 0.78) for comparison.
To determine baseline equivalence for the targeted outcomes, a series of independent samples t tests were run comparing the classrooms in the treat-ment condition and classrooms in the comparison condition. Results revealed no significant differences, on average, between the treatment and comparison classrooms and with respect to student demographic characteristics.
Outlier Analyses
Students absent for more than 39 days (+3 SD) were excluded from the main analyses. Students who had GPAs less than .40 were similarly excluded. Finally, two students were excluded because they had been suspended 3 or more times. In examining survey items, no students consistently answered at extreme values. Outlier cases and influential cases were further examined; however, no additional cases were removed after predictive regressions were run to examine treatment impacts.
Descriptive and Preliminary Analyses
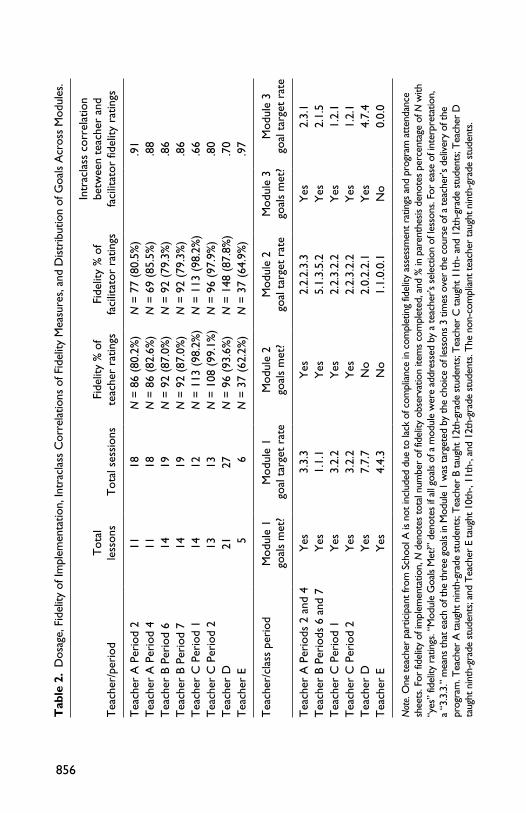
Frequencies, percentages, and interrater reliability statistics pertaining to dosage and fidelity of implementation ratings are summarized in Table 2. A total of five teachers (A-E) implemented the program, spread across eight separate treatment classrooms; Teachers D and E completed an unusually high and low number of lessons, respectively. The average total number of lessons implemented was 12.86, while the average total sessions completed was 16.50. The high number of lessons and sessions by Teacher D (21 and 27, respectively) can be attributed to her willingness to implement MMFW more than once per week; however, Teacher E’s low level can be attributed to the late onset of the intervention.
The results in Table 2 indicate that teachers and facilitators implemented lessons with high fidelity; only one teacher and facilitator implemented with less than 80% fidelity. Also presented are intraclass correlation coefficients as estimates of interrater reliability between the teacher and facilitator rat-ings. The ICC values were relatively high across classrooms, ranging from .66 to .97, p < .01. Finally, the extent to which lessons targeted each goal within each module was examined across classrooms. The vast majority of classes exposed youth to three modules. Module 4 was not implemented.
856
Tab
le 2
. D
osag
e, F
idel
ity o
f Im
plem
enta
tion,
Intr
acla
ss C
orre
latio
ns o
f Fid
elity
Mea
sure
s, a
nd D
istr
ibut
ion
of G
oals
Acr
oss
Mod
ules
.
Tea
cher
/per
iod
Tot
al
less
ons
Tot
al s
essi
ons
Fide
lity
% o
f te
ache
r ra
tings
Fide
lity
% o
f fa
cilit
ator
rat
ings
Intr
acla
ss c
orre
latio
n be
twee
n te
ache
r an
d fa
cilit
ator
fide
lity
ratin
gs
Tea
cher
A P
erio
d 2
1118
N =
86
(80.
2%)
N =
77
(80.
5%)
.91
Tea
cher
A P
erio
d 4
1118
N =
86
(82.
6%)
N =
69
(85.
5%)
.88
Tea
cher
B P
erio
d 6
1419
N =
92
(87.
0%)
N =
92
(79.
3%)
.86
Tea
cher
B P
erio
d 7
1419
N =
92
(87.
0%)
N =
92
(79.
3%)
.86
Tea
cher
C P
erio
d 1
1412
N =
113
(98
.2%
)N
= 1
13 (
98.2
%)
.66
Tea
cher
C P
erio
d 2
1313
N =
108
(99
.1%
)N
= 9
6 (9
7.9%
).8
0T
each
er D
2127
N =
96
(93.
6%)
N =
148
(87
.8%
).7
0T
each
er E
56
N =
37
(62.
2%)
N =
37
(64.
9%)
.97
Tea
cher
/cla
ss p
erio
dM
odul
e 1
goal
s m
et?
Mod
ule
1go
al t
arge
t ra
teM
odul
e 2
goal
s m
et?
Mod
ule
2go
al t
arge
t ra
teM
odul
e 3
goal
s m
et?
Mod
ule
3go
al t
arge
t ra
te
Tea
cher
A P
erio
ds 2
and
4Y
es3.
3.3
Yes
2.2.
2.3.
3Y
es2.
3.1
Tea
cher
B P
erio
ds 6
and
7Y
es1.
1.1
Yes
5.1.
3.5.
2Y
es2.
1.5
Tea
cher
C P
erio
d 1
Yes
3.2.
2Y
es2.
2.3.
2.2
Yes
1.2.
1T
each
er C
Per
iod
2Y
es3.
2.2
Yes
2.2.
3.2.
2Y
es1.
2.1
Tea
cher
DY
es7.
7.7
No
2.0.
2.2.
1Y
es4.
7.4
Tea
cher
EY
es4.
4.3
No
1.1.
0.0.
1N
o0.
0.0
Not
e. O
ne te
ache
r pa
rtic
ipan
t fro
m S
choo
l A is
not
incl
uded
due
to la
ck o
f com
plia
nce
in c
ompl
etin
g fid
elity
ass
essm
ent r
atin
gs a
nd p
rogr
am a
tten
danc
e sh
eets
. For
fide
lity
of im
plem
enta
tion,
N d
enot
es to
tal n
umbe
r of
fide
lity
obse
rvat
ion
item
s co
mpl
eted
, and
% in
par
enth
esis
deno
tes
perc
enta
ge o
f N w
ith
“yes
” fid
elity
rat
ings
. “M
odul
e G
oals
Met
?” d
enot
es if
all
goal
s of
a m
odul
e w
ere
addr
esse
d by
a te
ache
r’s s
elec
tion
of le
sson
s. Fo
r ea
se o
f int
erpr
etat
ion,
a
“3.3
.3.”
mea
ns th
at e
ach
of th
e th
ree
goal
s in
Mod
ule
1 w
as ta
rget
ed b
y th
e ch
oice
of l
esso
ns 3
tim
es o
ver
the
cour
se o
f a te
ache
r’s d
eliv
ery
of th
e pr
ogra
m. T
each
er A
taug
ht n
inth
-gra
de s
tude
nts;
Tea
cher
B ta
ught
12t
h-gr
ade
stud
ents
; Tea
cher
C ta
ught
11t
h- a
nd 1
2th-
grad
e st
uden
ts; T
each
er D
ta
ught
nin
th-g
rade
stu
dent
s; an
d T
each
er E
taug
ht 1
0th-
, 11t
h-, a
nd 1
2th-
grad
e st
uden
ts. T
he n
on-c
ompl
iant
teac
her
taug
ht n
inth
-gra
de s
tude
nts.
Perry et al. 857
Main Results
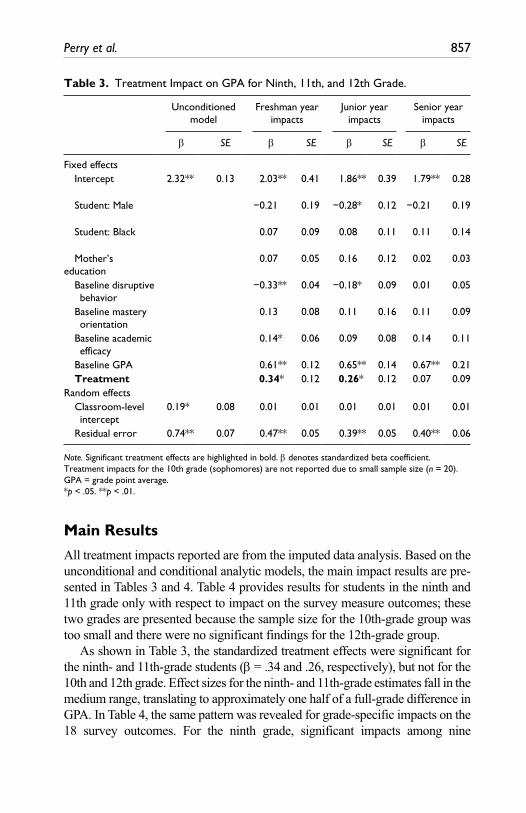
All treatment impacts reported are from the imputed data analysis. Based on the unconditional and conditional analytic models, the main impact results are pre-sented in Tables 3 and 4. Table 4 provides results for students in the ninth and 11th grade only with respect to impact on the survey measure outcomes; these two grades are presented because the sample size for the 10th-grade group was too small and there were no significant findings for the 12th-grade group.
As shown in Table 3, the standardized treatment effects were significant for the ninth- and 11th-grade students (β = .34 and .26, respectively), but not for the 10th and 12th grade. Effect sizes for the ninth- and 11th-grade estimates fall in the medium range, translating to approximately one half of a full-grade difference in GPA. In Table 4, the same pattern was revealed for grade-specific impacts on the 18 survey outcomes. For the ninth grade, significant impacts among nine
Table 3. Treatment Impact on GPA for Ninth, 11th, and 12th Grade.
Unconditioned model
Freshman year impacts
Junior year impacts
Senior year impacts
β SE β SE β SE β SE
Fixed effects Intercept 2.32** 0.13 2.03** 0.41 1.86** 0.39 1.79** 0.28
Student: Male −0.21 0.19 −0.28* 0.12 −0.21 0.19
Student: Black 0.07 0.09 0.08 0.11 0.11 0.14
Mother’s education
0.07 0.05 0.16 0.12 0.02 0.03
Baseline disruptive behavior
−0.33** 0.04 −0.18* 0.09 0.01 0.05
Baseline mastery orientation
0.13 0.08 0.11 0.16 0.11 0.09
Baseline academic efficacy
0.14* 0.06 0.09 0.08 0.14 0.11
Baseline GPA 0.61** 0.12 0.65** 0.14 0.67** 0.21 Treatment 0.34* 0.12 0.26* 0.12 0.07 0.09Random effects Classroom-level
intercept0.19* 0.08 0.01 0.01 0.01 0.01 0.01 0.01
Residual error 0.74** 0.07 0.47** 0.05 0.39** 0.05 0.40** 0.06
Note. Significant treatment effects are highlighted in bold. β denotes standardized beta coefficient. Treatment impacts for the 10th grade (sophomores) are not reported due to small sample size (n = 20). GPA = grade point average.*p < .05. **p < .01.
858 Youth & Society 50(6)
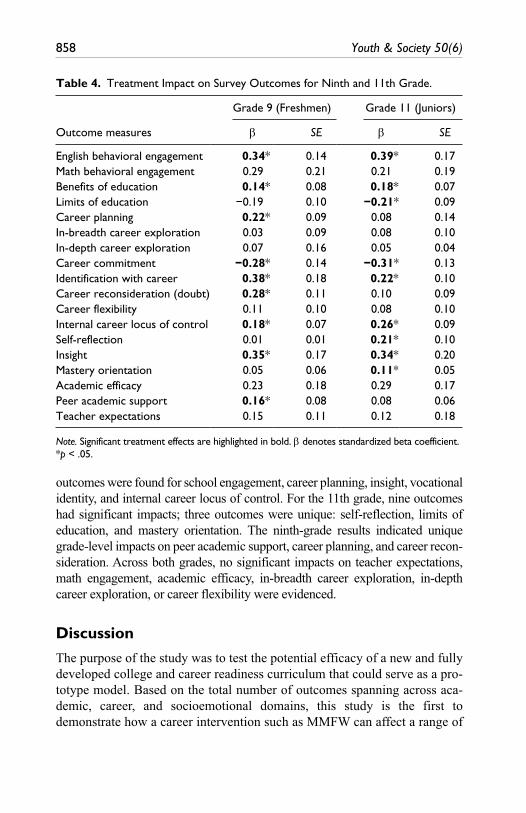
outcomes were found for school engagement, career planning, insight, vocational identity, and internal career locus of control. For the 11th grade, nine outcomes had significant impacts; three outcomes were unique: self-reflection, limits of education, and mastery orientation. The ninth-grade results indicated unique grade-level impacts on peer academic support, career planning, and career recon-sideration. Across both grades, no significant impacts on teacher expectations, math engagement, academic efficacy, in-breadth career exploration, in-depth career exploration, or career flexibility were evidenced.
Discussion
The purpose of the study was to test the potential efficacy of a new and fully developed college and career readiness curriculum that could serve as a pro-totype model. Based on the total number of outcomes spanning across aca-demic, career, and socioemotional domains, this study is the first to demonstrate how a career intervention such as MMFW can affect a range of
Table 4. Treatment Impact on Survey Outcomes for Ninth and 11th Grade.
Outcome measures
Grade 9 (Freshmen) Grade 11 (Juniors)
β SE β SE
English behavioral engagement 0.34* 0.14 0.39* 0.17Math behavioral engagement 0.29 0.21 0.21 0.19Benefits of education 0.14* 0.08 0.18* 0.07Limits of education −0.19 0.10 −0.21* 0.09Career planning 0.22* 0.09 0.08 0.14In-breadth career exploration 0.03 0.09 0.08 0.10In-depth career exploration 0.07 0.16 0.05 0.04Career commitment −0.28* 0.14 −0.31* 0.13Identification with career 0.38* 0.18 0.22* 0.10Career reconsideration (doubt) 0.28* 0.11 0.10 0.09Career flexibility 0.11 0.10 0.08 0.10Internal career locus of control 0.18* 0.07 0.26* 0.09Self-reflection 0.01 0.01 0.21* 0.10Insight 0.35* 0.17 0.34* 0.20Mastery orientation 0.05 0.06 0.11* 0.05Academic efficacy 0.23 0.18 0.29 0.17Peer academic support 0.16* 0.08 0.08 0.06Teacher expectations 0.15 0.11 0.12 0.18
Note. Significant treatment effects are highlighted in bold. β denotes standardized beta coefficient.*p < .05.
Perry et al. 859
important areas in positive youth development. Furthermore, it evaluated the program’s impact on a host of career development outcomes in a psychologi-cally sophisticated manner that is not usually conducted by researchers in education. Overall, the results offer promising support for the effectiveness of MMFW. Although preliminary in nature, they suggest that the timing of the intervention, or when youth are exposed to the program, may make an appreciable difference in determining its ultimate impact.
The medium effect size revealed for GPA (e.g., the difference between a B vs. a B−/C+) in the ninth and 11th grade is notable given that it is not only a robust predictor of school completion, but also is a difficult outcome to change in high school (Perry & Wallace, 2015). This key finding makes theo-retical sense insofar as MMFW improves GPA by increasing school engage-ment and self-determination. Consistent with the principles of SDT and the alignment of MMFW with self-exploration and vocational exploration, Wallace and Chhuon (2014) assert that urban youths’ perceptions of “being known” can promote learning (in this case, autonomous, self-determined learning) when “teachers are supportive of adolescents’ complex identities and postsecondary goals” (p. 5). The improvement in GPA lends support to this premise given that different, inter-connected domains of students’ experi-ences (career, personal, family, and cultural) are intentionally targeted throughout the course of the program’s implementation.
The motivational underpinnings of career development have been dis-cussed by various scholars in educational and developmental psychology using various theories of motivation (e.g., Ajzen, 1985; Wigfield & Eccles, 1992), yet they share the same fundamental ideas proposed in various theories of career development that are consistent with SDT (Perry & Wallace, 2015). Outside of vocational psychology, the closest resemblance to the application of SDT within the context of a career intervention is illustrated by CareerStart (Orthner et al., 2010). Designed as a universal intervention for middle school students, CareerStart aims to counteract school disengagement by “helping teachers and other school professionals explain how people in real jobs actu-ally use the information that is being taught in the class-room” (Orthner et al., 2010, p. 224). Hence, teachers improve the “extrinsic relevance” of their les-sons (Rose, Woolley, Orthner, Akos, & Jones-Sanpei, 2012).
In terms of career preparation, the results were generally favorable, yet revealed mixed findings depending on the outcome and grade. Career plan-ning was increased among the ninth grade only; this finding could be viewed from a developmental perspective to the extent that the first year of high school may represent the most sensitive time for changing such an outcome. However, the lack of significant change in other components of vocational identity (in-depth and in-breadth) is at odds with this inference. Perhaps these
860 Youth & Society 50(6)
measures were not sensitive in detecting change compared with the career planning measure, which assesses behaviors (e.g., after-school activities, tak-ing a part-time job) as opposed to cognitions and learning. In any case, the results found for career reconsideration (doubt) among freshmen, but for no other grade, support the notion that the ninth grade is the optimal time to initi-ate vocational exploration in high school. Although an increase in this out-come seems detrimental, it is viewed as a mature examination of initial career options and barriers. When urban youth encounter their career interests with a more purposeful and realistic approach, they can become doubtful about their original goals and their confidence about how to achieve them. This activation of realism, which can generate anxiety or ambivalence, can then be translated into resilient, goal-directed behavior through the support and guid-ance offered by programs like MMFW (Perry, 2008; Perry & Wallace, 2015). This premise ties back into the principles of SDT, which asserts that youths’ needs for autonomy are nourished not only by the cultivation of goals and aspirations but also by the construction of a meaningful rationale for why school is important to achieve them in the context of their everyday experience.
In terms of socioemotional outcomes, the findings confirmed our hypoth-esis that self-awareness would be improved. According to Perry et al. (2015), career programming addresses a wide range of “21st century skills” or “non-cognitive outcomes” associated with success in school and the workforce, including the capacity to understand one’s values, beliefs, abilities, and per-sonality traits. The results provide evidence that self-awareness can be mean-ingfully developed by MMFW, at least in the ninth and 11th grade. From an SDT perspective, self-exploration activities provided through MMFW culti-vate conditions for enhanced insight and self-reflection while offering a developmental vehicle for advancing youths’ autonomy to learn as they inte-grate such activities with the process of vocational exploration.
A final pattern of results that warrants attention pertains to our approach to examining grade-level impacts. Given that no significant effects were revealed among seniors, it may be “too late” for MMFW to yield appreciable differences at this period in the high school years. When situated in the con-text of the significant results for the 11th grade, it is plausible that juniors are more likely to explore careers than seniors, who may be more inclined to “check out” from the expectations and demands of their schoolwork. As such, seniors may not be as invested in their academic success as their peers in the 11th grade. Given that none of the lessons from Module 4 were implemented, however, it is also possible that a lack of alignment between the lessons and those recommended for seniors can partially explain the non-significant results. Future research will need to disentangle these speculations. Overall,
Perry et al. 861
the findings suggest that the ninth grade is the optimal time when MMFW can make its greatest impact during high school.
Limitations, Future Directions, and Implications for Practice
At this point, it may be premature to draw conclusions about best practices concerning the organization and delivery of MMFW until there are future evaluations through randomized controlled trials. Nevertheless, the promis-ing evidence demonstrated across a host of outcomes for this new curriculum is impressive.
Perhaps the most natural limitation in this study is sample size. This issue was especially problematic among 10th graders. Because the sample for this grade was so small, the findings could not be interpreted with adequate sta-tistical power. It thus remains to be seen if the same results for juniors can also be replicated among sophomores; albeit, caution should be used for ren-dering judgments about the 11th-grade findings given their fairly small sam-ple size. Another limitation of design was the fact that school attendance was relatively high among all schools at baseline. Therefore, inferences about MMFW with respect to improving this academic outcome cannot be made. As we have previously indicated, the aggregate sample was not large enough to formally test for treatment by grade-level interactions. This limitation stands as a key direction for future evaluation studies of MMFW.
In terms of program implementation, the study showed that various teach-ers in different schools across different grade levels can deliver the program with strong fidelity. Interestingly, the class which completed the most lessons (Teacher D; Table 2) had one of the lowest interrater reliability levels for fidelity of implementation. This finding could be viewed, however, as unex-pected levels of effectiveness to the extent that greater improvisation and creativity led to higher quality; hence, discrepancies in fidelity ratings may have enhanced the strength of the intervention (Hulleman & Cordray, 2009). Along these lines of consideration, future evaluations of MMFW should seek to use observational methods for assessing fidelity.
In the manual, two models of how the curriculum can be packaged and delivered within a single grade, or across multiple grades, are provided to help users organize MMFW. One of the important questions for the practice and evaluation of the program is the degree to which there is an added value (or greater long-term payoff) to participating in MMFW across multiple years of delivery during secondary school, rather than a single year or semes-ter. In this respect, future research should consider a variety of evaluation designs in which MMFW is delivered over time as well as in combination with other services that aim to address the same outcomes of interest.
862 Youth & Society 50(6)
There is a credible body of evidence indicating that career interventions can improve academic outcomes in K-12 education; at the same time, Perry and Wallace (2015) note an ongoing lack of understanding as to why some career interventions are more or less effective than others and how their impact is enhanced or weakened when considering factors such as dosage, duration, and method of delivery in the context of other interventions. These and similar questions may shed important light in terms of making policy recommendations. In the current study, for example, Teacher B taught the same (or nearly the same) number of lessons as Teacher C; but Teacher C covered them in about 36% less total sessions. If Teacher C had increased the number of sessions and thereby increased the dosage, would the magnitude of the impact and, in turn, results of the evaluation been different? Quite pos-sibly. Indeed, the same kind of question could be posed with respect to another limitation of the design in terms of participating schools. Delivering MMFW in the context of School C, for instance, may represent a unique artifact of the study due to its perfect graduation rate. Consequently, using these students as a comparison group may have explained the non-significant gains in 12th grade.
Conclusion
Now more than ever, college and career readiness stands at the forefront of the nation’s educational reform agenda. Given that MMFW was designed to be used by a variety of stakeholders and practitioners in a flexible, user-friendly manner, the contributions of this study lay the groundwork for its adaptation. Although it is not meant to serve as a substitute for other interventions, MMFW has the inherent capacity to be integrated into multiple strategies aimed at helping youth engage in that critical transition from school to post-secondary education and the workforce. This study provides a platform for identifying new and innovative ways to combine evidence-based strategies, especially among youth who need them the most as part of broader efforts to achieve equity in graduation and access to realizing the American Dream.
Authors’ Note
The opinions expressed are those of the authors and do not represent views of the Institute or the U.S. Department of Education.
Acknowledgments
The authors acknowledge Lauren O’Janpa and Max Traylor for their assistance with data collection and entry.
Perry et al. 863
Declaration of Conflicting Interests
The author(s) declared no potential conflicts of interest with respect to the research, authorship, and/or publication of this article.
Funding
The author(s) disclosed receipt of the following financial support for the research, authorship, and/or publication of this article: The research reported here was sup-ported by the Institute of Education Sciences, U.S. Department of Education, through Grant R305A100094 to Cleveland State University.
References
Ajzen, I. (1985). From intentions to actions: A theory of planned behavior. In J. Kuhl & J. Beckman (Eds.), Action-control: From cognition to behavior (pp. 11-39). Heidelberg, Germany: Springer.
Anyon, J. (1997). Ghetto schooling: A political economy of urban educational reform. New York, NY: Teachers College Press.
Balfanz, R., Herzog, L., & Mac Iver, D. J. (2007). Preventing student disengagement and keeping students on the graduation path in urban middle-grades schools: Early identification and effective interventions. Educational Psychologist, 42, 223-235.
Balfanz, R., & Legters, N. (2004). Locating the dropout crisis: Which high schools produce the nation’s dropouts? Where are they located? Who attends them? Baltimore, MD: Johns Hopkins University.
Charmaraman, L., & Hall, G. (2011). School dropout prevention: What arts-based community and out-of-school-time programs can contribute. New Directions for Youth Development, 2011(Suppl. 1), 9-27.
Christenson, S. L., Reschly, A. L., & Wylie, C. (2012). Preface. In S. Christenson, A. Reschly, & C. Wylie (Eds.), Handbook of research on student engagement (pp. v-ix). New York, NY: Springer.
Deci, E. L., & Ryan, R. M. (1985). Intrinsic motivation and self-determination in human behavior. New York, NY: Plenum.
Deci, E. L., & Ryan, R. M. (2000). The “what” and “why” of goal pursuits: Human needs and self-determination of behavior. Psychological Inquiry, 11, 227-268.
Dornbusch, S. M., & Steinberg, L. (1990). Measures of school engagement. Unpublished manuscript, Temple University, Philadelphia, PA.
Finn, J. D. (1989). Withdrawing from school. Review of Educational Research, 59, 117-142.
Fredricks, J. A., Blumenfeld, P. C., & Paris, A. H. (2004). School engagement: Potential of the concept, state of the evidence. Review of Educational Research, 74, 59-109.
Halpern, R. (2012). Supporting vocationally oriented learning in the high school years: Rationale, tasks, challenges. New Directions for Youth Development, 134, 85-106.
864 Youth & Society 50(6)
Hulleman, C. S., & Cordray, D. S. (2009). Moving from the lab to the field: The role of fidelity and achieved relative intervention strength. Journal of Research on Educational Effectiveness, 2, 88-110.
Hynes, K., & Hirsch, B. J. (2012). Issue editors’ notes. New Directions for Youth Development, 134, 1-6.
Jackson, J. H., & Hasak, J. (2014). Look beyond the label: Reframing, reimagining, and reinvesting in CTE. American Educator, 2014, 34-39.
Kena, G., Aud, S., Johnson, F., Wang, X., Zhang, J., Rathbun, A., . . . Kristapovich, P. (2014). The condition of education 2014 (NCES 2014-083). Washington, DC: U.S. Department of Education, National Center for Education Statistics. Retrieved from http://nces.ed.gov/pubsearch
Lawson, M. A., & Lawson, H. A. (2013). New conceptual frameworks for student engage-ment research, policy, and practice. Review of Educational Research, 83, 432-479.
McCallumore, K. M., & Sparapani, E. F. (2010). The importance of the ninth grade on high school graduation rates and student success in high school. Education, 130, 447-456.
Midgley, C., Maehr, M. L., Hruda, L. Z., Anderman, E., Anderman, L., Freeman, K., . . . Urdan, T. (2000). Manual for the Patterns of Adaptive Learning Scales (PALS). Ann Arbor: University of Michigan.
Millar, R., & Shevlin, M. (2007). The development and factor structure of a Career Locus of Control Scale for use with school pupils. Journal of Career Development, 33, 224-249.
Murdock, T. B. (1999). The social context of risk: Status and motivational predictors of alienation in middle school. Journal of Educational Psychology, 91, 62-75.
Murdock, T. B., Anderman, L. H., & Hodge, S. A. (2000). Middle-grade predic-tors of students’ motivation and behavior in high school. Journal of Adolescent Research, 15, 327-351.
Oakes, J. (1985). Keeping track: How schools structure inequality. New Haven, CT: Yale University Press.
Orthner, D. K., Akos, P., Rose, R., Jones-Sanpei, H., Mercado, M., & Wooley, M. E. (2010). CareerStart: A middle school student engagement and academic achieve-ment program. Children & Schools, 32, 223-234.
Perry, J. C. (2008). School engagement among urban youth of color: Criterion pat-tern effects of vocational exploration and racial identity. Journal of Career Development, 34, 397-422.
Perry, J. C., Cusner, A., & Pickett, L. L. (2015). Fostering adolescent work and career readiness. In C. Juntunen & J. Schwartz (Eds.), Counseling across the lifespan: Prevention and treatment (2nd ed., pp. 147-164). Thousand Oaks, CA: SAGE.
Perry, J. C., Liu, X., & Pabian, Y. (2010). School engagement as a mediator of aca-demic performance among urban youth: The role of career preparation, parental career support, and teacher support. The Counseling Psychologist, 38, 269-295.
Perry, J. C., President, M. A., Harmon, J. A., Mizen, A. S., Calhoun-Butts, C., Riley, S. A., . . . Arendt, C. (2014). Making my future work: A college and career readi-ness program (Manual). Cleveland, OH: Cleveland State University.
Perry et al. 865
Perry, J. C., & Wallace, E. W. (2012). What schools are doing around career development: Implications for policy and practice. New Directions in Youth Development, 134, 33-44.
Perry, J. C., & Wallace, E. W. (2015). Children and adolescents. In P. J. Hartung, M. L. Savickas, & W. B. Walsh (Eds.), APA handbook of career intervention: Foundations (Vol. 1, pp. 189-208). Washington, DC: American Psychological Association.
Porfeli, E. J., Lee, B., Vondracek, F. W., & Weigold, I. K. (2011). A multi-dimensional measure of vocational identity status. Journal of Adolescence, 34, 853-871.
Raudenbush, S. W. (2009). Adaptive centering with random effects: An alternative to the fixed effects model for studying time-varying treatments in school settings. Education, 4, 468-491.
Reeve, J. (2012). A self-determination theory perspective on student engagement. In S. Christenson, A. Reschly, & C. Wylie (Eds.), Handbook of research on student engagement (pp. 149-172). New York, NY: Springer.
Rose, R. A., Woolley, M. E., Orthner, D. K., Akos, P. T., & Jones-Sanpei, H. A. (2012). Increasing teacher use of career-relevant instruction: A randomized control trial of CareerStart. Educational Evaluation and Policy Analysis, 34, 295-312.
Rubin, D. B. (1987). Multiple imputation for nonresponse in surveys. New York: John Wiley and Sons.
Rumberger, R. W., & Rotermund, S. (2012). The relationship between engagement and high school dropout. In S. Christenson, A. Reschly & C. Wylie (Eds.), Handbook of research on student engagement (pp. 491-513). New York, NY: Springer.
Ryan, R. M., Lynch, M. F., Vansteenkiste, M., & Deci, E. L. (2011). Motivation and autonomy in counseling, psychotherapy, and behavior change: A look at theory and practice. The Counseling Psychologist, 39, 193-260.
Sauter, F. M., Heyne, D., Blöte, A. W., van Widenfelt, B. M., & Westenberg, P. M. (2010). Assessing therapy-relevant cognitive capacities in young people: Development and psychometric evaluation of the Self-Reflection and Insight Scale for Youth. Behavioural and Cognitive Psychotherapy, 38, 303-317.
Stephan, J. L., & Rosenbaum, J. E. (2013). Can high schools reduce college enroll-ment gaps with a new counseling model? Educational Evaluation and Policy Analysis, 35, 200-219.
Stone, J. R., III. (2014). More than one way: The case for high-quality CTE. American Educator, 2014, 4-11.
Super, D., Thompson, A., Lindeman, R., Jordaan, J., & Myers, R. (1981). The Career Development Inventory. Palo Alto, CA: Consulting Psychologists Press.
Swanson, C. B. (2009). Cities in crisis 2009: Closing the graduation gap: Educational and economic conditions in America’s largest cities. Bethesda, MD: Editorial Projects in Education.
Turner, J. C., Christensen, A., Kackar-Cam, H. Z., Trucano, M., & Fulmer, S. M. (2014). Enhancing students’ engagement: Report of a 3-year intervention with middle school teachers. American Educational Research Journal, 51, 1195-1226.
866 Youth & Society 50(6)
Wallace, T. L., & Chhuon, V. (2014). Proximal processes in urban classrooms: Engagement and disaffection in urban youth of color. American Educational Research Journal, 51, 937-973.
Wang, M., & Eccles, J. S. (2012). Social support matters: Longitudinal effects of social support on three dimensions of school engagement from middle to high school. Child Development, 83, 877-895.
Weinstein, C. E., Acee, T. W., & Jung, J. (2011). Self-regulation and learning strate-gies. New Directions for Teaching & Learning, 126, 45-53.
Wigfield, A., & Eccles, J. S. (1992). The development of achievement task values: A theoretical analysis. Developmental Review, 12, 265-310.
Yuan, Y. C. (2010). Multiple imputation for missing data: Concepts and new develop-ment (Version 9.0). SAS Institute, Inc.
Yuan, Y. (2011). Multiple imputation using SAS software. Journal of Statistical Software, 45(6), 1-25.
Author Biographies
Justin C. Perry was chair and associate professor in the Department of Counseling, Administration, Supervision, and Adult Learning at Cleveland State University at the time this study was completed. He also served as director of the Center for Urban Education. He is now dean of the School of Education at the University of Missouri - Kansas City.
Eric W. Wallace is a doctoral candidate in counseling psychology in the Urban Education PhD Program at Cleveland State University.
Meghan P. McCormick is a research associate at MDRC. She received her PhD in Applied Psychology and Quantitative Methods from New York University.