Embed Size (px)
Citation preview
Making CJR Work for You
A Roadmap for Successful Implementation of Medicare Bundles
https://innovation.cms.gov/initiatives/cjr
December 10, 2015

Key Takeaways
You’re the payerExecutive leadership is essentialOpportunity is in post-acuteDoing the right thing is most profitable

Background
“…HHS goal of 30 percenttraditional FFS Medicare payment
through alternative paymentmodels by the end of 2016… 50
percent by the end of 2018”
HHS Press Office 1-26-15

Anchor Stay44%
Ambulatory4%
HHA5%
Readmissions13%
IRF9%
LTAC4%
Other2%
SNF18%
Sample Hospital
Total Program 100% $113,000,000 Anchor Stay 44% $50,000,000 Post-Acute 56% $63,000,000
Ambulatory 4% $5,000,000 HHA 5% $6,000,000 Readmissions 13% $15,000,000 IRF 9% $10,000,000 LTAC 4% $5,000,000 Other 2% $2,000,000 SNF 18% $20,000,000
Agenda
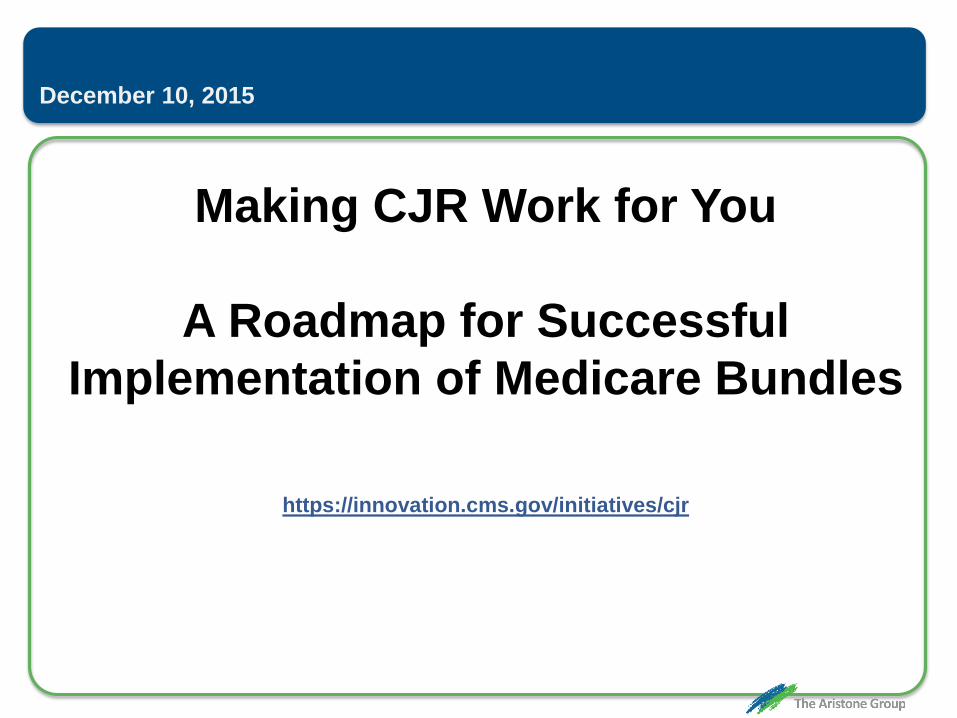
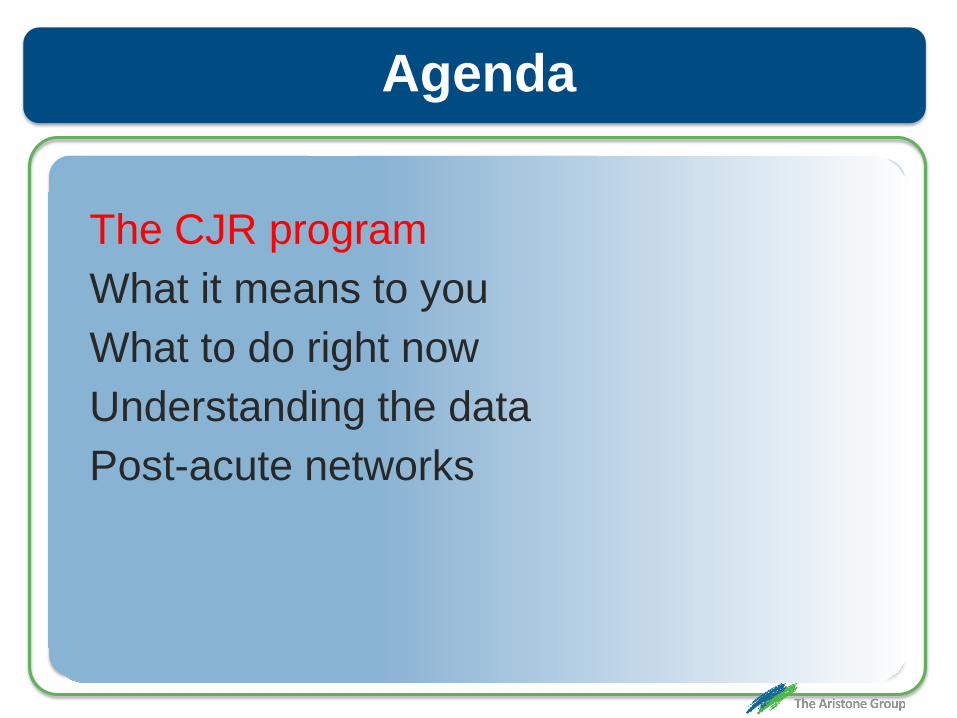
The CJR program What it means to youWhat to do right nowUnderstanding the dataPost-acute networks

Agenda
The CJR programWhat it means to youWhat to do right nowUnderstanding the dataPost-acute networks
The Program
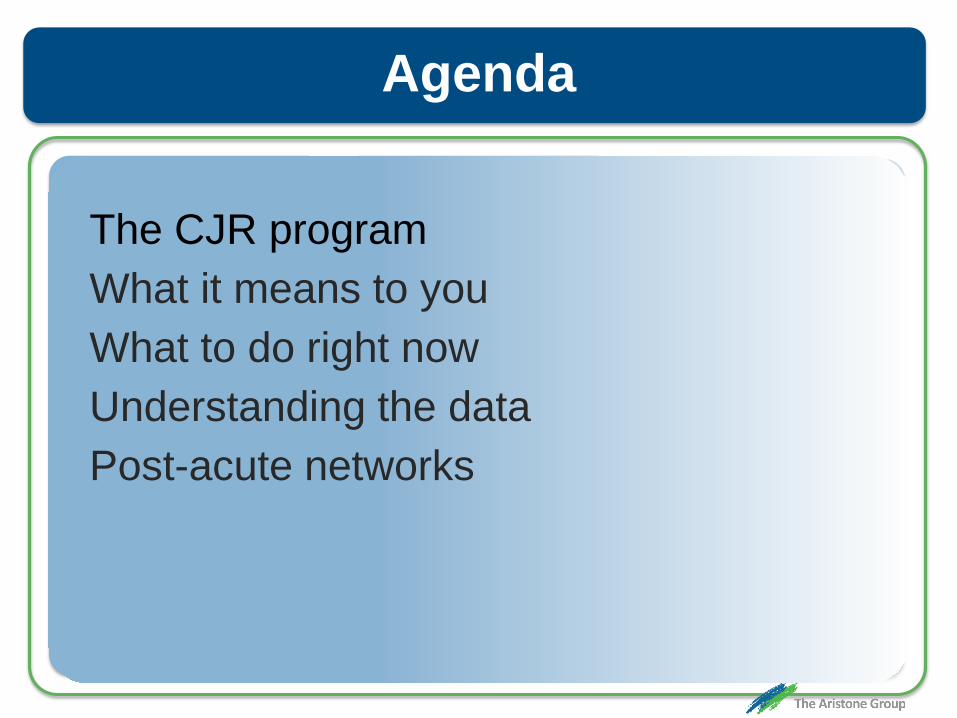
Comprehensive Care for Joint Replacement MANDATORY
Bundled payment for lower extremity joints MS-DRG 469 & 470 – w/ & w/o CC/MCCMedicare FFS beneficiariesDRG + 90 days post-dischargeAll Part A and Part B (some exceptions)Hospitals only

The Program
Only hospitals in one of 67 MSAs• MSA: Metropolitan Statistical Area• Census Bureau designation• CMS used only for selecting hospitals
Target pricing is region-based
MSA

The Program
Included services Physicians' services Inpatient hospitalization
(including readmissions) Inpatient Psychiatric Facility (IPF) Long-term care hospital (LTCH) Inpatient rehabilitation facility (IRF) Skilled nursing facility (SNF) Home health agency (HHA) Hospital outpatient services Independent outpatient therapy Clinical laboratory Durable medical equipment (DME) Part B drugs Hospice
Excluded servicesAcute clinical conditions not
arising from existing episode-related chronic clinical conditionsor complications of the LEJR surgery
Chronic conditions that are generallynot affected by the LEJR procedure orpost-surgical care

The Program
Timing• Begins April 1, 2016• 5 “year” program• 2016 is 9 months (Apr 1 – Dec 31)• Phase-in of risk, targets, requirements

The Program
Payment• FFS “as usual” for all parties• Retrospective reconciliation (annual)• Total episode spend – target price = ?• <0 means you get $• >0 means you owe $

The Program
Total episode spend over ~90 days• CMS totals all claims for:• DRG + SNF + HHA + DME + Part B
Target price• CMS determines/revises 2x/yr• Based on history (you and your region)

The Program
CMS Spend (Claims Paid) Target Price Result

The Program
CMS Spend (Claims Paid) Target Price Result
$18,000 $20,000 CMS pays you $2,000

The Program
CMS Spend (Claims Paid) Target Price Result
$18,000 $20,000 CMS pays you $2,000
$21,000 $20,000 You pay CMS $1,000
Shared Savings Model

The Program
Target price• Variable over the program lifetime• Phase-in: 33% -100% on regional spend• Based on 3 year historical data • Stratified to accommodate fractures • Discounted for CMS “cut”
CJR Target Baseline Pricing2016 2017 2018 2019 2020
Jan 12-Dec 14 Jan 12-Dec 14 Jan 14-Dec 16 Jan 14-Dec 16 Jan 16-Dec 18

The Program

The Program
DRG Pacific 469 $ 48,874470 $ 23,425
DRG Mountain469 $ 47,925470 $ 23,734 West North
DRG Central 469 $ 46,189470 $ 23,800
West SouthDRG Central 469 $ 55,448470 $ 27,464
East NorthDRG Central 469 $ 50,954470 $ 25,480
East NorthDRG Central 469 $ 50,954470 $ 25,480
MiddleDRG Atlantic 469 $ 52,028470 $ 27,406
NewDRG England 469 $ 47,928
470 $ 24,858
SouthDRG Atlantic469 $ 51,239470 $ 25,989
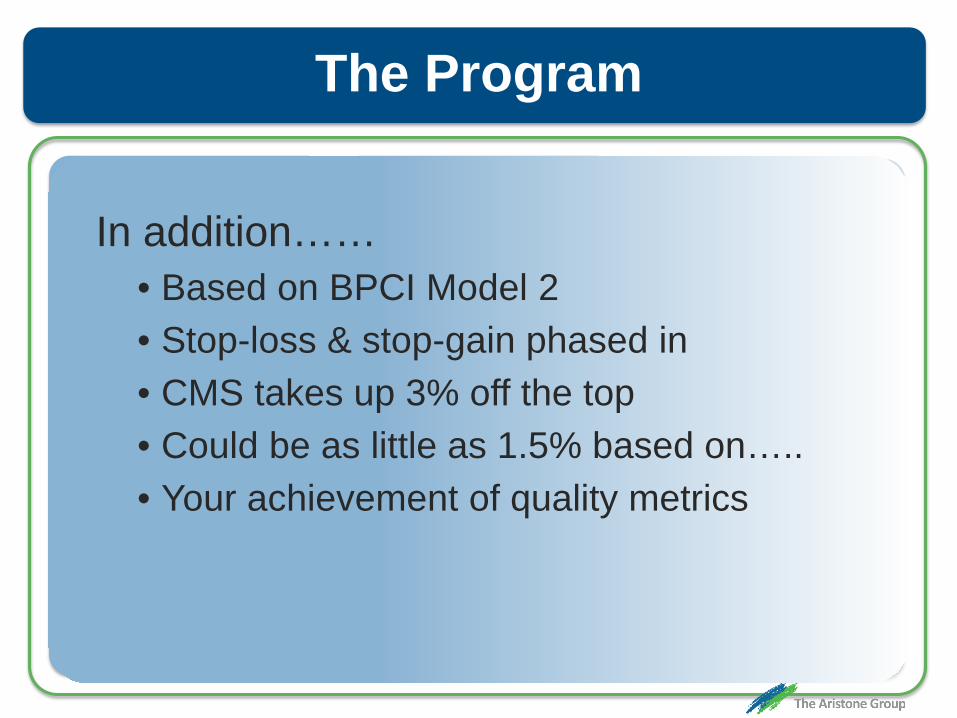
The Program
In addition……• Based on BPCI Model 2• Stop-loss & stop-gain phased in• CMS takes up 3% off the top• Could be as little as 1.5% based on…..• Your achievement of quality metrics

The Program
CJR Reconciliation Payments2016 2017 2018 2019 2020
Upside cap 20% of target 20% of target 20% of target 20% of target 20% of target

The Program
CJR Reconciliation Payments2016 2017 2018 2019 2020
Upside cap 20% of target 20% of target 20% of target 20% of target 20% of targetDownside* None 10% of target 20% of target 20% of target 20% of target

The Program
CJR Reconciliation Payments2016 2017 2018 2019 2020
Upside cap 20% of target 20% of target 20% of target 20% of target 20% of targetDownside* None 10% of target 20% of target 20% of target 20% of target
* Exceptions None 3% of target 5% of target 5% of target 5% of target
Spend > 2sd from the mean are excluded
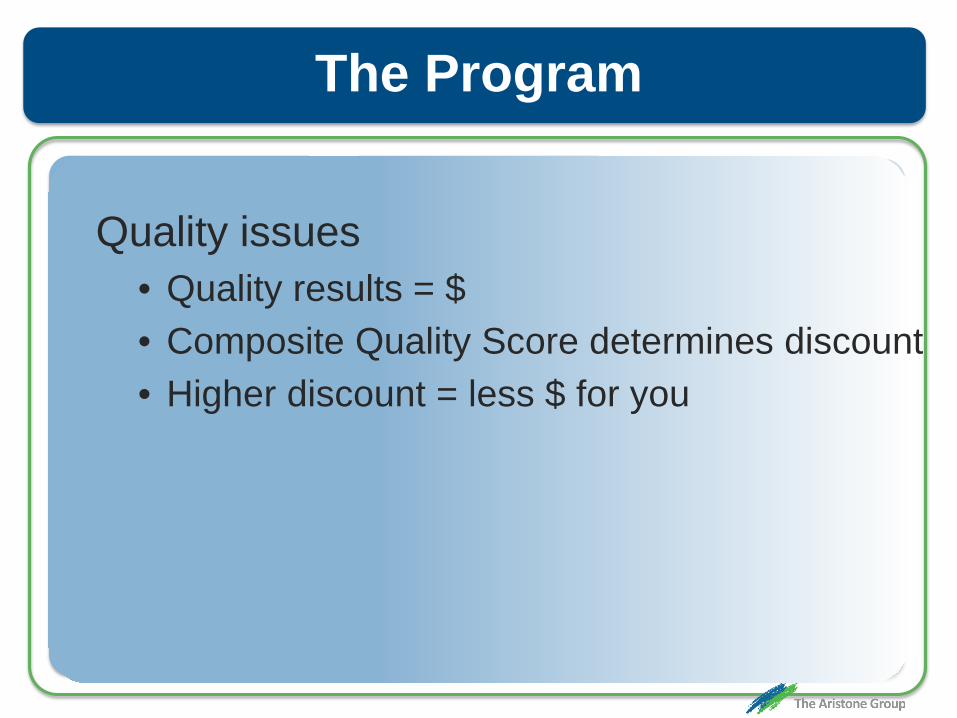
The Program
Quality issues• Quality results = $ • Composite Quality Score determines discount• Higher discount = less $ for you

The Program
CJR Composite Quality ScoringQuality
CategoryMaximum
PointsScore
Allocation Notes
RSCR for THA/TKA
(NQF #1550)10 50%
Based on hospital's decile performance
nationally

The Program
CJR Composite Quality ScoringQuality
CategoryMaximum
PointsScore
Allocation Notes
RSCR for THA/TKA
(NQF #1550)10 50%
Based on hospital's decile performance
nationally
HCAHPS (NQF #0166) 8 40%
Based on hospital's decile performance
nationally

The Program
CJR Composite Quality ScoringQuality
CategoryMaximum
PointsScore
Allocation Notes
RSCR for THA/TKA
(NQF #1550)10 50%
Based on hospital's decile performance
nationally
HCAHPS (NQF #0166) 8 40%
Based on hospital's decile performance
nationally
THA/TKA outcomes 2 10% Voluntary yr 1-3, may
be mandatory yr 4-5

The Program
CJR Composite ScoringPerformance
Percentile (national)
THA/TKA Complications
HCAHPS Survey
>= 90th 10.00 8.0080-90th 9.25 7.4070-80th 8.50 6.8060-70th 7.75 6.2050-60th 7.00 5.6040-50th 6.25 5.0030-50th 5.50 4.40<30th 0.00 0.00

The Program
CJR Discount StructureComposite
Quality Score
Quality Category
Eligible for Reconciliation
Payment
Eligible for Quality
Incentive Payment
Discount for Reconciliation
Payment
Discount for Repayment
Year 1
Discount for Repayment
Years 2-3
Discount for Repayment
Years 4-5
< 4.0 Below Acceptable No No 3.0% N/A 2.0% 3.0%
4.0-6.0 Acceptable Yes No 3.0% N/A 2.0% 3.0%
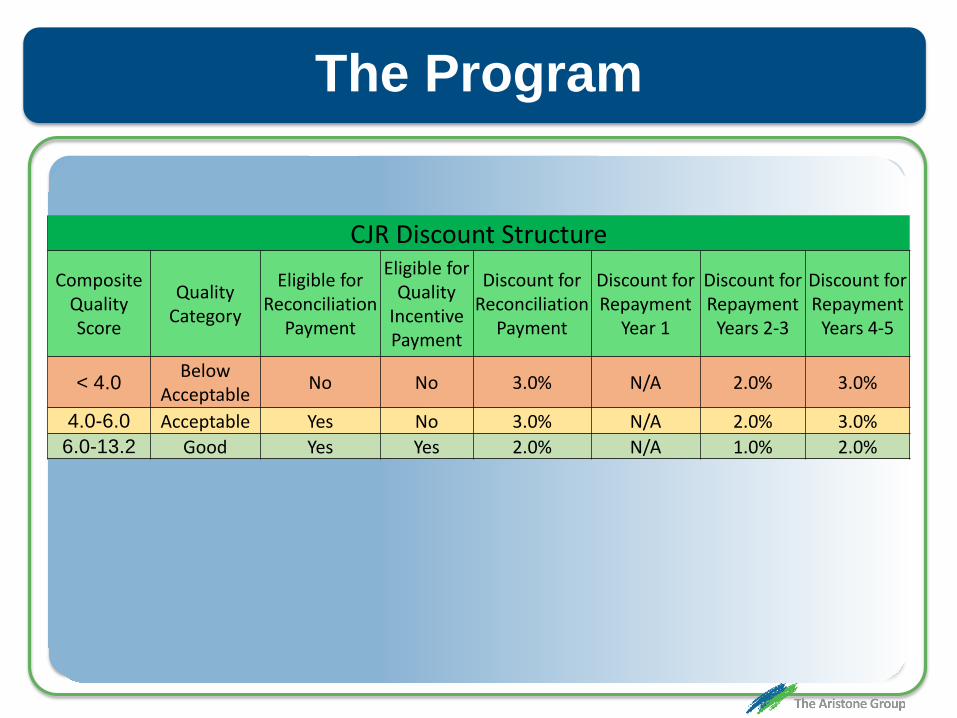
The Program
CJR Discount StructureComposite
Quality Score
Quality Category
Eligible for Reconciliation
Payment
Eligible for Quality
Incentive Payment
Discount for Reconciliation
Payment
Discount for Repayment
Year 1
Discount for Repayment
Years 2-3
Discount for Repayment
Years 4-5
< 4.0 Below Acceptable No No 3.0% N/A 2.0% 3.0%
4.0-6.0 Acceptable Yes No 3.0% N/A 2.0% 3.0%6.0-13.2 Good Yes Yes 2.0% N/A 1.0% 2.0%
>13.2 Excellent Yes Yes 1.5% N/A 0.5% 1.5%
The Program
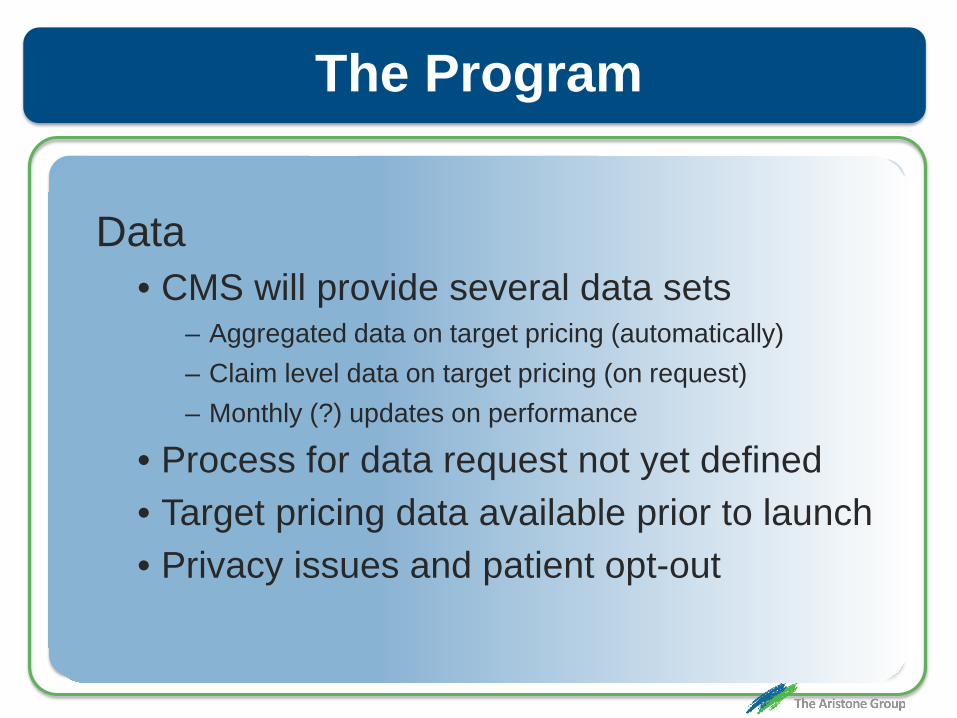
Data• CMS will provide several data sets
– Aggregated data on target pricing (automatically)– Claim level data on target pricing (on request)– Monthly (?) updates on performance
• Process for data request not yet defined• Target pricing data available prior to launch• Privacy issues and patient opt-out

The Program
Gainsharing• Allowable with “CJR collaborators”• Providers/suppliers supporting the program• Care redesign efforts during the episode• Portion of reconciliation amount or…• Internal cost savings• Contract in place prior to patient care• Upside and downside risk (some limits)

The Program
Waivers• SNF 3-day rule – starts in year 2• Home health visits• TelehealthCMS & OIG joint statement• Protects gainsharing arrangements

The Program
Other• Beneficiary incentives allowable
• >$25 must be “documented” • Technology must be <= $1,000• Items >$50 returned to the hospital after episode
• Post-acute care options• Must provide a “complete list” to patient• Preferred provider network is not prevented
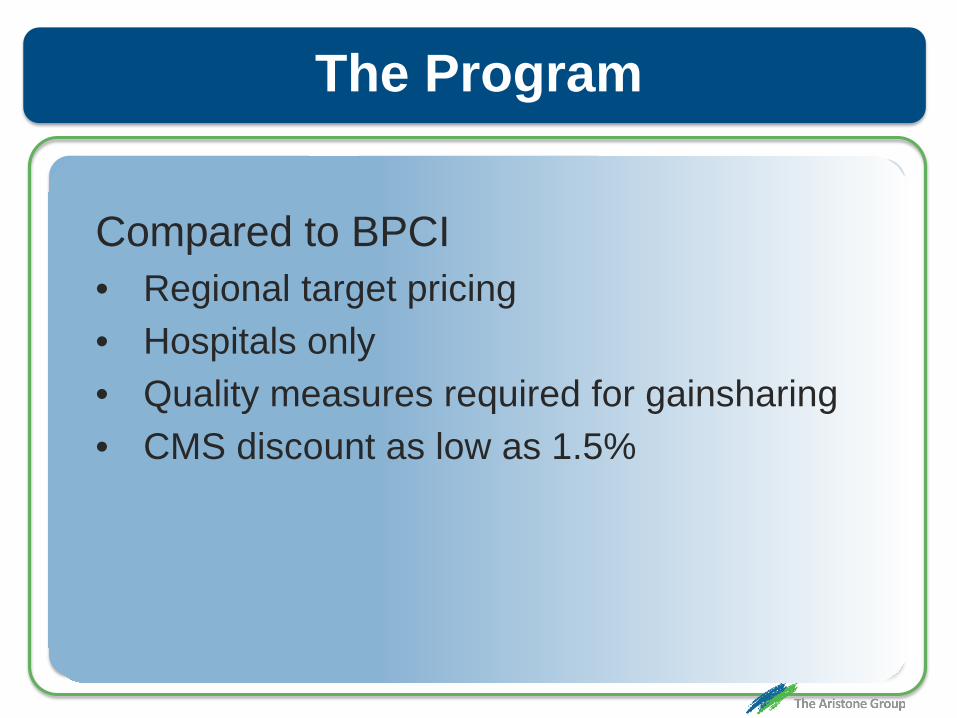
The Program
Compared to BPCI• Regional target pricing• Hospitals only• Quality measures required for gainsharing• CMS discount as low as 1.5%
Agenda
The CJR programWhat it means to youWhat to do right nowUnderstanding the dataPost-acute networks

Agenda
The CJR programWhat it means to youWhat to do right nowUnderstanding the dataPost-acute networks
What It Means
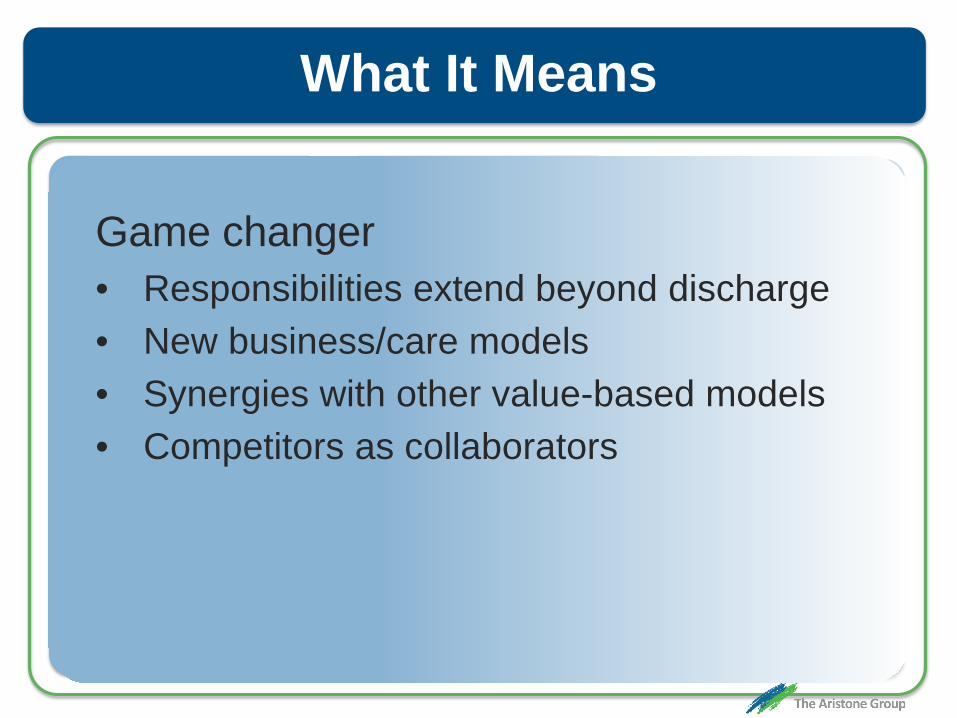
Game changer• Responsibilities extend beyond discharge• New business/care models• Synergies with other value-based models• Competitors as collaborators

What It Means
Mandatory• No opt-out for you• Need to respond now (not tomorrow) !• Risky to interpret year 1 as ramp-up• April 1, 2016 is sooner than you think

What It Means
Extended care• 90 days post-discharge• Care settings are unfamiliar• Creating partnerships will be a challenge• Following patients is hard

What It Means
Financial implications• Risk management• Measuring exposure• Skill sets; e.g., analytics• Managing new resources and requirements

What It Means
Care reengineering• Pathways, protocols, alignment• Working with post-acute partners• Ongoing education challenge• Care navigator role

What It Means
Data/analytics• Challenge to existing capabilities• Likely require outside products/services• Merging with internal data warehouse/systems• Deployment of data to users (real time)

Agenda
The CJR program What it means to youWhat to do right nowUnderstanding the dataPost-acute networks

Agenda
The CJR programWhat it means to youWhat to do right nowUnderstanding the dataPost-acute networks

What To Do Right Now
Top to-do’s• Planning• Gainsharing arrangements• Post-acute network

What To Do Right Now
Planning• Hire/contract/appoint/conscript a leader• Acquire industry knowledge/lessons learned• Establish a working team• Get an analytics partner
What To Do Right Now
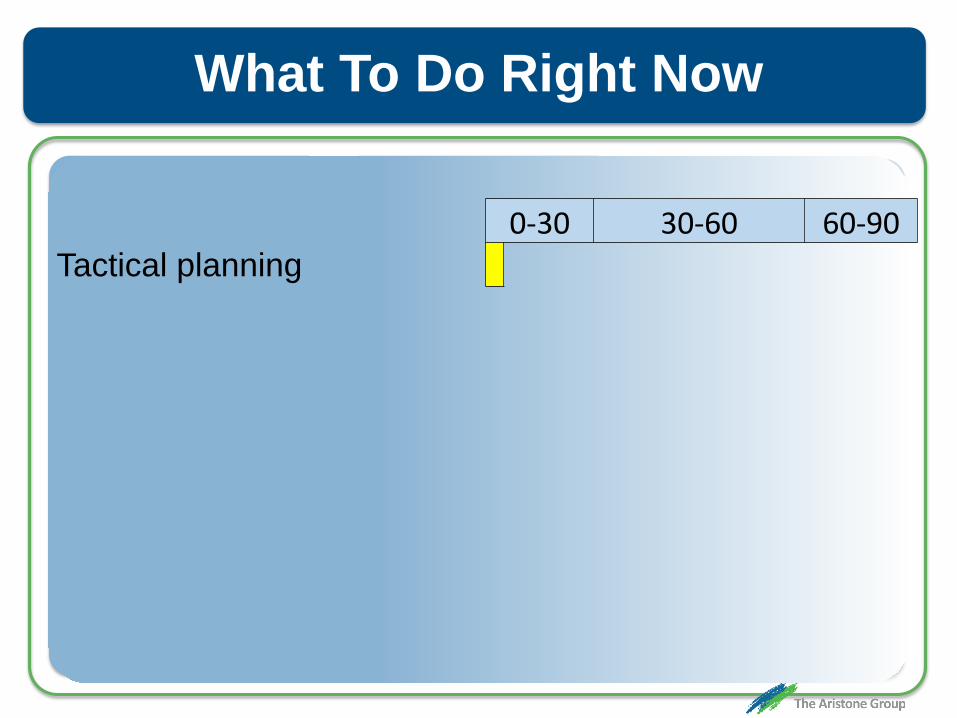
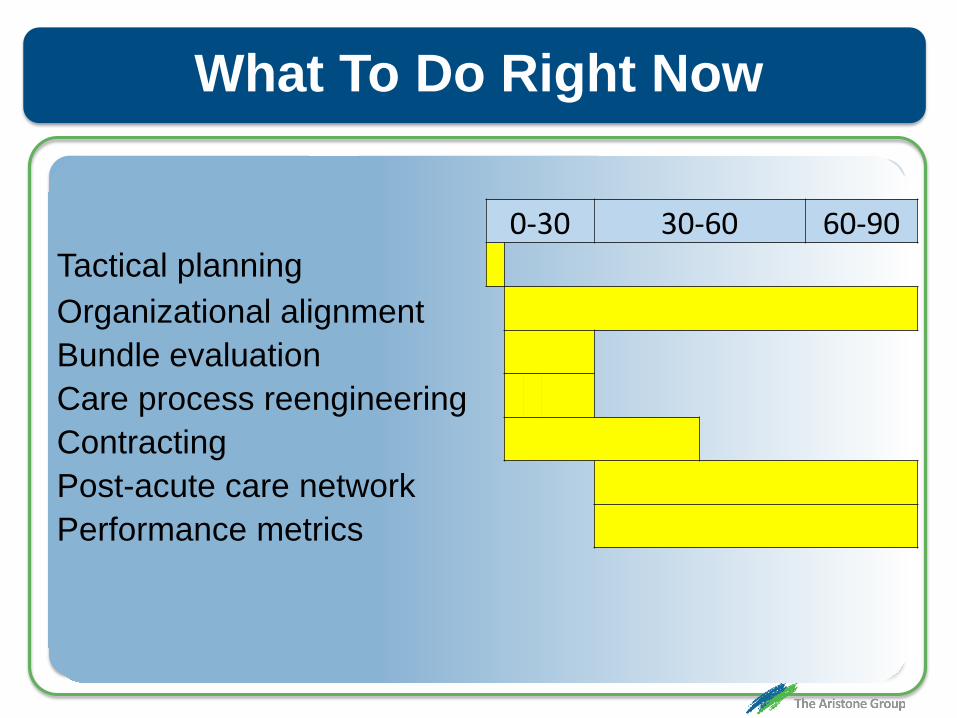
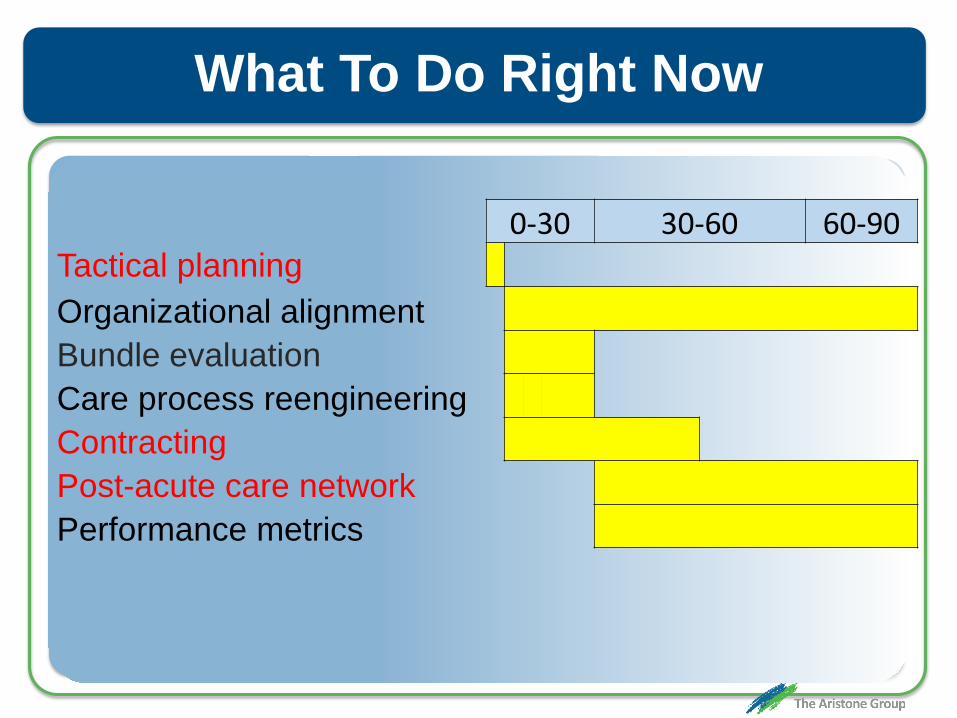
0-30 30-60 60-90Tactical planning

What To Do Right Now
0-30 30-60 60-90Tactical planningOrganizational alignment

What To Do Right Now
0-30 30-60 60-90Tactical planningOrganizational alignmentBundle evaluation

What To Do Right Now
0-30 30-60 60-90Tactical planningOrganizational alignmentBundle evaluationCare process reengineering

What To Do Right Now
0-30 30-60 60-90Tactical planningOrganizational alignmentBundle evaluationCare process reengineeringContracting

What To Do Right Now
0-30 30-60 60-90Tactical planningOrganizational alignmentBundle evaluationCare process reengineeringContractingPost-acute care network
What To Do Right Now
0-30 30-60 60-90Tactical planningOrganizational alignmentBundle evaluationCare process reengineeringContractingPost-acute care network Performance metrics
What To Do Right Now
0-30 30-60 60-90Tactical planningOrganizational alignmentBundle evaluationCare process reengineeringContractingPost-acute care network Performance metrics
What To Do Right Now
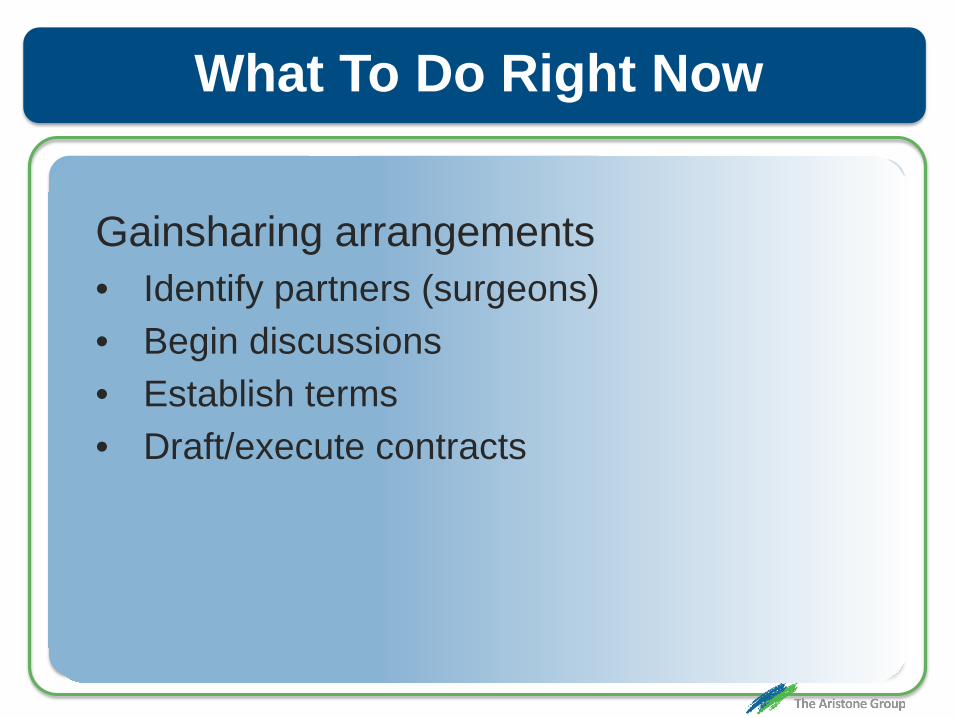
Gainsharing arrangements• Identify partners (surgeons)• Begin discussions• Establish terms• Draft/execute contracts

What To Do Right Now
Gainsharing contract considerations• Oversight, gainsharing, quality issues• Payments must be quality based• Negotiate quality measures and thresholds• Providers may be in other programs• Co‐management, professional service
arrangements, medical directorships

What To Do Right Now
Gainsharing contract considerations• What happens to unallocated $• Payments off the top• Who owns the data?
What To Do Right Now
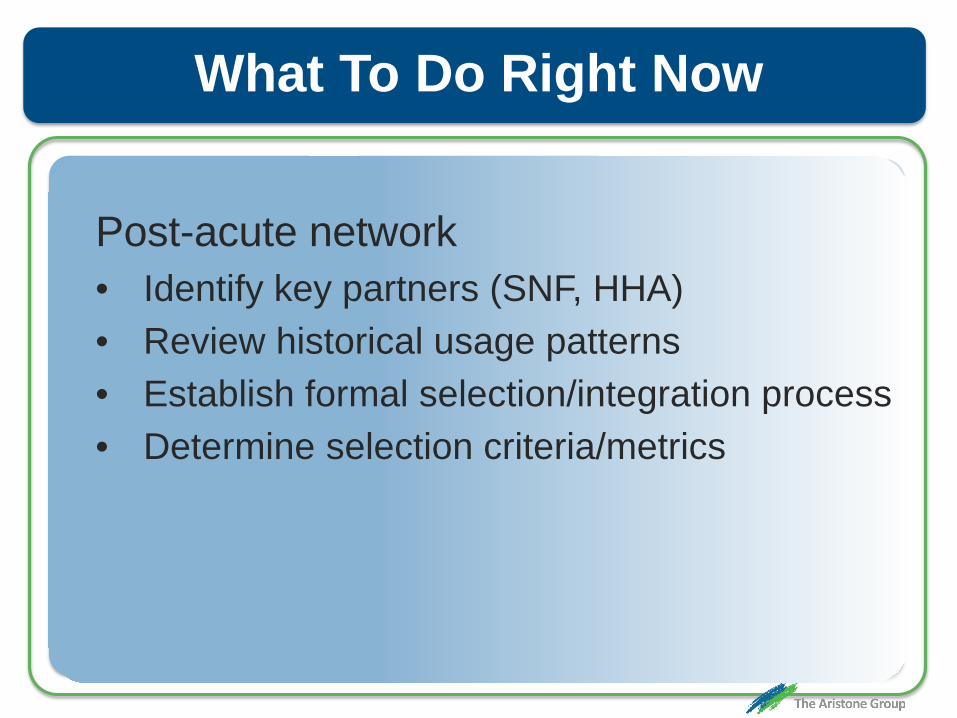
Post-acute network• Identify key partners (SNF, HHA)• Review historical usage patterns• Establish formal selection/integration process• Determine selection criteria/metrics

Agenda
The CJR program What it means to youWhat to do right nowUnderstanding the dataPost-acute networks

Agenda
The CJR programWhat it means to youWhat to do right nowUnderstanding the dataPost-acute networks

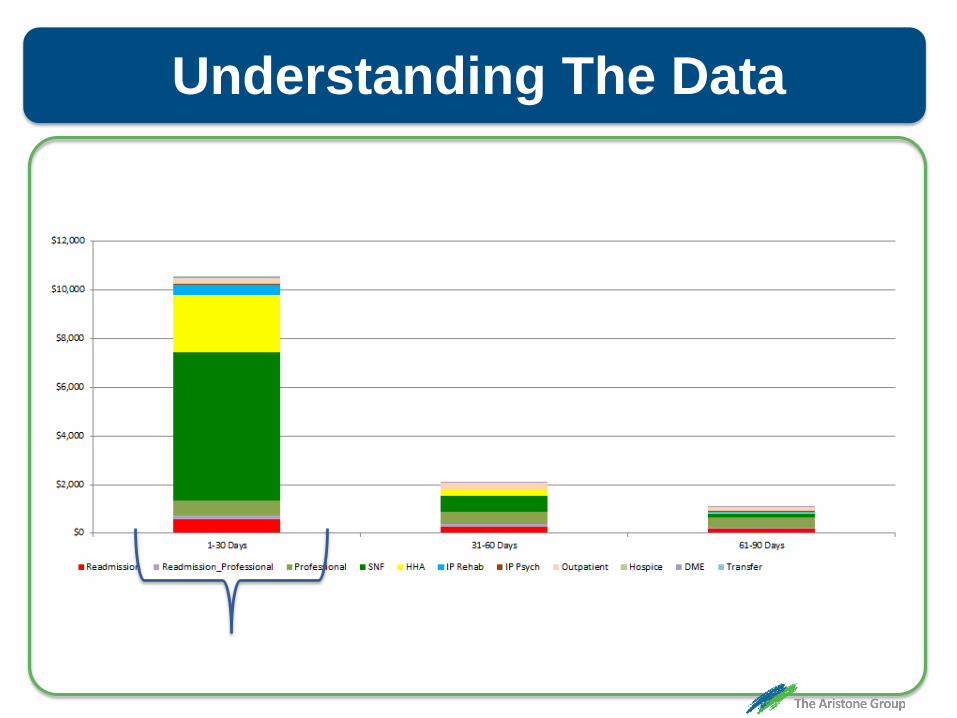
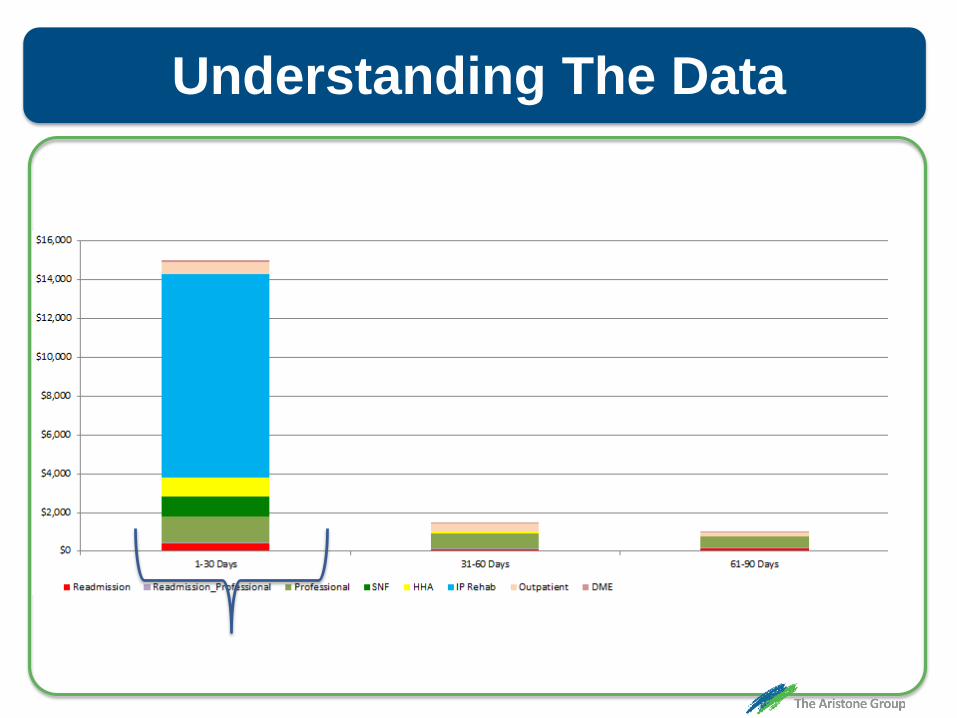
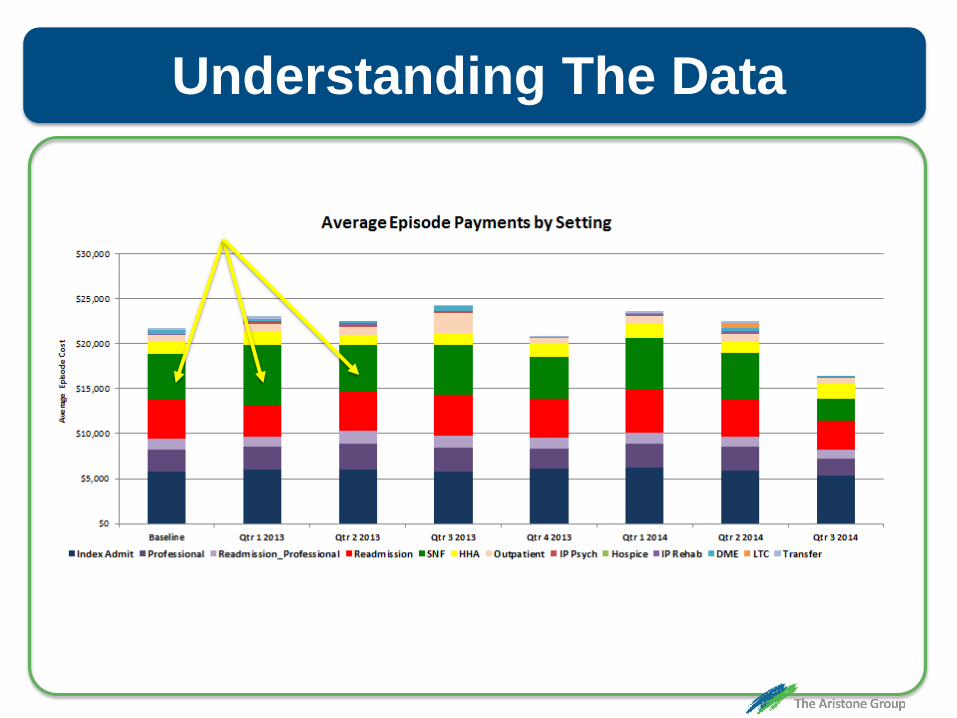
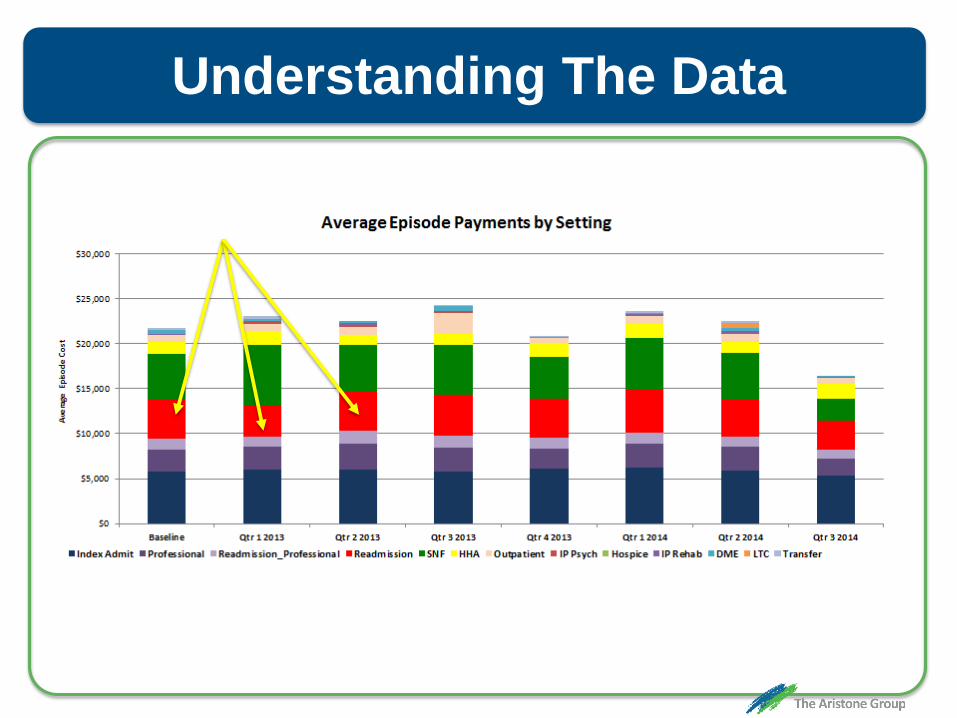
Understanding The Data
Key drivers for your strategy• Availability of data
- Internal and payer systems- Experiential
• It’s all about post-acute spend• Ability to drive positive change • Volume creates leverage

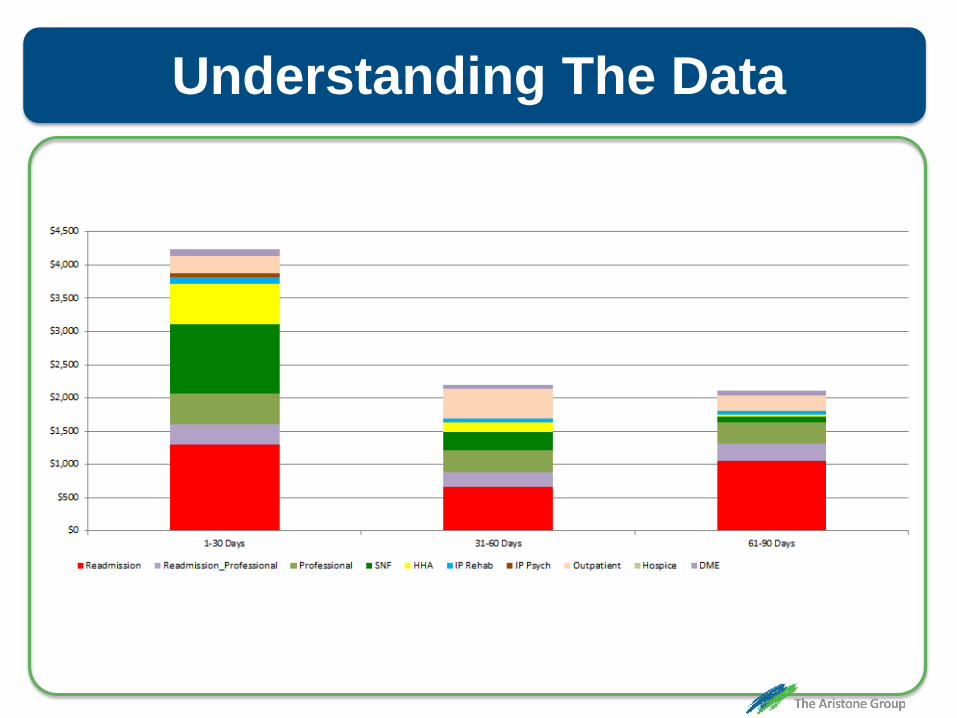
Understanding The Data

~3%
Savings herePays for ~3% here
Understanding The Data
Understanding The Data
Understanding The Data
Understanding The Data
Understanding The Data
Understanding The Data

Understanding The Data

SNF # Episodes Total Payment
Average Payment Readmissions Readmission
RateSNF 1 80 $785,461 $9,818 6 8%SNF 2 25 $301,225 $12,049 4 16%SNF 3 25 $187,522 $7,501 1 4%SNF 4 23 $354,001 $15,391 0 0%SNF 5 17 $196,222 $11,542 4 24%SNF 6 12 $164,526 $13,711 3 25%SNF 7 11 $255,124 $23,193 2 18%SNF 8 11 $91,230 $8,294 1 9%SNF 9 10 $115,235 $11,524 3 30%SNF 10 8 $152,134 $19,017 0 0%SNF 11 7 $48,256 $6,894 2 29%SNF 12 6 $44,120 $7,353 1 17%SNF 13 4 $56,125 $14,031 0 0%SNF 14 3 $14,597 $4,866 1 33%SNF 15 4 $39,256 $9,814 0 0%SNF 16 3 $13,021 $4,340 1 33%
Understanding The Data
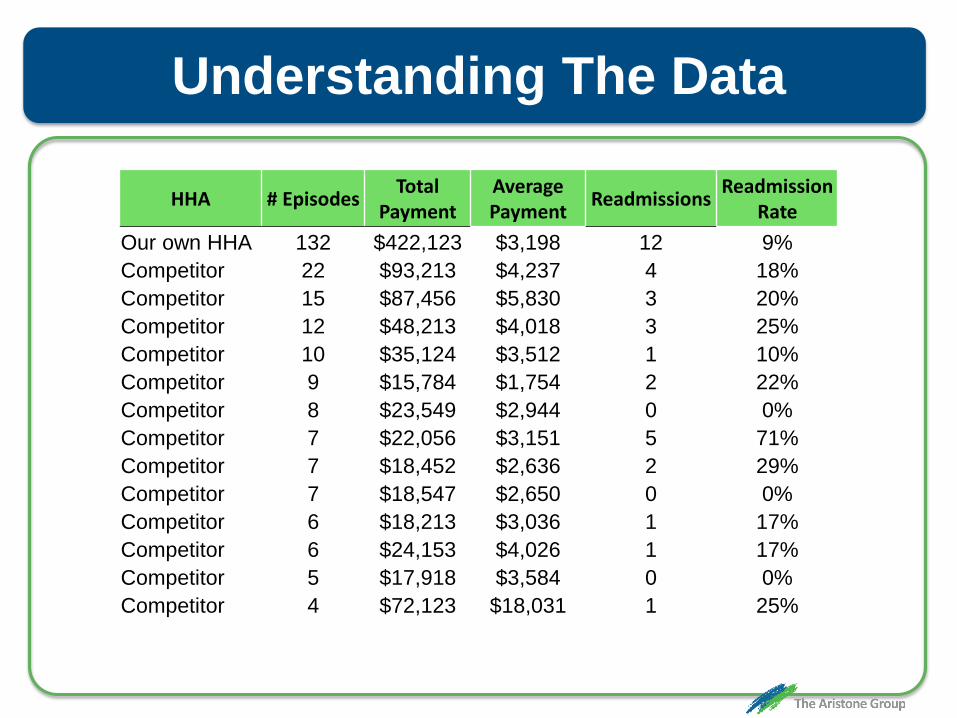
HHA # Episodes Total Payment
Average Payment Readmissions Readmission
RateOur own HHA 132 $422,123 $3,198 12 9%Competitor 22 $93,213 $4,237 4 18%Competitor 15 $87,456 $5,830 3 20%Competitor 12 $48,213 $4,018 3 25%Competitor 10 $35,124 $3,512 1 10%Competitor 9 $15,784 $1,754 2 22%Competitor 8 $23,549 $2,944 0 0%Competitor 7 $22,056 $3,151 5 71%Competitor 7 $18,452 $2,636 2 29%Competitor 7 $18,547 $2,650 0 0%Competitor 6 $18,213 $3,036 1 17%Competitor 6 $24,153 $4,026 1 17%Competitor 5 $17,918 $3,584 0 0%Competitor 4 $72,123 $18,031 1 25%
Understanding The Data

Understanding The Data
Sample Readiness KPIs / Data SetsAverage annual CJR volume by year, location,
DRG (past 5 years)

Understanding The Data
Sample Readiness KPIs / Data SetsAverage Annual CJR volume by year, location,
DRG (past 5 years)Average internal cost data / DRG

Understanding The Data
Sample Readiness KPIs / Data SetsAverage annual CJR volume by year, location,
DRG (past 5 years)Average internal cost data / DRG
List of orthopedic practices, ownership, relationship, quality ratings
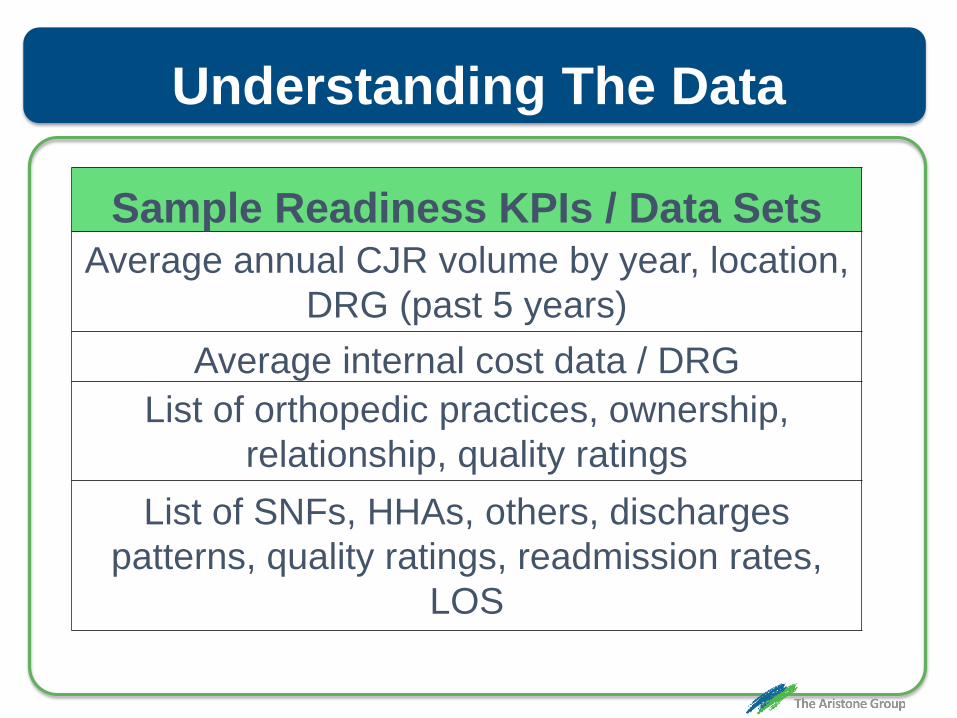
Understanding The Data
Sample Readiness KPIs / Data SetsAverage annual CJR volume by year, location,
DRG (past 5 years)Average internal cost data / DRG
List of orthopedic practices, ownership, relationship, quality ratings
List of SNFs, HHAs, others, discharges patterns, quality ratings, readmission rates,
LOS

Agenda
The CJR programWhat it means to youWhat to do right nowUnderstanding the dataPost-acute networks

Agenda
The CJR programWhat it means to youWhat to do right nowUnderstanding the dataPost-acute networks

Post-Acute Networks
Bundles are about post-acute spend• This is the source of your profit• Efforts should be focused here• Strategy is in optimizing that spend
- Direct post-acute care utilization- Readmissions
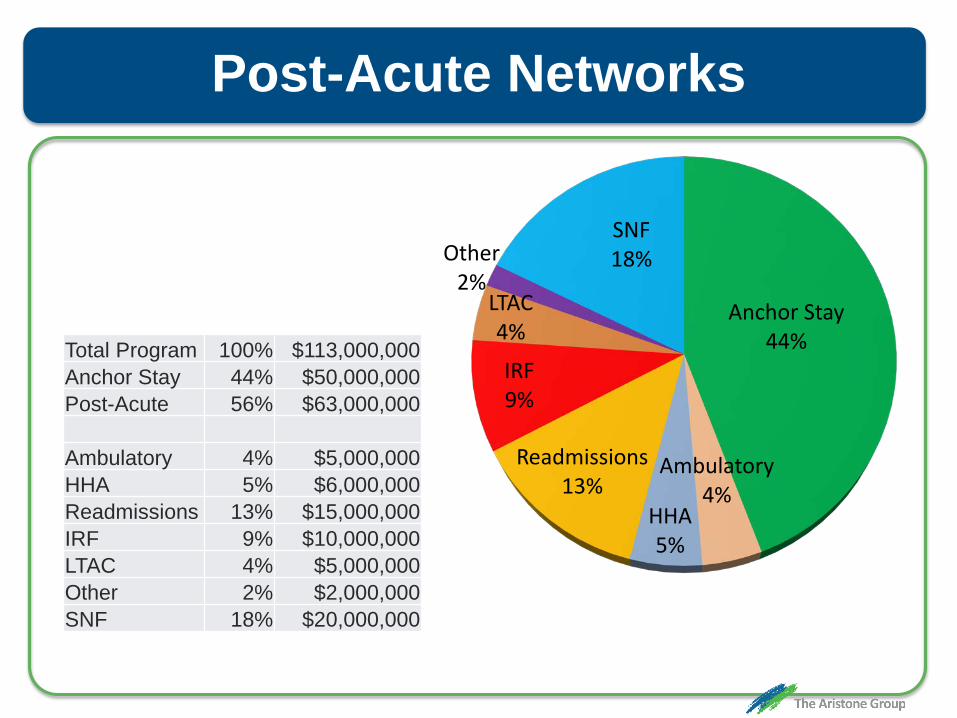
Anchor Stay44%
Ambulatory4%
HHA5%
Readmissions13%
IRF9%
LTAC4%
Other2%
SNF18%
Total Program 100% $113,000,000 Anchor Stay 44% $50,000,000 Post-Acute 56% $63,000,000
Ambulatory 4% $5,000,000 HHA 5% $6,000,000 Readmissions 13% $15,000,000 IRF 9% $10,000,000 LTAC 4% $5,000,000 Other 2% $2,000,000 SNF 18% $20,000,000
Post-Acute Networks
Post-Acute Networks
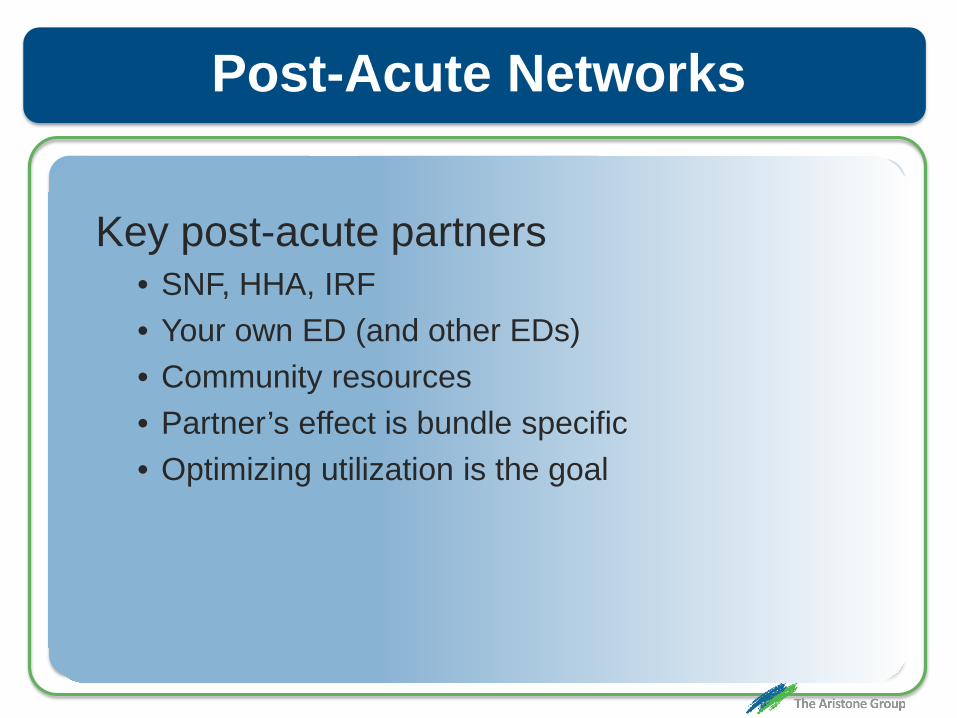
Key post-acute partners• SNF, HHA, IRF• Your own ED (and other EDs)• Community resources• Partner’s effect is bundle specific• Optimizing utilization is the goal

Post-Acute Care Network
SNF # Episodes Total Payment
Average Payment Readmissions Readmission
RateSNF 1 80 $785,461 $9,818 6 8%SNF 2 25 $301,225 $12,049 4 16%SNF 3 25 $187,522 $7,501 1 4%SNF 4 23 $354,001 $15,391 0 0%SNF 5 17 $196,222 $11,542 4 24%SNF 6 12 $164,526 $13,711 3 25%SNF 7 11 $255,124 $23,193 2 18%SNF 8 11 $91,230 $8,294 1 9%SNF 9 10 $115,235 $11,524 3 30%SNF 10 8 $152,134 $19,017 0 0%SNF 11 7 $48,256 $6,894 2 29%SNF 12 6 $44,120 $7,353 1 17%SNF 13 4 $56,125 $14,031 0 0%SNF 14 3 $14,597 $4,866 1 33%SNF 15 4 $39,256 $9,814 0 0%SNF 16 3 $13,021 $4,340 1 33%

0
10
20
30
40
50
60
70
80
90SN
F 1
SNF
5SN
F 9
SNF
13SN
F 17
SNF
21SN
F 25
SNF
29SN
F 33
SNF
37SN
F 41
SNF
45SN
F 49
SNF
53SN
F 57
SNF
61SN
F 65
SNF
69SN
F 73
SNF Referrals
Post-Acute Networks

Post-Acute Care Network
HHA # Episodes Total Payment
Average Payment Readmissions Readmission
RateOur own HHA 132 $422,123 $3,198 12 9%Competitor 22 $93,213 $4,237 4 18%Competitor 15 $87,456 $5,830 3 20%Competitor 12 $48,213 $4,018 3 25%Competitor 10 $35,124 $3,512 1 10%Competitor 9 $15,784 $1,754 2 22%Competitor 8 $23,549 $2,944 0 0%Competitor 7 $22,056 $3,151 5 71%Competitor 7 $18,452 $2,636 2 29%Competitor 7 $18,547 $2,650 0 0%Competitor 6 $18,213 $3,036 1 17%Competitor 6 $24,153 $4,026 1 17%Competitor 5 $17,918 $3,584 0 0%Competitor 4 $72,123 $18,031 1 25%

Post-Acute Networks
Why a post-acute network?• Ensures best quality/performance• Creates standardized/compliant care• Develops competition toward improvement
How to create the network?• Formal selection process• Internal input to performance metrics• Open to everyone
Post-Acute Networks
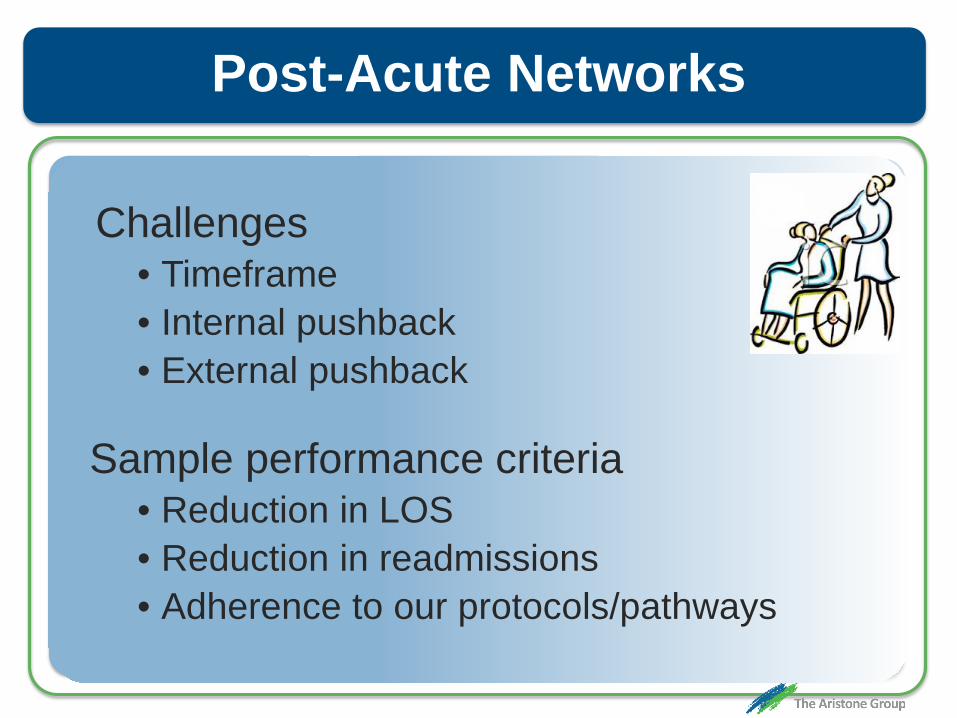
Challenges• Timeframe• Internal pushback• External pushback
Sample performance criteria• Reduction in LOS• Reduction in readmissions• Adherence to our protocols/pathways

Post-Acute Networks
Special considerations• Understanding of PAC drivers• Limitations and capabilities• Hospital support of PAC needs• Integration; e.g., your staff in their facility

Agenda
The CJR programWhat it means to youWhat to do right nowUnderstanding the dataPost-acute networks

Agenda
The CJR programWhat it means to youWhat to do right nowUnderstanding the dataPost-acute networks
Agenda
The CJR programWhat it means to youWhat to do right nowUnderstanding the dataPost-acute networks

Agenda
The CJR programWhat it means to youWhat to do right nowUnderstanding the dataPost-acute networks

Agenda
The CJR programWhat it means to youWhat to do right nowUnderstanding the dataPost-acute networks

Agenda
The CJR programWhat it means to youWhat to do right nowUnderstanding the dataPost-acute networks