Embed Size (px)
Citation preview
Making a Choropleth map with Google Fusion Tables
Choropleth map is a thematic map based on predefined aerial units. Its areas are coloured or shaded
to show the measurement of the statistical variables displayed on the map. These maps usually provide
a better visualization of how measurements vary across geographic areas. One tool to create and
share chropleth map is Google Fusion Tables. It is a very user-friendly tool and it helps users to create
an online interactive choropleth map in the most efficient method. Two sample maps made using
Google Fusion Tables are shown below:
Mapping murder around the world
http://www.guardian.co.uk/news/datablog/interactive/2011/oct/10/unitednations
development-data
Mapping population densities by the block
http://blogs.montrealgazette.com/2012/02/10/mapping-population-densities-by-the-block/
The major procedures of using this software are outlined as shown below:
Apply an online tool to import a zipped shapefile into Google Fusion Tables
Import an Excel spreadsheet into Google Fusion Tables
Merge the tabular data with KML file
Visualize the data as a choropleth map
Save or Share the map with others
Two files are needed for you to complete this tutorial and learn the steps. One is a zipped shapefile
containing the census tract (CT) boundary for the Kitchener Census Metropolitan Area (CMA). The
zipped file includes prj, shp, shx and dbf files which are all in one folder. The other one is an Excel
spreadsheet containing demographic information (total population, population age (0-14 and median
age) for each CT in Kitchener CMA.
Part 1 Import a shapefile into Google Fusion Tables
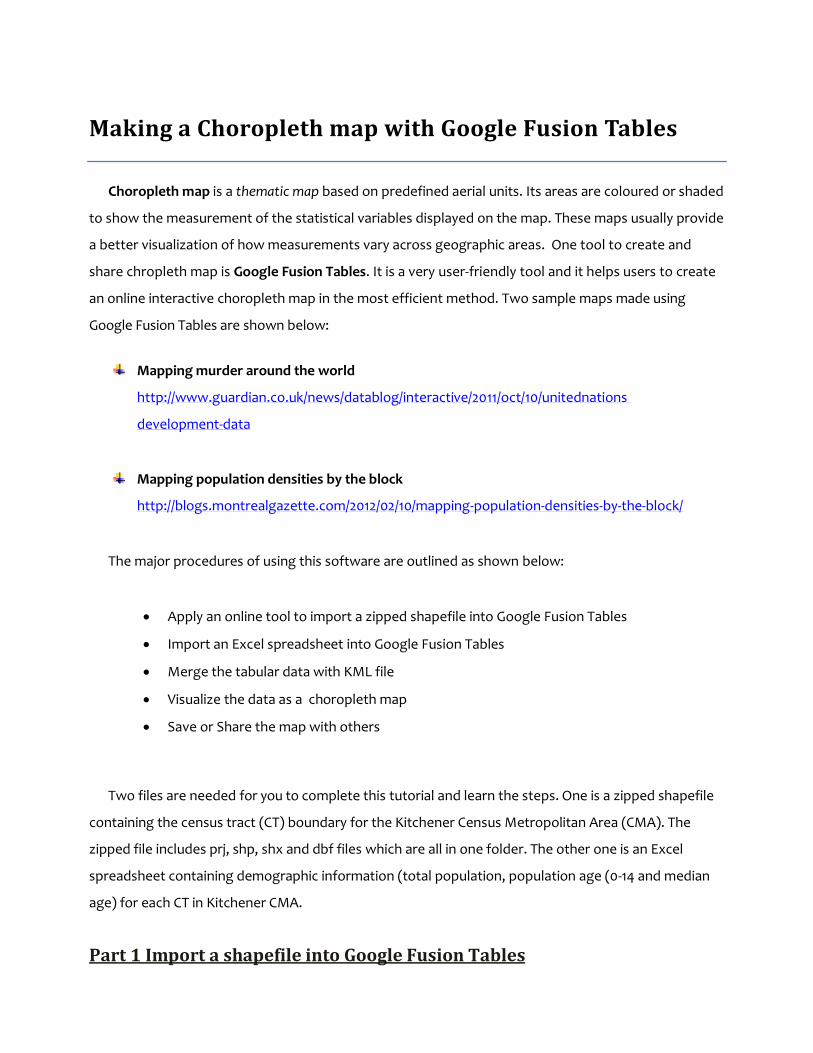
Aerial units are incredibly common in shapefile format but the only geographic file format that
Google Fusion Tables can import is KML. There are a few options to make this possible. The easiest
method is to use a Shapefile to Fusion converter called Shapescape (http://www.shpescape.com). The
steps are given below:
1. Open up the Shapescape with an internet browser and click ‘Continue’.
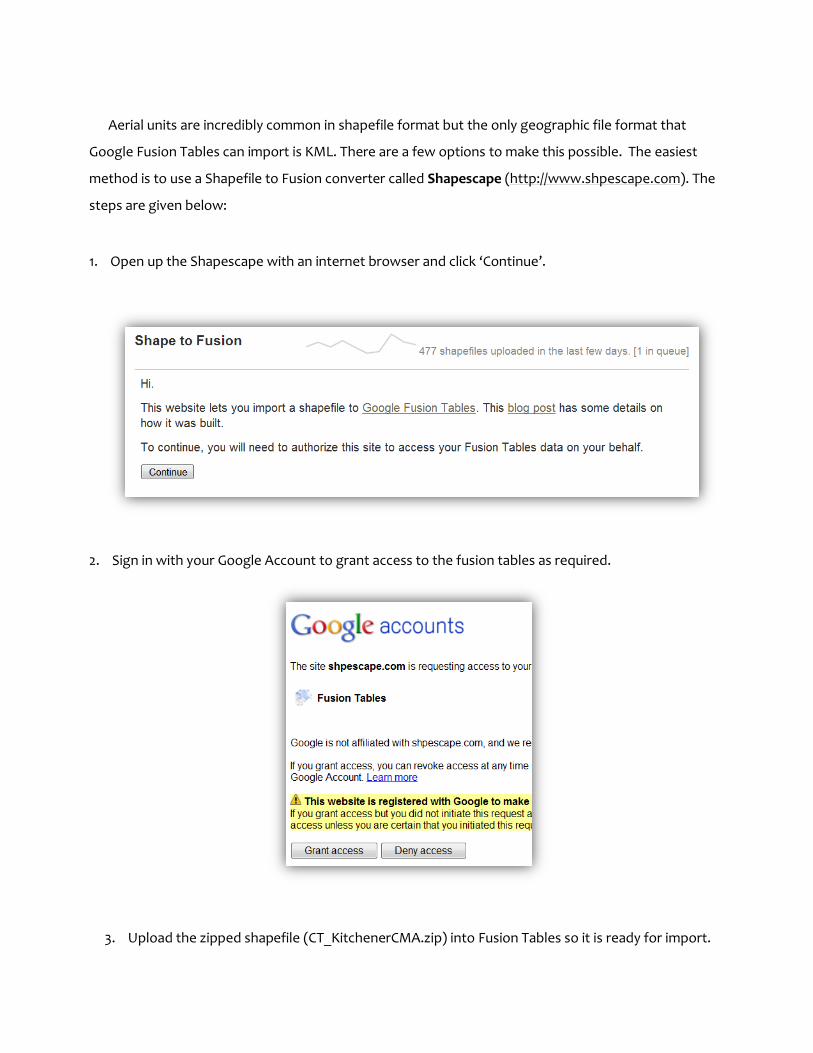
2. Sign in with your Google Account to grant access to the fusion tables as required.
3. Upload the zipped shapefile (CT_KitchenerCMA.zip) into Fusion Tables so it is ready for import.
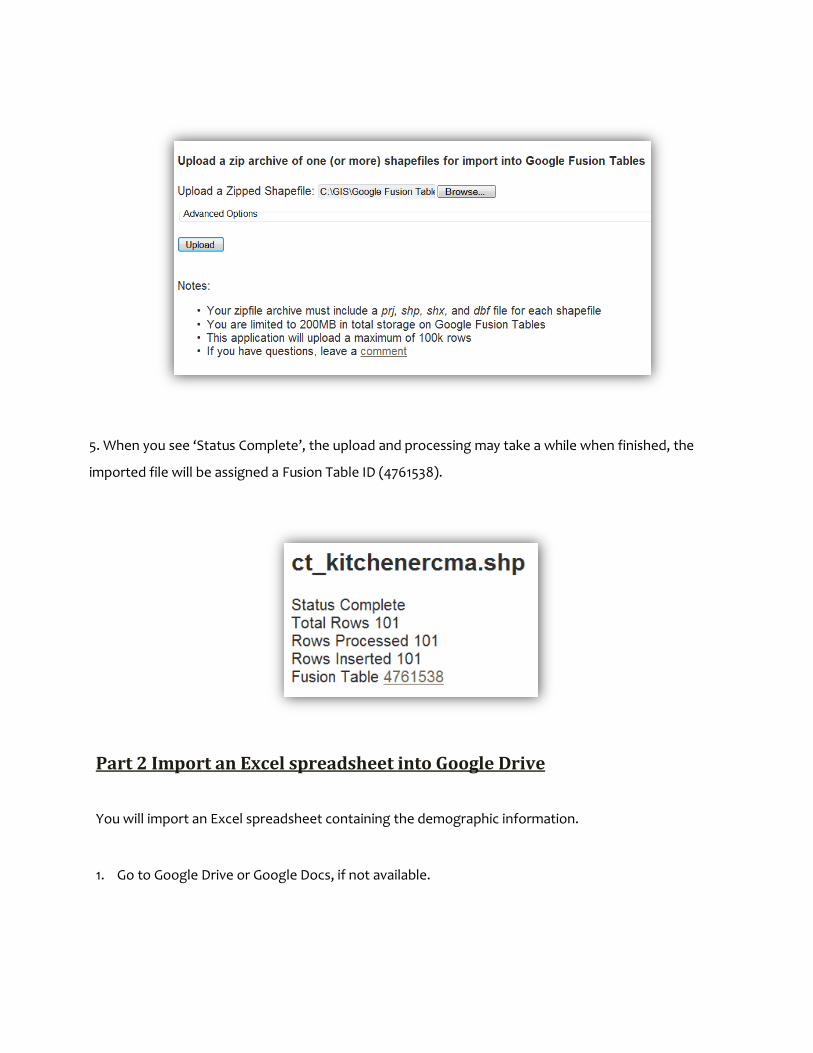
5. When you see ‘Status Complete’, the upload and processing may take a while when finished, the
imported file will be assigned a Fusion Table ID (4761538).
Part 2 Import an Excel spreadsheet into Google Drive
You will import an Excel spreadsheet containing the demographic information.
1. Go to Google Drive or Google Docs, if not available.
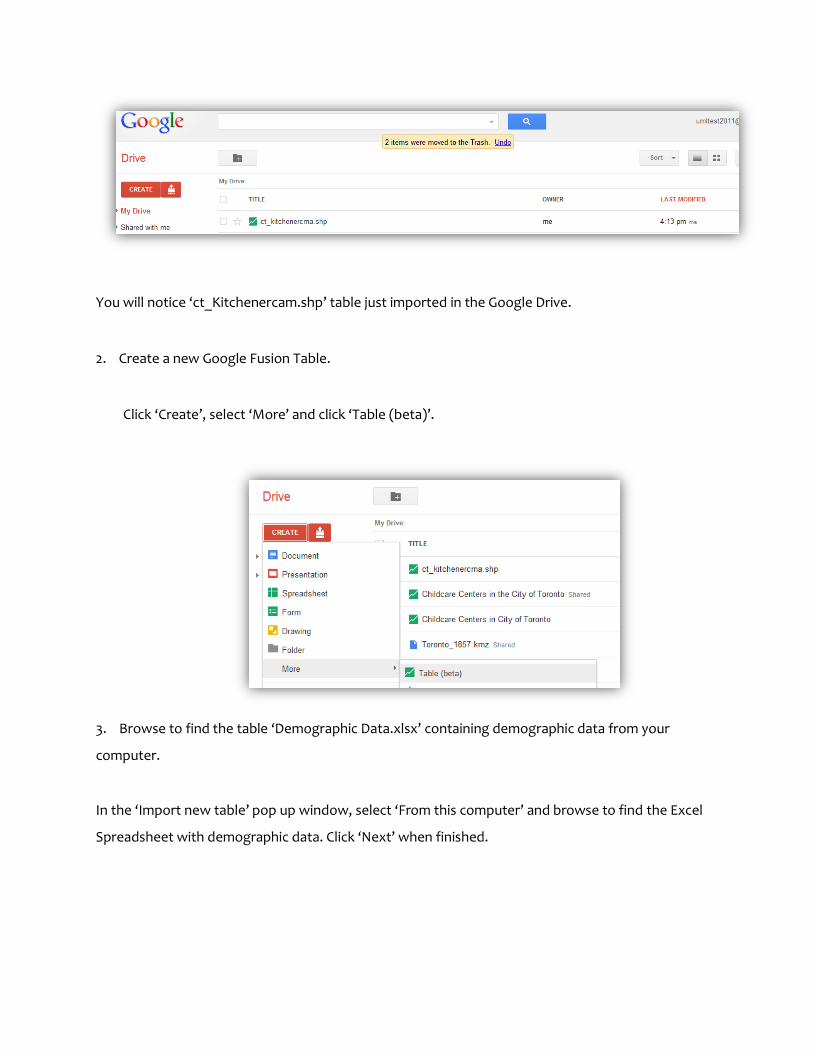
You will notice ‘ct_Kitchenercam.shp’ table just imported in the Google Drive.
2. Create a new Google Fusion Table.
Click ‘Create’, select ‘More’ and click ‘Table (beta)’.
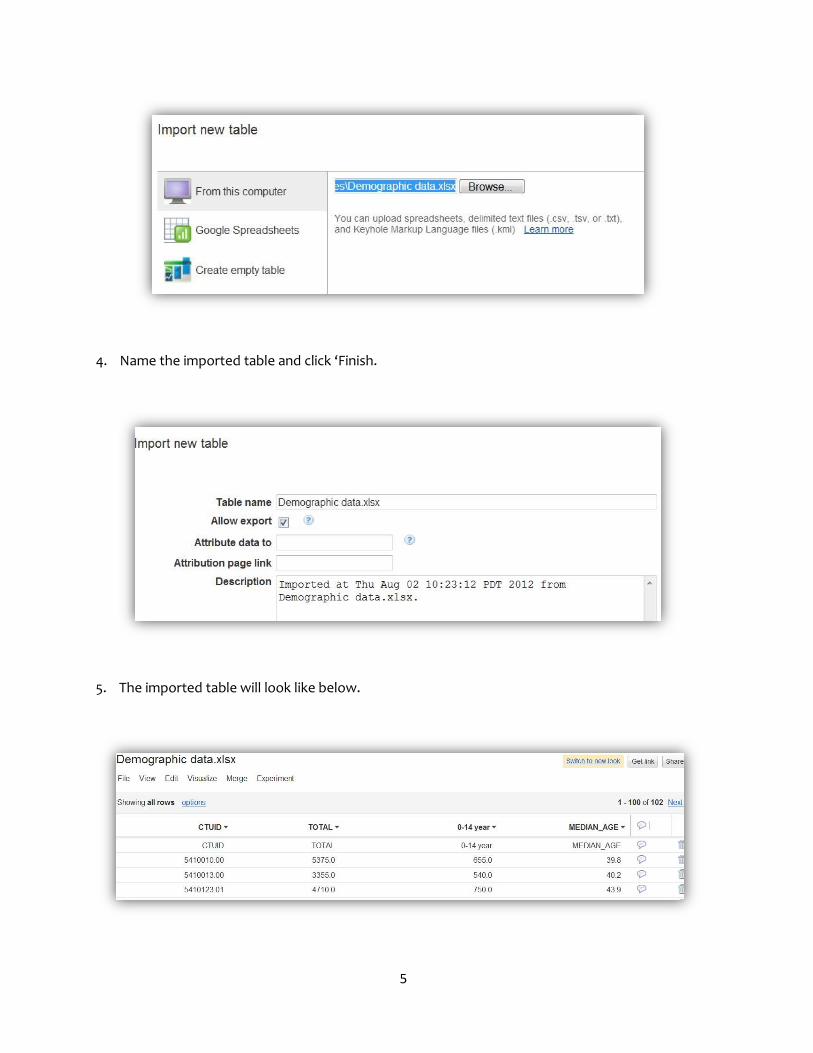
3. Browse to find the table ‘Demographic Data.xlsx’ containing demographic data from your
computer.
In the ‘Import new table’ pop up window, select ‘From this computer’ and browse to find the Excel
Spreadsheet with demographic data. Click ‘Next’ when finished.
5
4. Name the imported table and click ‘Finish.
5. The imported table will look like below.
6
Part 3 Merge the demographic data with the KML file
You can merge the demographic table with the KML boundary table by following the steps below:
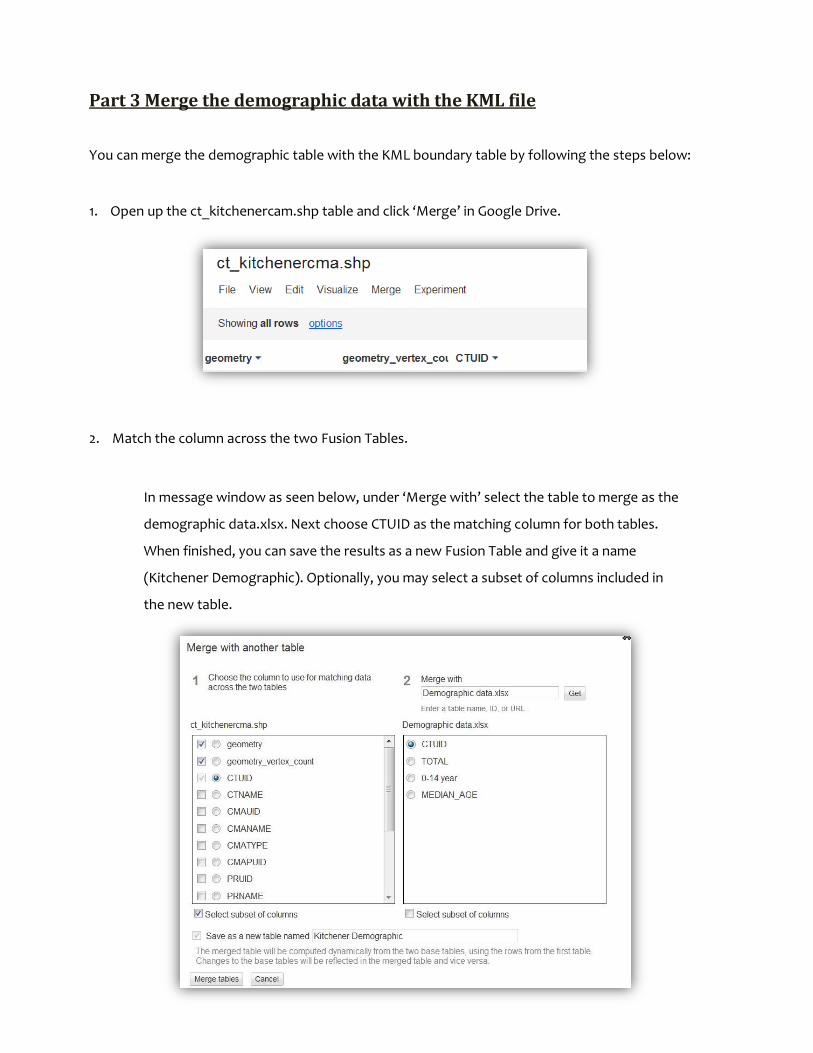
1. Open up the ct_kitchenercam.shp table and click ‘Merge’ in Google Drive.
2. Match the column across the two Fusion Tables.
In message window as seen below, under ‘Merge with’ select the table to merge as the
demographic data.xlsx. Next choose CTUID as the matching column for both tables.
When finished, you can save the results as a new Fusion Table and give it a name
(Kitchener Demographic). Optionally, you may select a subset of columns included in
the new table.
7
Part 4 Visualize the demographic data as a choropleth map
When the table merging process is complete, the next step is to create a choropleth map:
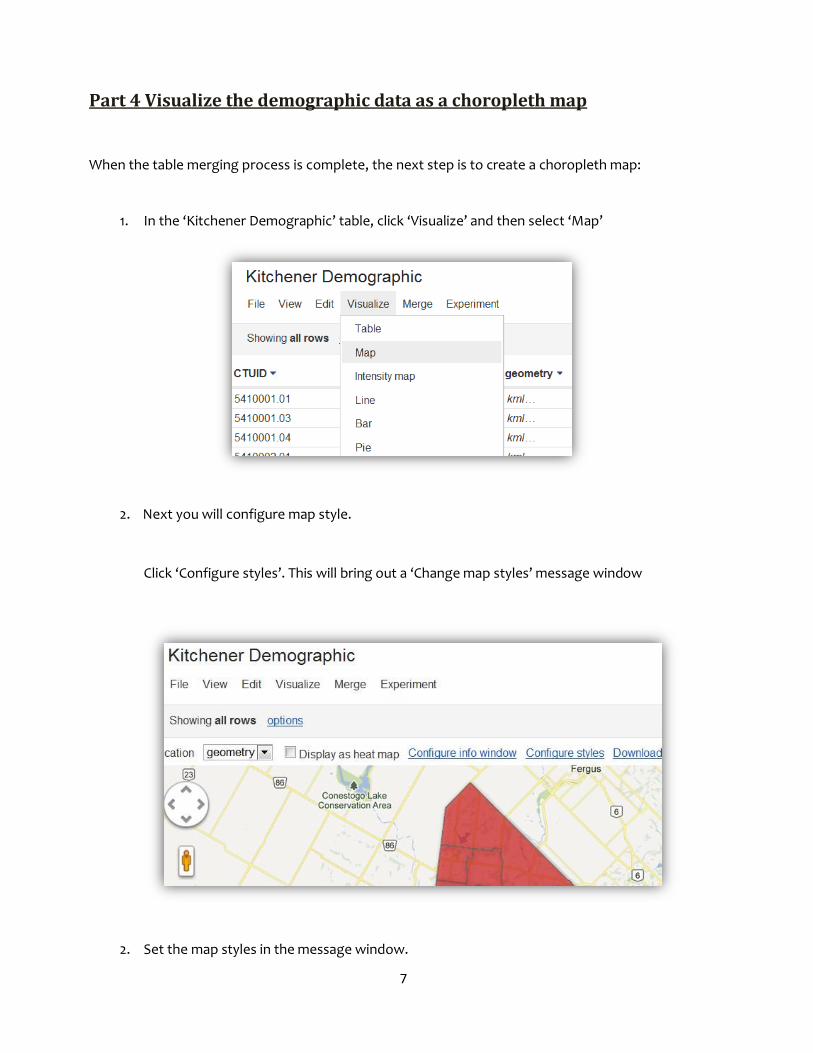
1. In the ‘Kitchener Demographic’ table, click ‘Visualize’ and then select ‘Map’
2. Next you will configure map style.
Click ‘Configure styles’. This will bring out a ‘Change map styles’ message window
2. Set the map styles in the message window.
8
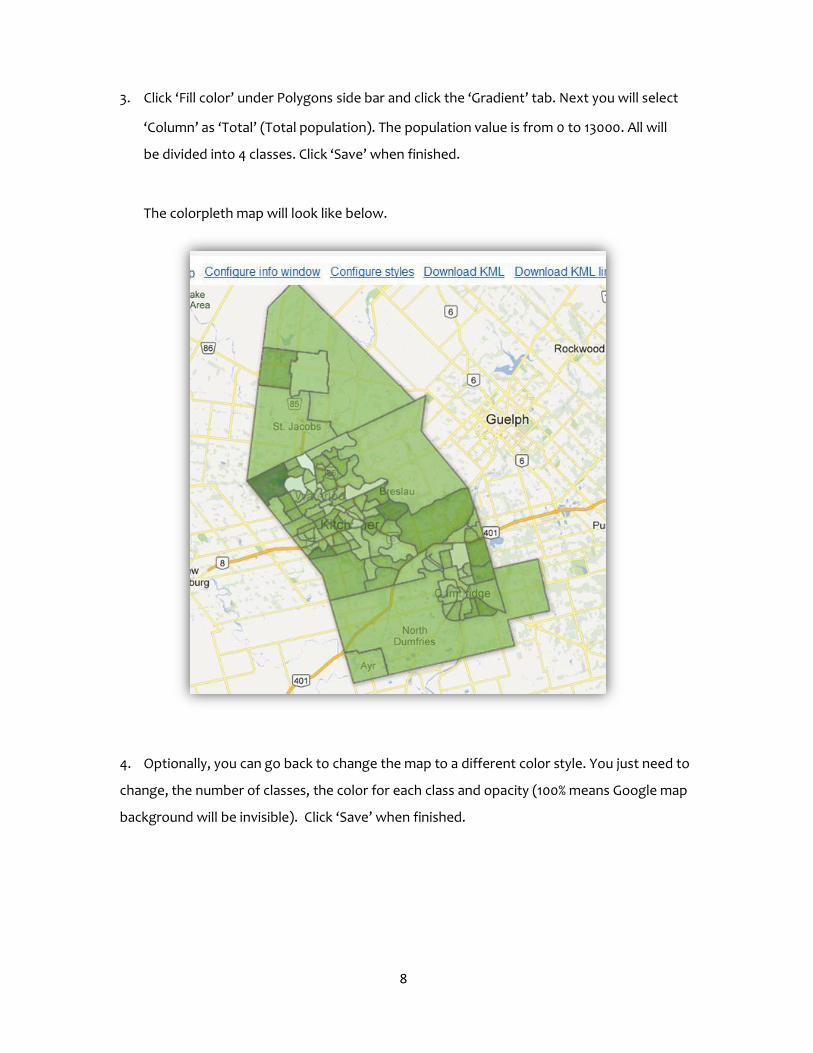
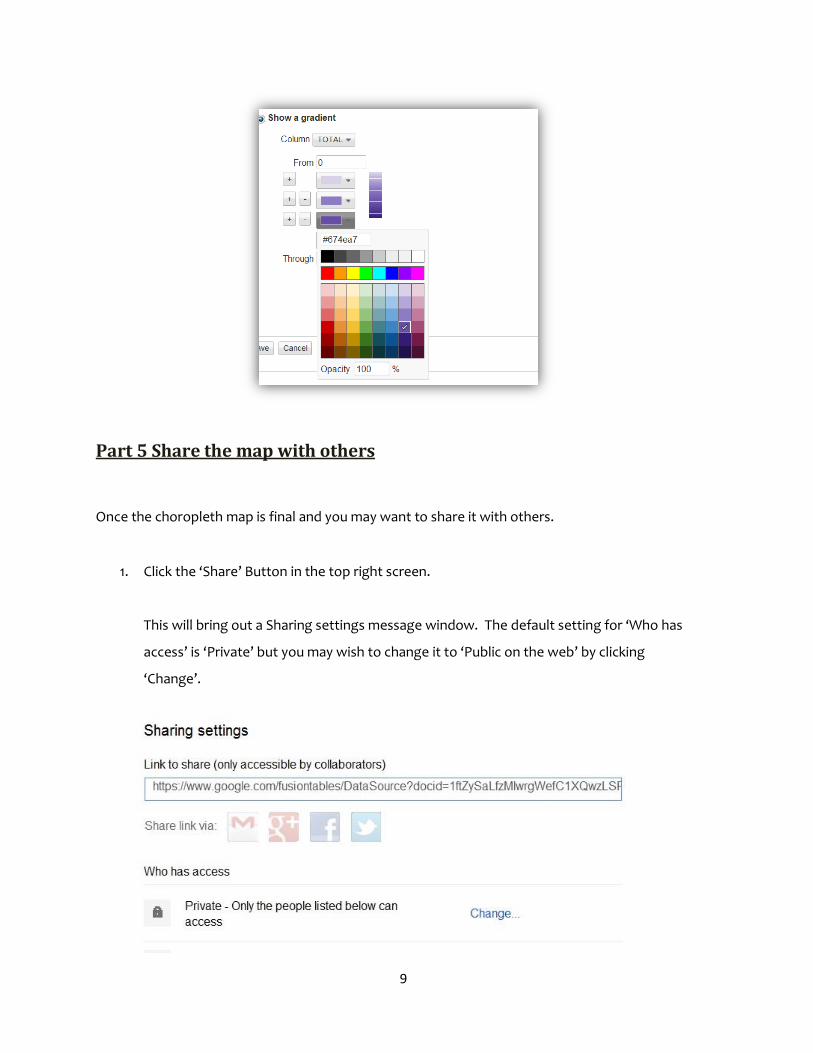
3. Click ‘Fill color’ under Polygons side bar and click the ‘Gradient’ tab. Next you will select
‘Column’ as ‘Total’ (Total population). The population value is from 0 to 13000. All will
be divided into 4 classes. Click ‘Save’ when finished.
The colorpleth map will look like below.
4. Optionally, you can go back to change the map to a different color style. You just need to
change, the number of classes, the color for each class and opacity (100% means Google map
background will be invisible). Click ‘Save’ when finished.
9
Part 5 Share the map with others
Once the choropleth map is final and you may want to share it with others.
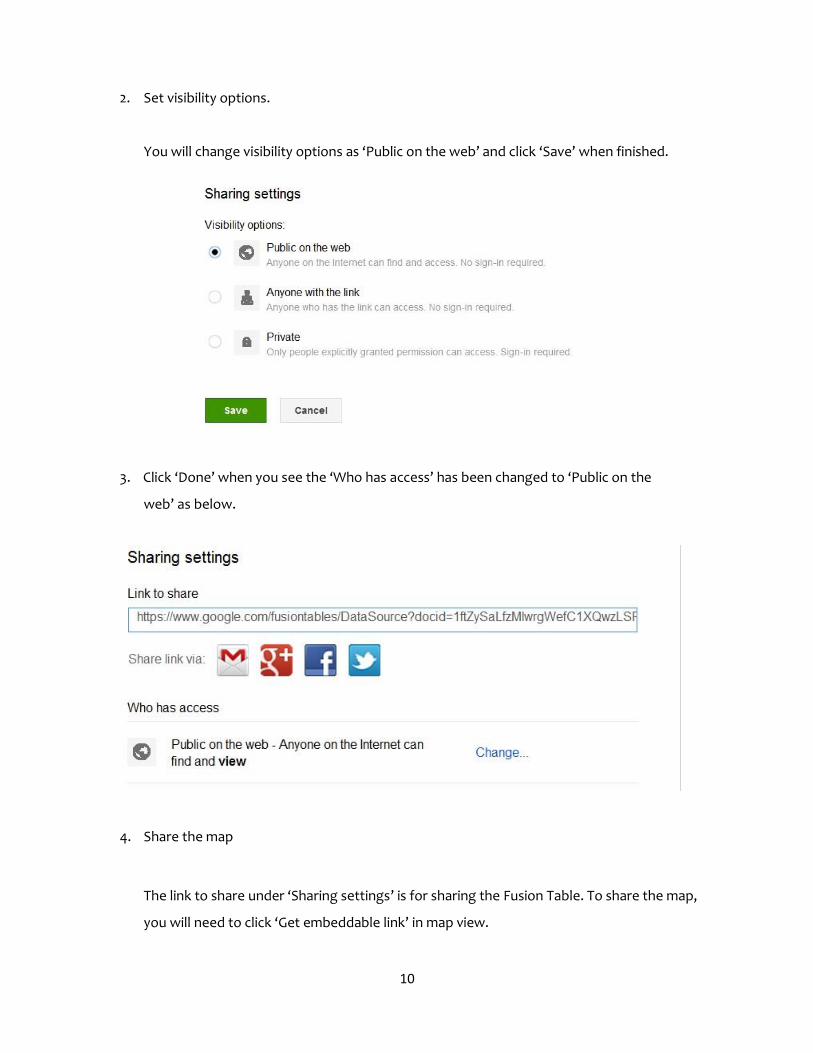
1. Click the ‘Share’ Button in the top right screen.
This will bring out a Sharing settings message window. The default setting for ‘Who has
access’ is ‘Private’ but you may wish to change it to ‘Public on the web’ by clicking
‘Change’.
10
2. Set visibility options.
You will change visibility options as ‘Public on the web’ and click ‘Save’ when finished.
3. Click ‘Done’ when you see the ‘Who has access’ has been changed to ‘Public on the
web’ as below.
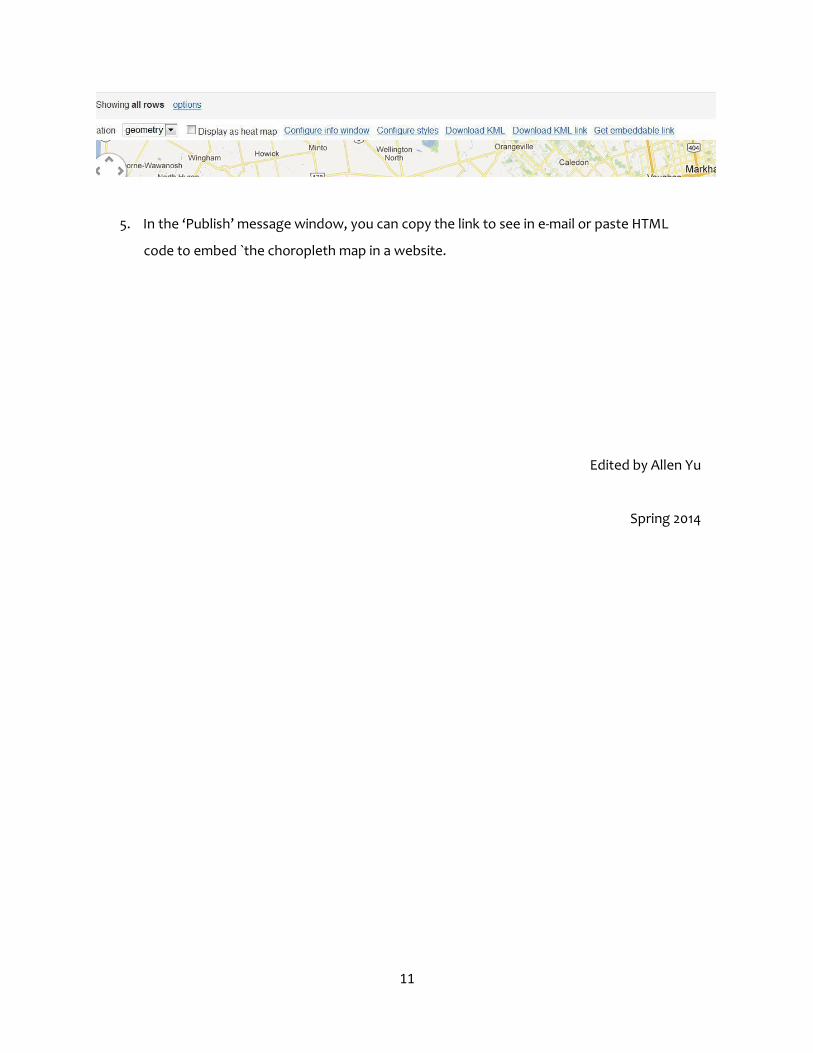
4. Share the map
The link to share under ‘Sharing settings’ is for sharing the Fusion Table. To share the map,
you will need to click ‘Get embeddable link’ in map view.
11
5. In the ‘Publish’ message window, you can copy the link to see in e-mail or paste HTML
code to embed `the choropleth map in a website.
Edited by Allen Yu
Spring 2014


![A FOSS Web Tool for Spatial Regression Techniques and its ......Mennis [4] Example of Bivariate Choropleth Mapping. Matthews and Yang [3] Example of ... Map Static Map in Base R vs](https://img.pdfslide.us/doc/110x75/5ea7cb2f56df197a443cda8b/a-foss-web-tool-for-spatial-regression-techniques-and-its-mennis-4-example.jpg)