Embed Size (px)
Citation preview

Make Wellness Your Business:
Strategies to Prevent Heart Attack
and Stroke in the Workplace
September 6, 2018
Findings from the Workplace Health in America Survey

The findings and conclusions in this presentation are those of the authors and do not necessarily represent the official position of the Centers for Disease Control and Prevention (CDC).
Presenter
Jason E. Lang, MPH, MS Team Lead for Workplace Health ProgramsDivision of Population HealthNational Center for Chronic Disease Prevention and Health PromotionCenters for Disease Control and Prevention
Presenter
Sharada Shantharam, MPH Health Scientist for IHRC, Inc.Division for Heart Disease and Stroke PreventionNational Center for Chronic Disease Prevention and Health PromotionCenters for Disease Control and Prevention
Agenda
• Why Heart Disease and Stroke Matters
• Development of the Workplace Health in America Survey
• Survey Findings
• Workplace Health Resource Center

Why Heart Disease and Stroke Matters
• More than 1.5 million people in the U.S. suffer from heart attacks and strokes per year1
• More than 800,000 deaths per year in the U.S. from cardiovascular disease (CVD)1
• CVD is the greatest contributor to racial disparities in life expectancy2
Heart Disease and Stroke in the U.S.
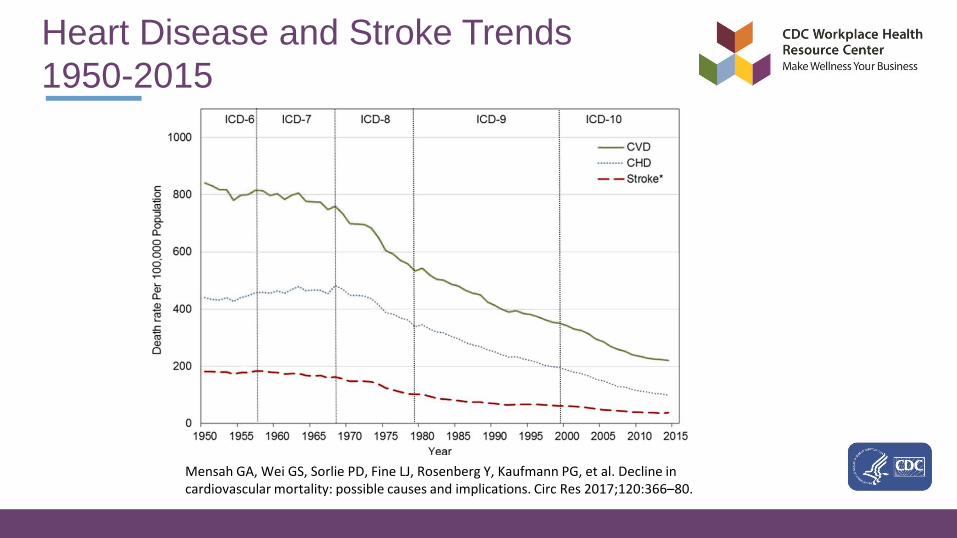
Heart Disease and Stroke Trends
1950-2015
Mensah GA, Wei GS, Sorlie PD, Fine LJ, Rosenberg Y, Kaufmann PG, et al. Decline in cardiovascular mortality: possible causes and implications. Circ Res 2017;120:366–80.
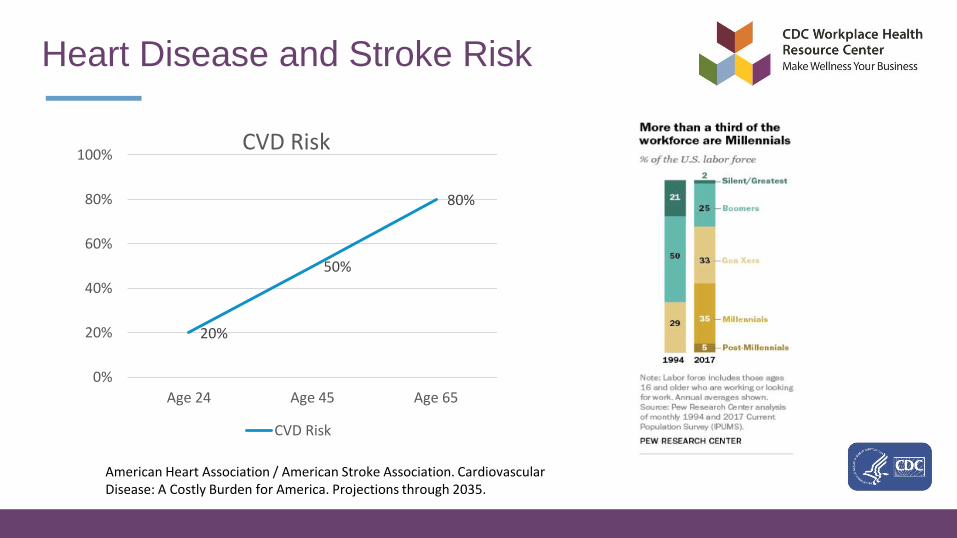
Heart Disease and Stroke Risk
20%
50%
80%
0%
20%
40%
60%
80%
100%
Age 24 Age 45 Age 65
CVD Risk
CVD Risk
American Heart Association / American Stroke Association. Cardiovascular Disease: A Costly Burden for America. Projections through 2035.

• About 1 in every 7 health care dollars is spent on CVD (about 14%)
• Annual CVD costs to the nation averaged $329.7 billion in 2013-2014• $199.2 billion in direct medical expenses
• $130.5 billion in lost productivity costs (from premature mortality)
Costs
Benjamin EJ, Virani SS, Callaway CW, et al. Heart disease and stroke statistics—2018 update: a report from the American Heart Association. Circulation. 2018;137:e67–e492.
Heart Disease and Stroke Matter
to Worksites
• On average, an employee with CVD costs his or her employer over a week in absences and $1,100 more on lost productivity each year than an employee without CVD.1
• Heart-healthy employees have better morale, miss less work, and are more productive than less healthy employees.2,3,4
1 American Heart Association / American Stroke Association. Cardiovascular Disease Costs will Exceed $1 Trillion by 2035, Warns
the American Heart Association: Nearly Half of Americans Will Develop Pre-existing CVD Conditions. 14 February 2017.2 Certified B Corporation. B Resource Guide: Creating and Employee Wellness Program.3 Linnan L, Weiner B, Graham A, Emmons K. Manager Beliefs Regarding Worksite Health Promotion Programs: Findings from the
Working Healthy Project 2. American Journal of Health Promotion. 2007.Jul-Aug;21(6):521-8. 4 Asay GRB, Roy K, Lang JE, Payne RL, Howard DH. Absenteeism and Employer Costs Associated with Chronic Diseases and
Health Risk Factors in the US Workforce. Prev. Chronic Dis. 2016.13;150503.

Development of the Workplace Health in
America Survey
• Describe current state of U.S. workplace health promotion and protection programs and practices in a nationally representative sample of employers, including by region, size, and industry
• Support ongoing surveillance of national workplace health priorities, trends, and emerging issues
• Provide free and accessible workplace health and safety program and policy data
• Advance workplace health promotion and protection research
Workplace Health in America (WHA)
Survey Objectives

• Project Steering Committee of national experts
• Data User Group of health agencies, employers, unions, insurers, employer groups, and worksite health promotion experts recommended survey domain areas
• Survey Development Group• Reviewed 13 other national employer surveys; including 2004 federally-funded national employer survey
• Created key domains and item dictionary
• Developed initial survey
• Review and input from CDC subject matter experts
• Cognitive interview testing on all survey items
• Pilot tested instrument with employers
WHA Survey Instrument Development

Survey Content Areas
Worksite Characteristics Disease management programs
Health insurance Key partners and incentives
Health risk assessments Work-life benefits and policies
Workplace health program
characteristics
Occupational health and safety
9 Health promotion program
areas & use of evidence-based
strategies
Barriers to health promotion
program implementation
Health screenings Emerging issues
• Followed procedures from 2004 National Worksite Health Promotion Survey, to the extent possible, to allow comparison of results
• Drew sample from Dun & Bradstreet database of all private and public employers in the U.S. with at least 10 employees
• Selected worksites using a stratified simple random sample design; primary strata were the 10 CDC regions. Within each region, additional stratification by:
• Size: 10-24, 25-49, 50-99, 100-249, 250-499, 500-749, 750-999, 1000+
• Seven combined North American Industry Classification System (NAICS) sectors
• Selected the number of worksites per size and industry group based on proportional allocation to the population
Sampling
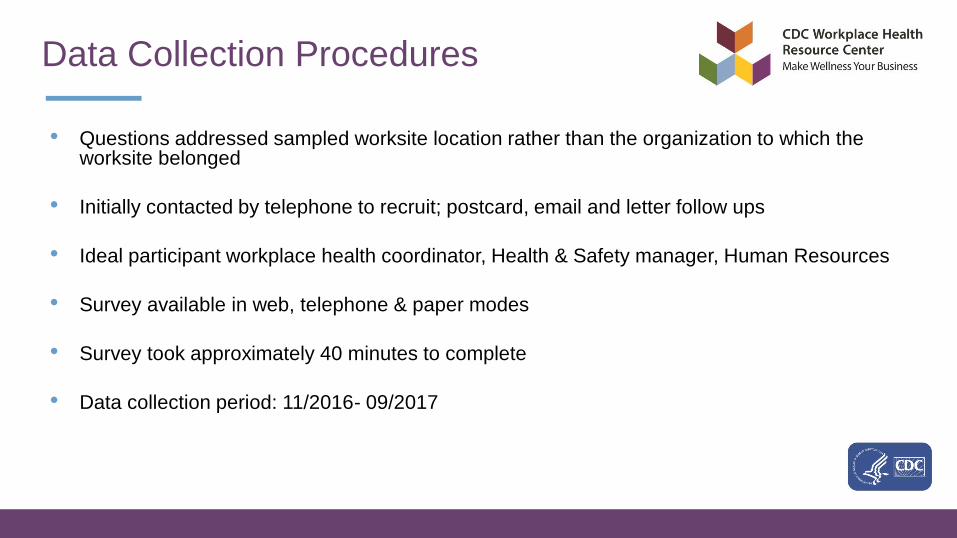
• Questions addressed sampled worksite location rather than the organization to which the worksite belonged
• Initially contacted by telephone to recruit; postcard, email and letter follow ups
• Ideal participant workplace health coordinator, Health & Safety manager, Human Resources
• Survey available in web, telephone & paper modes
• Survey took approximately 40 minutes to complete
• Data collection period: 11/2016- 09/2017
Data Collection Procedures
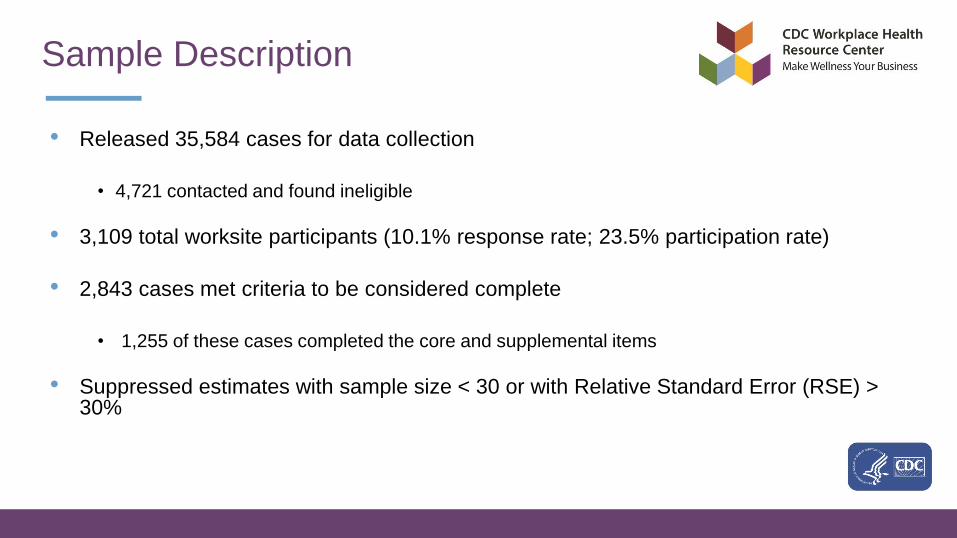
• Released 35,584 cases for data collection
• 4,721 contacted and found ineligible
• 3,109 total worksite participants (10.1% response rate; 23.5% participation rate)
• 2,843 cases met criteria to be considered complete
• 1,255 of these cases completed the core and supplemental items
• Suppressed estimates with sample size < 30 or with Relative Standard Error (RSE) > 30%
Sample Description

Survey Findings
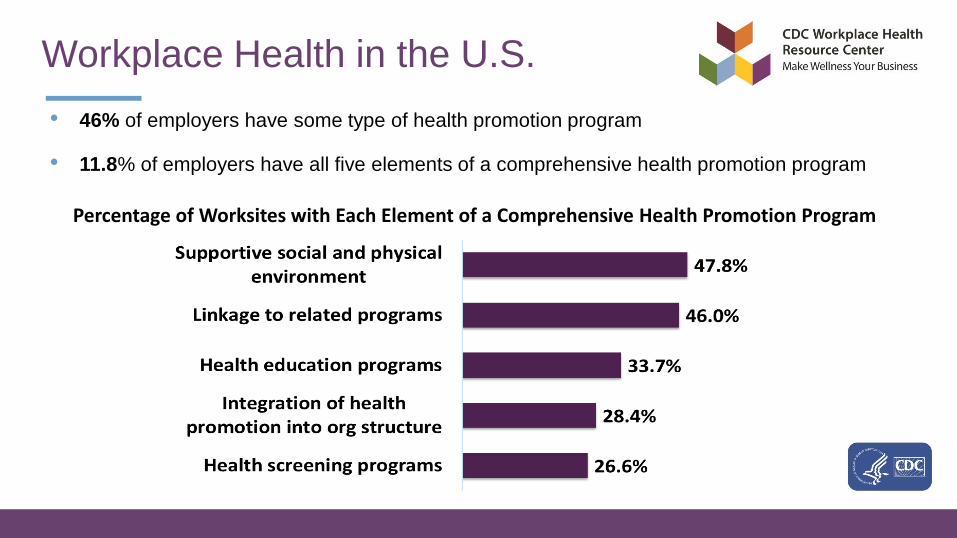
• 46% of employers have some type of health promotion program
• 11.8% of employers have all five elements of a comprehensive health promotion program
Workplace Health in the U.S.
Percentage of Worksites with Each Element of a Comprehensive Health Promotion Program
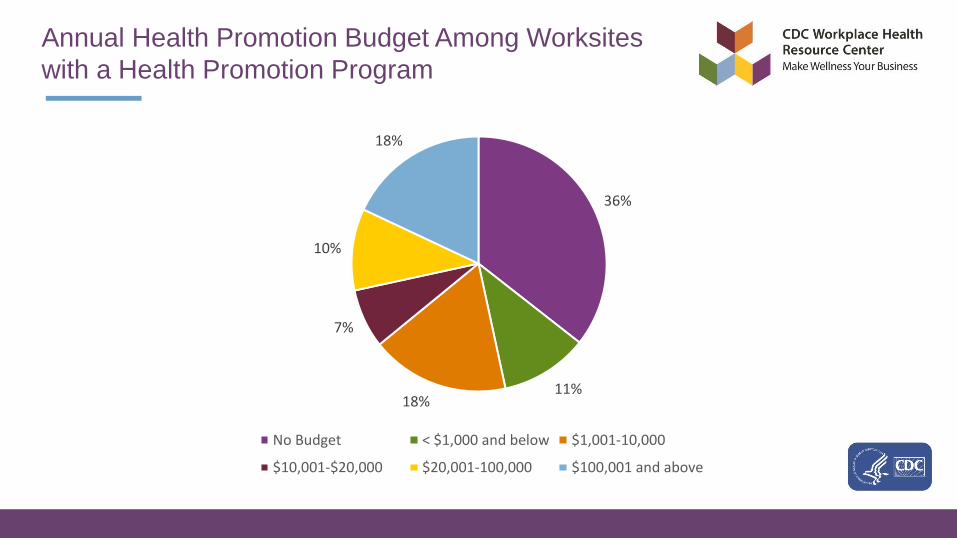
Annual Health Promotion Budget Among Worksites
with a Health Promotion Program
36%
11%18%
7%
10%
18%
No Budget < $1,000 and below $1,001-10,000
$10,001-$20,000 $20,001-100,000 $100,001 and above
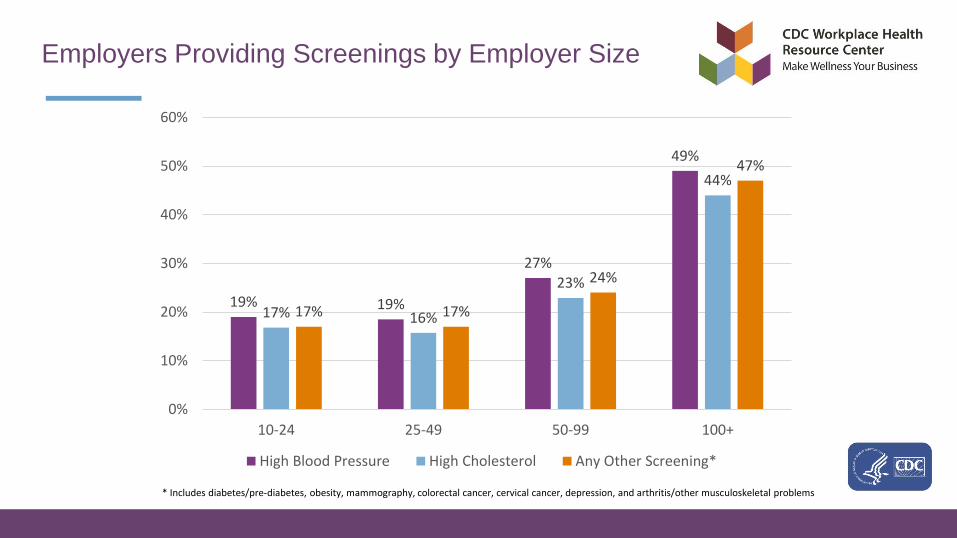
Employers Providing Screenings by Employer Size
19% 19%
27%
49%
17% 16%
23%
44%
17% 17%
24%
47%
0%
10%
20%
30%
40%
50%
60%
10-24 25-49 50-99 100+
High Blood Pressure High Cholesterol Any Other Screening*
* Includes diabetes/pre-diabetes, obesity, mammography, colorectal cancer, cervical cancer, depression, and arthritis/other musculoskeletal problems
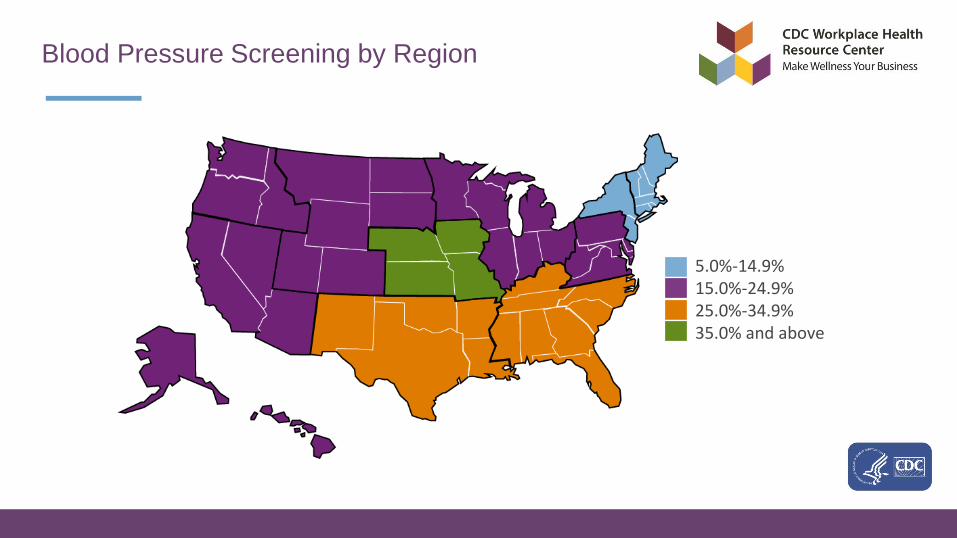
Blood Pressure Screening by Region
5.0%-14.9%15.0%-24.9%25.0%-34.9%35.0% and above
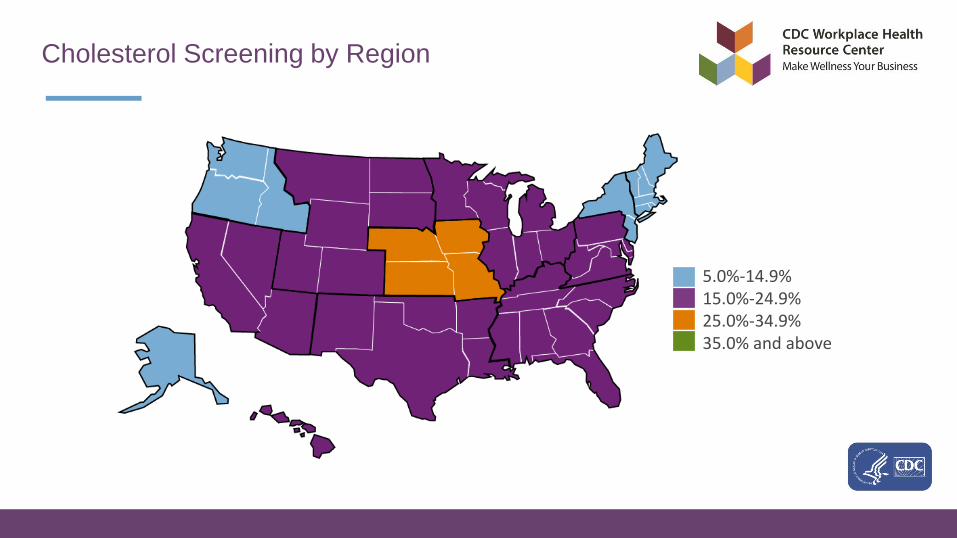
Cholesterol Screening by Region
5.0%-14.9%15.0%-24.9%25.0%-34.9%35.0% and above
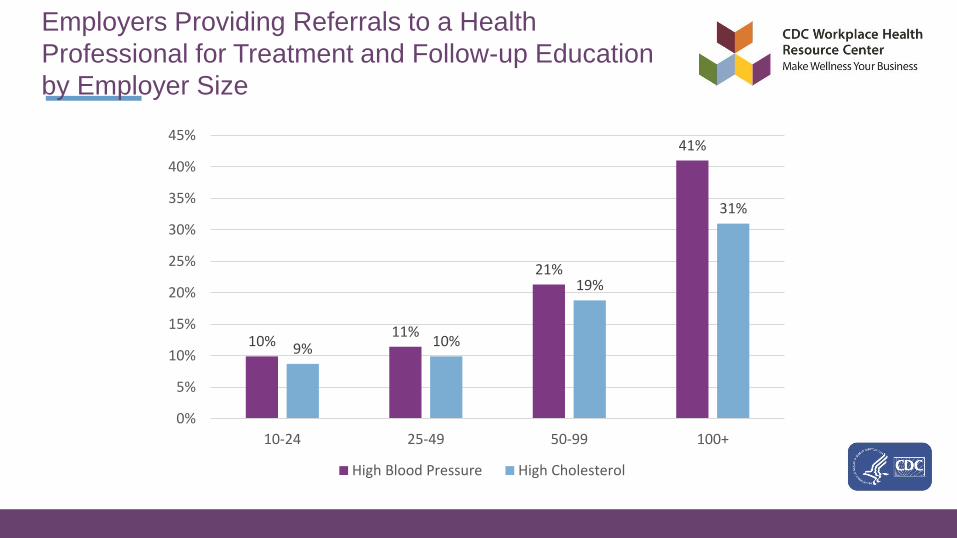
Employers Providing Referrals to a Health
Professional for Treatment and Follow-up Education
by Employer Size
10%11%
21%
41%
9% 10%
19%
31%
0%
5%
10%
15%
20%
25%
30%
35%
40%
45%
10-24 25-49 50-99 100+
High Blood Pressure High Cholesterol
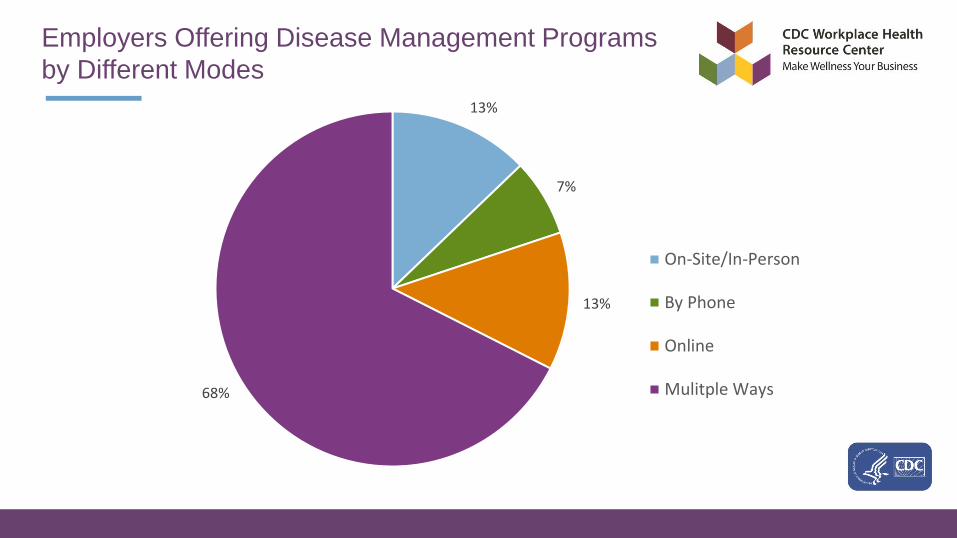
Employers Offering Disease Management Programs
by Different Modes
13%
7%
13%
68%
On-Site/In-Person
By Phone
Online
Mulitple Ways
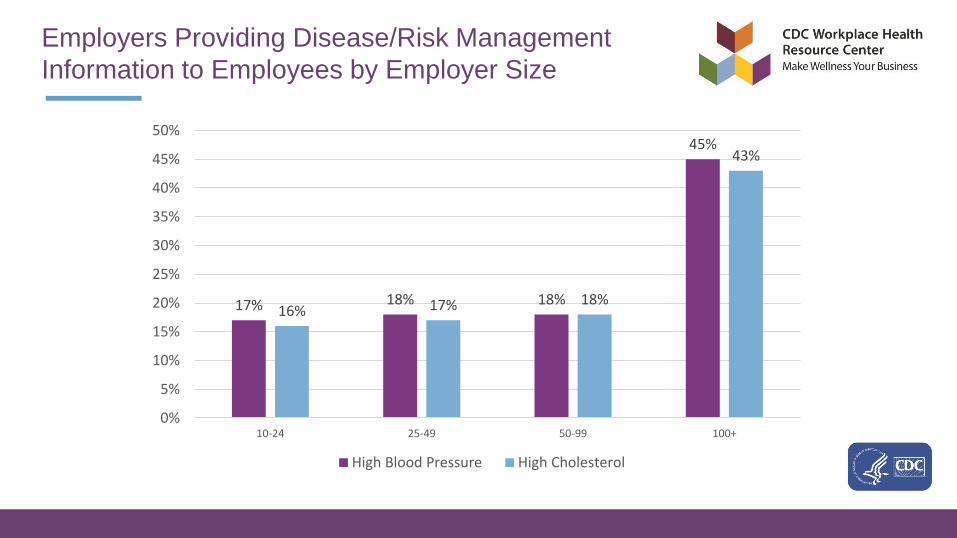
Employers Providing Disease/Risk Management
Information to Employees by Employer Size
17% 18% 18%
45%
16% 17% 18%
43%
0%
5%
10%
15%
20%
25%
30%
35%
40%
45%
50%
10-24 25-49 50-99 100+
High Blood Pressure High Cholesterol
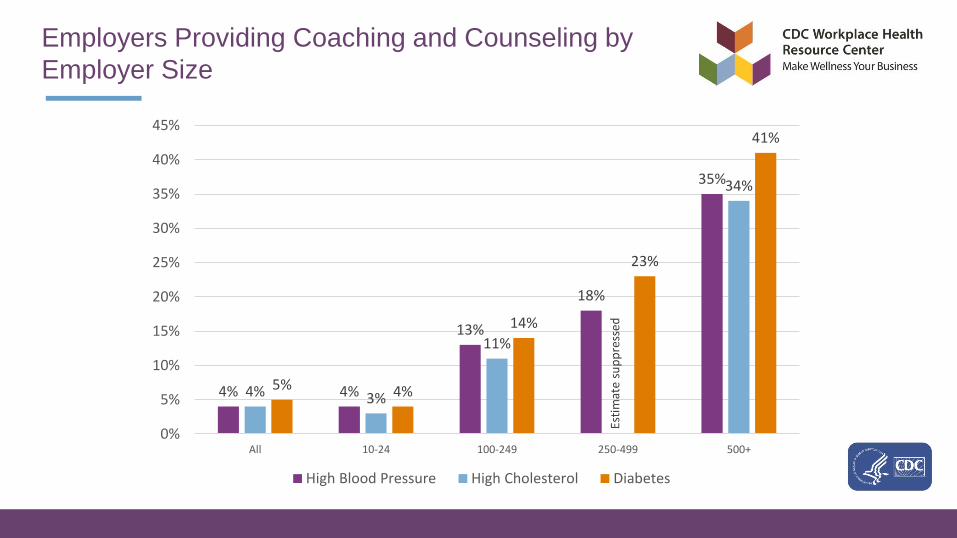
Employers Providing Coaching and Counseling by
Employer Size
4% 4%
13%
18%
35%
4% 3%
11%
0%
34%
5% 4%
14%
23%
41%
0%
5%
10%
15%
20%
25%
30%
35%
40%
45%
All 10-24 100-249 250-499 500+
High Blood Pressure High Cholesterol Diabetes
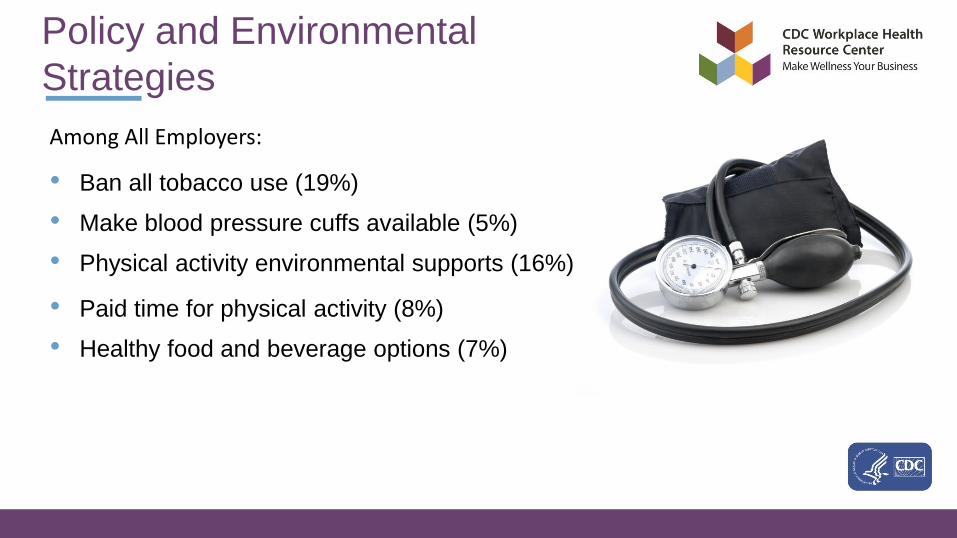
• Ban all tobacco use (19%)
• Make blood pressure cuffs available (5%)
• Physical activity environmental supports (16%)
• Paid time for physical activity (8%)
• Healthy food and beverage options (7%)
Policy and Environmental
Strategies
Among All Employers:

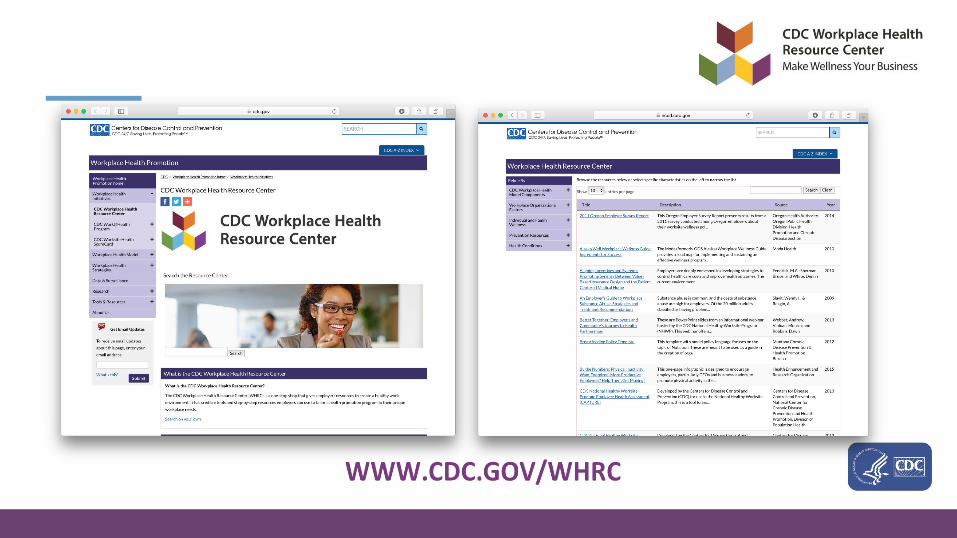
Workplace Health Resource Center
(WHRC)
• 500+ resources and growing
WHRC Tools
Library of webinars
and videos
Workplace health
strategies for small
business
Evidence-based summaries and issue
briefs
Emerging Issues (e.g., Sleep)Case studies
• Follow us on social media
CDC
@CDCgov
• Use #CDCWorkplaceHealth
• Engagement opportunities or have questions - email [email protected]
Stay Connected

Thank You