Embed Size (px)
Citation preview
12 May 2008
Make it happen
Delivering While De-LeveringSir Fred Goodwin, Group Chief Executive
Slide 2
Important Information
This document does not constitute an offer to sell, or a solicitation of an offer to subscribe for, securities of RBS or any of its affiliates in any jurisdiction or an inducement to enter into investment activity. This document is not a prospectus and investors should not subscribe for any of RBS’s securities except on the basis of the information contained in a prospectus.
No securities mentioned herein (the “Securities”) have been, or will be, registered under the United States Securities Act of 1933 (the “Securities Act”) and may not be offered or sold in the United States absent registration or an exemption from the registration requirements of the Securities Act. There will be no public offer of any Securities in the United States.
Certain statements made in this document constitute forward-looking statements within the meaning of the United States Private Securities Litigation Reform Act of 1995. Forward looking statements can be identified by the use of words such as ‘‘may’’, ‘‘will’’, ‘‘expect’’, ‘‘intend’’, ‘‘estimate’’, ‘‘anticipate’’, ‘‘believe’’, ‘‘plan’’, ‘‘seek’’, ‘‘continue’’ or similar expressions and relate to, among other things, the performance of RBS's various business units in the near to medium term, the amount by which RBS expects to write down the value of certain of its assets, RBS's expectations in respect of the rights issue, its capital ratios and its dividend payout ratio, RBS's business strategy and its plans and objectives for future operations. Such statements are based on current expectations and, by their nature, are subject to a number of risks and uncertainties that could cause actual results and performance to differ materially from any expected future results or performance, expressed or implied, by the forward-looking statement. Factors that might cause forward looking statements to differ materially from actual results, include among other things, general economic conditions in the European Union, in particular in the United Kingdom, and in other countries in which RBS has business activities or investments, including the United States; the inability of RBS to hedge certain risks economically; the adequacy of RBS’s impairment provisions and loss reserves; RBS’s ability to achieve revenue benefits and cost savings from the integration of certain of ABN AMRO’s businesses and assets; and the potential exposure of RBS to various types of market risks, such as interest rate risk, foreign exchange rate risk, credit risk and commodity and equity price risk. These forward-looking statements speak only as of the date of this document. The information and opinions contained in this document are subject to change without notice and, subject to compliance with applicable law, RBS assumes no responsibility or obligation to update publicly or review any of the forward- looking statements contained herein.

12 May 2008
Make it happen
De-Levering
Slide 4
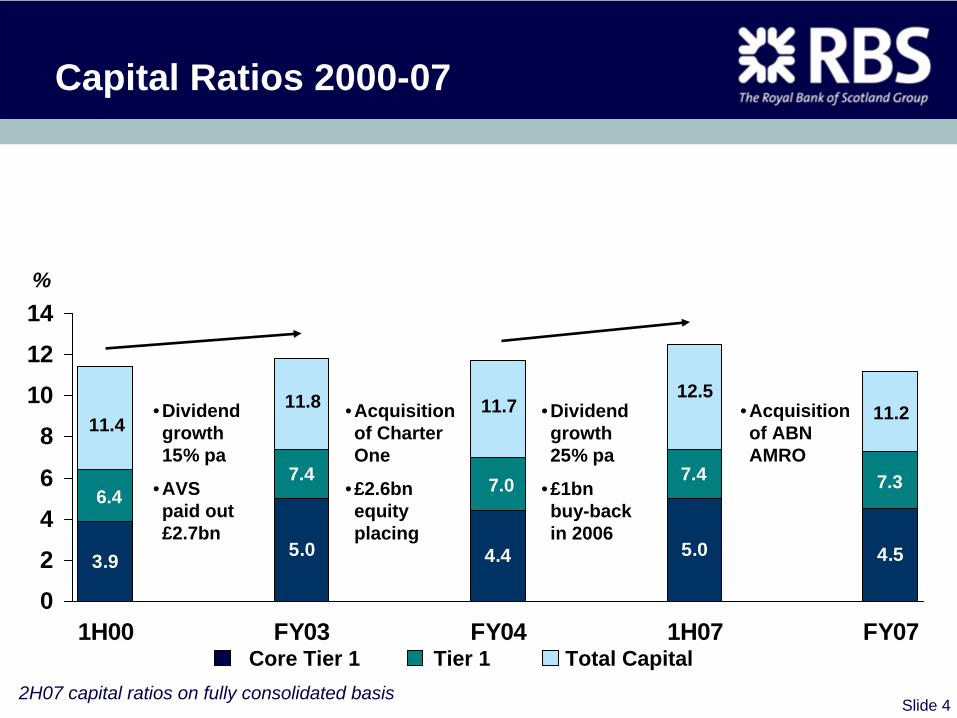
Capital Ratios 2000-07
3.9 5.0 4.4 5.0 4.5
0246
8101214
1H00 FY03 FY04 1H07 FY07
6.47.4 7.0 7.4 7.3
11.411.8 11.7
12.511.2
%
Core Tier 1 Tier 1 Total Capital2H07 capital ratios on fully consolidated basis
• Dividend growth 15% pa
• AVS paid out £2.7bn
• Dividend growth 25% pa
• £1bn buy-back in 2006
• Acquisition of Charter One
• £2.6bn equity placing
• Acquisition of ABN AMRO
Slide 5
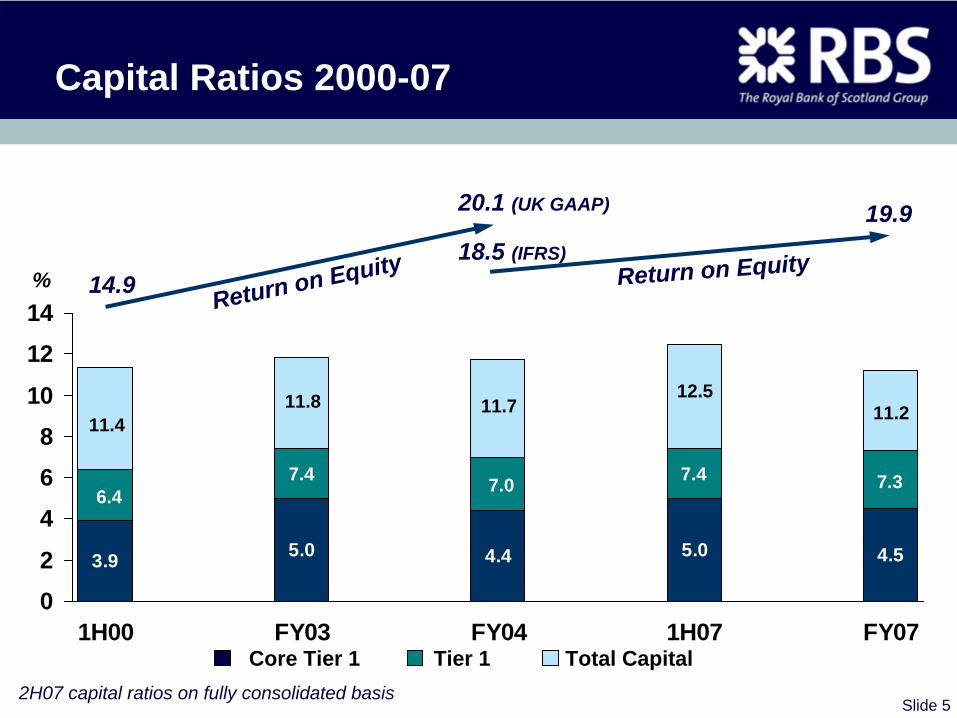
Capital Ratios 2000-07
3.9 5.0 4.4 5.0 4.5
02
468
10
1214
1H00 FY03 FY04 1H07 FY07
%
Core Tier 1 Tier 1 Total Capital2H07 capital ratios on fully consolidated basis
Return on Equity 18.5 (IFRS)
20.1 (UK GAAP) 19.9
14.9 Return on Equity
6.47.4 7.0 7.4 7.3
11.411.8 11.7
12.511.2
Slide 6
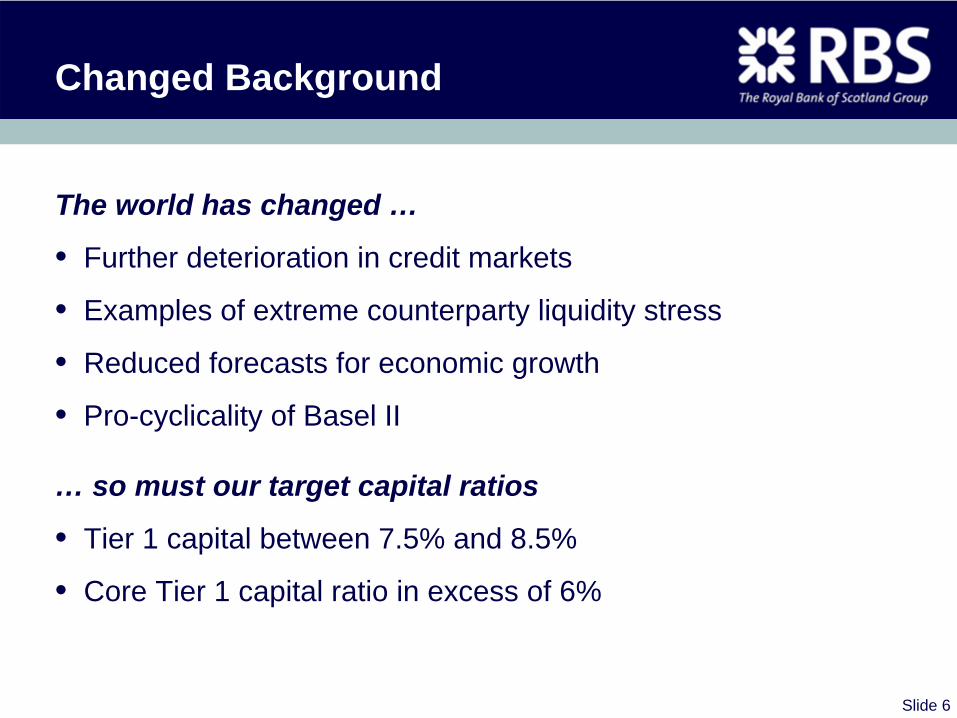
Changed Background
The world has changed …
• Further deterioration in credit markets
• Examples of extreme counterparty liquidity stress
• Reduced forecasts for economic growth
• Pro-cyclicality of Basel II
… so must our target capital ratios
• Tier 1 capital between 7.5% and 8.5%
• Core Tier 1 capital ratio in excess of 6%
Slide 7
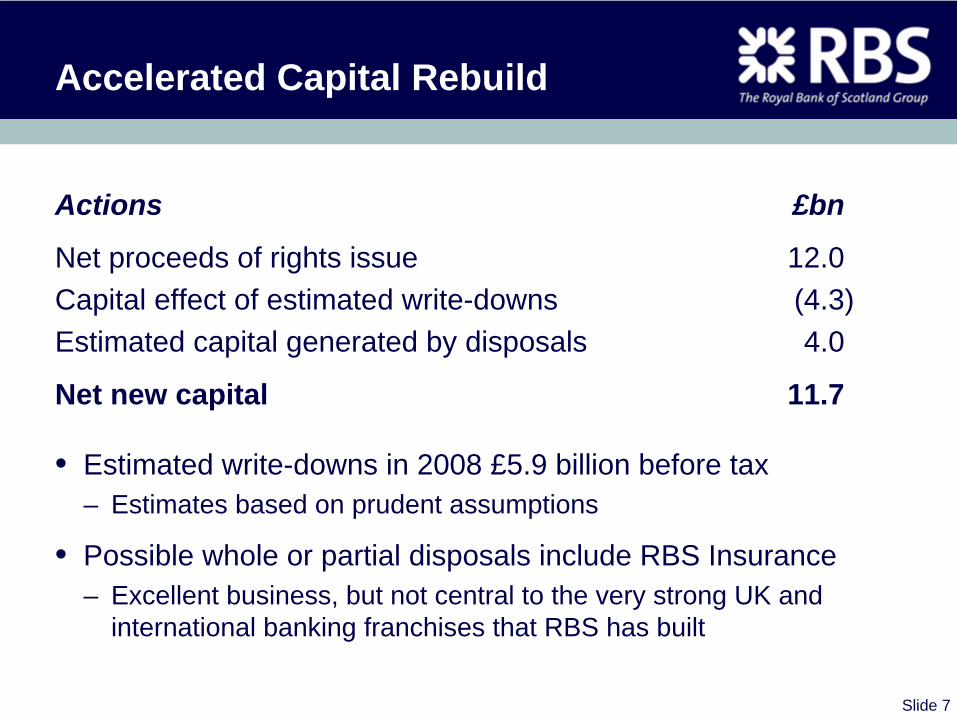
Accelerated Capital Rebuild
Actions £bn
Net proceeds of rights issue 12.0Capital effect of estimated write-downs (4.3)Estimated capital generated by disposals 4.0
Net new capital 11.7
• Estimated write-downs in 2008 £5.9 billion before tax– Estimates based on prudent assumptions
• Possible whole or partial disposals include RBS Insurance – Excellent business, but not central to the very strong UK and
international banking franchises that RBS has built

12 May 2008
Make it happen
Delivering
Slide 9
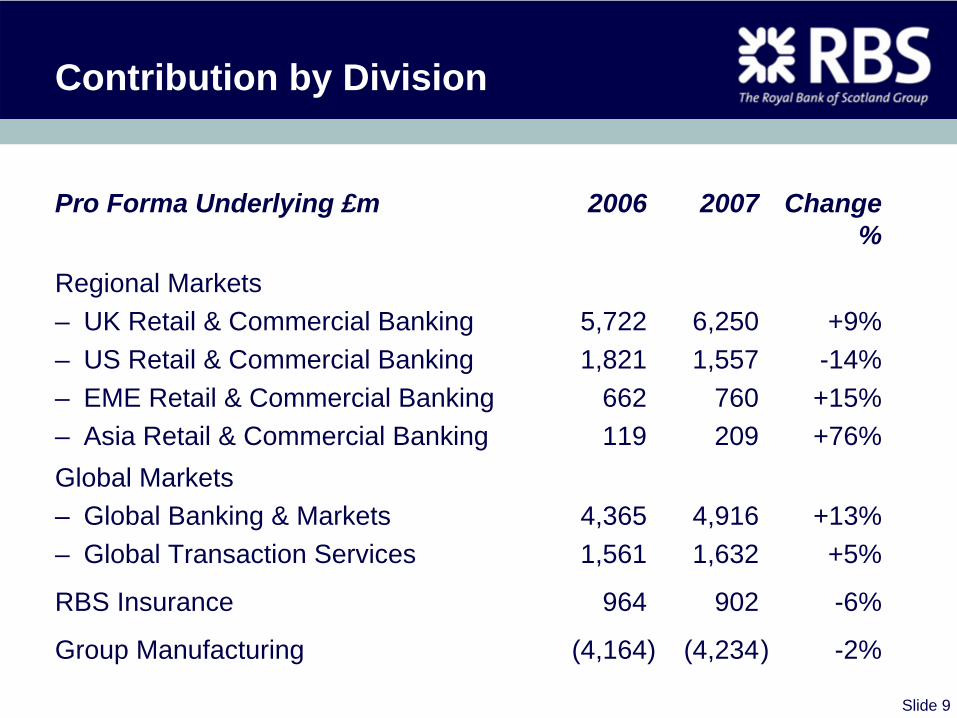
Contribution by Division
Pro Forma Underlying £m 2006 2007 Change %
Regional Markets– UK Retail & Commercial Banking 5,722 6,250 +9%– US Retail & Commercial Banking 1,821 1,557 -14%– EME Retail & Commercial Banking 662 760 +15%– Asia Retail & Commercial Banking 119 209 +76%Global Markets– Global Banking & Markets 4,365 4,916 +13%– Global Transaction Services 1,561 1,632 +5%
RBS Insurance 964 902 -6%
Group Manufacturing (4,164) (4,234) -2%
12 May 2008
Make it happen
Regional Markets
Slide 11
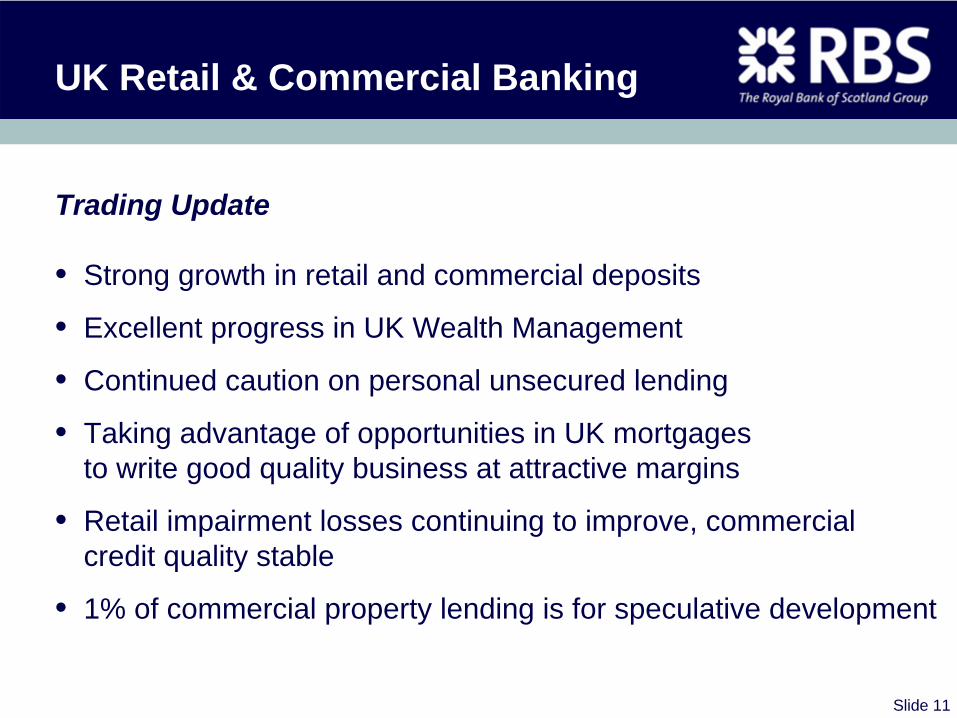
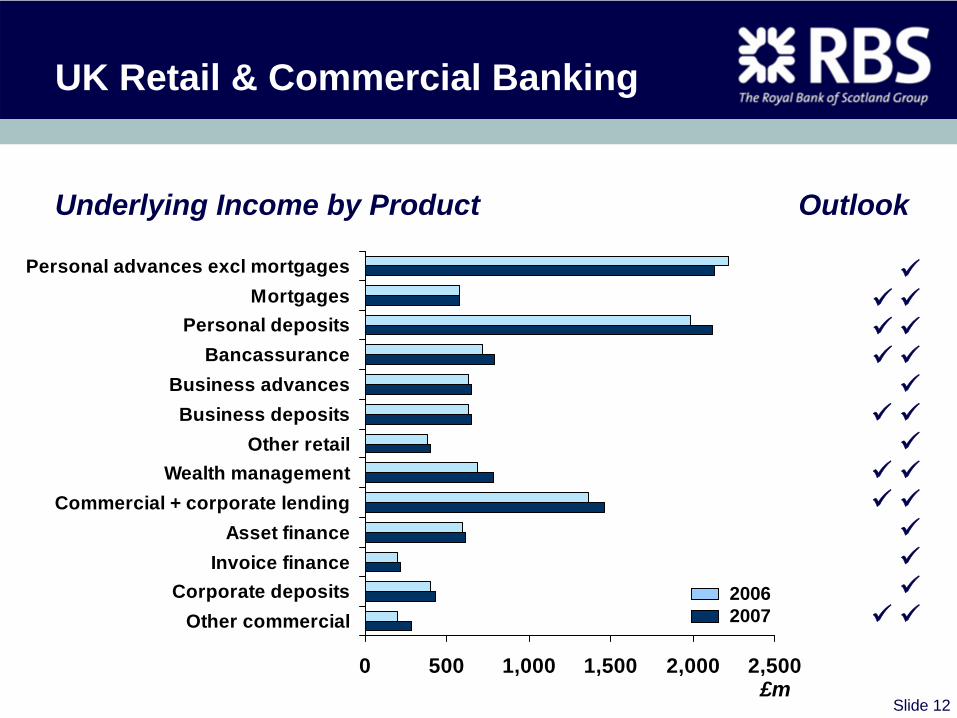
UK Retail & Commercial Banking
Trading Update
• Strong growth in retail and commercial deposits
• Excellent progress in UK Wealth Management
• Continued caution on personal unsecured lending
• Taking advantage of opportunities in UK mortgages to write good quality business at attractive margins
• Retail impairment losses continuing to improve, commercial credit quality stable
• 1% of commercial property lending is for speculative development
Slide 12
UK Retail & Commercial Banking
Underlying Income by Product Outlook
0 500 1,000 1,500 2,000 2,500
Personal advances excl mortgagesMortgages
Personal depositsBancassurance
Business advancesBusiness deposits
Other retailWealth management
Commercial + corporate lendingAsset finance
Invoice financeCorporate deposits
Other commercial
£m
20062007
Slide 13
US Retail & Commercial Banking
Trading Update
• Deposits stable, but pricing competitive
• Continue to diversify business– Good growth in commercial banking, cards and investment
product sales
• Cautious approach to consumer lending
• Positive income growth, good cost discipline
• Credit quality satisfactory, except for specific portfolio in home equity book
Slide 14
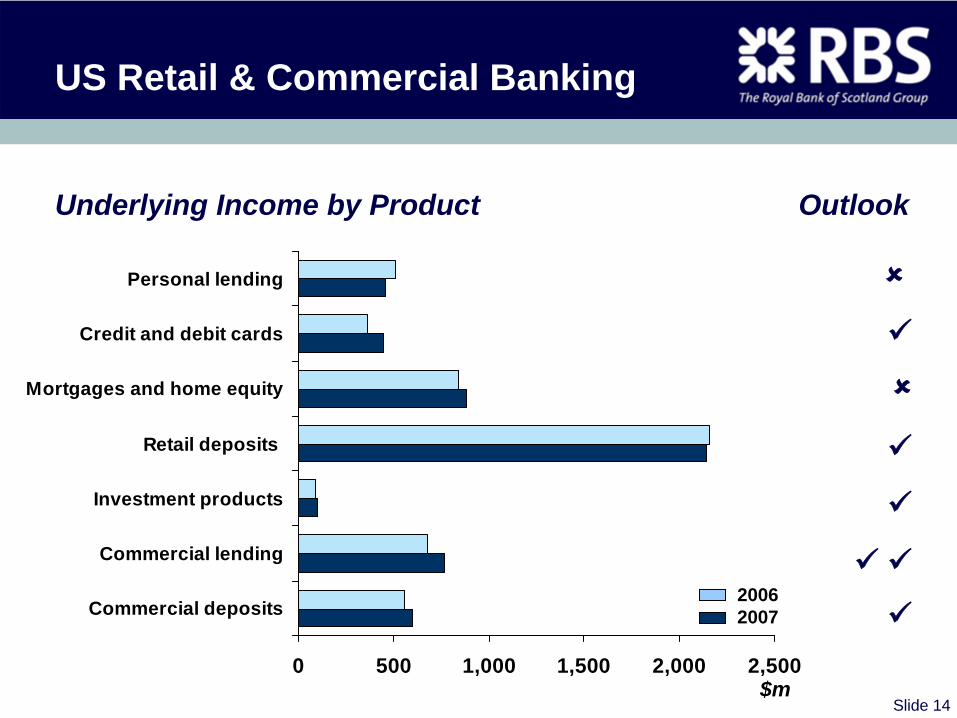
US Retail & Commercial Banking
Underlying Income by Product Outlook
0 500 1,000 1,500 2,000 2,500
Personal lending
Credit and debit cards
Mortgages and home equity
Retail deposits
Investment products
Commercial lending
Commercial deposits
$m
20062007
Slide 15
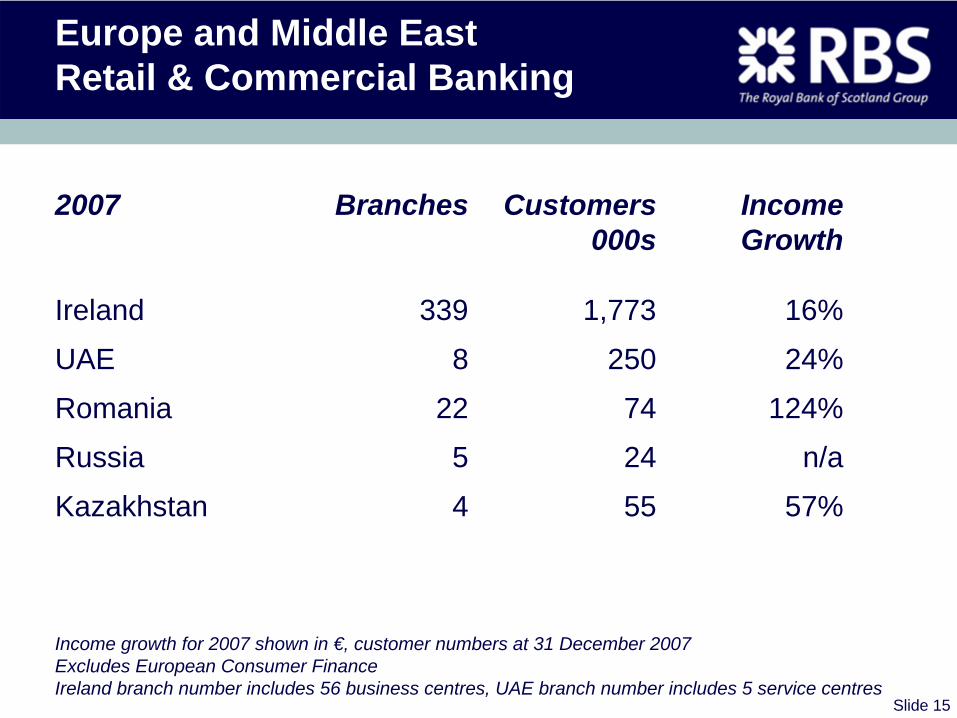
Europe and Middle East Retail & Commercial Banking
2007 Branches Customers Income 000s Growth
Ireland 339 1,773 16%
UAE 8 250 24%
Romania 22 74 124%
Russia 5 24 n/a
Kazakhstan 4 55 57%
Income growth for 2007 shown in €, customer numbers at 31 December 2007 Excludes European Consumer Finance Ireland branch number includes 56 business centres, UAE branch number includes 5 service centres
Slide 16
Europe and Middle East Retail & Commercial Banking
Trading Update
• Good growth in profit
• Income growth in Ulster Bank moderating in line with slower economic growth in Ireland
• Stable credit quality
• Good progress in UAE– Record sales of credit cards and personal loans– Continued strong growth in affluent banking
Slide 17
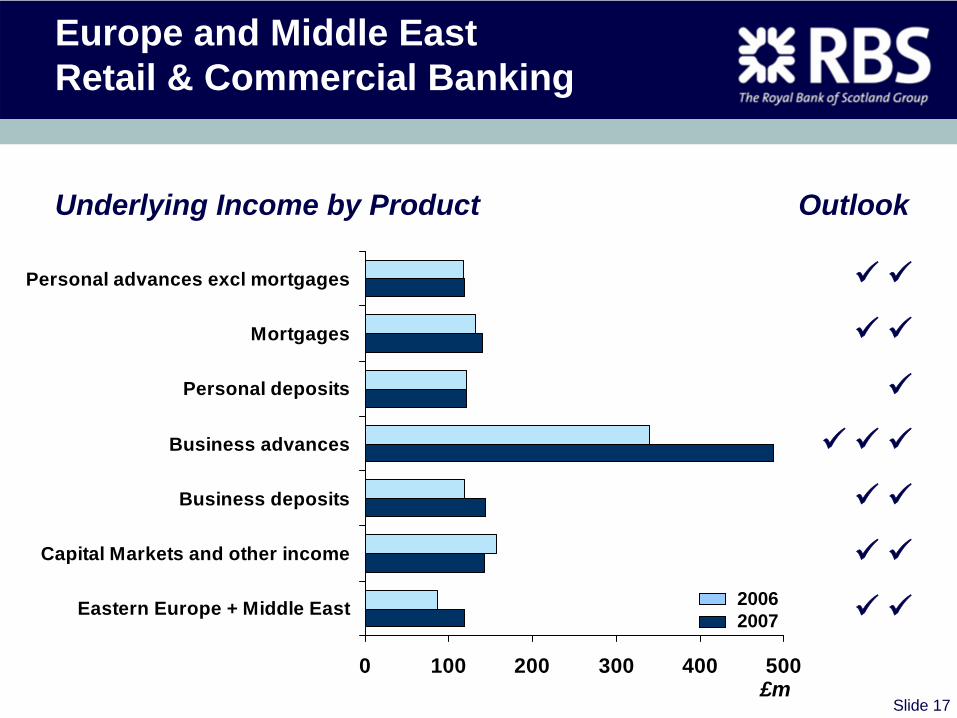
Europe and Middle East Retail & Commercial Banking
Underlying Income by Product Outlook
0 100 200 300 400 500
Personal advances excl mortgages
Mortgages
Personal deposits
Business advances
Business deposits
Capital Markets and other income
Eastern Europe + Middle East
£m
20062007
Slide 18
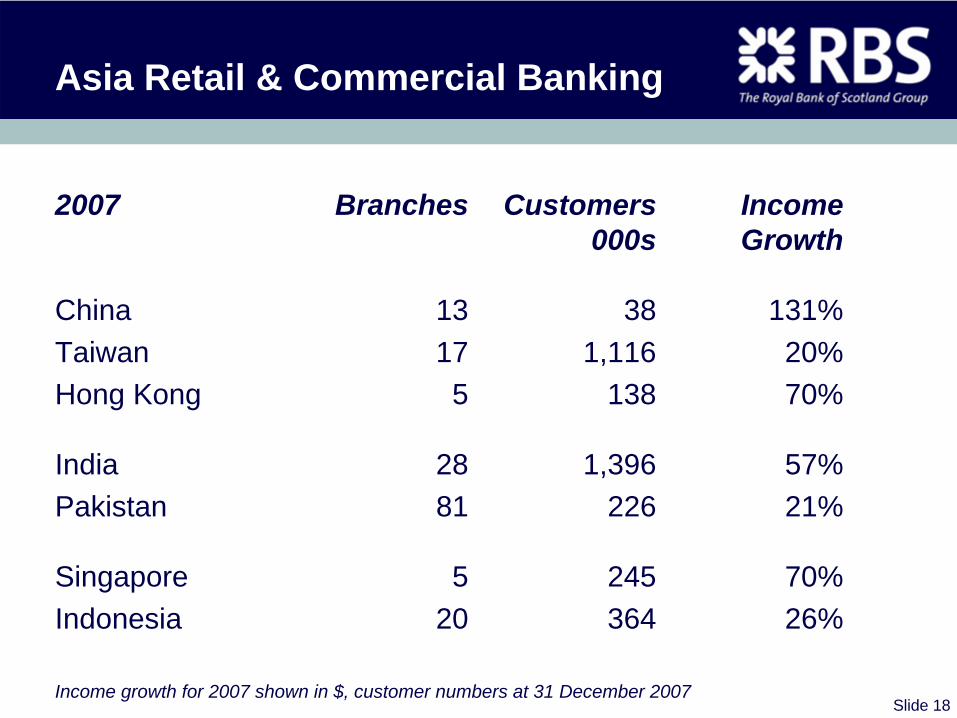
Asia Retail & Commercial Banking
2007 Branches Customers Income 000s Growth
China 13 38 131%Taiwan 17 1,116 20%Hong Kong 5 138 70%
India 28 1,396 57%Pakistan 81 226 21%
Singapore 5 245 70%Indonesia 20 364 26%
Income growth for 2007 shown in $, customer numbers at 31 December 2007
Slide 19
Asia Retail & Commercial Banking
Trading Update
• Strong growth in income and operating profit
• RBS Coutts making excellent progress with strong growth in deposits and assets under management
• Affluent banking business showing strong momentum, with a doubling of client funds in China within the last year
• Continued investment in development of retail and commercial banking franchise across the region
Slide 20
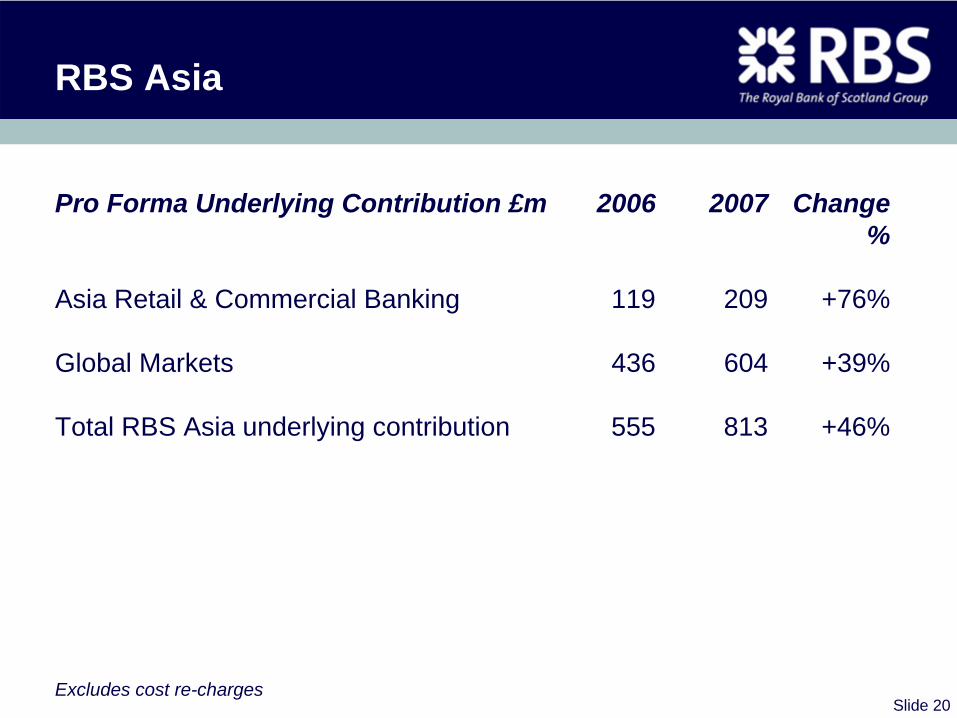
RBS Asia
Pro Forma Underlying Contribution £m 2006 2007 Change %
Asia Retail & Commercial Banking 119 209 +76%
Global Markets 436 604 +39%
Total RBS Asia underlying contribution 555 813 +46%
Excludes cost re-charges

12 May 2008
Make it happen
Global Markets
Slide 22
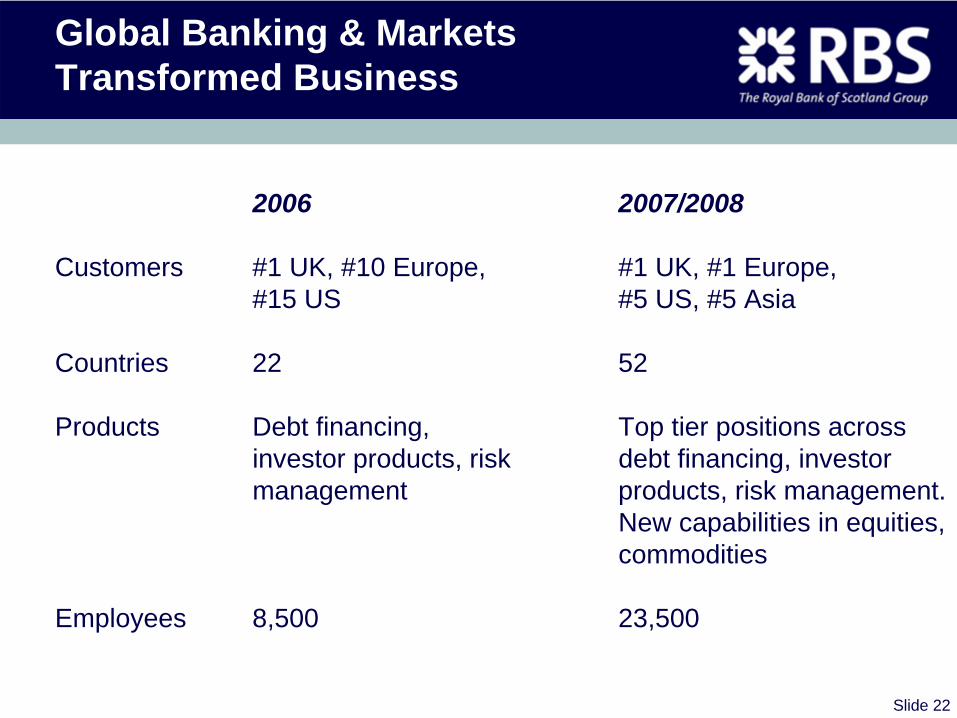
Global Banking & Markets Transformed Business
2006 2007/2008
Customers #1 UK, #10 Europe, #1 UK, #1 Europe, #15 US #5 US, #5 Asia
Countries 22 52
Products Debt financing, Top tier positions across investor products, risk debt financing, investor management products, risk management.
New capabilities in equities, commodities
Employees 8,500 23,500
Slide 23
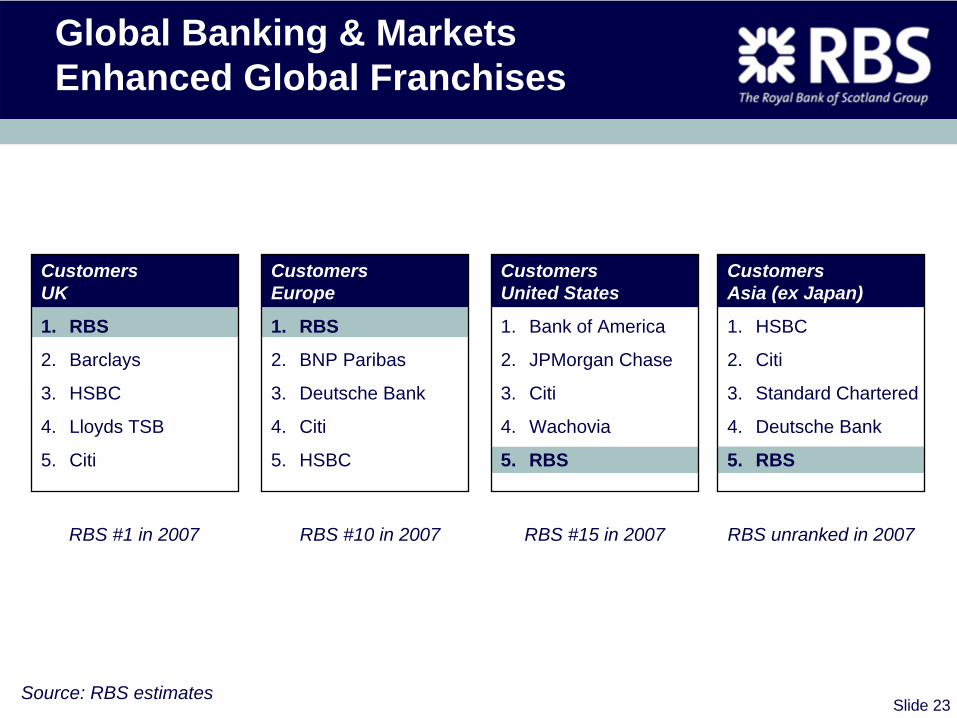
Global Banking & Markets Enhanced Global Franchises
Customers UK
1. RBS
2. Barclays
3. HSBC
4. Lloyds TSB
5. Citi
Customers Asia (ex Japan)
1. HSBC
2. Citi
3. Standard Chartered
4. Deutsche Bank
5. RBS
Customers Europe
1. RBS
2. BNP Paribas
3. Deutsche Bank
4. Citi
5. HSBC
Customers United States
1. Bank of America
2. JPMorgan Chase
3. Citi
4. Wachovia
5. RBS
RBS #1 in 2007 RBS #10 in 2007 RBS #15 in 2007 RBS unranked in 2007
Source: RBS estimates
Slide 24
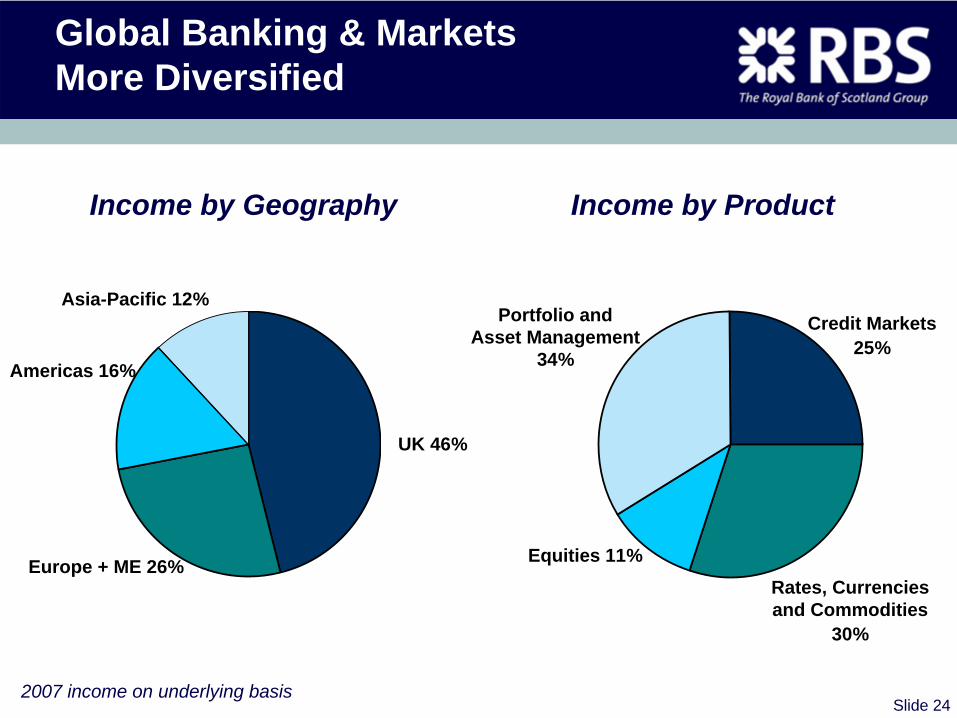
Global Banking & Markets More Diversified
2007 income on underlying basis
Income by Geography Income by Product
Americas 16%
Asia-Pacific 12%
Europe + ME 26%
Portfolio and Asset Management
34%
Equities 11%
Credit Markets25%
UK 46%
Rates, Currencies and Commodities
30%
Slide 25
Global Banking & Markets
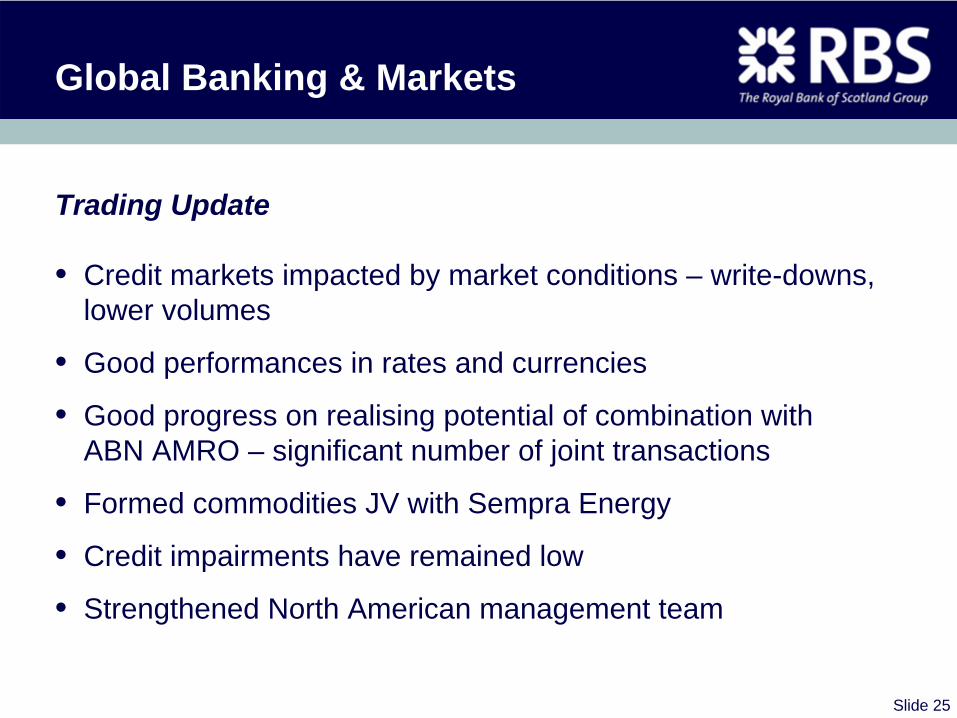
Trading Update
• Credit markets impacted by market conditions – write-downs, lower volumes
• Good performances in rates and currencies
• Good progress on realising potential of combination with ABN AMRO – significant number of joint transactions
• Formed commodities JV with Sempra Energy
• Credit impairments have remained low
• Strengthened North American management team
Slide 26
Global Banking & Markets
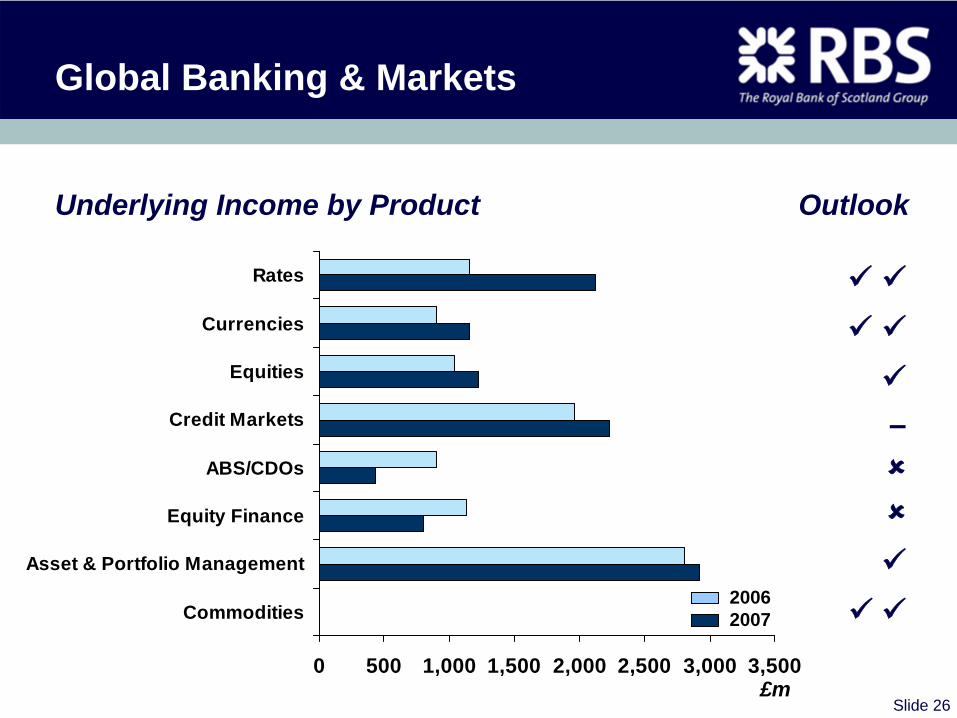
Underlying Income by Product Outlook
0 500 1,000 1,500 2,000 2,500 3,000 3,500
Rates
Currencies
Equities
Credit Markets
ABS/CDOs
Equity Finance
Asset & Portfolio Management
Commodities
£m
20062007
–
Slide 27
Global Transaction Services
Trading Update
• Successful leverage of combined product strengths and customer franchises to win significant new business– International network and infrastructure– Extending and deepening existing relationships– Few global competitors
• Continued expansion of international reach in merchant acquiring
• Good growth in income and profit
• Well controlled expense growth
Slide 28
Global Transaction Services
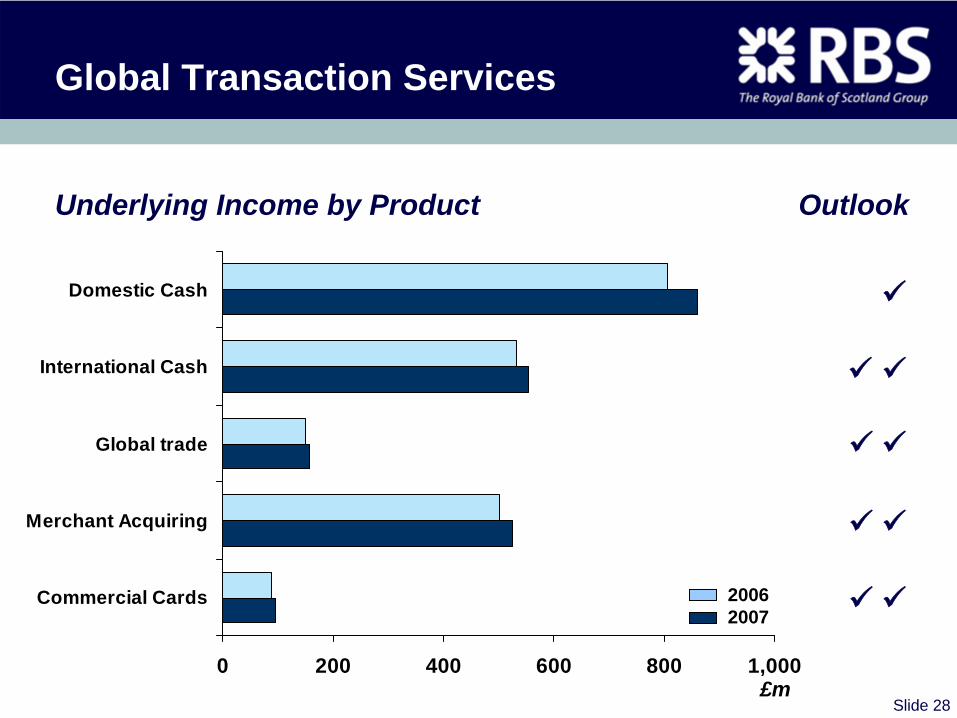
Underlying Income by Product Outlook
0 200 400 600 800 1,000
Domestic Cash
International Cash
Global trade
Merchant Acquiring
Commercial Cards
£m
20062007

12 May 2008
Make it happen
Group Manufacturing
Slide 30
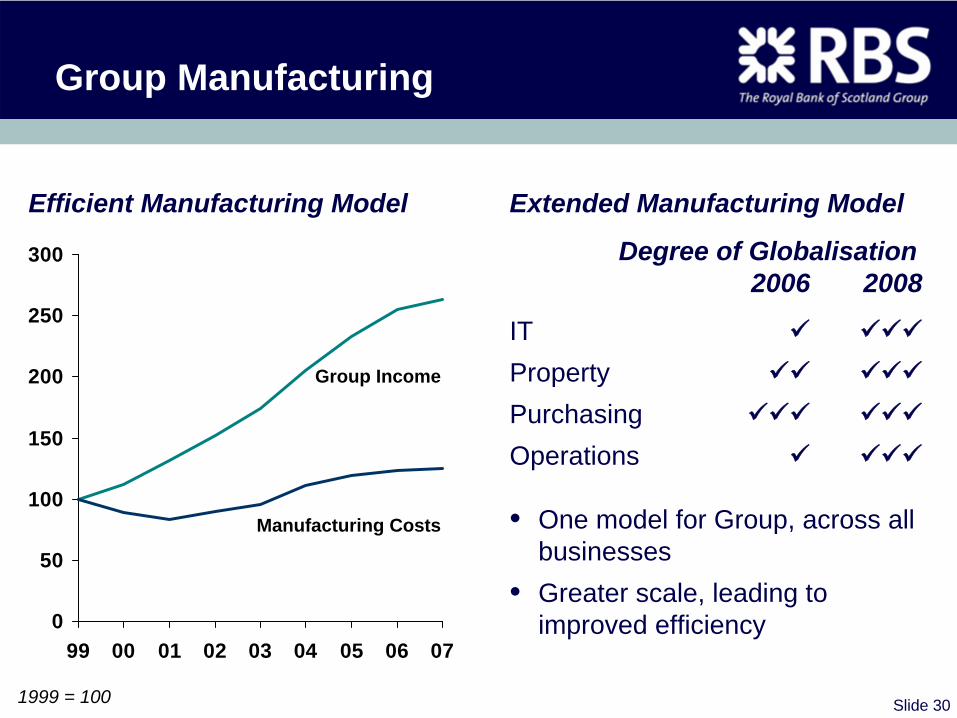
Group Manufacturing
Extended Manufacturing Model
Degree of Globalisation2006 2008
ITPropertyPurchasingOperations
• One model for Group, across all businesses
• Greater scale, leading to improved efficiency0
50
100
150
200
250
300
99 00 01 02 03 04 05 06 07
Manufacturing Costs
Group Income
Efficient Manufacturing Model
1999 = 100
12 May 2008
Make it happen
Transaction Benefits
Slide 32
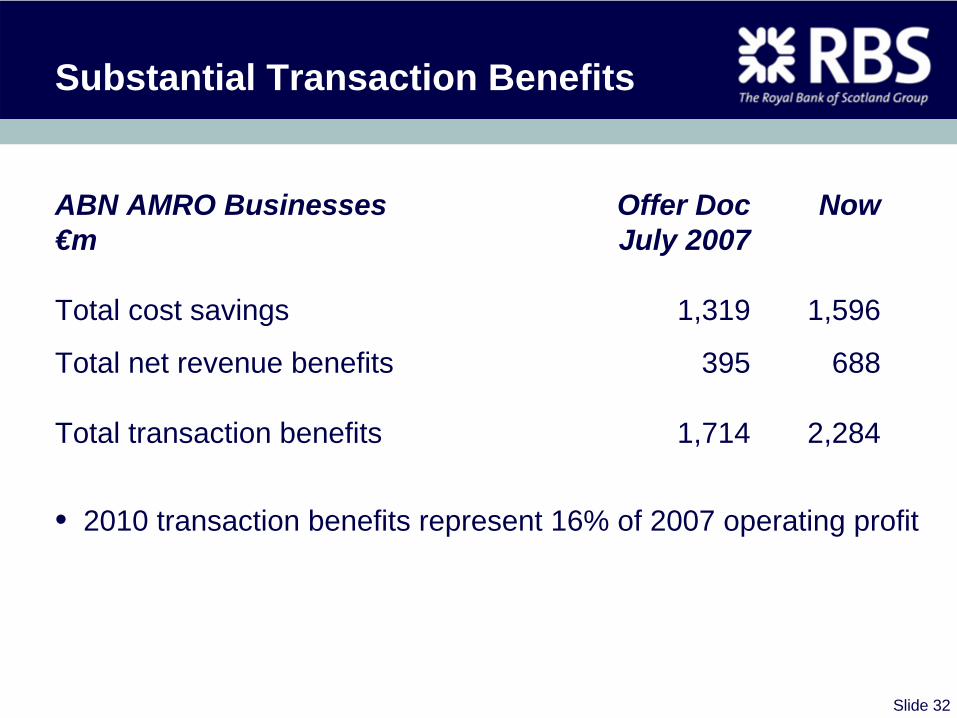
Substantial Transaction Benefits
ABN AMRO Businesses Offer Doc Now€m July 2007
Total cost savings 1,319 1,596
Total net revenue benefits 395 688
Total transaction benefits 1,714 2,284
• 2010 transaction benefits represent 16% of 2007 operating profit
Slide 33
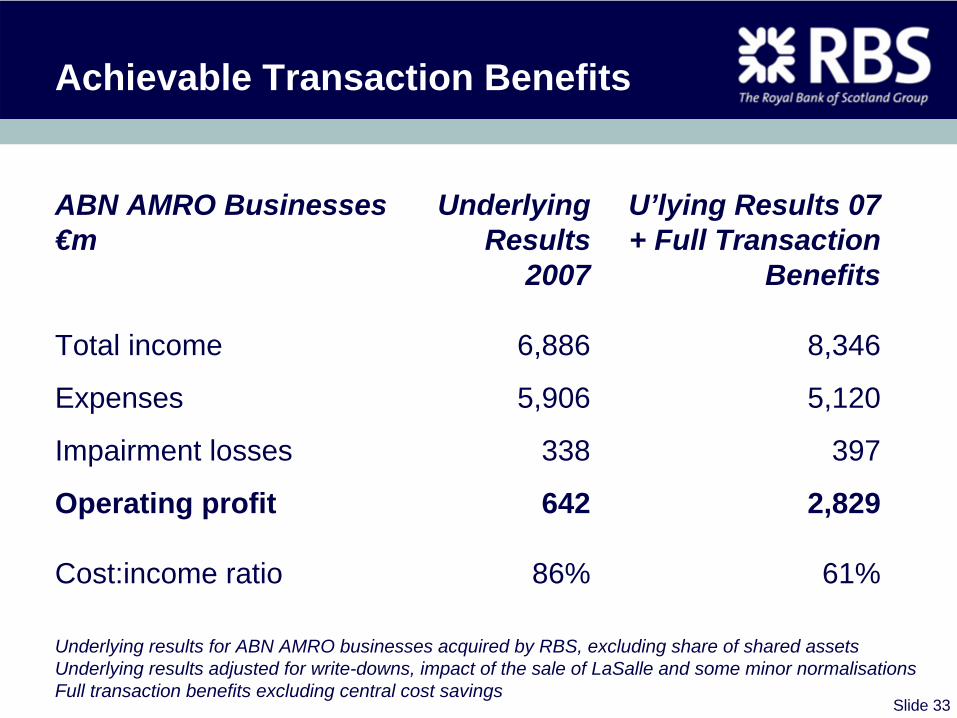
Achievable Transaction Benefits
ABN AMRO Businesses Underlying U’lying Results 07€m Results + Full Transaction
2007 Benefits
Total income 6,886 8,346
Expenses 5,906 5,120
Impairment losses 338 397
Operating profit 642 2,829
Cost:income ratio 86% 61%
Underlying results for ABN AMRO businesses acquired by RBS, excluding share of shared assetsUnderlying results adjusted for write-downs, impact of the sale of LaSalle and some minor normalisationsFull transaction benefits excluding central cost savings

12 May 2008
Make it happen
Conclusion
Slide 35
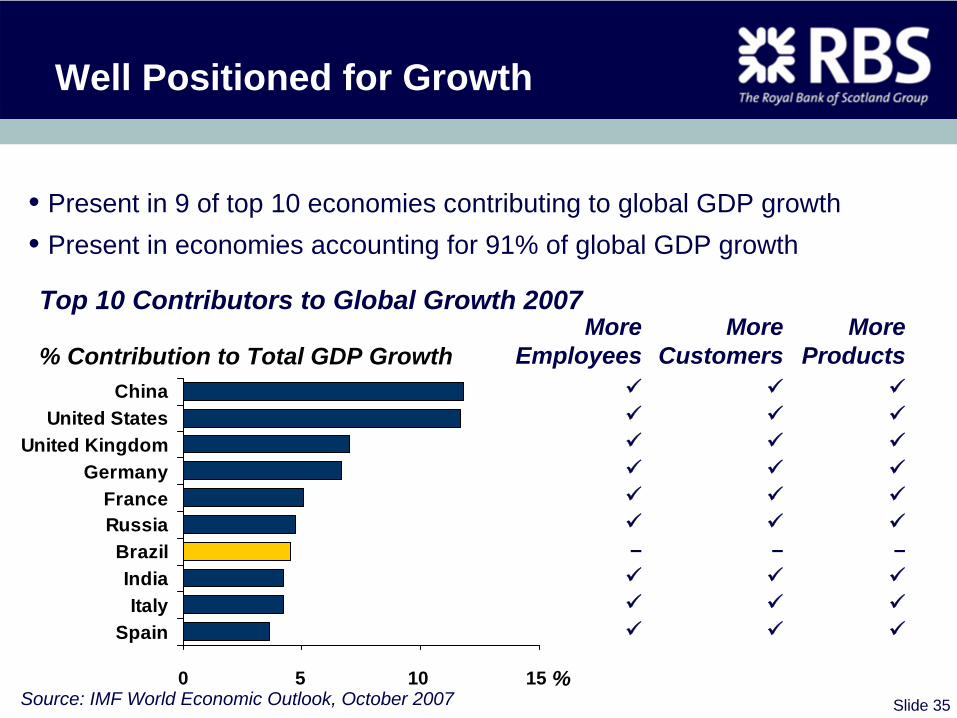
Well Positioned for Growth
ChinaUnited States
United KingdomGermany
FranceRussiaBrazilIndiaItaly
Spain
Top 10 Contributors to Global Growth 2007
% Contribution to Total GDP Growth
%0 5 10 15Source: IMF World Economic Outlook, October 2007
More More MoreEmployees Customers Products
– – –
• Present in 9 of top 10 economies contributing to global GDP growth• Present in economies accounting for 91% of global GDP growth
Slide 36
Well Positioned for Growth
‘Enhanced’
• Diversification
• Customer franchise
• Products
• Distribution channels
• Risk premium

12 May 2008
Make it happen
Delivering While De-LeveringSir Fred Goodwin, Group Chief Executive