Embed Size (px)
Citation preview
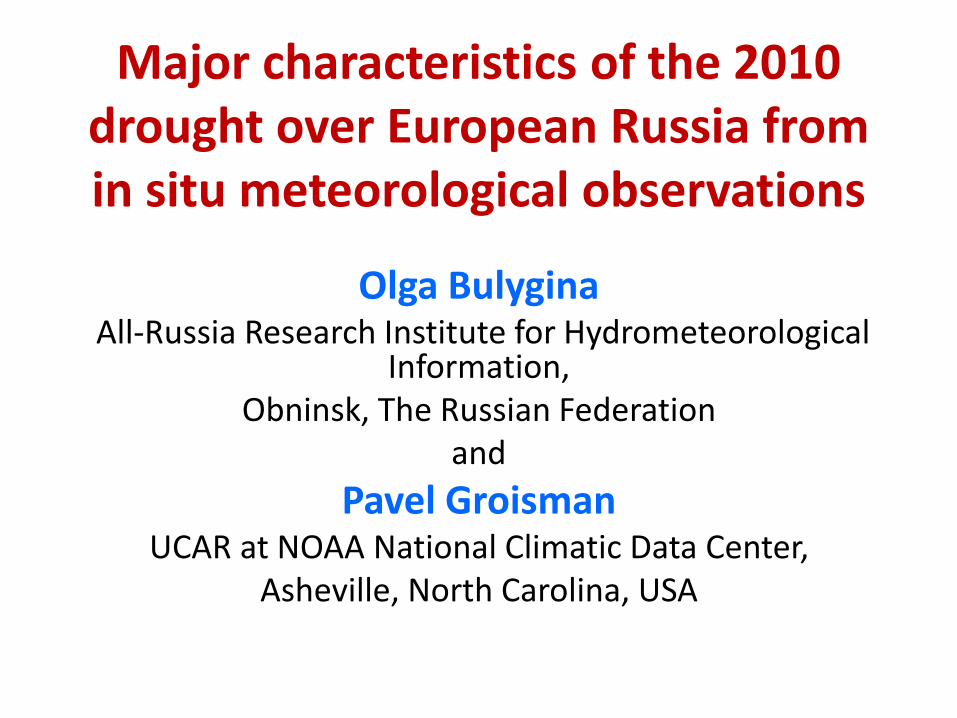
Major characteristics of the 2010 drought over European Russia from in situ meteorological observations
Olga Bulygina All-Russia Research Institute for Hydrometeorological
Information, Obninsk, The Russian Federation
and
Pavel Groisman UCAR at NOAA National Climatic Data Center,
Asheville, North Carolina, USA

Precipitation
Intensity

Oct-Mar Apr-Sep
Beads with a fixed number of stones illustrate how we can have in the same region
simultaneously increases in prolonged Wet Day and Dry Day Periods even with unchanged precipitation totals (design by O.G. Zolina).
Wet days

Nationwide precipitation intensity, I, changes over Russia
dI/dt = 2.3%/10yrs; R² = 0.4612
13
14
15
16
17
18
1965 1970 1975 1980 1985 1990 1995 2000 2005 2010 2015
Mean 5-day (or longer) precipitation intensity, mm (5 days)-1
To receive the nationwide time series, for
each year and each station mean annual
precipitation intensity was calculated as
(totals/number of events). Thereafter,
point estimates were area-averaged
arithmetically within climatological
regions shown in the map and, finally,
these regional mean values were
averaged again with the weights
proportional to the areas of the regions. ,
Russian climatological regions:
Pattern of precipitation intensity
trends over these regions is
shown in the next 2 panels.
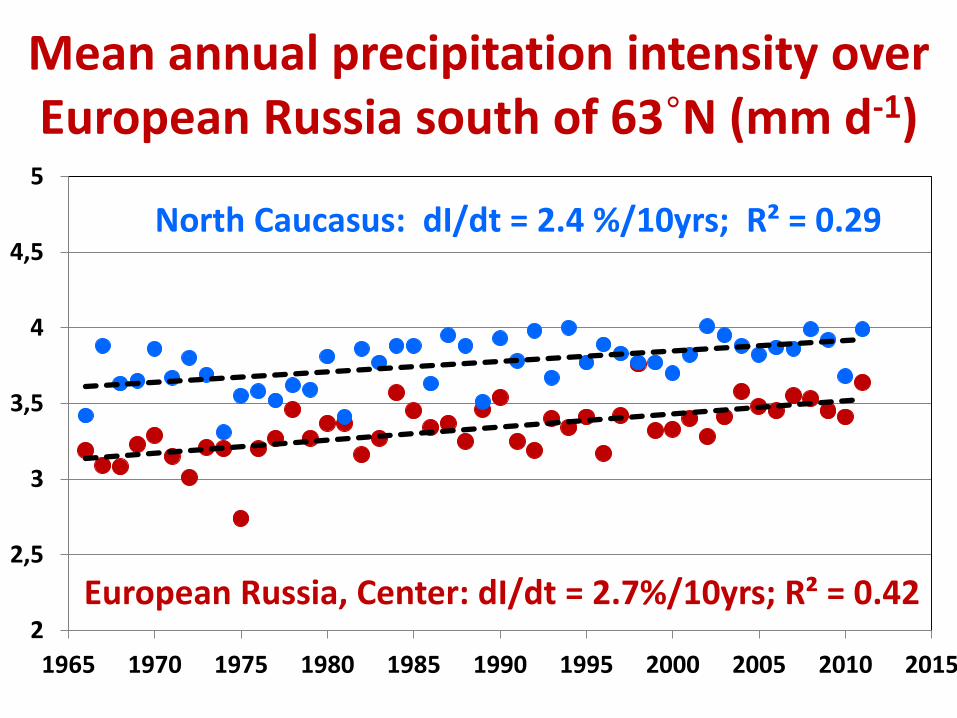
Mean annual precipitation intensity over European Russia south of 63˚N (mm d-1)
European Russia, Center: dI/dt = 2.7%/10yrs; R² = 0.42
North Caucasus: dI/dt = 2.4 %/10yrs; R² = 0.29
2
2,5
3
3,5
4
4,5
5
1965 1970 1975 1980 1985 1990 1995 2000 2005 2010 2015

Mean summer precipitation intensity over European Russia south of 63˚N, mm d-1
dI/dt = 2.7%/10yrs; R² = 0.21 4
4,5
5
5,5
6
6,5
7
1965 1970 1975 1980 1985 1990 1995 2000 2005 2010 2015
European Russia, Center

Warm Season Dryness
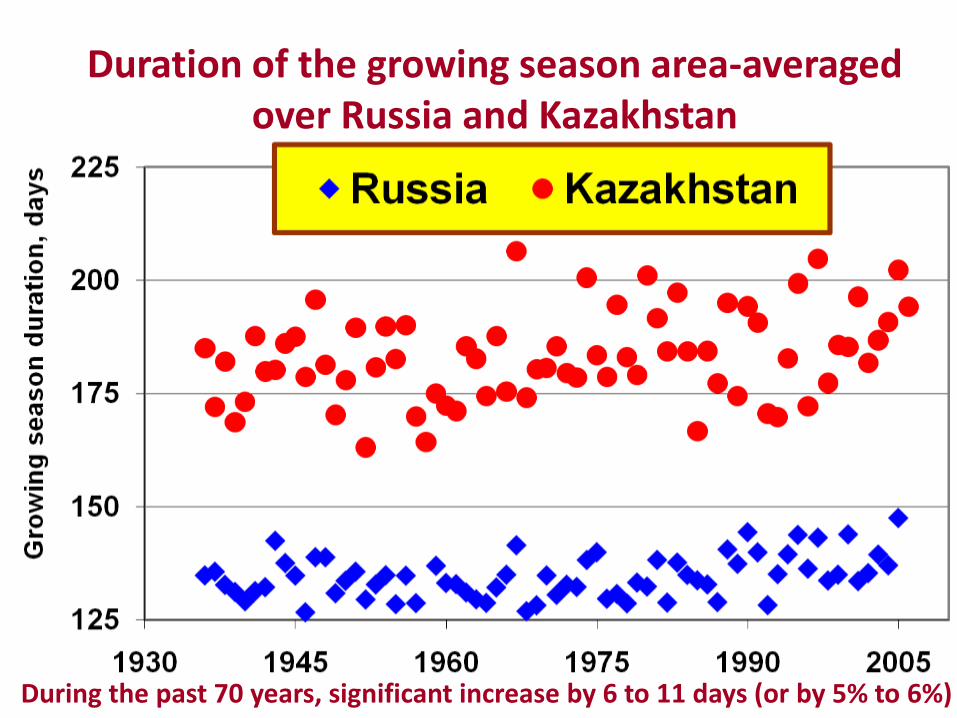
Duration of the growing season area-averaged over Russia and Kazakhstan
During the past 70 years, significant increase by 6 to 11 days (or by 5% to 6%)
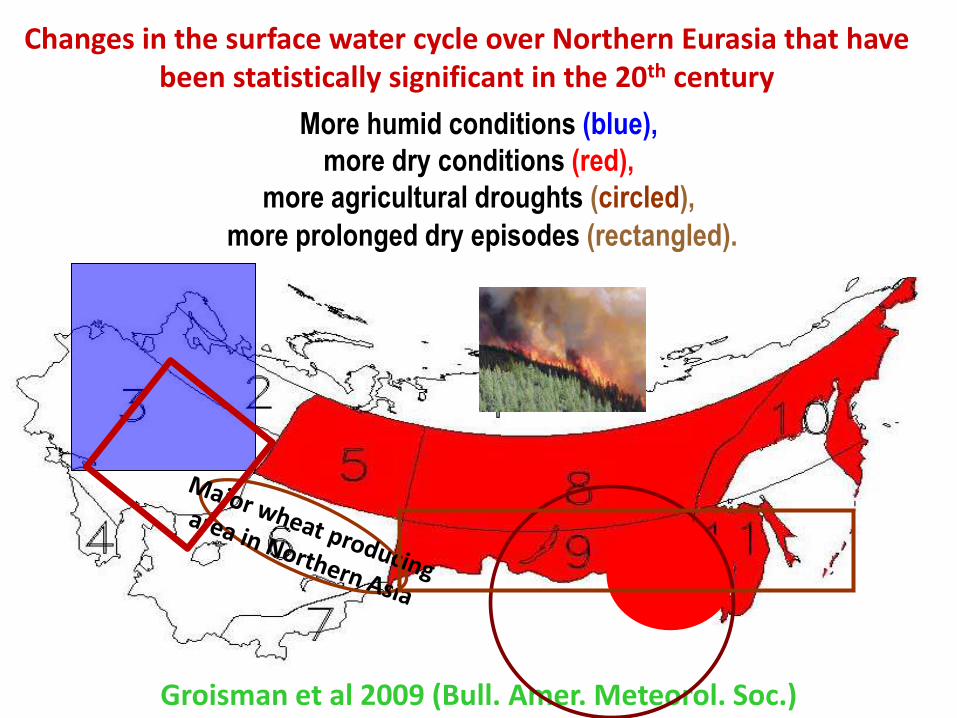
More humid conditions (blue),
more dry conditions (red),
more agricultural droughts (circled),
more prolonged dry episodes (rectangled).
Changes in the surface water cycle over Northern Eurasia that have been statistically significant in the 20th century
Groisman et al 2009 (Bull. Amer. Meteorol. Soc.)

DYNAMICS OF FIRES NUMBERS AND BURNED AREA (PROTECTED TERRITORY OF RUSSIA)
Korovin and Zukkert 2003, updated
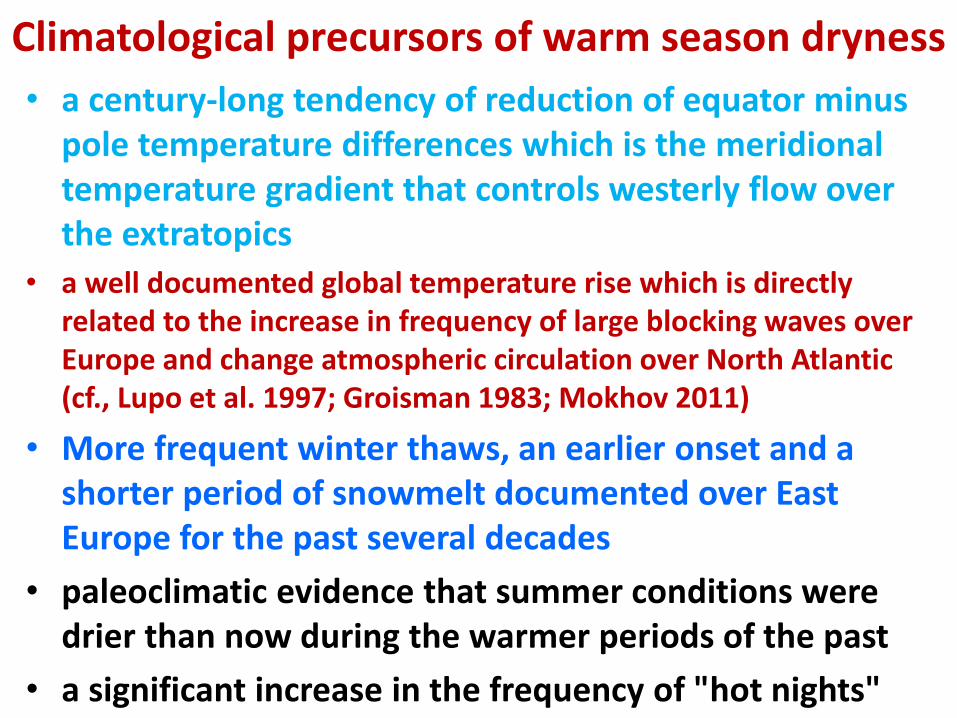
Climatological precursors of warm season dryness
• a century-long tendency of reduction of equator minus pole temperature differences which is the meridional temperature gradient that controls westerly flow over the extratopics
• a well documented global temperature rise which is directly related to the increase in frequency of large blocking waves over Europe and change atmospheric circulation over North Atlantic (cf., Lupo et al. 1997; Groisman 1983; Mokhov 2011)
• More frequent winter thaws, an earlier onset and a shorter period of snowmelt documented over East Europe for the past several decades
• paleoclimatic evidence that summer conditions were drier than now during the warmer periods of the past
• a significant increase in the frequency of "hot nights"

Background.
What was observed in 2010 over
European Russia in comparison to
the previous decades

In 2010, for European Russia: • all weather anomalies described in Letopisi for 1092
were repeated,
• in the 130-yr period of instrumental observations, the July-August mean regional temperature was 2°C above the record value of the previous extreme year (infamous 1972),
• in many locations across European Russia absolute temperature records were exceeded, and
• dramatic thresholds such as “hot nights” were first reported as far north as at 60°N in St. Petersburg.
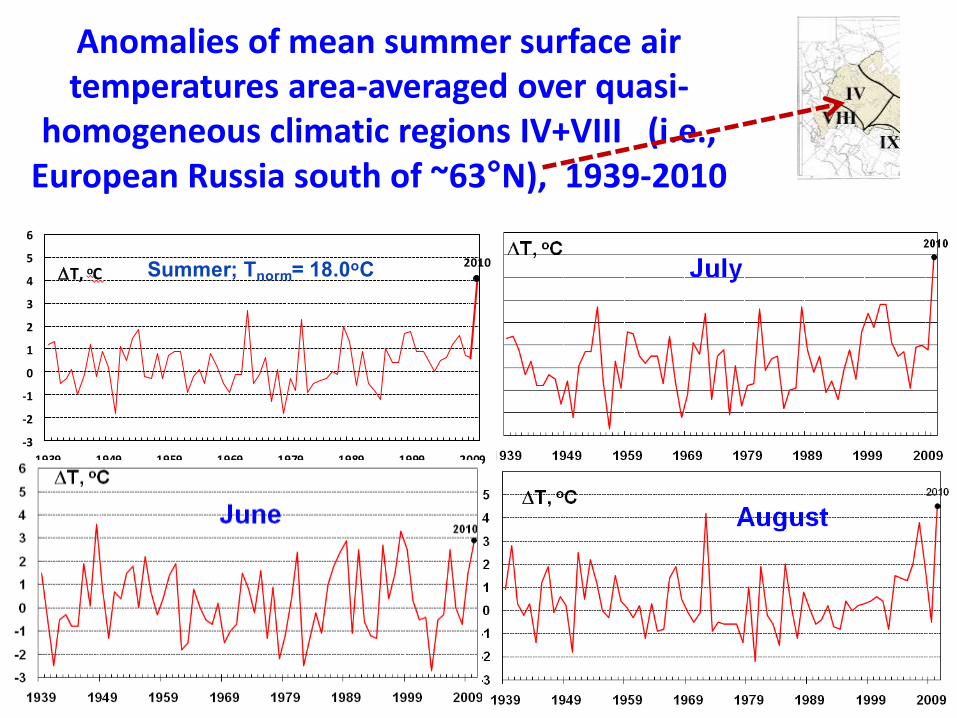
Anomalies of mean summer surface air temperatures area-averaged over quasi-
homogeneous climatic regions IV+VIII (i.e., European Russia south of ~63°N), 1939-2010
2010
-3
-2
-1
0
1
2
3
4
5
6
1939 1949 1959 1969 1979 1989 1999 2009
DT, oC Summer; Тnorm= 18.0оС

Pattern of the surface air temperature
anomalies in summer 2010, °C
Deviations from the 1961-1990 long term mean values
June July August

Moscow mean and maximum surface air
temperatures throughout summer 2010
Absolute
daily record
values
June July
July August
T, °C
days
T, °C
days
Above long-
term mean
values

“Hot nights” with Tmin above 75°F (≥23.9°C) in 2010
Saint-Petersburg. For the first
time since 1881, Tmin exceeded
23.9° C (14, 16, 29 July 2010).
Moscow. For the first time, Tmin exceeded 23.9° C (28 and 29 July, 4 August 2010).
- Blue dots: locations with at least one “hot night”
- Red dots: locations where the number of hot nights was more
that in any previous year during the period of observations

Precipitation anomalies in summer 2010 (% of long-term mean values for the 1961-1990 period)
At the end of July drought emergency was declared in 24 Administrative
Regions (oblast’) of Russia. Numerous sources of fire were identified
across European Russia. Situation was particularly difficult in the
Nizhniy Novgorod, Ryazan and Moscow Regions, where forest fires were
accompanied by fire in peat bogs. Fire completely consumed several
villages, thousands of people were made homeless.

Millennium time scale
• Changes in the hydrological and energy cycles prior to 2010
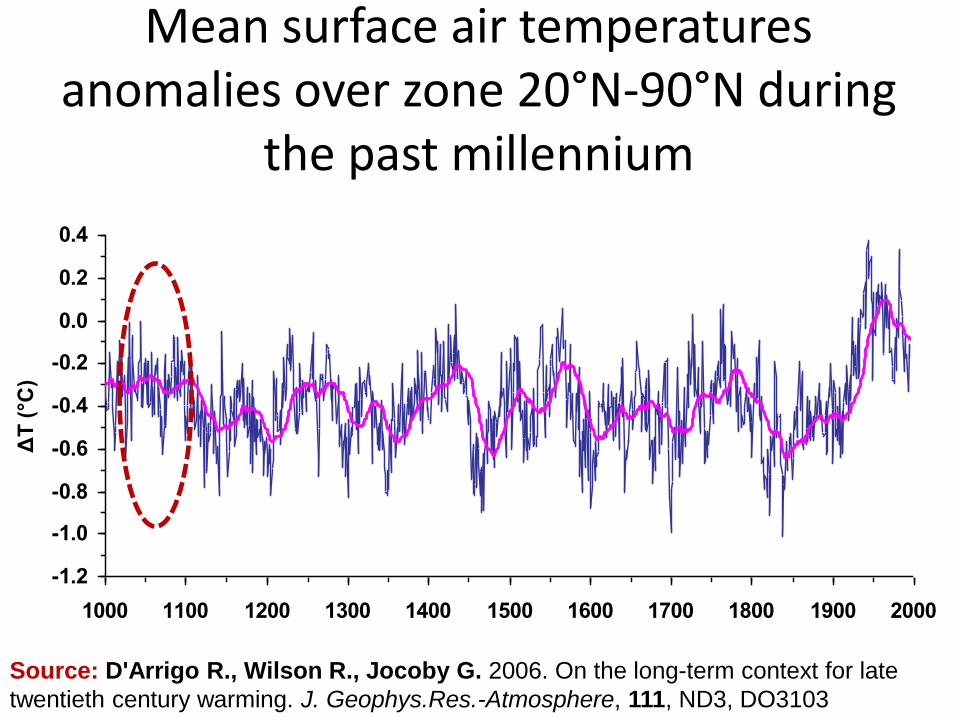
Mean surface air temperatures anomalies over zone 20°N-90°N during
the past millennium
-1.2
-1.0
-0.8
-0.6
-0.4
-0.2
0.0
0.2
0.4
1000 1100 1200 1300 1400 1500 1600 1700 1800 1900 2000
Годы
ΔT
(°C
)
Source: D'Arrigo R., Wilson R., Jocoby G. 2006. On the long-term context for late
twentieth century warming. J. Geophys.Res.-Atmosphere, 111, ND3, DO3103
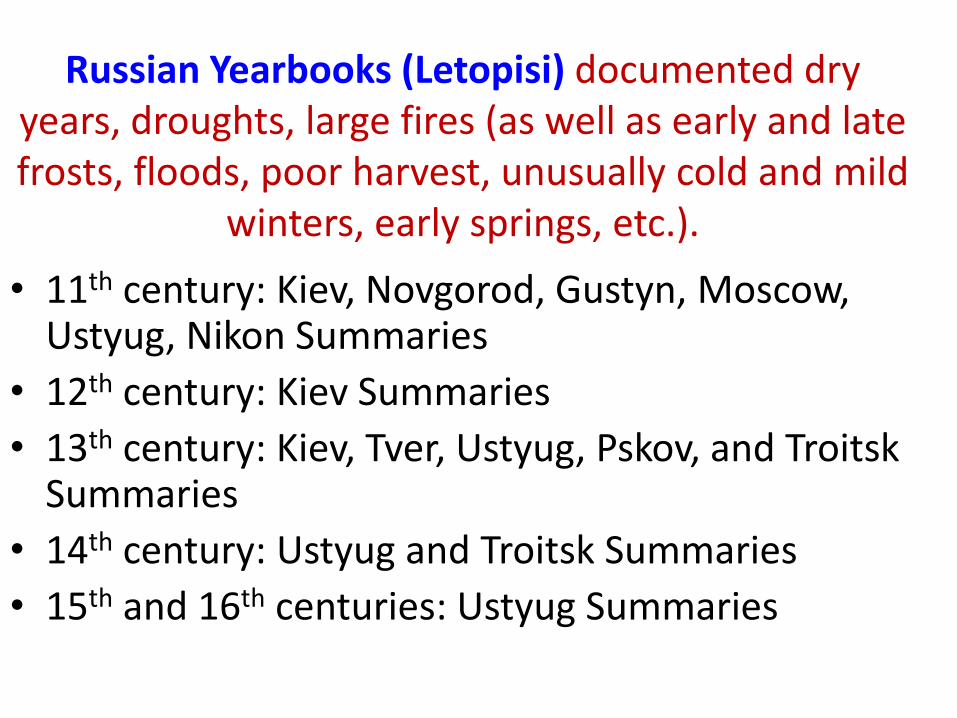
Russian Yearbooks (Letopisi) documented dry years, droughts, large fires (as well as early and late frosts, floods, poor harvest, unusually cold and mild
winters, early springs, etc.).
• 11th century: Kiev, Novgorod, Gustyn, Moscow, Ustyug, Nikon Summaries
• 12th century: Kiev Summaries
• 13th century: Kiev, Tver, Ustyug, Pskov, and Troitsk Summaries
• 14th century: Ustyug and Troitsk Summaries
• 15th and 16th centuries: Ustyug Summaries
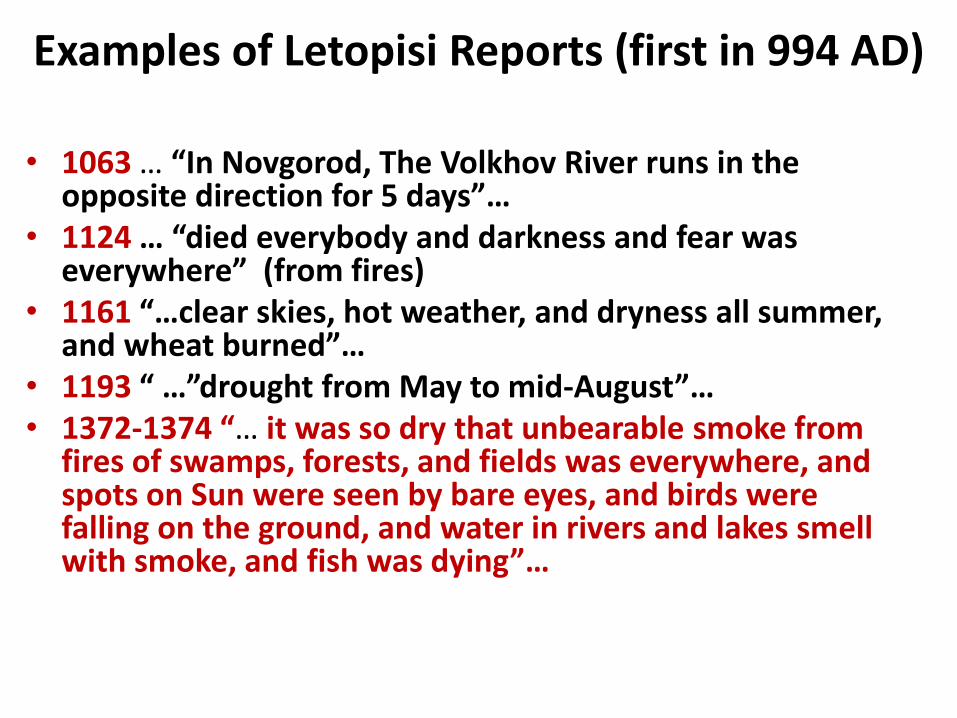
Examples of Letopisi Reports (first in 994 AD)
• 1063 … “In Novgorod, The Volkhov River runs in the opposite direction for 5 days”…
• 1124 … “died everybody and darkness and fear was everywhere” (from fires)
• 1161 “…clear skies, hot weather, and dryness all summer, and wheat burned”…
• 1193 “ …”drought from May to mid-August”… • 1372-1374 “… it was so dry that unbearable smoke from
fires of swamps, forests, and fields was everywhere, and spots on Sun were seen by bare eyes, and birds were falling on the ground, and water in rivers and lakes smell with smoke, and fish was dying”…

Generally, over Kiev Rus’ (the area of present northern Ukraine, Belarus, and central part of European Russia), in the 11th century summers were mostly warm and dry. However, on this background, the 1092 summer was extremely dry.
Letopisi witness: • Clear skies throughout the entire summer
• Prolonged period without rainfall
• Extremely hot weather
• Widespread naturally caused forest fires
• Naturally caused peat bog fires (let us recall that at that time wetlands were undisturbed which is opposite to the present state of the affairs)
• Fields & pasture were “fired out” => land cover dried out
• In Kiev, in the following autumn and winter more than 7 thousand (of total 50,000) died from starvation. Losses beyond the capital city were (in percent) even higher.
• This unfortunate development was followed with widespread epidemics (of undefined type).
• In Moscow: “Huge circle was in the sky in this summer, a drought was so strong that soil was burned and many forest and swamps were set in fire themselves”
Century time scale
• Changes in the hydrological and energy cycles prior to 2010

-0,4
-0,2
0
0,2
0,4
0,6
0,8
1
1955 1960 1965 1970 1975 1980 1985 1990 1995 2000 2005 2010 2015
Global Surface Air Temperature Anomalies, °C
Rates of increase of
annual temperature
for the “globe” (60S
to 90N) and
Northern Eurasia are
0.91 C/130 yr and
1.5C/130yr
respectively. (Lugina
et al 2007, updated).
2010
-3,5
-2,5
-1,5
-0,5
0,5
1,5
2,5
3,5
1880 1895 1910 1925 1940 1955 1970 1985 2000 2015
Tem
pe
ratu
re a
no
mali
es,
°C
Years
"globe" Northern Eurasia, north of 40N
Annual
temperature

Annual surface air temperature anomalies (C) area-
averaged over the 60°N - 90°N latitudinal zone (Arctic)
Linear trend for the entire period of instrumental observations is
1.79C/131 years but there were periods (e.g., 1936-2004) when there was
no statistically significant linear trend (Groisman et al. 2006, updated).
2011
Anomalies were calculated from the mean values for the 1951-1975 reference period.
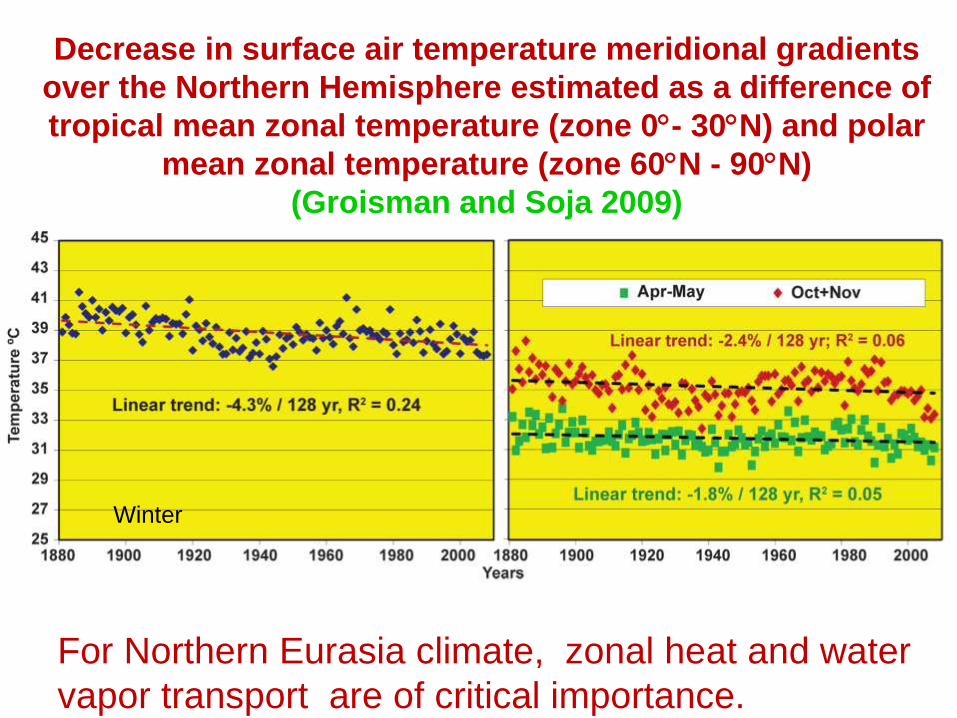
Decrease in surface air temperature meridional gradients
over the Northern Hemisphere estimated as a difference of
tropical mean zonal temperature (zone 0- 30N) and polar
mean zonal temperature (zone 60N - 90N)
(Groisman and Soja 2009)
For Northern Eurasia climate, zonal heat and water
vapor transport are of critical importance.
Winter

Northern Hemisphere sea ice extent as of mid-September 2011
Archive of the US National Snow and Ice Data Center (http://www.nsidc.org/data/seaice_index/index.html)
September 1979–2011 anomalies, %

April snow cover extent anomalies over Eurasia
Snow cover extent from NOAA satellites for 1967-2012. NOAA NCDC 2011:
State of the Climate Global Analysis April 2011. [ Available at
http://www.ncdc.noaa.gov/sotc/service/global/snowcover-eurasia/201204.gif]

Monthly rainfall anomalies in the summer months of 2010 over European Russia
Annual precipitation. Linear trends for the 1936-
2000 period, mm yr-1, Bogdanova et al. 2009).
Upper layer soil
moisture changes over
European Russia south
of 60°N during the
warm season
(Speranskaya 2009).
and again:

Annual and winter number of days with thaw over European Russia south of 60°N
dD/dt = 6.5 days/50yrs; R² = 0.18
dD/dt = 11 days/50yrs; R² = 0.35
0
10
20
30
40
50
60
1949 1959 1969 1979 1989 1999 2009
Days with thaw are defined as the days when the mean daily temperature is above -2°C while snow on the ground is above 5 cm.

-70
-60
-50
-40
-30
-20
-10
0
10
20
30
1945
1948
1951
1954
1957
1960
1963
1966
1969
1972
1975
1978
1981
1984
1987
1990
1993
1996
1999
2002
2005
2008
дни
Anomalies (days) of the spring dates of daily surface
air temperature transition through 0°С from the
mean long-term values in central Belarus
Elena V. Komarovskaya, 2009; Personal
communication
Two months earlier!!!

Dates when vegetation season starts, Julian day in European Russia south of 60°N
dD/dt = -8.6 d/120yr; R² = 0.12
80
90
100
110
120
130
140
150
160
1890 1900 1910 1920 1930 1940 1950 1960 1970 1980 1990 2000 2010

Anomalies from the mean for the 1961-1990 period were used for area-averaging with the following restoration of actual values; GHCN-v2 data (NCDC 2010)
16
17
18
19
20
21
22
23
24
25
1880 1893 1906 1919 1932 1945 1958 1971 1984 1997 2010
1938
July-August surface air temperatures,
over European Russia south of 60°N, °C
1972
July-August surface air temperature (°C) area-
averaged over European Russia south of 60°N (Lugina et al 2006, updated)
2010

Dry episodes above 30 days during the warm season
over European Russia, south of 60ºN, 1951-2010
1972
0
2
4
6
8
10
12
14
16
18
20
1950 1955 1960 1965 1970 1975 1980 1985 1990 1995 2000 2005 2010
dN/dt =0.6 days/10yr; R2 =0.08
2002
1972
2010
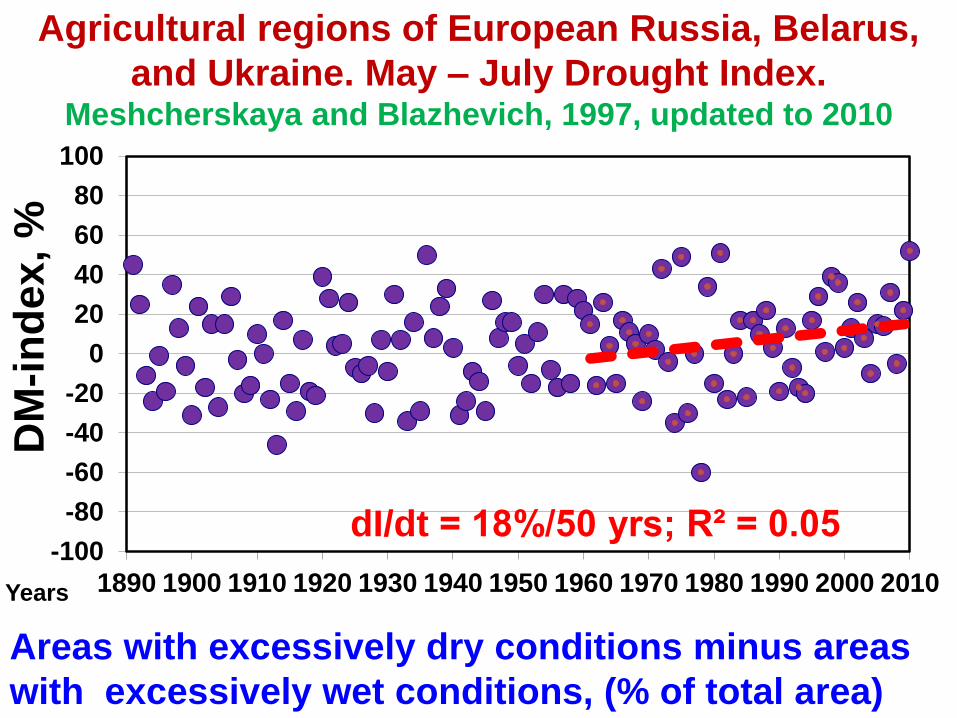
Areas with excessively dry conditions minus areas
with excessively wet conditions, (% of total area)
Agricultural regions of European Russia, Belarus,
and Ukraine. May – July Drought Index. Meshcherskaya and Blazhevich, 1997, updated to 2010
dI/dt = 18%/50 yrs; R² = 0.05 -100
-80
-60
-40
-20
0
20
40
60
80
100
1890 1900 1910 1920 1930 1940 1950 1960 1970 1980 1990 2000 2010
DM
-in
dex
, %
Years
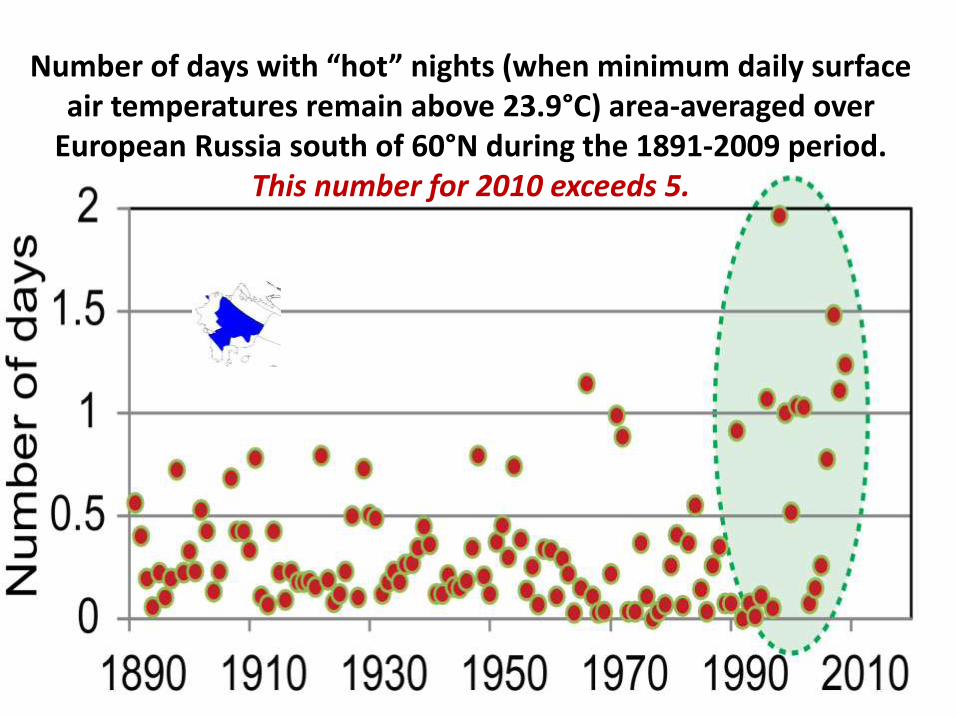
Number of days with “hot” nights (when minimum daily surface air temperatures remain above 23.9°C) area-averaged over
European Russia south of 60°N during the 1891-2009 period. This number for 2010 exceeds 5.

Summary

General Statement
• Numerous observational studies show that in the past several decades precipitation has become more intense over most of the extra-tropics.
• At the same time, (and often in the same regions) precipitation events may occur less frequently or come in sequences of prolonged no-rain and wet periods.
• European Russia is one of these regions.

We observe an increase in precipitation and soil moisture over European Russia during the
past 50 years, but… • Areas affected by agricultural droughts are
increasing in the last decades • Frequency of occurrence of prolonged (≥30 days) no-
rain periods is increasing, and • Number of days with “very hot” nights with
minimum temperatures ≥ 23.9°C became disproportionally large in the past decade (these days closely correlate with an increased mortality of unprotected population)