Embed Size (px)
Citation preview
geosciences
Article
Magnetotelluric-Geochemistry Investigations ofBlawan Geothermal Field, East Java, Indonesia
Sukir Maryanto 1,2,*, Cinantya N. Dewi 1, Vanisa Syahra 1,2, Arief Rachmansyah 3,James H. Foster 4, Ahmad Nadhir 1,2 and Didik R. Santoso 1,2
1 Department of Physics, Faculty of Sciences, Universitas Brawijaya, Veteran Street,Malang 65145, Indonesia; [email protected] (C.N.D.); [email protected] (V.S.);[email protected] (A.N.); [email protected] (D.R.S.)
2 Center of Energy and Natural Resources, Institute of Research and Community Services,Universitas Brawijaya, Veteran Street, Malang 65145, Indonesia
3 Department of Civil Engineering, Faculty of Engineering, Universitas Brawijaya, MT Haryono Street,Malang 65145, Indonesia; [email protected]
4 Hawaii Institute of Geophysics and Planetary, University of Hawaii, 1680 East-West Road, Pacific OceanScience & Technology (POST) Building, Room 602 Honolulu, HI 96822, USA; [email protected]
* Correspondence: [email protected]; Tel.: +62-813-211-57868
Academic Editors: Maurizio Barbieri and Jesús Martínez FríasReceived: 26 March 2017; Accepted: 24 May 2017; Published: 10 June 2017
Abstract: An integrated magnetotelluric (MT) and geochemical study of the Blawan geothermal fieldhas been performed. The character of the hot springs, the reservoir temperature, and geothermalreserve potential of Blawan geothermal field are assessed. MT measurements, with 250 m up to1200 m spacings, were made at 19 sites, and 6 locations at the Blawan hot springs have been sampledfor geochemical survey. The results of 2D modelling indicated that the geothermal system in theresearch area consisted of a cap rock zone (≤32 Ω·m), reservoir zone (>32 – ≤512 Ω·m), and heatsource zone (>512 Ω·m), and also identified faults. The characteristics of the hot spring water wereidentified through analyzing the major and minor elements. A ternary diagram (Cl-SO4-HCO3)showed that the Blawan hot springs consist of bicarbonate water (at locations of AP-01, AP-02,AP-03) and chloride water (at locations of AP-04, AP-05, and AP-06), with a reservoir temperature ofapproximately 90 C based on the Na–K–Ca geothermometer results. An estimate of the geothermalenergy using the volumetric method, gave a total geothermal reserve potential of 1.823 MWe.
Keywords: magnetotelluric; geochemistry; geothermal; Blawan; reservoir
1. Introduction
Indonesia contains about 40% of the global geothermal potential with about 80% of it beingvolcano-hosted geothermal, as Indonesia has 127 volcanoes—or about 13% of volcanoes around theglobe [1–3]. There are 265 identified geothermal energy locations with a total potential of 28.1 GWe.Most of the potential is associated with volcanic lines, which generally has high enthalpy, and can becommercially developed for power generation. A small portion of geothermal sources are associatedwith non-volcanic systems, and usually have a relatively low temperature reservoir. Geothermalsystems in Indonesia can generally be divided into five types based on the geological structure whichis a predictor for the magnitude of its potential: volcano complexes and graben—caldera volcaniccones—generally have a potential energy that is much larger than the other types. So far, only about 4%of geothermal energy are optimally used in Indonesia. Furthermore, there is few resources availablefor the study, research, and community education of volcanoes and geothermal energy.
Indonesia has about 265 existing geothermal areas with 138 locations (52.07%) of those existinggeothermal areas still at the initial stage of preliminary investigation to inventory their potential
Geosciences 2017, 7, 41; doi:10.3390/geosciences7020041 www.mdpi.com/journal/geosciences
Geosciences 2017, 7, 41 2 of 13
resource class, while 24 other locations (9.05%) are still at the stage of intoduction investigation to thepotential of the resource class hypothetical. Only seven geothermal locations, or 2.64%, are currentlyutilized for electricity generation with a total installed capacity of 1189 MW.
Some of undeveloped geothermal area commonly directly used by the local community fortourism, heating, mushroom crops, fertilizer production, agricultural industry, and fish farming.However, in general the direct used of geothermal in Indonesia have not been developed [4].
The Ijen volcano is one the most active volcanoes—located in eastern of Java, Indonesia—andit is known for its large hyper acidic crater lake. The Ijen volcano presents significant volcanic andenvironmental hazards to its immidiate surroundings. Besides its threats, the volcano provides somebenefits for the surrounding people through sulfur mining, tourism, and geothermal energy. In Blawanvillage north of the Ijen volcano, there are about 21 hot springs with surface temperatures rangingfrom 40 to 55 C. This means the Ijen volcano complex, especially at Blawan area, is of significantinterest for development as a geothermal field. In addition, the Blawan–Ijen volcano complex also hashigh potential for agriculture for primary commodities such as coffee, timber, and fruits. Furthermore,lush natural conditions in the caldera of old Ijen are home to residents with the establishment of theSempol district in Bondowoso [5].
2. Geological Settings
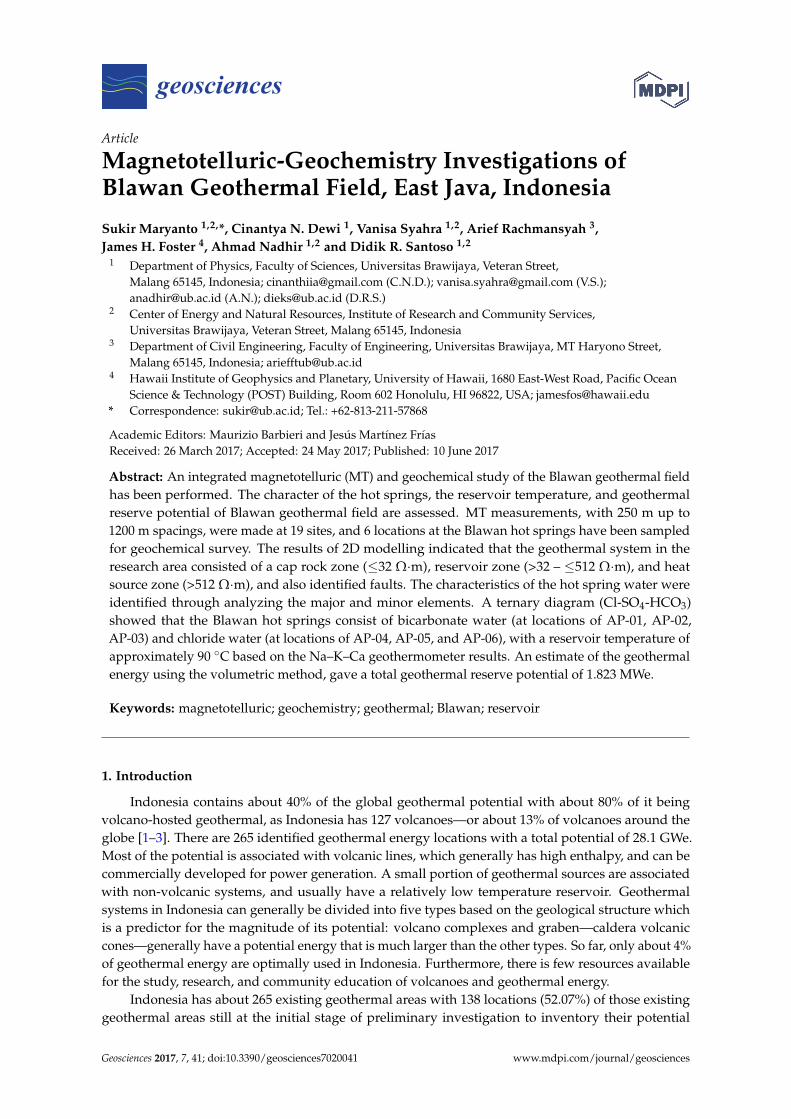
The Ijen caldera was formed more than 50,000 years ago as a result of the collapse of the Ijenstratovolcano [6]. The Ijen caldera has diameter of ±15 km to the caldera wall and has a high elevationin the northern region, curving to the southern region (Figure 1). The highest point of Ijen calderacomplex is in the south-eastern side, which is the peak of Mt. Merapi with an elevation of 2600 metersabove sea level (Figure 1). In the northern part of the caldera, the caldera wall forms a steep-slope withan elevation of 850 (near Blawan village) to 1558 m above sea level [7]. The southern region is mostlycovered by volcanic deposits from the eruption of post-caldera volcanic cones [8].
Geosciences 2017, 7, 41 2 of 13
Indonesia has about 265 existing geothermal areas with 138 locations (52.07%) of those existing geothermal areas still at the initial stage of preliminary investigation to inventory their potential resource class, while 24 other locations (9.05%) are still at the stage of intoduction investigation to the potential of the resource class hypothetical. Only seven geothermal locations, or 2.64%, are currently utilized for electricity generation with a total installed capacity of 1189 MW.
Some of undeveloped geothermal area commonly directly used by the local community for tourism, heating, mushroom crops, fertilizer production, agricultural industry, and fish farming. However, in general the direct used of geothermal in Indonesia have not been developed [4].
The Ijen volcano is one the most active volcanoes—located in eastern of Java, Indonesia—and it is known for its large hyper acidic crater lake. The Ijen volcano presents significant volcanic and environmental hazards to its immidiate surroundings. Besides its threats, the volcano provides some benefits for the surrounding people through sulfur mining, tourism, and geothermal energy. In Blawan village north of the Ijen volcano, there are about 21 hot springs with surface temperatures ranging from 40 to 55 °C. This means the Ijen volcano complex, especially at Blawan area, is of significant interest for development as a geothermal field. In addition, the Blawan–Ijen volcano complex also has high potential for agriculture for primary commodities such as coffee, timber, and fruits. Furthermore, lush natural conditions in the caldera of old Ijen are home to residents with the establishment of the Sempol district in Bondowoso [5].
2. Geological Settings
The Ijen caldera was formed more than 50,000 years ago as a result of the collapse of the Ijen stratovolcano [6]. The Ijen caldera has diameter of ±15 km to the caldera wall and has a high elevation in the northern region, curving to the southern region (Figure 1). The highest point of Ijen caldera complex is in the south-eastern side, which is the peak of Mt. Merapi with an elevation of 2600 meters above sea level (Figure 1). In the northern part of the caldera, the caldera wall forms a steep-slope with an elevation of 850 (near Blawan village) to 1558 m above sea level [7]. The southern region is mostly covered by volcanic deposits from the eruption of post-caldera volcanic cones [8].
Figure 1. Digital elevation model of the Ijen caldera complex. Red triangles indicate post-caldera volcanoes: 1: Jampit; 2: Ranteh; 3: Merapi; 4: Ringgih; 5: Blau; 6: Cemara; 7: Melaten; 8: Lingker; 9: Anyar; 10: Genteng; 11: Pendil; 12: Gelawan; 13: Kukusan; 14: Telaga Weru; 15: Widodaren; 16: Papak; 17: Kawah Ijen [9].
Figure 1. Digital elevation model of the Ijen caldera complex. Red triangles indicate post-calderavolcanoes: 1: Jampit; 2: Ranteh; 3: Merapi; 4: Ringgih; 5: Blau; 6: Cemara; 7: Melaten; 8: Lingker; 9:Anyar; 10: Genteng; 11: Pendil; 12: Gelawan; 13: Kukusan; 14: Telaga Weru; 15: Widodaren; 16: Papak;17: Kawah Ijen [9].
The Ijen caldera complex was formed in the Pleistocene era along with the formation of two othervolcanic centers in Java Island—Mt. Tengger and Mt. Ijang. The evolution of the Ijen caldera complexis divided into three periods as follows [10]:
Geosciences 2017, 7, 41 3 of 13
• Pre-caldera period. This period occurred around 0.29 Ma± 0.003, resulting in a huge stratovolcano.Sequences of layers were pyroclastic flows, pyroclastic fallout deposits, and basaltic flows.Dacite lava flows can be found in the northern side of the caldera rim. Outcrops also canbe found at the outside of the southern rim of the caldera, near Songgong village.
• Ijen caldera period. The main process of this period is thought to have occurred between 300,000and 50,000 years ago. The resulting deposit can be found both inside and outside of the caldera asa thick layer of fall pumice and pumice of pyroclastic flows. At the rim of the caldera, sedimentthickness reaches about 100–150 m.
• Post-caldera period. This period is divided into five different periods as follows:
1. First period—Post-caldera formation, a lake was established within the caldera. Sediment layersformed in the north–north-east regions of the caldera as interbedded volcanoclastic shales, silts,and lahar were deposited. The presence of volcanic ash shows that the lake was formed duringthe reactivation process of volcanic activity inside the caldera [10].
2. Second period—Consists of volcanic activity inside the caldera and the growth of the lava domeof Mt. Blau [10].
3. Third period—This period is characterized by the growth of four volcanoes: Mt. Ringgih,Mt. Jampit, Mt. Ranteh, and Mt. Merapi. The volcanic products vary in chemical compositionfrom basalt to andesite. Fall pumice, pyroclastic flows, lahar, and lahar flows can also befound [11]. Three of the four volcanoes (Mt. Jampit, Mt. Ranteh, and Mt. Merapi) lie along thesouthern edge of the caldera which suggests a significant fault linked to the formation of thecaldera and shallow magma chamber. The sequence also follows a tectonic lineament associatedwith fault structures. Petrologic studies show that Blau (resurgent dome) and the four volcanoesabove are associated with the other magma bodies from the pre-caldera formation period [12].
4. Fourth period—About 50,000 years ago, the lake was emptied through the northern part ofcaldera. Based on existing stratigraphy, drainage of the lake occurred in two different occasions.
5. Fifth period—This last period occurred about 25,000 years ago and consisted of the formation of12 cinder cones in a line oriented east to west. This trend appears to be more or less parallel tothe tectonic lineament [13] and shows the migration of volcanic activity from west to east acrossthe caldera. The youngest part of this cinder cone is the Ijen Crater [12].
Volcanic acitvity of Mt. Kendeng totally stopped after the formation of Ijen caldera and somefaults in the caldera wall. Pedati fault was formed in northern part of caldera wall, while Jampitfault was formed in the southwest. The processes of erosion and sedimentation of volcanic materialstook place after the formation of the caldera. Some loose pyroclastic material formed lahars whichwere then deposited on low lying areas. The lahar deposits that hardened are impermeable, so wateraccumulated in the Ijen caldera, forming Lake Blawan. Erosion and sedimentation processes take placecontinuously both inside and outside caldera. Erosion outside the caldera removed both loose materialas well as hard ignimbrite deposits. The loose material was deposited in the Madura Strait and BaliStrait. Meanwhile, erosional material from inside the caldera was transported and deposited in LakeBlawan and formed a lake clastic sediment. It is dominated by smooth volcanic material that formssandstone and siltstone [14].
Erosion takes place where the greywacke zone in the Pedati fault is reached by the water surfaceof Lake Blawan. Water flows across the Pedati fault towards Madura Strait, leading to focused erosionwithin the fault which eventually erodes down to the level of the lake floor. The existence of a way outfor the water through the fault causes Lake Blawan to become dry. The lake sediment clastic laters nearKali Sat, Kali Sengon, and Banyupait River are also eroded again forming deep valleys. This processlasted for a long period and was accompanied by lithification of lake clastic sediments. Large tectonicevents caused the formation of some faults in the area, such as Blawan fault, Watucapil fault, andKukusan fault, oriented from northeast to southwest and there is also the possibility of hidden faultsoriented from east to west in the southern part of the Ijen caldera. Tectonic events are suspected to
Geosciences 2017, 7, 41 4 of 13
be triggers of volcanic acitvity in the post-caldera era. Centers of post-caldera volcanic eruptions arelocated in the weak zone aligned east–west starting from Mt. Merapi and Mt. Ijen in the eastern regionto Mt. Raung in the western region [14].
3. Materials and Methods
We have conducted field experiments in the Blawan area on the north rim of Ijen caldera.The Blawan area is a caldera lake sitting on volcanic deposits with an abundance of pumice whichformed sandstone and silt. The presence of geothermal potential at this location is characterizedby hot springs scattered in the north of the area [14]. Various geophysics investigations have beencarried out in Blawan since 2013 to understand the geothermal characteristics and resources in the area.Those geophysical studies were limited to the shallow portion of the region. Shallow resistivitysurveys were conducted to determine the distribution of hot water [8]. Other geophysicalsurveys—like gravitational [15] and magnetic [16]—also provided valuable information about theshallow geothermal zone.
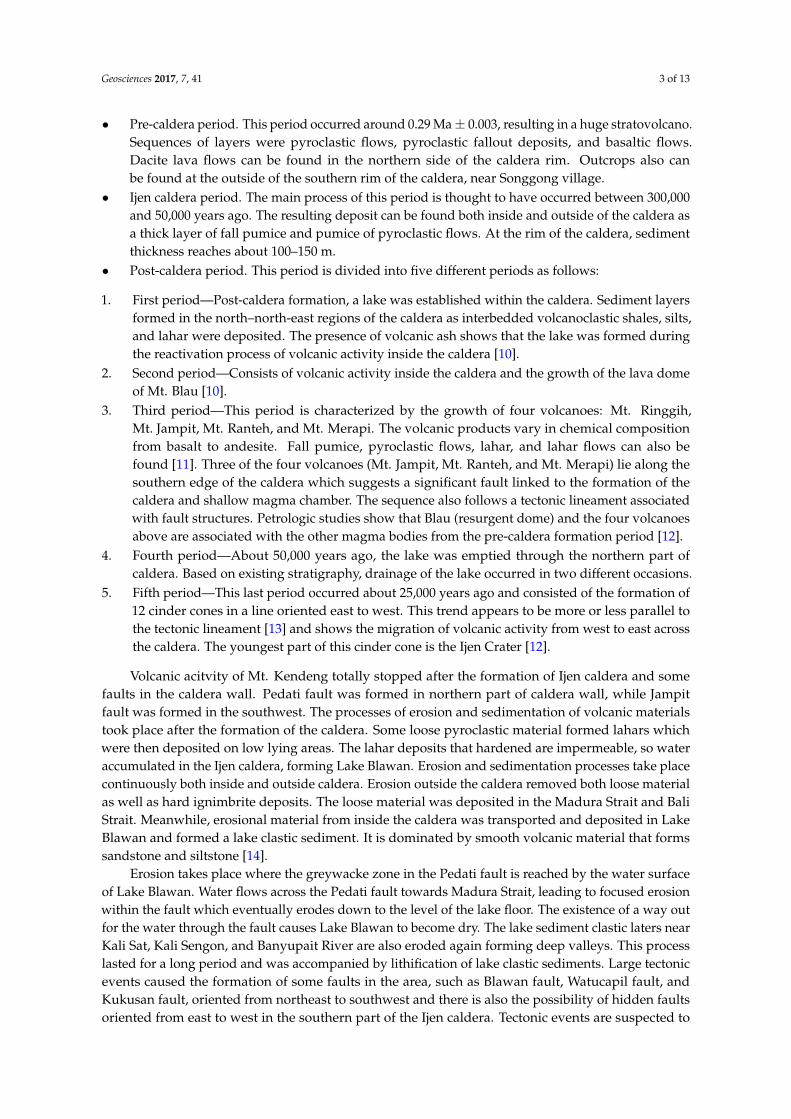
We performed a magnetotelluric survey from 21 February to 12 March, 2015 using a MetronixADU-07e manufactured by GmbH (Braunschweig, Germany). The ADU-07e measures two orthogonalcomponents of an electric field (Ex and Ey), and three components of the magnetic field (Hx, Hy, Hz).Nineteen MT sites were observed with three magnetic sensors to measure the magnetic horizontaland vertical field and two 30 m long dipoles with electrodes oriented N–S and E–W to measure theelectric field (Figure 2). The frequencies used during the study ranged from 0.01 Hz to 10,000 Hz.The observed data, which were stored in the ADU-07e database, were immediately downloadedto a personal computer upon arrival at the field base. The downloaded data were transformed forprocessing, and three frequency band data sets were generated at different sampling rates. For thehigh frequency (HF) band, 65 kHz sampling was selected. For the mid frequency (MF) and the lowfrequency (LF) bands, the sampling rates were set to 4 kHz and 128 Hz, respectively.
Geosciences 2017, 7, 41 4 of 13
Blawan fault, Watucapil fault, and Kukusan fault, oriented from northeast to southwest and there is also the possibility of hidden faults oriented from east to west in the southern part of the Ijen caldera. Tectonic events are suspected to be triggers of volcanic acitvity in the post-caldera era. Centers of post-caldera volcanic eruptions are located in the weak zone aligned east–west starting from Mt. Merapi and Mt. Ijen in the eastern region to Mt. Raung in the western region [14].
3. Materials and Methods
We have conducted field experiments in the Blawan area on the north rim of Ijen caldera. The Blawan area is a caldera lake sitting on volcanic deposits with an abundance of pumice which formed sandstone and silt. The presence of geothermal potential at this location is characterized by hot springs scattered in the north of the area [14]. Various geophysics investigations have been carried out in Blawan since 2013 to understand the geothermal characteristics and resources in the area. Those geophysical studies were limited to the shallow portion of the region. Shallow resistivity surveys were conducted to determine the distribution of hot water [8]. Other geophysical surveys—like gravitational [15] and magnetic [16]—also provided valuable information about the shallow geothermal zone.
We performed a magnetotelluric survey from 21 February to 12 March, 2015 using a Metronix ADU-07e manufactured by GmbH (Braunschweig, Germany). The ADU-07e measures two orthogonal components of an electric field (Ex and Ey), and three components of the magnetic field (Hx, Hy, Hz). Nineteen MT sites were observed with three magnetic sensors to measure the magnetic horizontal and vertical field and two 30 m long dipoles with electrodes oriented N–S and E–W to measure the electric field (Figure 2). The frequencies used during the study ranged from 0.01 Hz to 10,000 Hz. The observed data, which were stored in the ADU-07e database, were immediately downloaded to a personal computer upon arrival at the field base. The downloaded data were transformed for processing, and three frequency band data sets were generated at different sampling rates. For the high frequency (HF) band, 65 kHz sampling was selected. For the mid frequency (MF) and the low frequency (LF) bands, the sampling rates were set to 4 kHz and 128 Hz, respectively.
Figure 2. The configuration for the magnetotelluric acquisition used four porous pots (2 for Ex and 2 for Ey) and three magnetic coils (Hx, Hy, and Hz) that were set in different quadrants so that each coil could record the orthogonal x, y, and z magnetic components.
The configuration of the site locations was based on the structure and geological characteristics of the area. The geometry of the sites was designed to be approximately rectangular (Figure 3). In general, the sites were approximately 250 m to 1200 m apart depending on access constraints, but
Figure 2. The configuration for the magnetotelluric acquisition used four porous pots (2 for Ex and 2for Ey) and three magnetic coils (Hx, Hy, and Hz) that were set in different quadrants so that each coilcould record the orthogonal x, y, and z magnetic components.
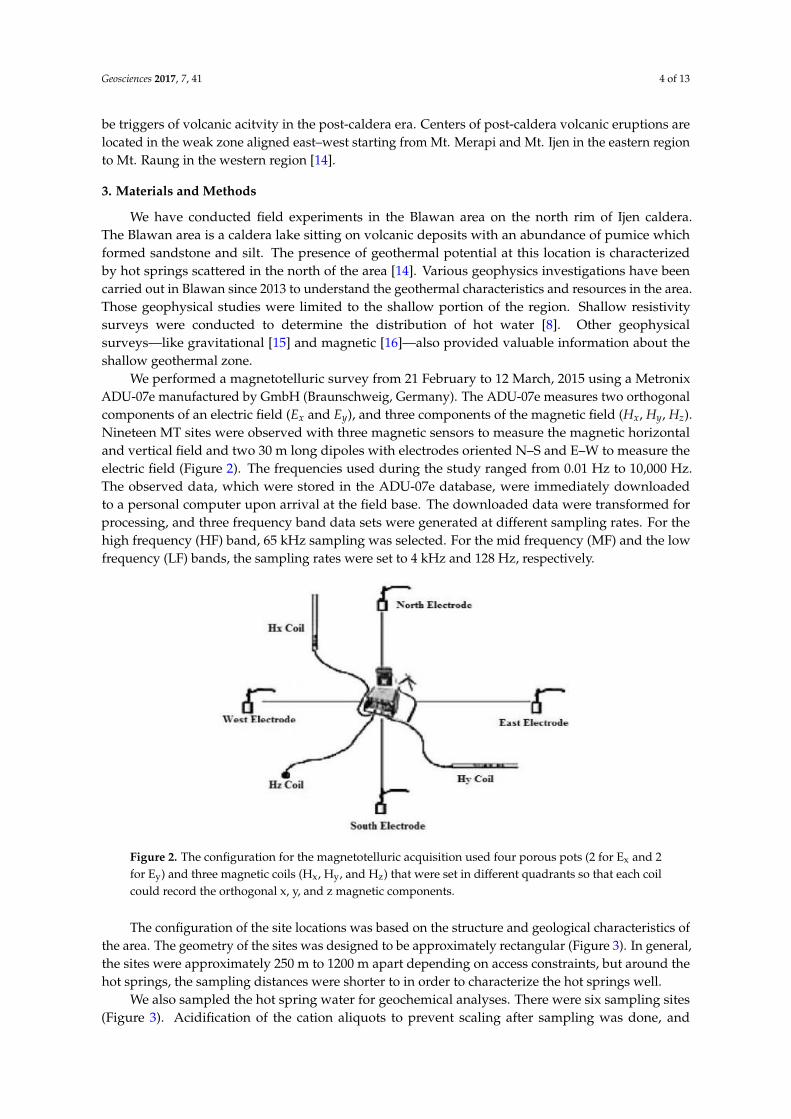
The configuration of the site locations was based on the structure and geological characteristics ofthe area. The geometry of the sites was designed to be approximately rectangular (Figure 3). In general,the sites were approximately 250 m to 1200 m apart depending on access constraints, but around thehot springs, the sampling distances were shorter to in order to characterize the hot springs well.
We also sampled the hot spring water for geochemical analyses. There were six sampling sites(Figure 3). Acidification of the cation aliquots to prevent scaling after sampling was done, and
Geosciences 2017, 7, 41 5 of 13
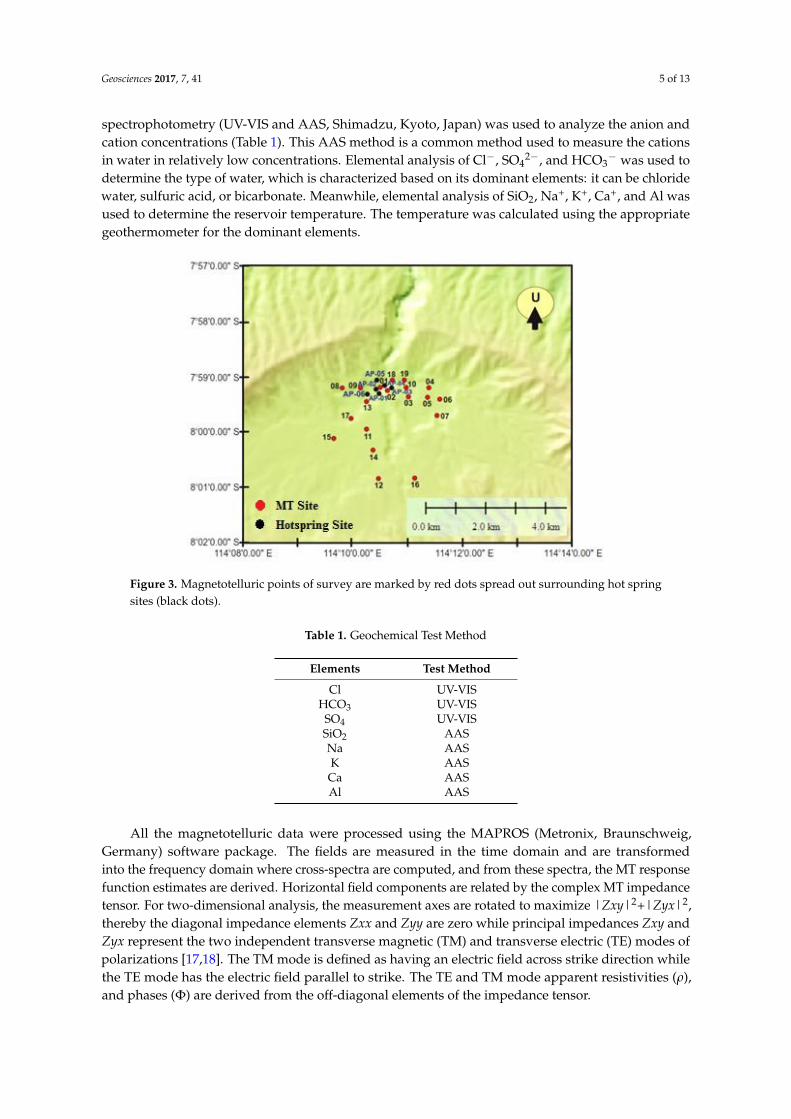
spectrophotometry (UV-VIS and AAS, Shimadzu, Kyoto, Japan) was used to analyze the anion andcation concentrations (Table 1). This AAS method is a common method used to measure the cationsin water in relatively low concentrations. Elemental analysis of Cl−, SO4
2−, and HCO3− was used to
determine the type of water, which is characterized based on its dominant elements: it can be chloridewater, sulfuric acid, or bicarbonate. Meanwhile, elemental analysis of SiO2, Na+, K+, Ca+, and Al wasused to determine the reservoir temperature. The temperature was calculated using the appropriategeothermometer for the dominant elements.
Geosciences 2017, 7, 41 5 of 13
around the hot springs, the sampling distances were shorter to in order to characterize the hot springs well.
We also sampled the hot spring water for geochemical analyses. There were six sampling sites (Figure 3). Acidification of the cation aliquots to prevent scaling after sampling was done, and spectrophotometry (UV-VIS and AAS, Shimadzu, Kyoto, Japan) was used to analyze the anion and cation concentrations (Table 1). This AAS method is a common method used to measure the cations in water in relatively low concentrations. Elemental analysis of Cl−, SO42−, and HCO3− was used to determine the type of water, which is characterized based on its dominant elements: it can be chloride water, sulfuric acid, or bicarbonate. Meanwhile, elemental analysis of SiO2, Na+, K+, Ca+, and Al was used to determine the reservoir temperature. The temperature was calculated using the appropriate geothermometer for the dominant elements.
Figure 3. Magnetotelluric points of survey are marked by red dots spread out surrounding hot spring sites (black dots).
Table 1. Geochemical Test Method
Elements Test MethodCl UV-VIS
HCO3 UV-VIS SO4 UV-VIS SiO2 AAS Na AAS K AAS Ca AAS Al AAS
All the magnetotelluric data were processed using the MAPROS (Metronix, Braunschweig, Germany) software package. The fields are measured in the time domain and are transformed into the frequency domain where cross-spectra are computed, and from these spectra, the MT response function estimates are derived. Horizontal field components are related by the complex MT impedance tensor. For two-dimensional analysis, the measurement axes are rotated to maximize |Zxy|2+|Zyx|2, thereby the diagonal impedance elements Zxx and Zyy are zero while principal impedances Zxy and Zyx represent the two independent transverse magnetic (TM) and transverse
Figure 3. Magnetotelluric points of survey are marked by red dots spread out surrounding hot springsites (black dots).
Table 1. Geochemical Test Method
Elements Test Method
Cl UV-VISHCO3 UV-VIS
SO4 UV-VISSiO2 AASNa AASK AASCa AASAl AAS
All the magnetotelluric data were processed using the MAPROS (Metronix, Braunschweig,Germany) software package. The fields are measured in the time domain and are transformedinto the frequency domain where cross-spectra are computed, and from these spectra, the MT responsefunction estimates are derived. Horizontal field components are related by the complex MT impedancetensor. For two-dimensional analysis, the measurement axes are rotated to maximize |Zxy|2+|Zyx|2,thereby the diagonal impedance elements Zxx and Zyy are zero while principal impedances Zxy andZyx represent the two independent transverse magnetic (TM) and transverse electric (TE) modes ofpolarizations [17,18]. The TM mode is defined as having an electric field across strike direction whilethe TE mode has the electric field parallel to strike. The TE and TM mode apparent resistivities (ρ),and phases (Φ) are derived from the off-diagonal elements of the impedance tensor.
Geosciences 2017, 7, 41 6 of 13
4. Results
4.1. Magnetotelluric Analysis
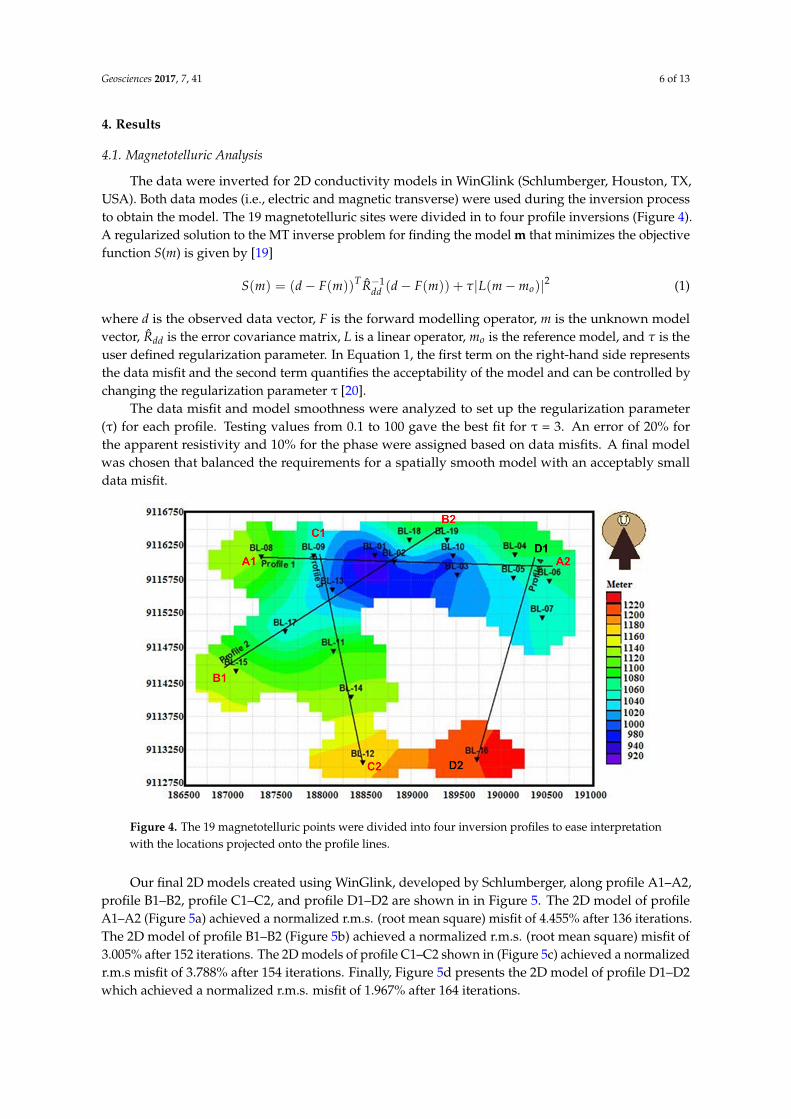
The data were inverted for 2D conductivity models in WinGlink (Schlumberger, Houston, TX,USA). Both data modes (i.e., electric and magnetic transverse) were used during the inversion processto obtain the model. The 19 magnetotelluric sites were divided in to four profile inversions (Figure 4).A regularized solution to the MT inverse problem for finding the model m that minimizes the objectivefunction S(m) is given by [19]
S(m) = (d− F(m))T R−1dd (d− F(m)) + τ|L(m−mo)|2 (1)
where d is the observed data vector, F is the forward modelling operator, m is the unknown modelvector, Rdd is the error covariance matrix, L is a linear operator, mo is the reference model, and τ is theuser defined regularization parameter. In Equation 1, the first term on the right-hand side representsthe data misfit and the second term quantifies the acceptability of the model and can be controlled bychanging the regularization parameter τ [20].
The data misfit and model smoothness were analyzed to set up the regularization parameter(τ) for each profile. Testing values from 0.1 to 100 gave the best fit for τ = 3. An error of 20% forthe apparent resistivity and 10% for the phase were assigned based on data misfits. A final modelwas chosen that balanced the requirements for a spatially smooth model with an acceptably smalldata misfit.
Geosciences 2017, 7, 41 6 of 13
electric (TE) modes of polarizations [17,18]. The TM mode is defined as having an electric field across strike direction while the TE mode has the electric field parallel to strike. The TE and TM mode apparent resistivities (ρ), and phases (Ф) are derived from the off-diagonal elements of the impedance tensor.
4. Results
4.1. Magnetotelluric Analysis
The data were inverted for 2D conductivity models in WinGlink (Schlumberger, Houston, TX, USA). Both data modes (i.e., electric and magnetic transverse) were used during the inversion process to obtain the model. The 19 magnetotelluric sites were divided in to four profile inversions (Figure 4). A regularized solution to the MT inverse problem for finding the model m that minimizes the objective function S(m) is given by [19] = − − + | − | (1)
where d is the observed data vector, F is the forward modelling operator, m is the unknown model vector, is the error covariance matrix, L is a linear operator, is the reference model, and τ is the user defined regularization parameter. In Equation 1, the first term on the right-hand side represents the data misfit and the second term quantifies the acceptability of the model and can be controlled by changing the regularization parameter τ [20].
The data misfit and model smoothness were analyzed to set up the regularization parameter (τ) for each profile. Testing values from 0.1 to 100 gave the best fit for τ = 3. An error of 20% for the apparent resistivity and 10% for the phase were assigned based on data misfits. A final model was chosen that balanced the requirements for a spatially smooth model with an acceptably small data misfit.
Figure 4. The 19 magnetotelluric points were divided into four inversion profiles to ease interpretation with the locations projected onto the profile lines.
Our final 2D models created using WinGlink, developed by Schlumberger, along profile A1–A2, profile B1–B2, profile C1–C2, and profile D1–D2 are shown in in Figure 5. The 2D model of profile A1–A2 (Figure 5a) achieved a normalized r.m.s. (root mean square) misfit of 4.455% after 136 iterations. The 2D model of profile B1–B2 (Figure 5b) achieved a normalized r.m.s. (root mean square) misfit of 3.005% after 152 iterations. The 2D models of profile C1–C2 shown in (Figure 5c)
Figure 4. The 19 magnetotelluric points were divided into four inversion profiles to ease interpretationwith the locations projected onto the profile lines.
Our final 2D models created using WinGlink, developed by Schlumberger, along profile A1–A2,profile B1–B2, profile C1–C2, and profile D1–D2 are shown in in Figure 5. The 2D model of profileA1–A2 (Figure 5a) achieved a normalized r.m.s. (root mean square) misfit of 4.455% after 136 iterations.The 2D model of profile B1–B2 (Figure 5b) achieved a normalized r.m.s. (root mean square) misfit of3.005% after 152 iterations. The 2D models of profile C1–C2 shown in (Figure 5c) achieved a normalizedr.m.s misfit of 3.788% after 154 iterations. Finally, Figure 5d presents the 2D model of profile D1–D2which achieved a normalized r.m.s. misfit of 1.967% after 164 iterations.
Geosciences 2017, 7, 41 7 of 13
Geosciences 2017, 7, 41 7 of 13
achieved a normalized r.m.s misfit of 3.788% after 154 iterations. Finally, Figure 5d presents the 2D
model of profile D1–D2 which achieved a normalized r.m.s. misfit of 1.967% after 164 iterations.
(a) (b)
(c) (d)
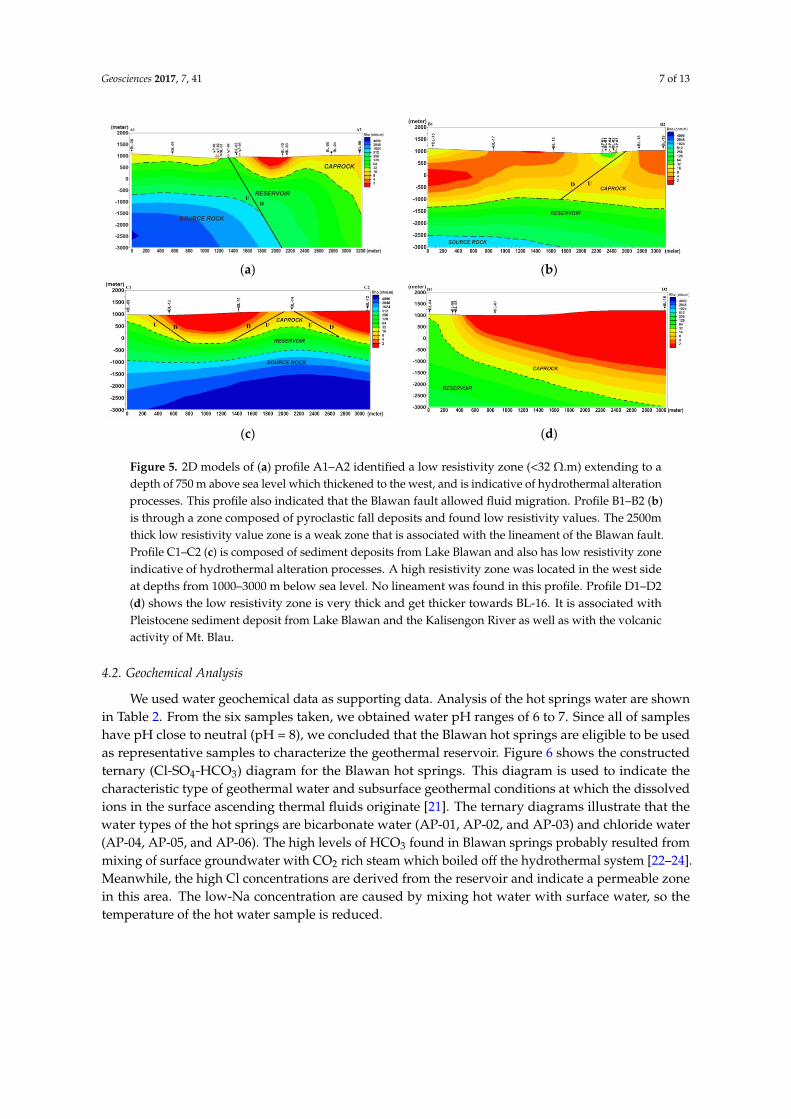
Figure 5. 2D models of (a) profile A1–A2 identified a low resistivity zone (<32 Ω.m) extending to a
depth of 750 m above sea level which thickened to the west, and is indicative of hydrothermal
alteration processes. This profile also indicated that the Blawan fault allowed fluid migration. Profile
B1–B2 (b) is through a zone composed of pyroclastic fall deposits and found low resistivity values.
The 2500m thick low resistivity value zone is a weak zone that is associated with the lineament of the
Blawan fault. Profile C1–C2 (c) is composed of sediment deposits from Lake Blawan and also has low
resistivity zone indicative of hydrothermal alteration processes. A high resistivity zone was located
in the west side at depths from 1000–3000 m below sea level. No lineament was found in this profile.
Profile D1–D2 (d) shows the low resistivity zone is very thick and get thicker towards BL-16. It is
associated with Pleistocene sediment deposit from Lake Blawan and the Kalisengon River as well as
with the volcanic activity of Mt. Blau.
4.2. Geochemical Analysis
We used water geochemical data as supporting data. Analysis of the hot springs water are
shown in Table 2. From the six samples taken, we obtained water pH ranges of 6 to 7. Since all of
samples have pH close to neutral (pH = 8), we concluded that the Blawan hot springs are eligible to be
used as representative samples to characterize the geothermal reservoir. Figure 6 shows the
constructed ternary (Cl-SO4-HCO3) diagram for the Blawan hot springs. This diagram is used to
indicate the characteristic type of geothermal water and subsurface geothermal conditions at which
the dissolved ions in the surface ascending thermal fluids originate [21]. The ternary diagrams
illustrate that the water types of the hot springs are bicarbonate water (AP-01, AP-02, and AP-03)
and chloride water (AP-04, AP-05, and AP-06). The high levels of HCO3 found in Blawan springs
probably resulted from mixing of surface groundwater with CO2 rich steam which boiled off the
hydrothermal system [22,23,24]. Meanwhile, the high Cl concentrations are derived from the
reservoir and indicate a permeable zone in this area. The low-Na concentration are caused by mixing
hot water with surface water, so the temperature of the hot water sample is reduced.
Figure 5. 2D models of (a) profile A1–A2 identified a low resistivity zone (<32 Ω.m) extending to adepth of 750 m above sea level which thickened to the west, and is indicative of hydrothermal alterationprocesses. This profile also indicated that the Blawan fault allowed fluid migration. Profile B1–B2 (b)is through a zone composed of pyroclastic fall deposits and found low resistivity values. The 2500mthick low resistivity value zone is a weak zone that is associated with the lineament of the Blawan fault.Profile C1–C2 (c) is composed of sediment deposits from Lake Blawan and also has low resistivity zoneindicative of hydrothermal alteration processes. A high resistivity zone was located in the west sideat depths from 1000–3000 m below sea level. No lineament was found in this profile. Profile D1–D2(d) shows the low resistivity zone is very thick and get thicker towards BL-16. It is associated withPleistocene sediment deposit from Lake Blawan and the Kalisengon River as well as with the volcanicactivity of Mt. Blau.
4.2. Geochemical Analysis
We used water geochemical data as supporting data. Analysis of the hot springs water are shownin Table 2. From the six samples taken, we obtained water pH ranges of 6 to 7. Since all of sampleshave pH close to neutral (pH = 8), we concluded that the Blawan hot springs are eligible to be usedas representative samples to characterize the geothermal reservoir. Figure 6 shows the constructedternary (Cl-SO4-HCO3) diagram for the Blawan hot springs. This diagram is used to indicate thecharacteristic type of geothermal water and subsurface geothermal conditions at which the dissolvedions in the surface ascending thermal fluids originate [21]. The ternary diagrams illustrate that thewater types of the hot springs are bicarbonate water (AP-01, AP-02, and AP-03) and chloride water(AP-04, AP-05, and AP-06). The high levels of HCO3 found in Blawan springs probably resulted frommixing of surface groundwater with CO2 rich steam which boiled off the hydrothermal system [22–24].Meanwhile, the high Cl concentrations are derived from the reservoir and indicate a permeable zonein this area. The low-Na concentration are caused by mixing hot water with surface water, so thetemperature of the hot water sample is reduced.

Geosciences 2017, 7, 41 8 of 13
Table 2. Geochemical analysis
Parameter Concentration (mg/kg)
AP-01 AP-02 AP-03 AP-04 AP-05 AP-06pH 6.628 6.718 6.648 6.822 7.685 6.725Cl 130 145 140 160 130 150
HCO3 187.44 280.28 220 13.2 0 132.88SO4 43.908 43.731 32.594 34.678 20.222 29.792SiO2 13.43 12.25 9.72 15.29 9.06 10.62Na 0.016 0.017 0.01 0.012 0.014 0.018K 46.86 18.53 35.65 30.08 72.7 57.03Ca 6.614 6.301 6.668 6.638 3.446 5.576Al 0 <0.1006 0 0 0 0
Geosciences 2017, 7, 41 8 of 13
Table 2. Geochemical analysis
Parameter Concentration (mg/kg)AP-01 AP-02 AP-03 AP-04 AP-05 AP-06
pH 6.628 6.718 6.648 6.822 7.685 6.725 Cl 130 145 140 160 130 150
HCO3 187.44 280.28 220 13.2 0 132.88 SO4 43.908 43.731 32.594 34.678 20.222 29.792 SiO2 13.43 12.25 9.72 15.29 9.06 10.62 Na 0.016 0.017 0.01 0.012 0.014 0.018 K 46.86 18.53 35.65 30.08 72.7 57.03 Ca 6.614 6.301 6.668 6.638 3.446 5.576 Al 0 <0.1006 0 0 0 0
Figure 6. Ternary diagram of Cl-SO4-HCO3 for the Blawan hotspring sites [21].
5. Discussion
The main requirements for the formation of a geothermal system (hydrothermal) are a major source of heat, a reservoir to accumulate heat, and caprock [25]. The discovery of the faults shown in Figure 5 will support the geothermal system of Blawan, as faults play important roles as pathways and storage for hydrothermal fluids [26]. The distribution of Blawan geothermal system is presented in Figure 7.
Based on the correlation with the geological map of research area (Figure 8), it can be interpreted that the low resistivity zone (≤32 Ω·m) is probably composed of sandstone, Blawan lake sediments, and pyroclastic deposits such as volcanic ash. The low resistivity zone dominates to depths of 750 m below sea level and thickens toward the west (spread out along A1–A2). In Profile 2 (spread out along B1–B2), the low resistivity zone dominates from the surface to a depth of 1250 m below sea level. This corresponds to the geological map (Figure 8) that shows the presence of the Blawan fault. For Profile 3 (C1–C2) the low resistivity zone is significantly shallower than in Profiles 1 and 2, and extends from the surface to a depth of 250 m. In Profile 4 (D1–D4) the low resistivity zone thickens towards point BL-16 (in the south) to a depth of 1000 m below sea level. Low resistivity is often associated with hydrothermal alteration processes, and resistivity decreases proportionately with the abundance of clay minerals. In general, the conductive clay products of hydrothermal alteration, and the high temperature associated with geothermal activity tend to result in lower overall resistivity in geothermal systems [27]. We interpret our low resistivity zones as due to caprock with the presence of high clay mineral contents. Caprock is composed of impermeable rocks that prevent hot fluid in the reservoir being lost to the surface. The low resistivity zone is suspected to be formed in post-caldera period.
Figure 6. Ternary diagram of Cl-SO4-HCO3 for the Blawan hotspring sites [21].
5. Discussion
The main requirements for the formation of a geothermal system (hydrothermal) are a majorsource of heat, a reservoir to accumulate heat, and caprock [25]. The discovery of the faults shown inFigure 5 will support the geothermal system of Blawan, as faults play important roles as pathwaysand storage for hydrothermal fluids [26]. The distribution of Blawan geothermal system is presentedin Figure 7.
Based on the correlation with the geological map of research area (Figure 8), it can be interpretedthat the low resistivity zone (≤32 Ω·m) is probably composed of sandstone, Blawan lake sediments,and pyroclastic deposits such as volcanic ash. The low resistivity zone dominates to depths of 750 mbelow sea level and thickens toward the west (spread out along A1–A2). In Profile 2 (spread outalong B1–B2), the low resistivity zone dominates from the surface to a depth of 1250 m below sealevel. This corresponds to the geological map (Figure 8) that shows the presence of the Blawan fault.For Profile 3 (C1–C2) the low resistivity zone is significantly shallower than in Profiles 1 and 2, andextends from the surface to a depth of 250 m. In Profile 4 (D1–D4) the low resistivity zone thickenstowards point BL-16 (in the south) to a depth of 1000 m below sea level. Low resistivity is oftenassociated with hydrothermal alteration processes, and resistivity decreases proportionately with theabundance of clay minerals. In general, the conductive clay products of hydrothermal alteration, andthe high temperature associated with geothermal activity tend to result in lower overall resistivity ingeothermal systems [27]. We interpret our low resistivity zones as due to caprock with the presenceof high clay mineral contents. Caprock is composed of impermeable rocks that prevent hot fluid
Geosciences 2017, 7, 41 9 of 13
in the reservoir being lost to the surface. The low resistivity zone is suspected to be formed inpost-caldera period.Geosciences 2017, 7, 41 9 of 13
(a) (b)
(c) (d)
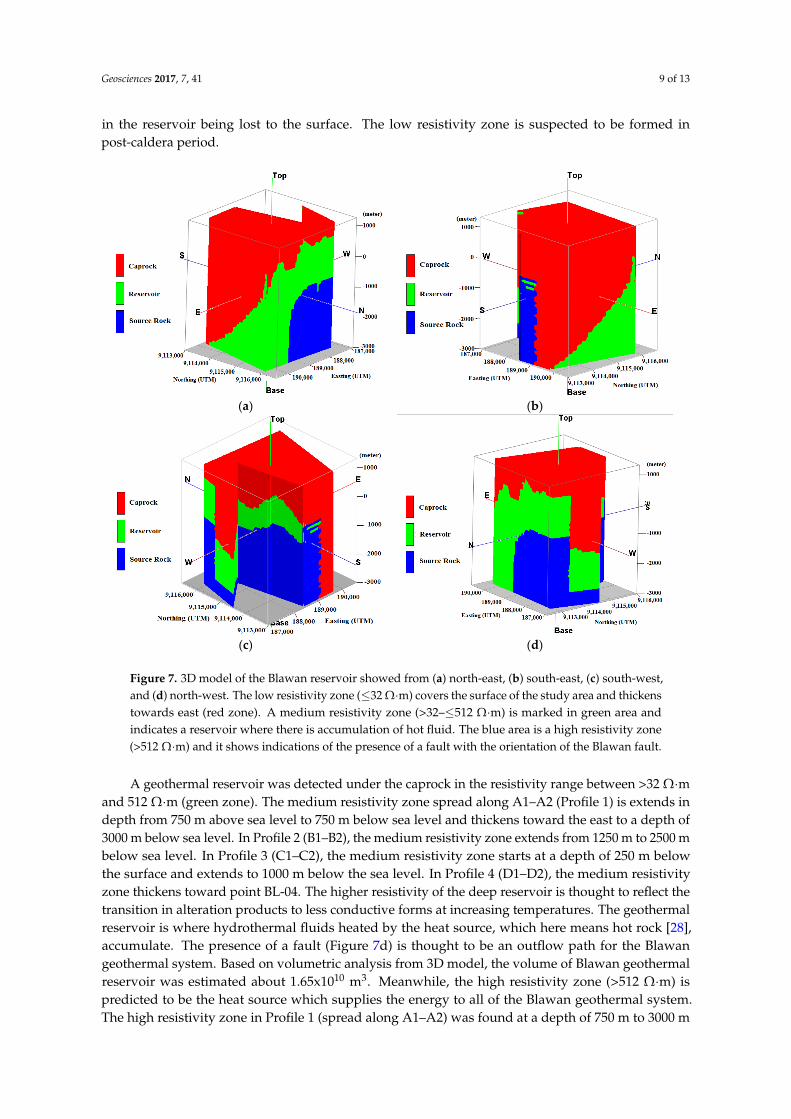
Figure 7. 3D model of the Blawan reservoir showed from (a) north-east, (b) south-east, (c) south-west, and (d) north-west. The low resistivity zone (≤32 Ω·m) covers the surface of the study area and thickens towards east (red zone). A medium resistivity zone (>32 – ≤512 Ω·m) is marked in green area and indicates a reservoir where there is accumulation of hot fluid. The blue area is a high resistivity zone (>512 Ω·m) and it shows indications of the presence of a fault with the orientation of the Blawan fault.
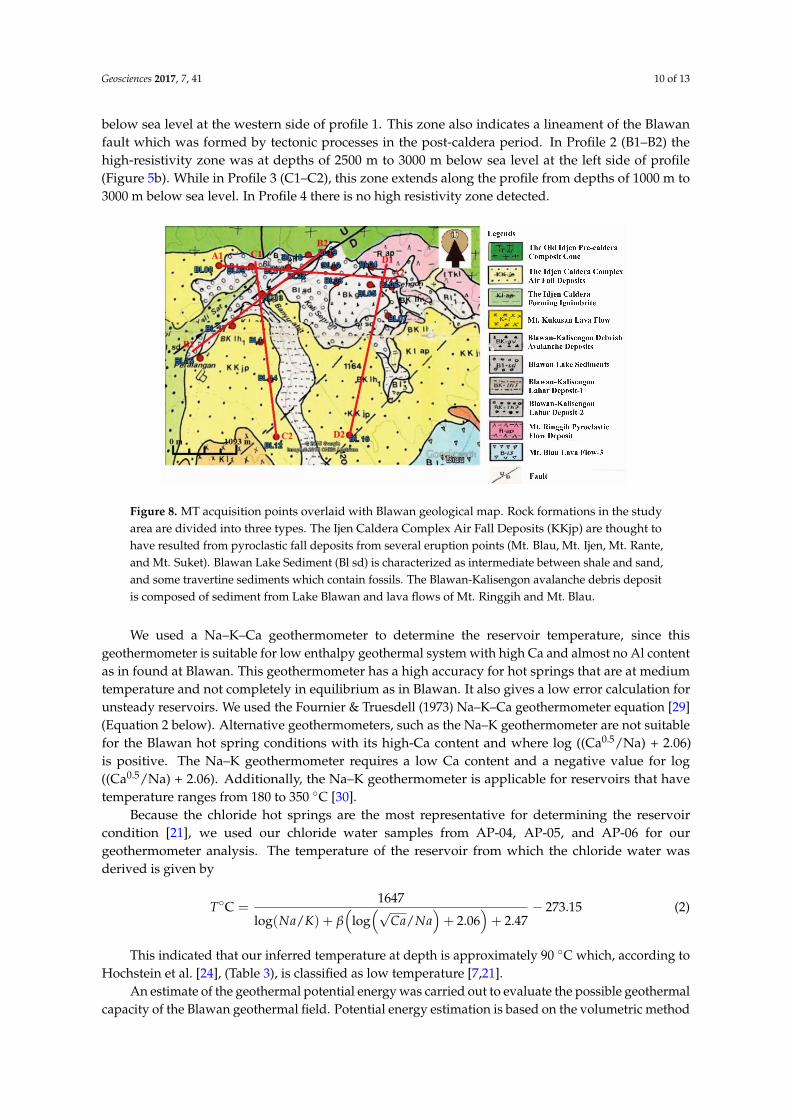
Figure 8. MT acquisition points overlaid with Blawan geological map. Rock formations in the study area are divided into three types. The Ijen Caldera Complex Air Fall Deposits (KKjp) are thought to have resulted from pyroclastic fall deposits from several eruption points (Mt. Blau, Mt. Ijen, Mt.
Figure 7. 3D model of the Blawan reservoir showed from (a) north-east, (b) south-east, (c) south-west,and (d) north-west. The low resistivity zone (≤32 Ω·m) covers the surface of the study area and thickenstowards east (red zone). A medium resistivity zone (>32–≤512 Ω·m) is marked in green area andindicates a reservoir where there is accumulation of hot fluid. The blue area is a high resistivity zone(>512 Ω·m) and it shows indications of the presence of a fault with the orientation of the Blawan fault.
A geothermal reservoir was detected under the caprock in the resistivity range between >32 Ω·mand 512 Ω·m (green zone). The medium resistivity zone spread along A1–A2 (Profile 1) is extends indepth from 750 m above sea level to 750 m below sea level and thickens toward the east to a depth of3000 m below sea level. In Profile 2 (B1–B2), the medium resistivity zone extends from 1250 m to 2500 mbelow sea level. In Profile 3 (C1–C2), the medium resistivity zone starts at a depth of 250 m belowthe surface and extends to 1000 m below the sea level. In Profile 4 (D1–D2), the medium resistivityzone thickens toward point BL-04. The higher resistivity of the deep reservoir is thought to reflect thetransition in alteration products to less conductive forms at increasing temperatures. The geothermalreservoir is where hydrothermal fluids heated by the heat source, which here means hot rock [28],accumulate. The presence of a fault (Figure 7d) is thought to be an outflow path for the Blawangeothermal system. Based on volumetric analysis from 3D model, the volume of Blawan geothermalreservoir was estimated about 1.65x10¹⁰ m3. Meanwhile, the high resistivity zone (>512 Ω·m) ispredicted to be the heat source which supplies the energy to all of the Blawan geothermal system.The high resistivity zone in Profile 1 (spread along A1–A2) was found at a depth of 750 m to 3000 m
Geosciences 2017, 7, 41 10 of 13
below sea level at the western side of profile 1. This zone also indicates a lineament of the Blawanfault which was formed by tectonic processes in the post-caldera period. In Profile 2 (B1–B2) thehigh-resistivity zone was at depths of 2500 m to 3000 m below sea level at the left side of profile(Figure 5b). While in Profile 3 (C1–C2), this zone extends along the profile from depths of 1000 m to3000 m below sea level. In Profile 4 there is no high resistivity zone detected.
Geosciences 2017, 7, 41 9 of 13
(a) (b)
(c) (d)
Figure 7. 3D model of the Blawan reservoir showed from (a) north-east, (b) south-east, (c) south-west, and (d) north-west. The low resistivity zone (≤32 Ω·m) covers the surface of the study area and thickens towards east (red zone). A medium resistivity zone (>32 – ≤512 Ω·m) is marked in green area and indicates a reservoir where there is accumulation of hot fluid. The blue area is a high resistivity zone (>512 Ω·m) and it shows indications of the presence of a fault with the orientation of the Blawan fault.
Figure 8. MT acquisition points overlaid with Blawan geological map. Rock formations in the study area are divided into three types. The Ijen Caldera Complex Air Fall Deposits (KKjp) are thought to have resulted from pyroclastic fall deposits from several eruption points (Mt. Blau, Mt. Ijen, Mt.
Figure 8. MT acquisition points overlaid with Blawan geological map. Rock formations in the studyarea are divided into three types. The Ijen Caldera Complex Air Fall Deposits (KKjp) are thought tohave resulted from pyroclastic fall deposits from several eruption points (Mt. Blau, Mt. Ijen, Mt. Rante,and Mt. Suket). Blawan Lake Sediment (Bl sd) is characterized as intermediate between shale and sand,and some travertine sediments which contain fossils. The Blawan-Kalisengon avalanche debris depositis composed of sediment from Lake Blawan and lava flows of Mt. Ringgih and Mt. Blau.
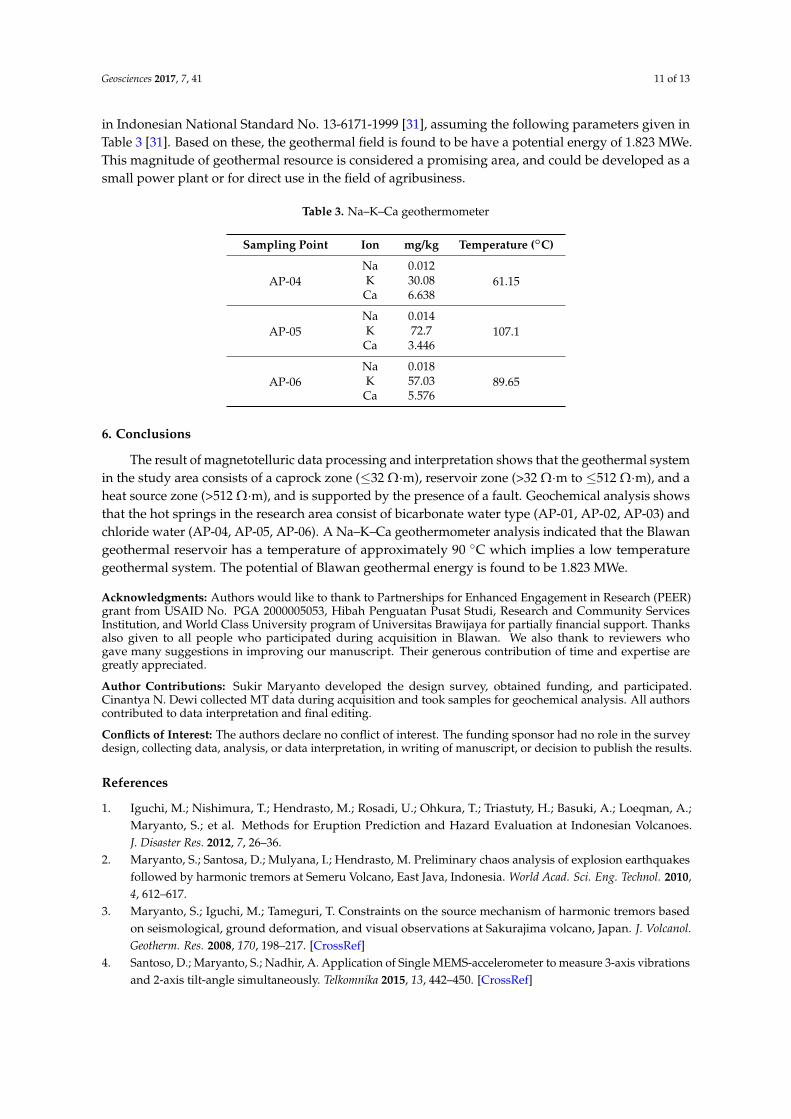
We used a Na–K–Ca geothermometer to determine the reservoir temperature, since thisgeothermometer is suitable for low enthalpy geothermal system with high Ca and almost no Al contentas in found at Blawan. This geothermometer has a high accuracy for hot springs that are at mediumtemperature and not completely in equilibrium as in Blawan. It also gives a low error calculation forunsteady reservoirs. We used the Fournier & Truesdell (1973) Na–K–Ca geothermometer equation [29](Equation 2 below). Alternative geothermometers, such as the Na–K geothermometer are not suitablefor the Blawan hot spring conditions with its high-Ca content and where log ((Ca0.5/Na) + 2.06)is positive. The Na–K geothermometer requires a low Ca content and a negative value for log((Ca0.5/Na) + 2.06). Additionally, the Na–K geothermometer is applicable for reservoirs that havetemperature ranges from 180 to 350 C [30].
Because the chloride hot springs are the most representative for determining the reservoircondition [21], we used our chloride water samples from AP-04, AP-05, and AP-06 for ourgeothermometer analysis. The temperature of the reservoir from which the chloride water wasderived is given by
TC =1647
log(Na/K) + β(
log(√
Ca/Na)+ 2.06
)+ 2.47
− 273.15 (2)
This indicated that our inferred temperature at depth is approximately 90 C which, according toHochstein et al. [24], (Table 3), is classified as low temperature [7,21].
An estimate of the geothermal potential energy was carried out to evaluate the possible geothermalcapacity of the Blawan geothermal field. Potential energy estimation is based on the volumetric method
Geosciences 2017, 7, 41 11 of 13
in Indonesian National Standard No. 13-6171-1999 [31], assuming the following parameters given inTable 3 [31]. Based on these, the geothermal field is found to be have a potential energy of 1.823 MWe.This magnitude of geothermal resource is considered a promising area, and could be developed as asmall power plant or for direct use in the field of agribusiness.
Table 3. Na–K–Ca geothermometer
Sampling Point Ion mg/kg Temperature (C)
AP-04Na 0.012
61.15K 30.08Ca 6.638
AP-05Na 0.014
107.1K 72.7Ca 3.446
AP-06Na 0.018
89.65K 57.03Ca 5.576
6. Conclusions
The result of magnetotelluric data processing and interpretation shows that the geothermal systemin the study area consists of a caprock zone (≤32 Ω·m), reservoir zone (>32 Ω·m to ≤512 Ω·m), and aheat source zone (>512 Ω·m), and is supported by the presence of a fault. Geochemical analysis showsthat the hot springs in the research area consist of bicarbonate water type (AP-01, AP-02, AP-03) andchloride water (AP-04, AP-05, AP-06). A Na–K–Ca geothermometer analysis indicated that the Blawangeothermal reservoir has a temperature of approximately 90 C which implies a low temperaturegeothermal system. The potential of Blawan geothermal energy is found to be 1.823 MWe.
Acknowledgments: Authors would like to thank to Partnerships for Enhanced Engagement in Research (PEER)grant from USAID No. PGA 2000005053, Hibah Penguatan Pusat Studi, Research and Community ServicesInstitution, and World Class University program of Universitas Brawijaya for partially financial support. Thanksalso given to all people who participated during acquisition in Blawan. We also thank to reviewers whogave many suggestions in improving our manuscript. Their generous contribution of time and expertise aregreatly appreciated.
Author Contributions: Sukir Maryanto developed the design survey, obtained funding, and participated.Cinantya N. Dewi collected MT data during acquisition and took samples for geochemical analysis. All authorscontributed to data interpretation and final editing.
Conflicts of Interest: The authors declare no conflict of interest. The funding sponsor had no role in the surveydesign, collecting data, analysis, or data interpretation, in writing of manuscript, or decision to publish the results.
References
1. Iguchi, M.; Nishimura, T.; Hendrasto, M.; Rosadi, U.; Ohkura, T.; Triastuty, H.; Basuki, A.; Loeqman, A.;Maryanto, S.; et al. Methods for Eruption Prediction and Hazard Evaluation at Indonesian Volcanoes.J. Disaster Res. 2012, 7, 26–36.
2. Maryanto, S.; Santosa, D.; Mulyana, I.; Hendrasto, M. Preliminary chaos analysis of explosion earthquakesfollowed by harmonic tremors at Semeru Volcano, East Java, Indonesia. World Acad. Sci. Eng. Technol. 2010,4, 612–617.
3. Maryanto, S.; Iguchi, M.; Tameguri, T. Constraints on the source mechanism of harmonic tremors basedon seismological, ground deformation, and visual observations at Sakurajima volcano, Japan. J. Volcanol.Geotherm. Res. 2008, 170, 198–217. [CrossRef]
4. Santoso, D.; Maryanto, S.; Nadhir, A. Application of Single MEMS-accelerometer to measure 3-axis vibrationsand 2-axis tilt-angle simultaneously. Telkomnika 2015, 13, 442–450. [CrossRef]
Geosciences 2017, 7, 41 12 of 13
5. Konstantinuo, K.I.; Perwita, C.A.; Maryanto, S.; Budianto, A.; Hendrasto, M. Maximal Lyapunov exponentvariations of volcanic tremor recorded during explosive and effusive activity at Mt. Semeru volcano,Indonesia. Nonlinear Process. Geophys. 2013, 20, 1137–1145. [CrossRef]
6. Van Hinsberg, V.; Berlo, K.; van Bergen, M.; Jones, A. Extreme alteration by hyperacidic brines at Kawah Ijenvolcano, East Java, Indonesia: I. Textural and mineralogical imprint. J. Volcanol. Geotherm. Res. 2010, 198,253–263. [CrossRef]
7. Van Bergen, M.; Bernard, A.; Sumarti, S.; Sriwana, T.; Sitorus, K. Crater Lake of Java: Dieng, Kelud, and Ijen.Excursion Guidebook; IAVCEI General Assembly: Bali, Indonesia, 2000.
8. Karlina, I.; Maryanto, S.; Rachmansyah, A. Distribution of hot springs Blawan-Ijen based on geoelectricitydata. J. Nat. B 2013, 2, 164–171.
9. Mauri, G. Multi-Scale Analysis of Multiparameter Geophysical and Geochemical Data from Active VolcanicSystems. Unpublished Ph.D. Thesis, Simon Fraser University, Burnaby, BC, Canada, 2009.
10. Sitorus, K. Volcanic Stratigraphy and Geochemistry of the Idjen Caldera Complex, East Java, Indonesia.Unpublished MSc Thesis, University of Wellington, Wellington, New Zealand, 1990.
11. Van Hisberg, V. Water-Rock Interaction and Element Fluxes in the Kawah Ijen Hyperacid Crater Lake andthe Banyu Pahit River, East Java, Indonesia. Unpublished Master’s Thesis, Utrecht University, Utrecht, TheNetherlands, 2001.
12. Berlo, K. The Magmatic Evolution of the Ijen Caldera, East Java, Indonesia. Unpublished Master’s Thesis,Utrecht University, Utrecht, The Netherlands, 2001.
13. Carn, S. Application of Synthetic Aperture Radar (SAR) imagery to volcano mapping in the humid tropics:A case study in East Java, Indonesia. Bull. Volcanol. 1999, 61, 92–105. [CrossRef]
14. Zaennudin, A.; Wahyudin, D.; Surmayadi, M.; Kusdinar, E. Hazard assessment of Ijen volcanic eruption EastJava. J. Environ. Geol. Hazard 2012, 3, 109–132.
15. Raehanayati; Maryanto, S.; Rachmansyah, A. Study of Geothermal Potential in Blawan-Ijen, East Java BasedOn Gravity Method. J. Neutrino 2013, 6, 31–39. (In Indonesian).
16. Afandi, A.; Maryanto, S.; Rachmansyah, A. Identification of Geothermal Reservoir based on MagneticMethod for Blawan Area, Bondowoso. J. Neutrino 2013, 6, 1–10. (In Indonesian).
17. Vozoff, K. The Magnetotelluric method. In Electromagnetic Methods in Applied Geophysics. Volume 2, Application,Parts A and B; Nabighian, M.N., Ed.; Society of Exploration Geophysicists: Tulsa, OK, USA, 1991; pp. 641–711.
18. Gamble, T.; Goubau, W.; Clarke, J. Magnetotellurics with a remote magnetic reference. Geophysics 1979, 44,53–86. [CrossRef]
19. Tikhonov, A.; Arsenin, V. Solutions of Ill-Posed Problems. John Wiley & Sons: New York, NY, USA, 1977.20. Xiao, W. Magnetotelluric Exploration in the Rocky Mountain Foothills. Master’s Thesis, University of
Alberta, Edmonton, AB, Canada, 2004.21. Sukhyar, R.; Gurusinga, C.; Widodo, S.; Munandar, A.; Dahlan, H.M.; Wahyuningsih, R. Potential and
Development of Indonesia Geothermal Resources; Geological Agency of Indonesia: Bandung, Indonesia, 2014.(In Indonesian)
22. Ellis, A.J.; Mahon, W.A. Chemistry and Geothermal System; Academic Press: New York, NY, USA, 1977.23. Delmelle, P.; Bernard, A.; Kusakabe, M.; Fischer, T.; Takano, B. Geochemistry of magmatic-hydrothermal
system of Kawah Ijen volcano, East Java, Indonesia. J. Volcanol. Geotherm. Res. 2000, 97, 31–53. [CrossRef]24. Hochstein, M.; Zheng, K.; Pasvanoglu, S.; Vivian-Neal, P. Advective (heat sweep) geothermal systems.
In Proceedings of the 38th Workshop on Geothermal Reservoir Engineering, Stanford, CA, USA,11–13 February 2013.
25. Kasbani. Type of geothermal systems in Indonesia and potential energy estimation. Bull. Geol. Agency 2009,4, 64–73.
26. Asaue, H.; Koike, K.; Yoshinaga, T.; Takakura, S. Magnetotelluric resistivity modelling for 3D characterizationgeothermal reservoir in the Western Side of Mt. Aso, SW Japan. J. Appl. Geophys. 2005, 58, 296–312.
27. Ussher, G.; Harvey, C.; Johnstone, R.; Anderson, E. Understanding The Resistivities Observed In GeothermalSystems. In Proceedings of the World Geothermal Congress, Kyushu-Tohoku, Japan, May 28–10 June 2000;pp. 1915–1920.
28. Mardiana, U. Geothermal Manifestation of Papandayan Based on Rock Resistivity Value, Case Study Mt. Garut-WestJava; Department of Geology Padjadjaran University: Bandung, Indonesia, 2007.

Geosciences 2017, 7, 41 13 of 13
29. Fournier, R.O.; Truesdell, A.H. An empirical Na–K–Ca geothermometer for natural waters. Geochim.Cosmochim. Acta 1973, 37, 1255–1275. [CrossRef]
30. Ellis, A.J. Chemical Geothermometry in Geothermal Systems. Geothermics 1979, 25, 219–226. [CrossRef]31. National Standardization Agency. Geothermal Energy Potential Estimation Method; Indonesian National
Standard No. 13-6171-1999; National Standard Agency: Jakarta, Indonesia, 1999; pp. 1–9.
© 2017 by the authors. Licensee MDPI, Basel, Switzerland. This article is an open accessarticle distributed under the terms and conditions of the Creative Commons Attribution(CC BY) license (http://creativecommons.org/licenses/by/4.0/).