Embed Size (px)
Citation preview
Magnetic ResonanceSpectroscopy (MRS)and Its Application inAlzheimer’s DiseasePRAVAT K. MANDAL1,2,3
1Department of Psychiatry, Western Psychiatric Institute and Clinic, University of Pittsburgh Medical School,Pittsburgh, Pennsylvania2Center for Neuroscience, University of Pittsburgh Medical School, Pittsburgh, Pennsylvania3Department of Bioengineering, University of Pittsburgh, Pittsburgh, Pennsylvania
ABSTRACT: Magnetic resonance spectroscopy (MRS) is a noninvasive tool to measure
the chemical composition of tissues (in vivo) and characterize functional metabolic proc-
esses in different parts of the human organs. It provides vital biological information at
the molecular level. Combined with magnetic resonance imaging (MRI), an integrated
MRI/MRS examination provides anatomical structure, pathological function, and biochemi-
cal information about a living system. MRS provides a link between the biochemical
alterations and the pathophysiology of disease. This article provides a comprehensive
description of the MRS technique and its application in Alzheimer’s disease (AD)
research. This review is a primer for students and researchers seeking a firm theoretical
understanding of MRS physics as well as its application in clinical AD research. � 2007
Wiley Periodicals, Inc. Concepts Magn Reson Part A 30A: 40–64, 2007
KEY WORDS: MRS; MRI; PRESS; STEAM; 2D MRS; Alzheimer’s disease
I. INTRODUCTION
Magnetic resonance spectroscopy (MRS) is a rap-
idly developing field of neuroimaging that allows
noninvasive in vivo analysis of metabolites. It
selectively excites a small volume of tissue (voxel)
using gradients, then records the free induction
decay (FID) and produces a spectrum from the FID
originating from that voxel. In the 1980s the first
MR spectrum from living brain was published, and
studies were performed on patients with stroke or
brain tumors (1–3). Over the past two decades,
MRS has been performed on patients with a wide
range of neurological and psychiatric disorders so
as to increase the understanding of the pathological
mechanisms of these disorders. MRS is also applied
to monitor long-term changes with or without drug
therapy and to identify differences between diag-
nostic groups.
Received 1 August 2006; revised 12 October 2006;
accepted 12 October 2006
Correspondence to: Dr. Pravat K. Mandal; E-mail: [email protected]
Concepts in Magnetic Resonance Part A, Vol. 30A(1) 40–64 (2007)
Published online in Wiley InterScience (www.interscience.wiley.com). DOI 10.1002/cmr.a.20072
� 2007 Wiley Periodicals, Inc.
40

MRS is a nondestructive technique, which does not
require any ionizing radiation. It provides a wealth of
information (in vivo) on various neurometabolites
from a single experiment. It does not require metabo-
lite isolation or sample treatment, as required by mass
spectrometry or other analytical methods. In recent
years, there have been a number of technical advances
concerning both the implementation of different MRS
pulse sequences, data processing, and commercial
availability of more sophisticated high-field scanners.
MRS techniques have been developed and applied
extensively in brain research (4). The brain has mul-
tiple levels of compartmentation ranging from the
type of cellular compartment (neuron versus astro-
cyte) to the type of tissue compartment (the gray
matter vs. the white matter) to distinct central nerv-
ous systems and brain functions. These compart-
ments are highly integrated and work together to
attain various brain functions. MRS is useful in
understanding the neurochemical changes in the
brain due to different physiological processes. The
extensive numbers of MRS applications have been
reported exclusively in the brain due to the lack of
motion artifacts in the brain. In addition, the brain is
more or less spherical; hence, it is easier to adjust the
high degree of homogeneous magnetic field by shim-
ming for MRS studies. However, there are suscepti-
bility differences in the brain between the intracellu-
lar and extracellular space.
The unique applications of MRS in brain research
are (1) quantification of oxidative state of the brain
and defining neuronal death; (2) accessing and map-
ping neuronal damage; (3) evaluating membrane
alteration and characterizing encephalopathies (dis-
turbances in brain functioning, particularly in intel-
lectual activity or higher cortical functioning). MR
spectroscopy enables detection of abnormalities in
several neurodegenerative diseases, such as Alzhei-
mer’s disease (AD), and plays an important role in
research studies of dementia (5, 6). However, despitethese advances, there is still a large gap between the
MRS techniques development and the challenge of
implementing them in a hospital environment for
diagnostic purposes (7, 8).
The Basics of MRS
The fundamental basis of MRS is governed by the
same principles of nuclear magnetic resonance (NMR)
(9–21). MRS requires a magnetic field and a radio fre-
quency (RF) transmit pulse at a particular resonant fre-
quency to observe the signal of a specific nuclei (e.g.,1H, 31P, 13C etc.) in the region of interest (Table 1).
The product of MRS is a ‘‘spectrum’’ with a frequency
axis in parts per million (ppm) and a signal amplitude
axis (22–28). The signal amplitude (area) is a measure
of a particular metabolite concentration. Specific
nuclei (e.g., 1H, 31P, 13C, and so on) from the metabo-
lite, depending on their characteristic signature, give
rise to either a single peak or multiple peaks that are
uniquely positioned along the frequency axis (X axis),
known as the chemical shift. The dispersion of chemi-
cal shift (along the X axis) increases with magnetic
field strength. The peak amplitude (area) that is
directly related to the concentration of that assigned
metabolite is displaced along the Y axis. In vivo 1H-
MRS and 31P-MRS are the most widely used applica-
tions of MRS, but other atoms that are used for MRS
studies include 13C, 15N, 19F, and 23Na. Major metabo-
lites detected by 1H MRS are as follows:
� N-acetyl aspartate (NAA) is a neuronal marker
seen only in nervous tissue.
� Glutamate (Glu) and glutamine (Gln) complex
is a mixture of peaks that helps to monitor
glutamate metabolism in the brain for chronic
epileptic activities.
� Lactate is a highly specific marker of cell
death as well as tissue necrosis.
� Creatine (Cr) is thought to be a marker of
energetic status of cells.
� Choline (Cho), an indicator of membrane ac-
tivity, is often elevated in the presence of ma-
lignant processes.
Table 1 Nuclei Used for MRS In Vivo
Nucleus Name
Spin
Number
Frequency
v at B0 ¼ 1.5 Tesla
Inherent Sensitivity
at Const. Field (1H ¼ 1)
Natural
Abundance (%)
1H Hydrogen (protons) 12
63.87 1 99.98513C Carbon 1
216.06 0.0159 1.108
19F Fluorine 12
60.08 0.833 10023Na Sodium 3
216.89 0.0925 100
31P Phosphorus 12
25.85 0.0663 10035Cl Chlorine 3
26.26 0.0047 75.53
39K Potassium 32
2.98 0.00051 93.08
MRS AND ITS APPLICATION IN ALZHEIMER’S DISEASE 41
Concepts in Magnetic Resonance Part A (Bridging Education and Research) DOI 10.1002/cmr.a
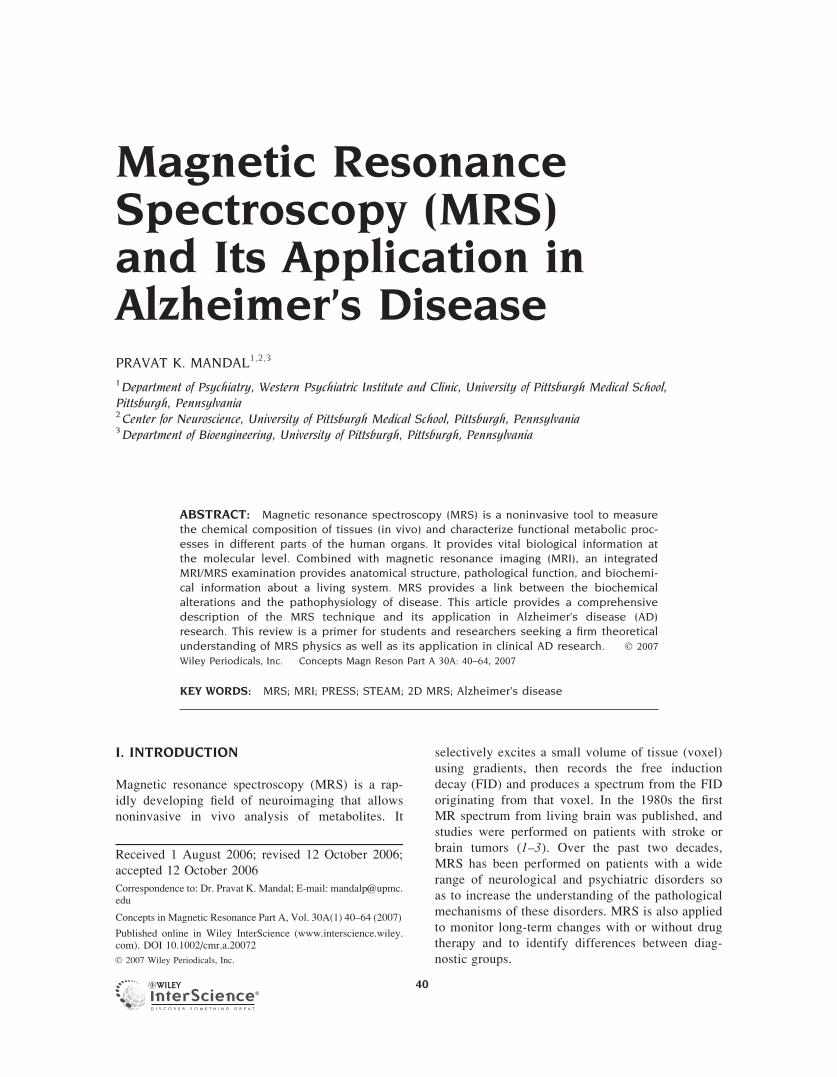
� Myo-inositol (mI), a sugar alcohol, is a marker
of astrocytic activity and is often higher in
conditions such as AD and malignant tumors.
In recent years, there has been more interest in 1H
MRS, particularly after it was demonstrated that it was
possible to obtain high-resolution spectra from small,
well-defined regions in reasonably short scan times.
The higher sensitivity of the proton is due to several fac-
tors, including higher gyromagetic ratio, higher metab-
olite concentrations, and favorable 1H relaxation times.
Although the sensitivity of 31P MRS is less than 1H
MRS, 31P MRS provides insights into the biochemistry
not available by 1H MRS (29, 30). 31P MRS detects
high-energy metabolites: adenosine triphosphate
(ATP), phosphocreatine (PCr), and inorganic phosphate
(Pi). 31P MRS allows noninvasive assessment of vari-
ous fundamental biochemical, physiological, and
energy intensive metabolic events occurring inside the
brain (31, 32). The steady-state phosphate signals as
well as other physiological parameters detected by in
vivo 31P MRS have been used extensively in clinical
studies and linked to numerous diseases such as AD
(33), epilepsy (34, 35), migraine, brain ischemia, and
seizure (36). Figure 1 represents a typical 1H and 31P
MRS spectrum of the brain at 7 Tmagnetic field.
To enhance the signal-to-noise ratio (SNR) of the
MR spectrum, the pulse sequence and the parameters
are adjusted to minimize signal intensity loss due to
T2 (transverse) and T1 (longitudinal) relaxation of the
nuclei (e.g., 1H, 31P, and 13C). As mentioned previ-
ously, the MRS technique is applied in conjunction
with MRI, and both techniques share similarities and
differences as outlined below.
Similarities with MRI
� The same scanner is used for both MRI and
MRS studies. A schematic diagram of a scan-
ner is shown in Fig. 2.
Figure 1 (A) 1H MRS spectrum (97) and (B) 31P MR spectrum (32) from parietal white matter
at 7 T in normal human brain using STEAM pulse sequence. Inset indicates voxel location.
42 MANDAL
Concepts in Magnetic Resonance Part A (Bridging Education and Research) DOI 10.1002/cmr.a

� Both techniques are based on the same physi-
cal principles (i.e., the detection of energy ex-
change between external magnetic fields and
specific nuclei within the tissue).
� Both techniques use a magnetic field instead
of radiation. Generally, the patient is placed
supine (face up) inside the scanner. A special
RF coil is placed around the patient’s head
and MRI/MRS experiments are performed.
� Both techniques extensively use gradients for
spatial localization and dephasing the unwanted
magnetization.
� MRI and multiple-voxel MRS experiments both
use phase-encoding gradients (Fig. 3).
Differences with MRI
� In MRI, the magnetic field is used to create
images based on proton signals from water con-
tent among tissues and organs. MRI images con-
tain anatomical information based on the distri-
bution of protons (from water) as well as the rel-
ative proton relaxation rates in various tissues.
� In MRS, magnetic field is used for creating a
graph. This graph consists of various peaks, each
of which represents a specific metabolite in the
specific region of interest. The presence or ab-
sence, as well as increase or decrease in peak area,
provide insight into various neurochemical proc-
esses occurring in the tissue.
� MRS is generally less sensitive thanMRI because
the concentrations of nuclei (1H, 31P, and so on
from the neurometabolites) as measured by MRS
are orders of magnitude less concentrated com-
pared to the concentration of hydrogen (from
water) generally involved inMRI.
� MRI provides information on the physical-chem-
ical state of tissues, flow diffusion, and motion.
MRS provides chemical composition of tissues
from the particular region of interest.
Figure 3 (A) Normal magnetic field gradient and (B)
phase-coding magnetic field gradients that allow the
encoding of the spatial signal location along a second
dimension by different spin phases. Amplitude is kept
fixed in a normal magnetic field gradient. In phase-encod-
ing gradient, amplitude is typically varied from a mini-
mum value of �KPE to maximum value of þKPE in N
steps, where KPE refers to the amplitude of the phase-
encoding gradient. The spatial resolution is directly
related to the number of phase-encoding steps.
Figure 2 (A) Scanner. (B) The components of a scanner used for MRS and MRI studies.
MRS AND ITS APPLICATION IN ALZHEIMER’S DISEASE 43
Concepts in Magnetic Resonance Part A (Bridging Education and Research) DOI 10.1002/cmr.a

� Common uses of MRI include the detection of
AD, stroke versus tumor, recurrent or residual tu-
mor following therapy versus successfully treated
tumor, infection or abscess, and many others.
MRS does not diagnose a given condition, but
rather provides additional data to aid in diagnosis,
and it must be interpreted along with clinical his-
tory and other imaging studies, such asMRI.
� In MRI, readout gradient (frequency encoding) is
turned on during data acquisition time. In MRS,
no frequency-encoding gradients are necessary
during data collection due to inherent chemical
shift difference of the nuclei (e.g., 1H, 31P, 13C,
etc.) in a given tissue volume.
� In a single-voxel MRS experiment there is no
application of phase-encoding gradient, whereas
phase encoding gradient is necessary for MRI to
record spatial map.
II. COMPONENTS OF MRS TECHNIQUE
Some of the integral components of MRS technology
are radio-frequency source, gradients, slice selection,
and phase encoding.
Radio Frequency Source
The RF coil is responsible for generating and broad-
casting the RF energy. Specialized coils are used to
provide improved resolution in the surface regions of
the patient. It contains four main components: a fre-
quency synthesizer, a digital envelope of RF frequen-
cies, a high power amplifier, and a coil or antenna.
The final component of the RF system is the trans-
mitter coil. Most MRS systems use a saddle coil to
produce uniform RF fields over large volumes (e.g.,
body or head). This design is useful to produce uni-
form RF penetration and to generate an effective B1
field perpendicular to Bo even though the coil open-
ing is parallel to Bo. Two types of coil polarity are
used, linearly polarized (LP) and circularly polar-
ized (CP).
RF coils have two categories: volume and surface
coil. Volume coils are typically cylindrical shaped, a
popular example being a birdcage coil. Surface coils
are subdivided into a single-loop coil or an array coil.
Volume coils transmit and receive radio-frequency
pulses and are called ‘‘trans-receivers.’’ Surface coils
generally receive signals only and are traditionally
used to improve signal-to-noise ratio. Unlike MRI
studies, most spectroscopic measurements deposit lit-
tle RF power to the patient, and specific absorption
rate (SAR) limitations are infrequent in MRS due to
long TR (repetition time) used in MR protocol. One
important exception is 1H-decoupled MRS studies,
which are particularly RF intensive and may be lim-
ited by RF heating concerns.
Gradient Coils
Gradient coils are used to apply gradients to the main
Bo field in X, Y, and Z directions. The gradient GZ is
applied along the long axis of the patient to select a
slice (transverse section). This GZ gradient is usually
supplied by a pair of Helmholz coils and has a typical
value of �1 mT m�1. The change in Bo from one
end of the patient to the other will be of the order
1:1000. The coils for GY and GZ gradients are usu-
ally saddle shaped similar to the RF coils. These gra-
dients allow the creation of a two-dimensional (2D)
image of a particular slice. In practice, gradients can
be applied in any desired direction by software con-
trol of the electronics. The gradients GX, GY, and GZ
are generally switched on and off for a certain length
of time in the complex pulse sequences of operations
used for MRS studies. The mechanical stress pro-
duced on the various gradient coils by rapidly chang-
ing magnetic fields in MRS pulse sequences accounts
for the strange noises often reported by patients
undergoing MRS studies.
Gradient Methodology
The flow of electrical current through the gradient
coils produces gradient fields. These gradient fields are
applied in short bursts of pulses. The number, duration,
and amplitude of the gradient pulse are determined by
the particular pulse sequence and measurement param-
eters in the protocol. Continuous linear field homoge-
neity is made using gradient offset currents.
There are four characteristics to describe gradient
system performance: maximum gradient strength;
duty cycle; rise time and slew rate; and techniques
for eddy current compensation. The major complica-
tion of gradient pulses for spectroscopic studies is
eddy currents. Eddy currents are produced in
response to a changing magnetic field (gradient
pulse). Most eddy currents decay with shorter time
constants compared with the time between the end of
the gradient pulse and the beginning of data collec-
tion. Spectroscopic studies are particularly sensitive
to eddy currents. In some instances, additional post-
acquisition corrections are necessary to obtain well-
resolved resonances.
Larger gradient strength allows for better spatial
resolution. The duty cycle of the gradient amplifier is
another important measure of gradient performance.
The duty cycle determines how fast an amplifier can
respond to the demands of a pulse sequence. Large
44 MANDAL
Concepts in Magnetic Resonance Part A (Bridging Education and Research) DOI 10.1002/cmr.a
duty cycles allow high-amplitude gradient pulses
between very short interpulse delays.
Selection of Magnetization by Gradients. Gradients
are used extensively for two purposes, either rephas-
ing (selection) (37) or dephasing (elimination) (38)of a particular magnetization transfer pathway (21).Whenever gradients are applied in a particular direc-
tion (for simplicity’s sake, it is assumed here that
gradients are applied along the Z direction), it gener-
ates a phase factor associated with the coherence
level. It is convenient to re-express the Cartesian
operators IX and IY in terms of raising and lowering
operators Iþ and I�, respectively, to describe the
effects of field gradients to rephase transverse mag-
netization and removal of artifacts generated due to
imperfect 1808 pulse (38).
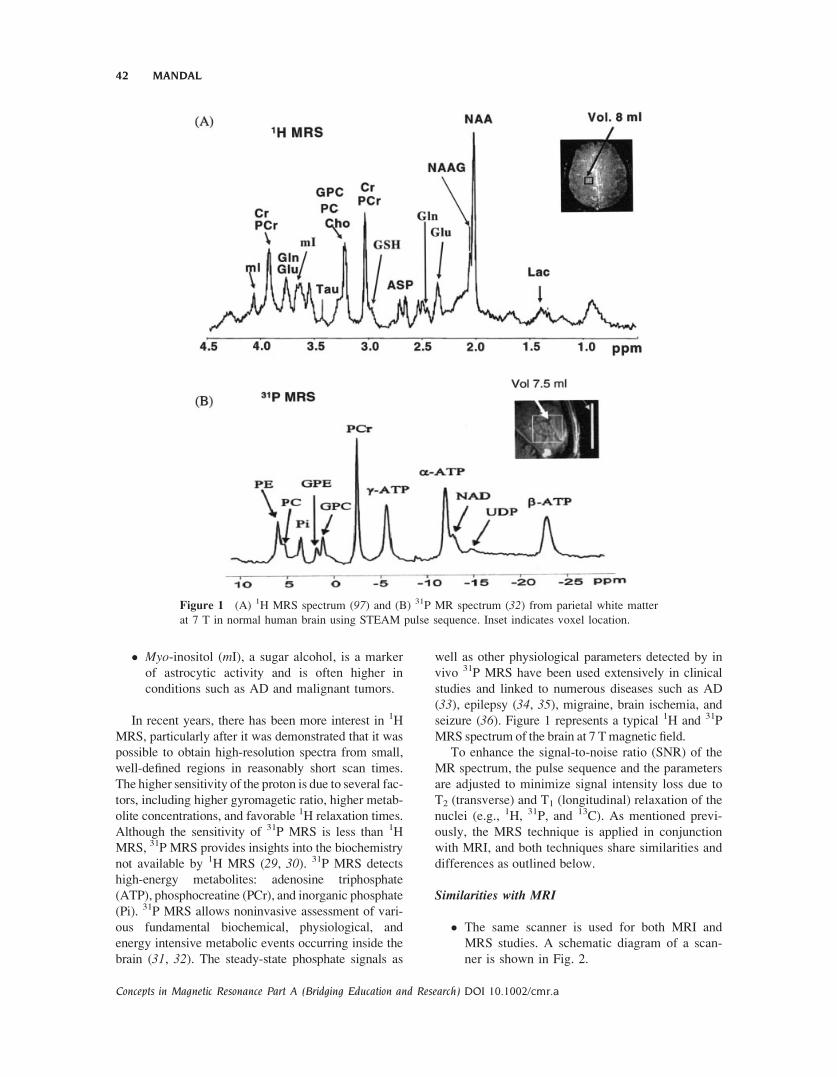
Rephasing of Transverse Magnetization. If two gra-
dients with the same strength, shape, duration, and po-
larity are applied on either side of a 1808 pulse, trans-verse magnetization is refocused (Fig. 4). Details of
operator formalism are provided in the appendix (21).The rephasing of magnetization is an important appli-
cation of gradients and it can be explained by analyz-
ing the magnetization at different points in Fig. 4.
ða ! bÞ IZ �!90�x �IY ¼ � 1
2iIþ � I
�½ �
�!g1GrtIz � 1
2iIþe�ig1GrtIz � I�eþig1GrtIz� �
ðb ! cÞ �!180�Ix � 1
2iI�e�ig1GrtIz � Iþeþig1GrtIz� �
ðc ! dÞ �!g1GrtIz � 1
2iI�e�ig1GrtIzeþig1GrtIz�
� Iþe�ig1GrtIzeþig1GrtIz� ¼ þ 1
2iIþ � I�½ � [1]
The net phase acquired after 2t is zero and we get
back the same transverse magnetization (Iþ � I�) thatwe started with, where G is the gradient strength, t isthe duration of gradient application, and r is the dis-
tance from the gradient isocenter. gH is the nuclear
gyromagnetic ratio of proton.
Removal of Unwanted Magnetization Due to anImperfect 1808 Pulse. This application is critical to
remove unwanted magnetization due to an imperfect
1808 pulse and it can be explained by analyzing the
magnetization at different points in Fig. 4.
ða ! bÞ IZ �!90�x �IY ¼ � 1
2iIþ � I�½ �
�!g1GrtIz � 1
2iIþe�ig1GrtIz � I�eþig1GrtIz� �
ðb ! cÞ ð180þ yÞIximperfect pulse
!
� 1
2iCosy Iþe�ig1GrtIz � I�eþig1GrtIz
� �
� 1
2Iz e�ig1GrtIz � eþig1GrtIz� �
ðc ! dÞ �!�g1GrtIz � 1
2iCosy Iþe�ig1GrtIzeþig1GrtIz
�
� I�e�ig1GrtIzeþig1GrtIz�� 1
2iCosy
1
2iIþ � I�½ �
� 1
2Iz e�ig1GrtIz � eþig1GrtIz� � ¼ � 1
2iIþ � I�½ �
� 1
2Iz e�ig1GrtIz � eþig1GrtIz� �
[2]
Any magnetization associated with a phase factor
experiences different gradient strength, and the over-
all integrals become zero. Hence, at the end of 2t,longitudinal magnetization (Iz) associated with the
phase factor will be dephased.
Spatial Encoding and Slice Selection
In MRS, quantification of metabolites from a particular
region of the body is the primary objective, and the
selection of the specific region of the body is accom-
plished with the help of slice-selecting gradients,
known as spatial encoding. Slice selection is achieved
by applying a one-dimensional, constant magnetic field
gradient. At the same time, a selective 908 pulse is
applied. Application of this selective 908 pulse in con-
junction with a magnetic field gradient will rotate spins
that are located in a slice or a plane through the object.
Figure 5 illustrates the slice selection using appli-
cation of a selective 908 pulse in the presence of field
gradient GZ. The selective 908 pulse excites only a
narrow frequency range (Do), and this narrow tissue
slice in the Z direction (DZ) is sampled for analysis
as indicated by the shaded area in Fig. 5.
The magnitude of the slice select gradient deter-
mines the difference in precession frequency between
the two points of the gradient. Steep gradient slopes
Figure 4 Application of pulsed field gradient to rephase
transverse magnetization by 1808 pulse and elimination of
unwanted magnetization due to imperfect 1808. The gra-
dients are placed symmetrically from the 1808 pulse. Mag-
netization at various points (a–d) are explained in the text.
MRS AND ITS APPLICATION IN ALZHEIMER’S DISEASE 45
Concepts in Magnetic Resonance Part A (Bridging Education and Research) DOI 10.1002/cmr.a
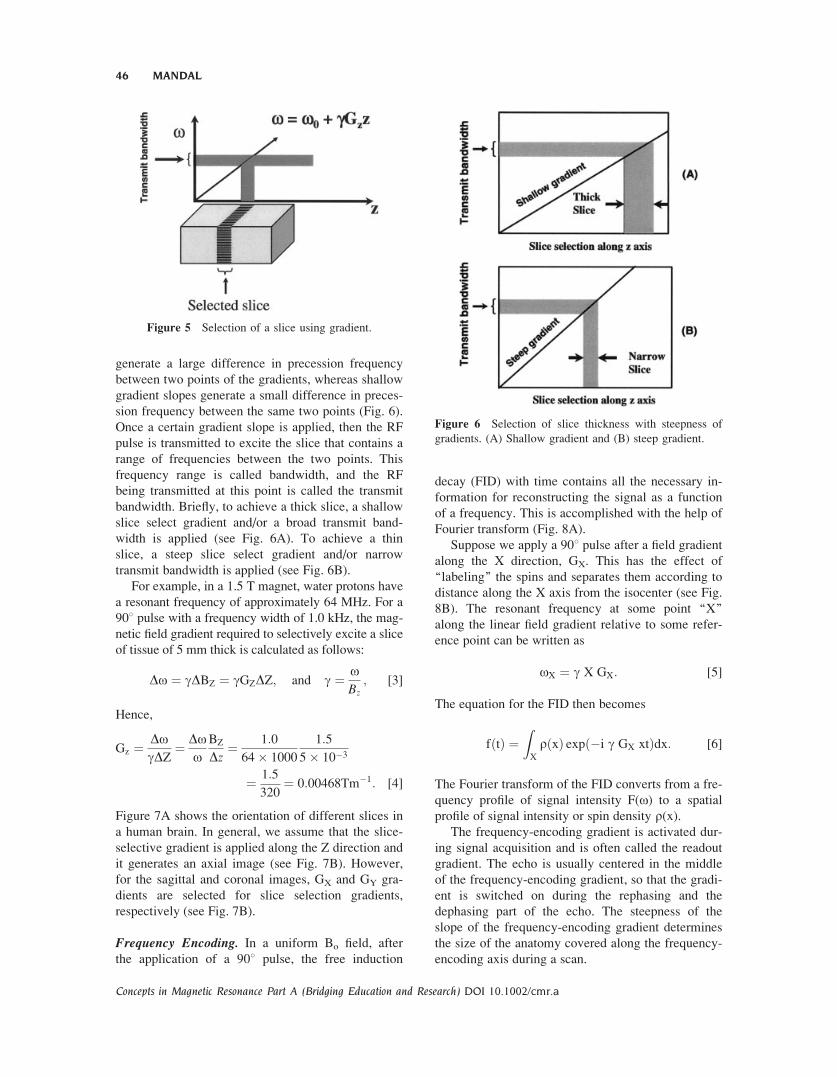
generate a large difference in precession frequency
between two points of the gradients, whereas shallow
gradient slopes generate a small difference in preces-
sion frequency between the same two points (Fig. 6).
Once a certain gradient slope is applied, then the RF
pulse is transmitted to excite the slice that contains a
range of frequencies between the two points. This
frequency range is called bandwidth, and the RF
being transmitted at this point is called the transmit
bandwidth. Briefly, to achieve a thick slice, a shallow
slice select gradient and/or a broad transmit band-
width is applied (see Fig. 6A). To achieve a thin
slice, a steep slice select gradient and/or narrow
transmit bandwidth is applied (see Fig. 6B).
For example, in a 1.5 T magnet, water protons have
a resonant frequency of approximately 64 MHz. For a
908 pulse with a frequency width of 1.0 kHz, the mag-
netic field gradient required to selectively excite a slice
of tissue of 5 mm thick is calculated as follows:
Do ¼ gDBZ ¼ gGZDZ; and g ¼ oBz
; [3]
Hence,
Gz ¼ DogDZ
¼ Doo
BZ
Dz¼ 1:0
64� 1000
1:5
5� 10�3
¼ 1:5
320¼ 0:00468Tm�1: [4]
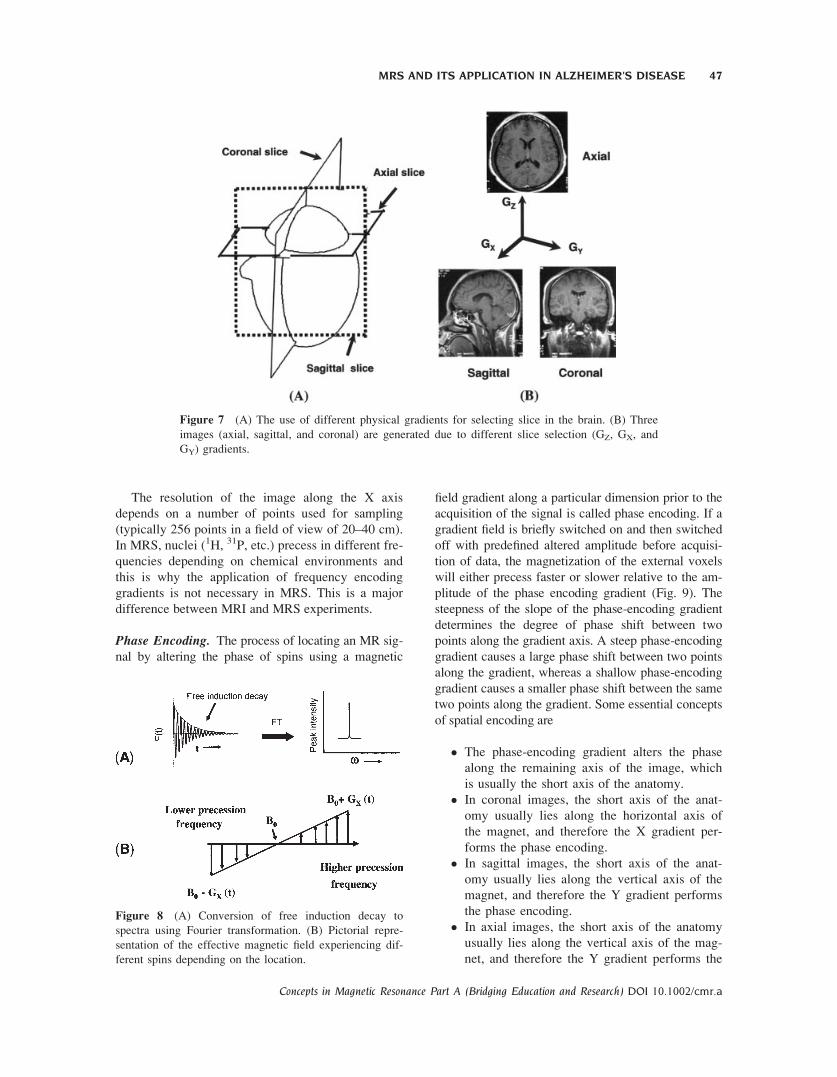
Figure 7A shows the orientation of different slices in
a human brain. In general, we assume that the slice-
selective gradient is applied along the Z direction and
it generates an axial image (see Fig. 7B). However,
for the sagittal and coronal images, GX and GY gra-
dients are selected for slice selection gradients,
respectively (see Fig. 7B).
Frequency Encoding. In a uniform Bo field, after
the application of a 908 pulse, the free induction
decay (FID) with time contains all the necessary in-
formation for reconstructing the signal as a function
of a frequency. This is accomplished with the help of
Fourier transform (Fig. 8A).
Suppose we apply a 908 pulse after a field gradient
along the X direction, GX. This has the effect of
‘‘labeling’’ the spins and separates them according to
distance along the X axis from the isocenter (see Fig.
8B). The resonant frequency at some point ‘‘X’’
along the linear field gradient relative to some refer-
ence point can be written as
oX ¼ g X GX: [5]
The equation for the FID then becomes
fðtÞ ¼ZX
rðxÞ expð�i g GX xtÞdx: [6]
The Fourier transform of the FID converts from a fre-
quency profile of signal intensity F(o) to a spatial
profile of signal intensity or spin density r(x).The frequency-encoding gradient is activated dur-
ing signal acquisition and is often called the readout
gradient. The echo is usually centered in the middle
of the frequency-encoding gradient, so that the gradi-
ent is switched on during the rephasing and the
dephasing part of the echo. The steepness of the
slope of the frequency-encoding gradient determines
the size of the anatomy covered along the frequency-
encoding axis during a scan.
Figure 6 Selection of slice thickness with steepness of
gradients. (A) Shallow gradient and (B) steep gradient.
Figure 5 Selection of a slice using gradient.
46 MANDAL
Concepts in Magnetic Resonance Part A (Bridging Education and Research) DOI 10.1002/cmr.a
The resolution of the image along the X axis
depends on a number of points used for sampling
(typically 256 points in a field of view of 20–40 cm).
In MRS, nuclei (1H, 31P, etc.) precess in different fre-
quencies depending on chemical environments and
this is why the application of frequency encoding
gradients is not necessary in MRS. This is a major
difference between MRI and MRS experiments.
Phase Encoding. The process of locating an MR sig-
nal by altering the phase of spins using a magnetic
field gradient along a particular dimension prior to the
acquisition of the signal is called phase encoding. If a
gradient field is briefly switched on and then switched
off with predefined altered amplitude before acquisi-
tion of data, the magnetization of the external voxels
will either precess faster or slower relative to the am-
plitude of the phase encoding gradient (Fig. 9). The
steepness of the slope of the phase-encoding gradient
determines the degree of phase shift between two
points along the gradient axis. A steep phase-encoding
gradient causes a large phase shift between two points
along the gradient, whereas a shallow phase-encoding
gradient causes a smaller phase shift between the same
two points along the gradient. Some essential concepts
of spatial encoding are
� The phase-encoding gradient alters the phase
along the remaining axis of the image, which
is usually the short axis of the anatomy.
� In coronal images, the short axis of the anat-
omy usually lies along the horizontal axis of
the magnet, and therefore the X gradient per-
forms the phase encoding.
� In sagittal images, the short axis of the anat-
omy usually lies along the vertical axis of the
magnet, and therefore the Y gradient performs
the phase encoding.
� In axial images, the short axis of the anatomy
usually lies along the vertical axis of the mag-
net, and therefore the Y gradient performs the
Figure 8 (A) Conversion of free induction decay to
spectra using Fourier transformation. (B) Pictorial repre-
sentation of the effective magnetic field experiencing dif-
ferent spins depending on the location.
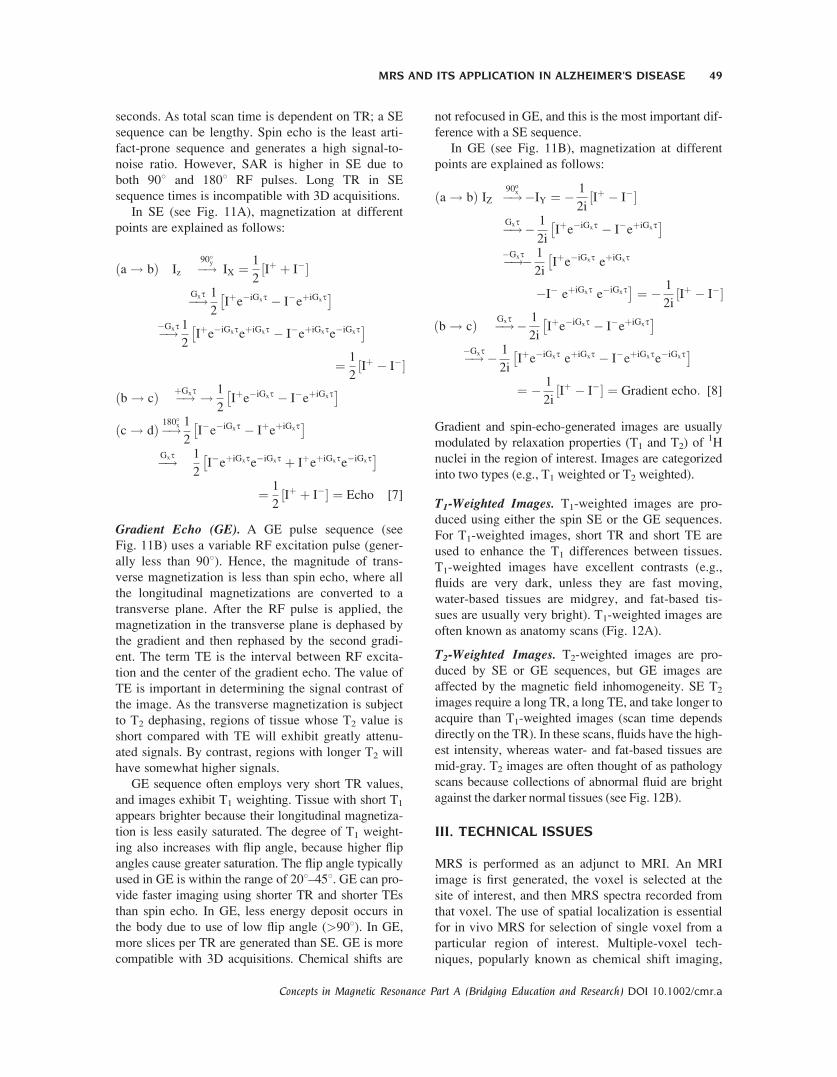
Figure 7 (A) The use of different physical gradients for selecting slice in the brain. (B) Three
images (axial, sagittal, and coronal) are generated due to different slice selection (GZ, GX, and
GY) gradients.
MRS AND ITS APPLICATION IN ALZHEIMER’S DISEASE 47
Concepts in Magnetic Resonance Part A (Bridging Education and Research) DOI 10.1002/cmr.a
phase encoding. However, when imaging the
head, the short axis of the anatomy lies along
the horizontal axis of the magnet, and therefore
the X gradient performs the phase encoding.
A field gradient is applied along the Y direction,
GY as a short pulse, after the RF pulse, but before the
main acquisition time of the FID. This has the effect
of progressively phase shifting the precessing spins
along the Y direction, but without changing the fre-
quency. This labels the spins in a different way, but
to disentangle all the information, the computing pro-
cedure used to reconstruct the second dimension in
the 2D slice requires that the operation be performed
in many steps (typically 256) where the phase encod-
ing amplitude is varied incrementally. This particular
process determines the resolution in the Y direction,
and largely accounts for the long time needed for the
whole imaging experiment.
In the frequency domain (X axis) (Fig. 10), there
is a change in frequency depending on the location of
the voxel. In Figure 10, we have assumed that our
area of interest is subdivided into 5 � 5 matrices.
The amplitude of the phase gradient varies systemati-
cally; as the amplitude varies, the phase of the spin
varies differently as depicted along the phase shift
axis. Frequency encoding is applied in MRS, and it is
provided by the inherent chemical shift differences
of different spins.
Formation of an Image
After getting an image of the brain, a voxel is chosen
in the region of interest for MRS analysis. Generally,
two MRI sequences (e.g., a spin echo or a gradient
echo) are applied for generating an MRI image. A
detailed discussion about these two sequences is
given below.
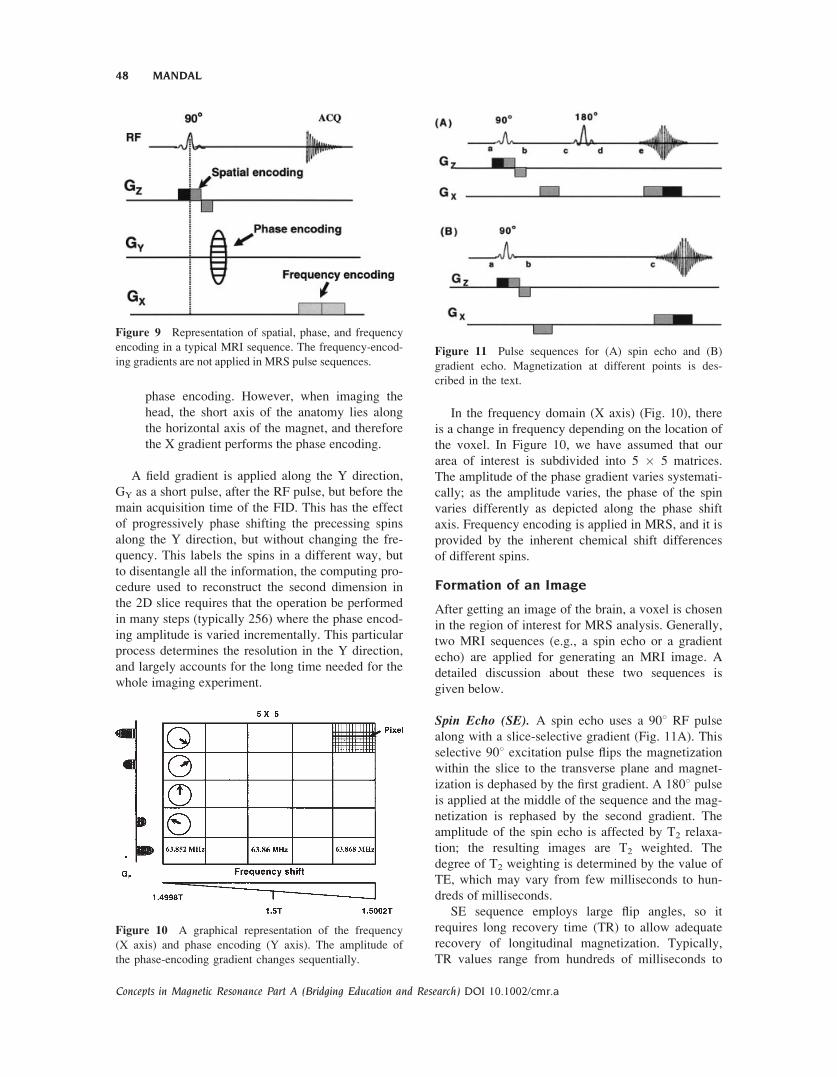
Spin Echo (SE). A spin echo uses a 908 RF pulse
along with a slice-selective gradient (Fig. 11A). This
selective 908 excitation pulse flips the magnetization
within the slice to the transverse plane and magnet-
ization is dephased by the first gradient. A 1808 pulseis applied at the middle of the sequence and the mag-
netization is rephased by the second gradient. The
amplitude of the spin echo is affected by T2 relaxa-
tion; the resulting images are T2 weighted. The
degree of T2 weighting is determined by the value of
TE, which may vary from few milliseconds to hun-
dreds of milliseconds.
SE sequence employs large flip angles, so it
requires long recovery time (TR) to allow adequate
recovery of longitudinal magnetization. Typically,
TR values range from hundreds of milliseconds to
Figure 10 A graphical representation of the frequency
(X axis) and phase encoding (Y axis). The amplitude of
the phase-encoding gradient changes sequentially.
Figure 11 Pulse sequences for (A) spin echo and (B)
gradient echo. Magnetization at different points is des-
cribed in the text.
Figure 9 Representation of spatial, phase, and frequency
encoding in a typical MRI sequence. The frequency-encod-
ing gradients are not applied in MRS pulse sequences.
48 MANDAL
Concepts in Magnetic Resonance Part A (Bridging Education and Research) DOI 10.1002/cmr.a
seconds. As total scan time is dependent on TR; a SE
sequence can be lengthy. Spin echo is the least arti-
fact-prone sequence and generates a high signal-to-
noise ratio. However, SAR is higher in SE due to
both 908 and 1808 RF pulses. Long TR in SE
sequence times is incompatible with 3D acquisitions.
In SE (see Fig. 11A), magnetization at different
points are explained as follows:
ða ! bÞ Iz �!90�y
IX ¼ 1
2Iþ þ I�½ �
�!Gxt 1
2Iþe�iGxt � I�eþiGxt� �
�!�Gxt 1
2Iþe�iGxteþiGxt � I�eþiGxte�iGxt� �
¼ 1
2Iþ � I�½ �
ðb ! cÞ �!þGxt ! 1
2Iþe�iGxt � I�eþiGxt� �
ðc ! dÞ�!180�x 1
2I�e�iGxt � IþeþiGxt� �
�!Gxt 1
2I�eþiGxte�iGxt þ IþeþiGxte�iGxt� �
¼ 1
2Iþ þ I�½ � ¼ Echo [7]
Gradient Echo (GE). A GE pulse sequence (see
Fig. 11B) uses a variable RF excitation pulse (gener-
ally less than 908). Hence, the magnitude of trans-
verse magnetization is less than spin echo, where all
the longitudinal magnetizations are converted to a
transverse plane. After the RF pulse is applied, the
magnetization in the transverse plane is dephased by
the gradient and then rephased by the second gradi-
ent. The term TE is the interval between RF excita-
tion and the center of the gradient echo. The value of
TE is important in determining the signal contrast of
the image. As the transverse magnetization is subject
to T2 dephasing, regions of tissue whose T2 value is
short compared with TE will exhibit greatly attenu-
ated signals. By contrast, regions with longer T2 will
have somewhat higher signals.
GE sequence often employs very short TR values,
and images exhibit T1 weighting. Tissue with short T1
appears brighter because their longitudinal magnetiza-
tion is less easily saturated. The degree of T1 weight-
ing also increases with flip angle, because higher flip
angles cause greater saturation. The flip angle typically
used in GE is within the range of 208–458. GE can pro-
vide faster imaging using shorter TR and shorter TEs
than spin echo. In GE, less energy deposit occurs in
the body due to use of low flip angle (>908). In GE,
more slices per TR are generated than SE. GE is more
compatible with 3D acquisitions. Chemical shifts are
not refocused in GE, and this is the most important dif-
ference with a SE sequence.
In GE (see Fig. 11B), magnetization at different
points are explained as follows:
ða ! bÞ IZ �!90ox �IY ¼ � 1
2iIþ � I�½ �
�!Gxt � 1
2iIþe�iGxt � I�eþiGxt� �
�!�Gxt� 1
2iIþe�iGxt eþiGxt�
�I� eþiGxt e�iGxt� ¼ � 1
2iIþ � I�½ �
ðb ! cÞ �!Gxt � 1
2iIþe�iGxt � I�eþiGxt� �
�!�Gxt� 1
2iIþe�iGxt eþiGxt � I�eþiGxte�iGxt� �
¼ � 1
2iIþ � I�½ � ¼ Gradient echo: [8]
Gradient and spin-echo-generated images are usually
modulated by relaxation properties (T1 and T2) of1H
nuclei in the region of interest. Images are categorized
into two types (e.g., T1 weighted or T2 weighted).
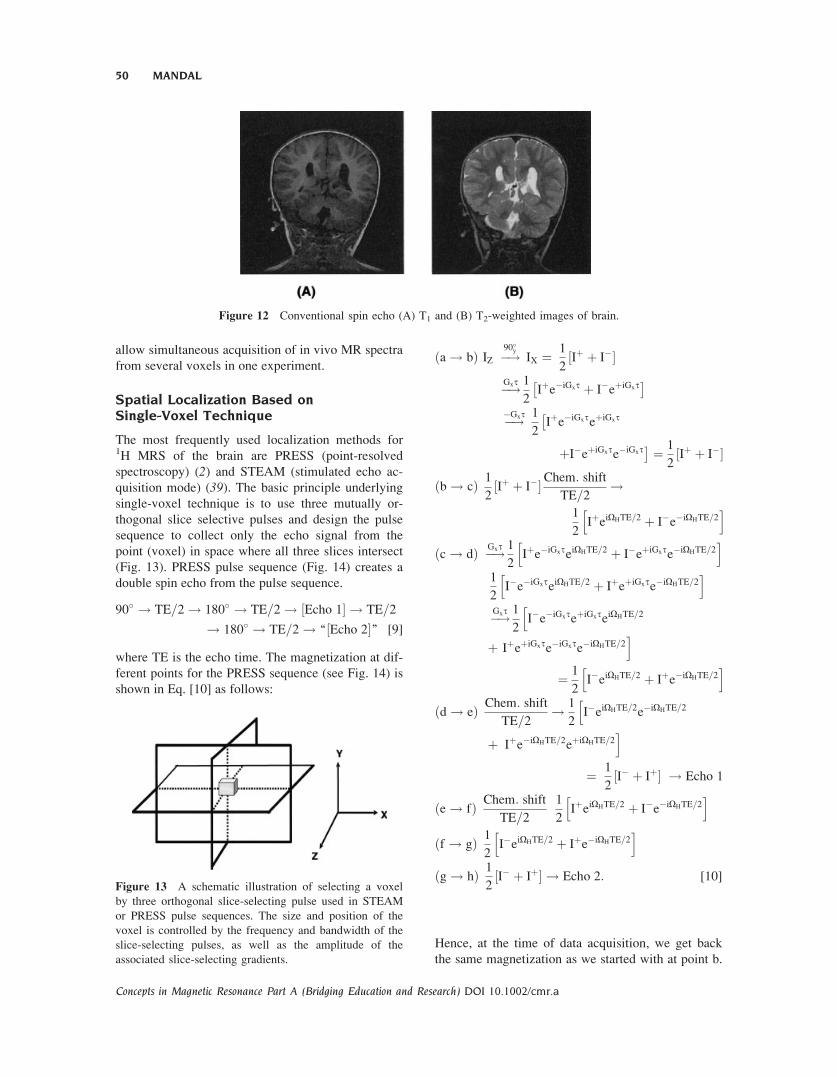
T1-Weighted Images. T1-weighted images are pro-
duced using either the spin SE or the GE sequences.
For T1-weighted images, short TR and short TE are
used to enhance the T1 differences between tissues.
T1-weighted images have excellent contrasts (e.g.,
fluids are very dark, unless they are fast moving,
water-based tissues are midgrey, and fat-based tis-
sues are usually very bright). T1-weighted images are
often known as anatomy scans (Fig. 12A).
T2-Weighted Images. T2-weighted images are pro-
duced by SE or GE sequences, but GE images are
affected by the magnetic field inhomogeneity. SE T2
images require a long TR, a long TE, and take longer to
acquire than T1-weighted images (scan time depends
directly on the TR). In these scans, fluids have the high-
est intensity, whereas water- and fat-based tissues are
mid-gray. T2 images are often thought of as pathology
scans because collections of abnormal fluid are bright
against the darker normal tissues (see Fig. 12B).
III. TECHNICAL ISSUES
MRS is performed as an adjunct to MRI. An MRI
image is first generated, the voxel is selected at the
site of interest, and then MRS spectra recorded from
that voxel. The use of spatial localization is essential
for in vivo MRS for selection of single voxel from a
particular region of interest. Multiple-voxel tech-
niques, popularly known as chemical shift imaging,
MRS AND ITS APPLICATION IN ALZHEIMER’S DISEASE 49
Concepts in Magnetic Resonance Part A (Bridging Education and Research) DOI 10.1002/cmr.a
allow simultaneous acquisition of in vivo MR spectra
from several voxels in one experiment.
Spatial Localization Based onSingle-Voxel Technique
The most frequently used localization methods for1H MRS of the brain are PRESS (point-resolved
spectroscopy) (2) and STEAM (stimulated echo ac-
quisition mode) (39). The basic principle underlying
single-voxel technique is to use three mutually or-
thogonal slice selective pulses and design the pulse
sequence to collect only the echo signal from the
point (voxel) in space where all three slices intersect
(Fig. 13). PRESS pulse sequence (Fig. 14) creates a
double spin echo from the pulse sequence.
90� ! TE=2 ! 180� ! TE=2 ! ½Echo 1� ! TE=2
! 180� ! TE=2 ! ‘‘½Echo 2�’’ [9]
where TE is the echo time. The magnetization at dif-
ferent points for the PRESS sequence (see Fig. 14) is
shown in Eq. [10] as follows:
ða ! bÞ IZ �!90�y
IX ¼ 1
2Iþ þ I�½ �
�!Gxt 1
2Iþe�iGxt þ I�eþiGxt� �
�!�Gxt 1
2Iþe�iGxteþiGxt�
þI�eþiGxte�iGxt� ¼ 1
2Iþ þ I�½ �
ðb ! cÞ 1
2Iþ þ I�½ �Chem: shift
TE=2!
1
2IþeiOHTE=2 þ I�e�iOHTE=2h i
ðc ! dÞ �!Gxt 1
2Iþe�iGxteiOHTE=2 þ I�eþiGxte�iOHTE=2h i
1
2I�e�iGxteiOHTE=2 þ IþeþiGxte�iOHTE=2h i
�!Gxt 1
2I�e�iGxteþiGxteiOHTE=2h
þ IþeþiGxte�iGxte�iOHTE=2i
¼ 1
2I�eiOHTE=2 þ Iþe�iOHTE=2h i
ðd ! eÞ Chem: shift
TE=2! 1
2I�eiOHTE=2e�iOHTE=2h
þ Iþe�iOHTE=2eþiOHTE=2i
¼ 1
2I� þ Iþ½ � ! Echo 1
ðe ! fÞ Chem: shift
TE=2
1
2IþeiOHTE=2 þ I�e�iOHTE=2h i
ðf ! gÞ 1
2I�eiOHTE=2 þ Iþe�iOHTE=2h i
ðg ! hÞ 1
2I� þ Iþ½ � ! Echo 2: [10]
Hence, at the time of data acquisition, we get back
the same magnetization as we started with at point b.
Figure 13 A schematic illustration of selecting a voxel
by three orthogonal slice-selecting pulse used in STEAM
or PRESS pulse sequences. The size and position of the
voxel is controlled by the frequency and bandwidth of the
slice-selecting pulses, as well as the amplitude of the
associated slice-selecting gradients.
Figure 12 Conventional spin echo (A) T1 and (B) T2-weighted images of brain.
50 MANDAL
Concepts in Magnetic Resonance Part A (Bridging Education and Research) DOI 10.1002/cmr.a

Thus, sensitivity is not lost in a PRESS sequence.
However, PRESS is a longer pulse sequence.
STEAM pulse sequence selects a stimulated echo
from the pulse sequence (Fig. 15). The general pulse
sequence scheme for STEAM is given below.
90� ! TE=2 ! 90� ! TM ! 90� ! TE=2
! ‘‘½Echo�’’ [11]
where TM is the mixing time. The magnetization at
different points originated from STEAM sequence
(see Fig. 15) are given in Eq. [12] as follows:
Hence, at the time of data acquisition, we get half
the magnetization that we started with at point b.
Thus, in a STEAM sequence, sensitivity is reduced
by half. Figure 16 shows the 1H MRS data acquired
Figure 14 A schematic diagram of PRESS pulse sequence. Magnetization at different points is
described in the text. Chemical shift selective imaging (CHESS) pulses at the beginning of the
pulse sequence are used to suppress water peak (98). [ ]3 symbol at the bottom indicates fre-
quency-selective 908 pulse to selectively excite the water, followed by application of spoiler gra-
dient (repeated thrice) to dephase the resulting magnetization.
ða ! bÞ IZ �!90�x ¼ IY:� 1
2iIþ � I�½ � �!Gxt
� 1
2iIþe�iGxt � I�eþiGxt� �
�!�Gxt� 1
2iIþe�iGxteþiGxt � I�eþiGxte�iGxt� �
¼ � 1
2iIþ � I�½ �
ðb ! cÞ Chem: shift
TE=2! � 1
2iIþeiOHTE=2h
�I�e�iOHTE=2i
ðc ! dÞ �!�Gxt� 1
2iIþeþiGxteiOHTE=2h
� I�e�iGxte�iOHTE=2i
�!Gxt � 1
2iIþeiOHTE=2 � I�e�iOHTE=2h i
¼ �!90�x � 1
2ieiOHTE=2
1
2Iþ þ I�
8: 9;þ iIZ
� ��
�e�iOHTE=21
2Iþ þ I�
8: 9;þ iIZ
� ��
ðd ! eÞ G1xt1
Spoiler� 1
2ieiOHTE=2fþiIZgh
�e�iOHTE=2f�iIZgi
ðe ! fÞ �!90�x � 1
2i
1
2eiOHTE=2 I� � Iþ
8: 9;n oh
þe�iOHTE=2 I� � Iþ8: 9;n oi
GXt�GXt
¼ � 1
2i
1
2eiOHTE=2 I� � Iþ
8: 9;n oh
þ e�iOHTE=2 I� � Iþ8: 9;n oi
ðf ! gÞChem: shift
TE=2! þ 1
2i
1
2Iþ � I�½ �
� 1
2i
1
2I�e�iOHTE � Iþe�iOHTE� � ¼ 1
2i
1
2Iþ � I�½ �
¼ Reduced signal intensity: [12]
MRS AND ITS APPLICATION IN ALZHEIMER’S DISEASE 51
Concepts in Magnetic Resonance Part A (Bridging Education and Research) DOI 10.1002/cmr.a

in the same region by PRESS and STEAM sequences
at 3T magnetic field (40).
Similarities between PRESS and STEAM
� Both of these pulse sequences involve sequen-
tial application of three orthogonal gradients to
select slices, during which selective RF pulses
are used to excite the spins in each slice. Hence,
at the end of the three-slice series, the only spins
excited are within the chosen volumes.
� Both PRESS and STEAM can be applied
along with the phase-encoding gradients,
which allow the defined volumes to be subdi-
vided. This yields a signal acquisition from
multiple volumes simultaneously. Because the
metabolite distribution can be represented as
maps, this approach is known as magnetic res-
onance spectroscopic imaging (MRSI) or
chemical shift imaging (CSI) (24, 41–43).
Differences between PRESS and STEAM
� In a PRESS sequence, sensitivity is higher by a
factor of two than a STEAM sequence, given the
same echo time. This is because the stimulated
echo is formed from only half the available equi-
libriummagnetization.
� The STEAM sequence is less sensitive to T2-
relaxation effects as no T2 relaxation occurs
during the mixing time, whereas PRESS is
sensitive to T2-relaxation throughout the local-
ization sequence. STEAM has two echo inter-
vals; PRESS has four echo intervals.
� With the same hardware, shorter TEs can be
achieved with STEAM than with PRESS.
� STEAM may have slightly better water sup-
pression factor, because water suppression
pulses can be added during the TM period
(which does not occur in PRESS). In addition,
STEAM may have less spurious water signals
from the 908 slice selective pulses than the
1808 pulses in PRESS.
� Another factor to consider, especially at higher
field strengths, is that the amount of power de-
posited (i.e., SAR) is approximately twice as
high for PRESS compared with STEAM. SAR
is not a significant factor at low fields (e.g.,
1.5 T). The Federal Drug Administration has
approved higher fields (up to 3.0 T) for clini-
cal use. At present, 7.0 T scanners are being
used exclusively for research purposes.
Chemical Shift Imaging (CSI)
Chemical shift imaging (CSI) or magnetic resonance
spectroscopic imaging (MRSI) is an efficient tech-
nique for noninvasive characterization and quantifi-
cation of metabolites from simultaneous acquisition
Figure 16 A comparison of the brain spectra at 3T using
(A) PRESS and (B) STEAM pulse sequences. The in vivo
acquisition spectra shown are from the occipital region of
a 22-year-old healthy male. For all acquisitions, the band-
width was 2.5 kHz with the collection of 2,048 data
points. A line width broadening function of �6 Hz was
applied to simulate the in vivo line width (99).
Figure 15 A schematic diagram of STEAM pulse
sequence. Magnetization at different points is described in
the text. Chemical shift selective imaging (CHESS) pulses
at the beginning of the pulse sequence are used to sup-
press water peak (98). [ ]3 symbol at the bottom indicates
frequency-selective 908 pulse to selectively excite the
water, followed by application of spoiler gradient
(repeated thrice) to dephase the resulting magnetization.
52 MANDAL
Concepts in Magnetic Resonance Part A (Bridging Education and Research) DOI 10.1002/cmr.a
of spectra from multiple voxels. Phase encoding can
be used either with a simple FID acquisition or in
combination with volume selective methods, such as
PRESS or STEAM. Because frequency encoding is
not possible in spectroscopy, phase encoding must be
applied in each of the directions in which spatial in-
formation is required—namely, two directions for 2D
chemical shift imaging or three directions for 3D
CSI. Scan time is dependent on the number of voxels
(N) in a particular direction. Given that, each phase-
encoding step requires a separate TR period, and the
scan time increases as N2 for 2D or N3 for 3D CSI.
Because the scan time increases so rapidly with N,
this imposes a further constraint on spatial resolution.
In multivoxel 1H MRS, typical in-plane resolutions
are in the order of 1 to 2 cm. In 31P MRS, even lower
resolutions are used because of the lower sensitivity
of the 31P nucleus.
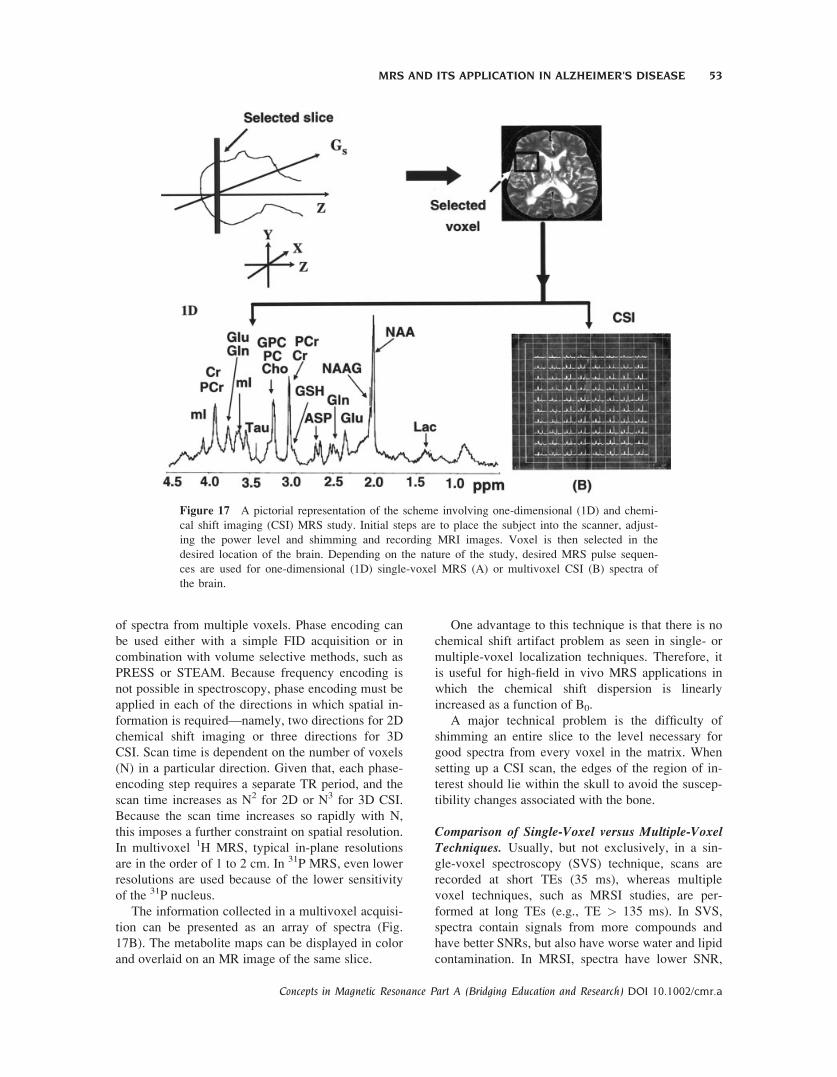
The information collected in a multivoxel acquisi-
tion can be presented as an array of spectra (Fig.
17B). The metabolite maps can be displayed in color
and overlaid on an MR image of the same slice.
One advantage to this technique is that there is no
chemical shift artifact problem as seen in single- or
multiple-voxel localization techniques. Therefore, it
is useful for high-field in vivo MRS applications in
which the chemical shift dispersion is linearly
increased as a function of B0.
A major technical problem is the difficulty of
shimming an entire slice to the level necessary for
good spectra from every voxel in the matrix. When
setting up a CSI scan, the edges of the region of in-
terest should lie within the skull to avoid the suscep-
tibility changes associated with the bone.
Comparison of Single-Voxel versus Multiple-VoxelTechniques. Usually, but not exclusively, in a sin-
gle-voxel spectroscopy (SVS) technique, scans are
recorded at short TEs (35 ms), whereas multiple
voxel techniques, such as MRSI studies, are per-
formed at long TEs (e.g., TE > 135 ms). In SVS,
spectra contain signals from more compounds and
have better SNRs, but also have worse water and lipid
contamination. In MRSI, spectra have lower SNR,
Figure 17 A pictorial representation of the scheme involving one-dimensional (1D) and chemi-
cal shift imaging (CSI) MRS study. Initial steps are to place the subject into the scanner, adjust-
ing the power level and shimming and recording MRI images. Voxel is then selected in the
desired location of the brain. Depending on the nature of the study, desired MRS pulse sequen-
ces are used for one-dimensional (1D) single-voxel MRS (A) or multivoxel CSI (B) spectra of
the brain.
MRS AND ITS APPLICATION IN ALZHEIMER’S DISEASE 53
Concepts in Magnetic Resonance Part A (Bridging Education and Research) DOI 10.1002/cmr.a

fewer detectable compounds, and variable amounts of
T2 weighting but are usually better-resolved spectra
with flatter baselines. SVS takes less time than MRSI
studies. Resolution in SVS is higher than MRSI tech-
niques. Quantification of metabolites is more robust
in SVS compared with MRSI techniques.
Two-Dimensional Technique
A major concern with one-dimensional MRS is that
many peaks overlap, and precise quantification is not
possible. In particular, the dominant peaks of gluta-
thione (GSH) overlap with other metabolites. Spec-
tral editing and multiple-quantum (MQ) techniques
can be used to differentiate glutathione and Glx
metabolites from overlapping lipids signals (44–47).A drawback of the spectral editing technique is that
only one metabolite can be selectively detected (44,45). Reduced signal strength of metabolites is a
major concern with MQ techniques (46, 47). Severalversions of localized 2D MRS sequences (Fig. 18)
have been successfully implemented on whole-body
1.5 T and 3 T MR imaging scanners (48, 49). Due to
an added dimension, a localized 2D MR spectrum
has better resolution (Fig. 19) than a conventional 1D
MR spectrum (48, 49).A 2D L-COSY sequence is operated on a single
voxel. Two major problems (49) yet to be resolved in
the localized 2D MR spectroscopy are (1) minimiz-
ing the RF pulses used for localization and coherence
transfer, taking into consideration that some of the
brain metabolites have short T2; and (2) recording
the localized 2D spectra of human organs in a rea-
sonable time duration.
Prior to localization by the 2D L-COSY sequence,
a CHESS sequence consisting of three frequency-
selective water-suppression pulses with a bandwidth
of approximately 75 Hz was used, each followed by
the dephasing Bo gradient pulses.
The 2D L-COSY pulse sequence had a combination
of three slice-selective RF pulses (908–1808–908) to
localize a desired voxel. The desired coherence trans-
fer pathways selected by a pair of gradient pulses are also
shown along with the pulse sequence (see Fig. 18).
Figure 18 A schematic diagram of a two-dimensional L-COSY pulse sequence. The RF pulse
scheme consisted of three RF pulses (908, 1808, 908) that were slice-selective along three orthog-
onal axes. A pair of B0 gradient crusher pulses were symmetric with respect to the slice-refocus-
ing 1808 RF pulse. The last slice-selective 908 RF pulse with a pair of symmetric B0 gradient
crushers also served as a coherence transfer pulse for the L-COSY spectrum. The coherence
transfer pathway diagram depicts the different stages of conversion of magnetization/coherences.
Chemical shift-selective imaging (CHESS) pulses at the beginning of the pulse sequence are
used to suppress water peak (98). [ ]3 symbol at the bottom indicates frequency-selective 908pulse to selectively excite the water, followed by application of spoiler gradient (repeated thrice)
to dephase the resulting magnetization.
54 MANDAL
Concepts in Magnetic Resonance Part A (Bridging Education and Research) DOI 10.1002/cmr.a

The magnetization at different points of a 2D-L-
COSY sequence is given in Eq. 13 as follows:
ða!bÞ IZ �!90�x �IY¼� i
2I��Iþ½ ��!Gyt
� i
2I�eþiGyt � Iþe�iGyt� �
�!�Gyt� i
2IþeþiGyte�iGxt � Iþe�iGyteþiGyt� �
¼� i
2I��Iþ½ �
ðb!eÞ Chem: shift
TE=2!� i
2I�e�iOHTE=2�IþeþiOHTE=2h i
ðc!dÞ �!Gzt � i
2I�eþiGzte�iOHTE=2�Iþe�iGzteþiOHTE=2h i
�!180�x � i
2IþeþiGzte�iOHTE=2� I�e�iGzteþiOHTE=2h i
�!Gzt � i
2IþeþiGzte�iGzte�iOHTE=2h
� I�e�iGzteþiGzteþiOHTE=2i
¼� i
2I�e�iOHTE=2 � IþeþiOHTE=2h i
ðd!eÞ Chem: shift
TE=2! � i
2
hI�e�iOHTE=2eþiOHTE=2
� IþeþiOHTE=2e�iOHTE=2i¼� i
2I��Iþ½ �
ðe!fÞ Chem: shift
t1¼� i
2I�eþiOHt1 � Iþe�iOHt1� �
Spin�Spincoupling
t1
� i
2I�eiOHt1fcosðpJISt1Þ þ 2iSZsinðpJISt1Þg� �
þ i
2Iþe�iOHt1fcosðpJISt1Þ�2iSZsinðpJISt1Þg� �
ðf!gÞ�!�Gzt� i
2I�eiOHt1e�iGztfcosðpJISt1Þ�
þ 2iSZsinðpJISt1Þg�þ i
2Iþe�iOHt1eþiGztfcosðpJISt1Þ� � 2iSZsinðpJISt1Þg�
�!þGzt � i
2I�eiOHt1e�iGzteþiGztfcosðpJISt1Þ�
þ 2iSZsinðpJISt1Þg�þ i
2Iþe�iOHt1eþiGzte�iGztfcosðpJISt1�
þ 2iSZsinðpJISt1Þg�¼� i
2I�eiOHt1fcosðpJISt1Þþ 2iSZsinðpJISt1Þg� �
þ i
2Iþe�iOHt1fcosðpJISt1Þ� 2iSZsinðpJISt1Þg� �
¼Data acquisition ðduring t2Þ: [13]
The application of 2D L-COSY on a normal brain
correlating different metabolites is shown in Fig. 19.
This 2D MRS technique has a great potential for
application to neurodegenerative diseases (i.e., AD)
for quantification of neurometabolites, particularly
the major antioxidant GSH that cannot be definitively
quantified by one-dimensional MRS technique.
IV. ALZHEIMER’S DISEASE
Alzheimer’s disease (AD), which accounts for
around 70% of dementia, is a progressive neurodege-
nerative disease manifested by cognitive deteriora-
tion, progressive impairment of activities of daily liv-
ing (ADL), and a variety of neuropsychiatric symp-
toms and behavioral disturbances (50, 51). In normal
aging, nerve cells (neurons) in the brain are not lost
in large numbers. In AD, however, many nerve cells
stop functioning, lose connections with other nerve
cells, and die. At first, AD destroys neurons in parts
of the brain that control memory, including the hip-
pocampus (a structure deep in the brain that helps
encode short-term memories) and related structures
(52). As nerve cells in the hippocampus stop working
properly, short-term memory fails and a person’s
ability to do easy and familiar tasks often begins to
decline. AD later attacks the cerebral cortex (the
outer layer of neurons in the brain), particularly the
areas responsible for language and reasoning (53). Atthis point, AD begins to take away language skills
and changes a person’s ability to make rational judg-
ments (54). Psychotic symptoms develop in some
patients, such as depression, hallucinations, and delu-
Figure 19 2D L-COSY MR spectrum of a 27-year-old
healthy control in the occipito-parietal gray matter region
at 1.5 T scanner. The 2D raw data were zero-filled to 256
and 2,048 along F1 and F2 axes and displayed in the
magnitude mode (100).
MRS AND ITS APPLICATION IN ALZHEIMER’S DISEASE 55
Concepts in Magnetic Resonance Part A (Bridging Education and Research) DOI 10.1002/cmr.a
sions (55). Eventually other parts of the brain are
involved, thereby making the AD brain unresponsive.
The fundamental molecular etiology, which leads to
neuronal loss resulting in cognitive decline in AD, is
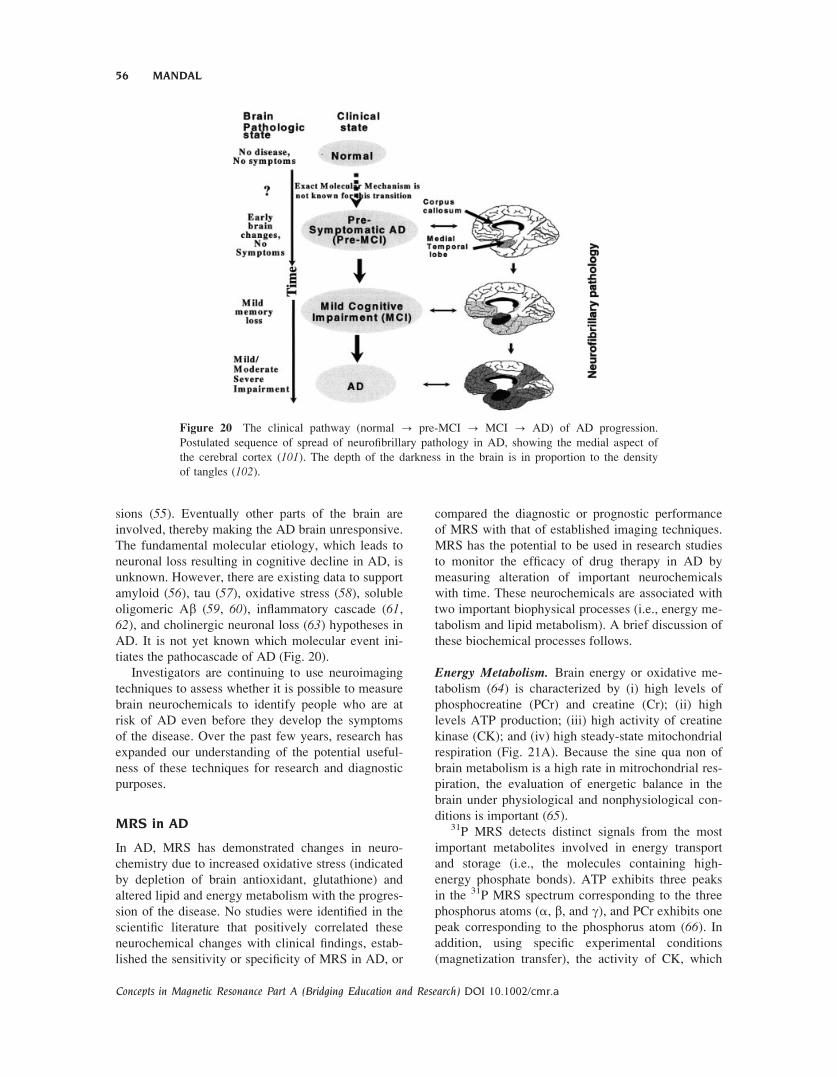
unknown. However, there are existing data to support
amyloid (56), tau (57), oxidative stress (58), solubleoligomeric Ab (59, 60), inflammatory cascade (61,62), and cholinergic neuronal loss (63) hypotheses inAD. It is not yet known which molecular event ini-
tiates the pathocascade of AD (Fig. 20).
Investigators are continuing to use neuroimaging
techniques to assess whether it is possible to measure
brain neurochemicals to identify people who are at
risk of AD even before they develop the symptoms
of the disease. Over the past few years, research has
expanded our understanding of the potential useful-
ness of these techniques for research and diagnostic
purposes.
MRS in AD
In AD, MRS has demonstrated changes in neuro-
chemistry due to increased oxidative stress (indicated
by depletion of brain antioxidant, glutathione) and
altered lipid and energy metabolism with the progres-
sion of the disease. No studies were identified in the
scientific literature that positively correlated these
neurochemical changes with clinical findings, estab-
lished the sensitivity or specificity of MRS in AD, or
compared the diagnostic or prognostic performance
of MRS with that of established imaging techniques.
MRS has the potential to be used in research studies
to monitor the efficacy of drug therapy in AD by
measuring alteration of important neurochemicals
with time. These neurochemicals are associated with
two important biophysical processes (i.e., energy me-
tabolism and lipid metabolism). A brief discussion of
these biochemical processes follows.
Energy Metabolism. Brain energy or oxidative me-
tabolism (64) is characterized by (i) high levels of
phosphocreatine (PCr) and creatine (Cr); (ii) high
levels ATP production; (iii) high activity of creatine
kinase (CK); and (iv) high steady-state mitochondrial
respiration (Fig. 21A). Because the sine qua non of
brain metabolism is a high rate in mitrochondrial res-
piration, the evaluation of energetic balance in the
brain under physiological and nonphysiological con-
ditions is important (65).31P MRS detects distinct signals from the most
important metabolites involved in energy transport
and storage (i.e., the molecules containing high-
energy phosphate bonds). ATP exhibits three peaks
in the 31P MRS spectrum corresponding to the three
phosphorus atoms (a, b, and g), and PCr exhibits one
peak corresponding to the phosphorus atom (66). Inaddition, using specific experimental conditions
(magnetization transfer), the activity of CK, which
Figure 20 The clinical pathway (normal ? pre-MCI ? MCI ? AD) of AD progression.
Postulated sequence of spread of neurofibrillary pathology in AD, showing the medial aspect of
the cerebral cortex (101). The depth of the darkness in the brain is in proportion to the density
of tangles (102).
56 MANDAL
Concepts in Magnetic Resonance Part A (Bridging Education and Research) DOI 10.1002/cmr.a

catalyzes the transfer of the phosphate group of PCr
to ADP, can be directly measured (67). PCr is
detected together with Cr through its major reso-
nance on a 1H MRS at 3 ppm, corresponding to N-
CH3 protons (68). In short, the MRS technique is
helpful in measuring noninvasively ATP, PCr, and
lactate concentrations of the brain under normal and
pathological conditions (69–71).
Lipid Metabolism. The brain has a high lipid con-
tent, including phospholipids, galactocerebrosides,
and gangliosides (72). 31P MRS detects the phospho-
rus atoms of the head groups in bilayer phospholipids
of neuronal membrane. These narrow PDE resonan-
ces of the 31P MR spectrum are primarily from GPC
and GPE, which are free and mobile in the cytosol
and involved in brain lipid metabolism (73) (see Fig.
21B). The PME is mostly composed of signals from
phosphoethanolamine (PE) and phosphocholine (PC)
(74, 75). Because these resonances consist of over-
lapping signals, the significance of modifications of
PME and PDE resonances in pathology is not com-
pletely known. Initially it has been proposed that the
PME-to-PDE ratio reflects phospholipid turnover
(64). PME and PDE corresponds to the molecules
involved in the anabolism and catabolism of phos-
pholipids, respectively (76).
1H MRS in AD
1H MRS has two great advantages: the proton is the
most sensitive stable nucleus, and almost every com-
pound in living tissue contains hydrogen atoms.
However, there are technical difficulties. First, the
presence of an intense signal from tissue water and,
in some cases, from lipids swamp the much smaller
signals from metabolites of interest that are present
at much lower concentration. Another major problem
arises from the narrow chemical shift range of 1H
signals (about 8 ppm). Thus in order to apply in vivo
Figure 21 A schematic presentation of energy (A) (64) and lipid metabolism (B) (103). Theabbreviations in energy metabolism are as follows: CK, choline kinage; PDH, pyruvate dehydro-
genase complex; ATP, adenosine triphosphate; ADP, adenosine diphosphate. Glucose breaks
down to pyruvate in the cytosol during glycolysis. (B) The abbreviations in lipid metabolism are
as follows: FA, fatty acid; PC, phosphorylcholine; CK, choline kinase; CDP: cytidine diphos-
phate; PLA, phospholipase A; PLC, phospholipase C; PLD, phospholipase D; LPL, lysophopholi-
pase; CPD, cholinephosphodiesterase; PD, phosphodiesterase.
MRS AND ITS APPLICATION IN ALZHEIMER’S DISEASE 57
Concepts in Magnetic Resonance Part A (Bridging Education and Research) DOI 10.1002/cmr.a

1H MRS successfully, it is necessary to suppress the
intense interfering signals (i.e., water and lipids).
Moreover, other technical and experimental problems
related with the localization, interpretation, and quan-
tification of 1H MRS spectra should be taken into
consideration accurately.1H MRS has yielded a growing body of interesting
and largely replicable evidence of characteristic
metabolite changes in AD (Fig. 22). A consistent
finding has been a reduction in NAA levels in AD
brains in temporoparietal region (77), temporal lobe
(78–80), and parietal lobe (81). Overall, NAA
decrease in AD has been shown in at least 18 reports,
including in vitro studies showing a correlation with
AD pathology (82, 83).NAA depletion is higher in gray matter compared
with white matter in AD. Another striking finding in
the literature has been the unforeseen elevation of mIlevels by about 15% to 20% in the gray matter of
patients with AD. Subjects with age-associated mem-
ory impairment show no significant increase in mI inthe temporoparietal region (77), yet one study dem-
onstrated an increased mI signal in the posterior cin-
gulate of individuals with mild cognitive impairment
(79). No significant mI changes have been confirmed
in white matter, but a moderate inverse association
between frontal white matter mI levels and global
mental function has been found (78). The combined
NAA/mI ratio is robust in discriminating possible
AD cases from age-matched control subjects (78,84). The NAA/mI ratio in patients with AD has also
been shown to significantly correlate with Mini-Men-
tal State Examination (MMSE) scores and even to
significantly predict MMSE change after 12 months
(85).There are intriguing suggestions that 1H MRS
may have a useful role in prognosis of mental func-
tion and tracking of disease progression. A notewor-
thy finding has been the equivalence of in vivo chol-
ine estimates between pathologic groups and control
subjects.
31P MRS in AD
31P is a naturally occurring nucleus, which has been
most extensively used for studying in vivo tissue
energetic processes. The spectra are simple as the
MR signals are observed only from the relatively mo-
bile compounds, which are in 2–10 mM concentra-
tion. Thus, monitoring the relative concentration of
various 31P metabolites noninvasively helps to study
the biochemistry of diseased and normal states of tis-
sues and to monitor the efficacy of several therapeu-
tic interventions. The spectrum (see Fig. 1B) shows
characteristic resonances from b-ATP at �23 ppm
and g-ATP signal at �6.0 ppm. The signal at �7.5
ppm contains contributions from the a-phosphategroups of ATP and adenosine-di phosphate (ADP).
The resonances at 0 ppm and 5 ppm are due to PCr
and inorganic phosphate (pi), respectively. The
chemical shift position of Pi is sensitive to pH and
provides a noninvasive indicator of intracellular pH.
Besides Pi, ATP, and PCr, signals from phosphomo-
noesters (PME; 6–8 ppm) and phosphodiesters (PDE;
2–4 ppm) are also observed. The metabolic state of
cells can thus be studied by monitoring the PME
peak.31P MRS studies of AD have shown abnormalities
in the levels of membrane phospholipids and high-
energy metabolites that appear dependent on the se-
verity of the illness (22, 23). In normal aging there is
a decrease in PMEs accompanied with a concomitant
increase in PDE levels, which is different from the
profile of biochemical changes in AD (86, 87). Pette-grew and coworkers (22, 86) have reported elevated
PME levels in the initial stages of AD compared with
age-matched controls. As the illness progresses, PME
levels drop. In contrast, PDE levels and high-energy
metabolites, such as PCr and Pi, appear to increase as
Figure 22 The application of 1H MRS in AD. Spectra
are shown for Control and AD brain in the posterior cin-
gulate region. It is a region of the brain in which there
appears to be progressive pathological change throughout
the course of AD, and is hence a suitable target for longi-
tudinal studies. NAA/Cr ratio is lower in AD patients
compared with Control subjects. In most cases, the ratio
NAA/Cr shows good specificity and sensitivity for distin-
guishing AD patients from Control subjects (104).
58 MANDAL
Concepts in Magnetic Resonance Part A (Bridging Education and Research) DOI 10.1002/cmr.a

the dementia worsens and seem to correlate with the
number of senile plaques (22). It has been proposed
that the increase in PME reflects early, possibly caus-
ative, abnormalities in membrane metabolism,
whereas the increase of PDE and PCr reflects neuro-
nal degeneration and death (22, 86).Abnormalities in the lipid composition (Fig. 23)
have been identified in different regions of the brain
of AD patients. Anisotropy studies have additionally
demonstrated abnormal membrane fluidity in hippo-
campal synaptosomes (88). Taken together, such
findings suggest that aberrations in the synthesis and
degradation of membrane phospholipids are meta-
bolic events that occur in AD brains. The intracere-
bral availability of phospholipid precursors and
metabolites, as well as the occurrence of high-energy
phosphates, can be estimated by the analysis of the31P spectral curve within a discrete brain area with
the aid of MRS.
It is possible that 31P MRS findings will change
during the progression of AD. Longitudinal studies
in larger population are needed for the time course of31P MRS changes in AD. Because 31P MRS yields
lower SNR ratio, 31P MRS requires larger voxels,
which limits the specificity of the findings from a
certain region of the brain. These drawbacks can be
overcome using higher-field scanner due to increased
SNR at higher field.
Voxel Selection
As the exact location of the postulated biochemical
abnormalities is unknown in neurodegenerative disor-
ders, the optimal location for the MRS voxel selec-
tion is important. Often voxels are selected on regions
of the brain thought to be involved in a particular psy-
chiatric disease, as determined by other imaging
modalities, such as positron emission tomography
(PET) or single photon emission computed tomogra-
phy (SPECT). However, the real possibility exists
that the brain abnormality is located in a brain region
not sampled by the MRS voxel. As such, the abnor-
mality could be missed altogether. Many studies
attempt to sample several locations in a given sub-
ject’s brain, but in reality, it is only a small percent-
age of the entire brain volume. Recent studies are
using the technique of MRS imaging (MRSI) to sam-
ple dozens of voxels at a time, thus reducing this
potential for sampling errors. To get high-quality MR
spectrum, voxel selection in cerebrospinal fluid
(CSF) and near the skull and scalp should be avoided.
Tissue Volume Correction
Most MRS techniques use cubic or rectangular vox-
els, which do not usually correspond with the curved
shapes of the sampled brain regions. As such, a given
voxel often samples a combination of cerebrospinal
fluid (CSF), gray matter, and white matter. Because
CSF has no measurable proton MRS metabolites, the
presence of a large fraction of CSF within a voxel
will artifactually lower the metabolite concentrations.
Furthermore, metabolite concentrations are different
in gray matter and white matter (89). New postpro-
cessing techniques have been developed using ana-
tomical images to take these tissue components into
account (89). It is also possible to incorporate voxel
tissue composition data into the statistical analysis
(90) or correct metabolite concentrations (91). To
select a voxel in a desired brain region, it is possible
to shift the acquisition grid for MRSI studies.
MR Spectra Quantification
Absolute concentration measurements are the ulti-
mate goal of in vivo 1H MRS. Because the signal
area is proportional to the amount of nuclei in ques-
tion, it is in principle possible to quantify metabolite
concentration in vivo. In practice, however, signal
quantification present major technical problems.
First, the spectrum itself can be difficult to interpret.
It may contain many overlapping peaks (especially if
acquired at a short time echo) and due to broad base-
line that could come from metabolites with short T2.
Second, there is inevitable T1 and T2 weighting of
the resonance peaks, which is dependent on the tim-
ing of the localization sequence, as well as signal loss
and distortions of coupled peaks. Third, the quality
of the localization (i.e., suppression of signals from
Figure 23 MRS data phosphomonoesters (PME) in AD
and Control subjects. Values represent percent areas cal-
culated in terms of the ratio between PME under-peak
area to the sum of all under-peak areas within the same
spectral curve (105).
MRS AND ITS APPLICATION IN ALZHEIMER’S DISEASE 59
Concepts in Magnetic Resonance Part A (Bridging Education and Research) DOI 10.1002/cmr.a

outside the VOI) complicates the calculation of the
exact volume from which the spectrum was acquired.
Finally, a reference signal is required for calibration.
This may explain in part the discrepancies between
different studies of the same brain region.
The LC-Model (92) is a popular software mostly
used in different laboratories for the quantification of
the metabolites.
V. LIMITATION OF MRS
At present, 1H MRS and 1H MRSI have several limi-
tations. To obtain a good SNR, the experiment dura-
tion is still long and can be compromised by patient
movement. Furthermore, some brain regions, such as
the cerebellum and temporal lobes, that are of patho-
logical interest are difficult to assess due to magnetic
field inhomogenities, which can influence the quality
of the spectra. Methodological improvements in
localized shimming will allow more reproducible
studies from these brain regions in the future.
VI. FUTURE DIRECTION
The ability to perform in vivo longitudinal studies
from several brain regions and to quantitate metabo-
lite changes provides exciting opportunities for
research and as a surrogate tool in assessing putative
treatments in many neurodegenerative diseases.
Future MRS studies should take advantage of new
experimental MRS methods that are relevant to neu-
rodegenerative illness and treatment. A few pioneer-
ing studies have examined GABA, the major inhibi-
tory neurotransmitter in the brain (93). Furthermore,
Glu is the principal excitatory neurotransmitter in the
brain. Using short echo times (TE) techniques, it is
possible to measure Glx levels, although until now
few studies have examined this peak (90, 91, 94).Because a considerable amount is known about these
neurotransmitter systems, detecting GABA or Glu
MRS abnormalities in psychiatric patients would be
helpful to understand the underlying biochemical
defects and to determine optimal treatments.
MRS studies in psychiatric research should also
take advantage of new hardware technologies such as
high-field MRI machines (3 T and above). Though
susceptibility artifacts are considerably increased at
high fields, high-order shimming can help smooth
out magnetic fields enough to obtain reliable spectro-
scopic data. Because the signal-to-noise ratio is
increased at higher magnetic field strengths, imaging
time can be decreased and voxel size can be made
smaller. The improvement in available signal afforded
at higher fields also provides for more sophisticated
spectral editing techniques, which will allow mea-
surement of some clinically relevant neurotrans-
mitters described previously. The MRSI technique is
also valuable because several different brain regions
can be studied simultaneously in a single well-posi-
tioned slice. This is useful as we do not yet know
where the biochemical abnormalities are located in
the various neurodegenerative diseases.
Very high-field magnets may also lead to the de-
velopment of new imaging techniques. For example,
animal research suggests a heterogeneous distribution
of lithium within the brain parenchyma (95). Ideally,because lithium has a single peak, it should be possi-
ble to perform lithium imaging, just as it has been
done for sodium. However, such techniques have
been hampered by low signal-to-noise ratios caused
by small concentrations of lithium within the brain.
Higher-field magnets may be able to increase the sig-
nal-to-noise such that lithium images can be obtained.
Soares and his team have already performed lithium
MRS at 3T (96).Two-dimensional MRS at higher magnetic field
strengths (e.g., 7 T) scanner holds strong promise for
2D MRS spectroscopy as it will dramatically increase
signal-to-noise ratios and substantially separate the
overlapping peaks, which can be quantified without
ambiguity.
MRS is a complex and sophisticated neuroimag-
ing technique that allows reliable and reproducible
quantification of brain neurochemistry. MRS is al-
ready being used to probe the pathophysiology and
psychopharmacology of many neurodegenerative dis-
orders, and it is possible that in the future such chem-
ical sampling will generate means of classifying the
disorders by neurochemical analysis. Furthermore,
MR spectroscopy may permit the analysis of immedi-
ate and long-term pharmacotherapeutic interventions
and eventually uncover the means to diagnose disor-
ders at a preclinical stage. Clearly, the full clinical
potential of neurodegenerative MRS is only begin-
ning to be realized, and it is hoped that further advan-
ces in technology will lead to more sensitive and reli-
able methods of metabolite quantification and local-
ization and perhaps increase the number of
compounds—in particular, neurotransmitters that can
be detected using spectroscopy.
ACKNOWLEDGMENTS
This article is dedicated to my parents, Mr. Bhardres-
war Mandal and Mrs. Kalpana Mandal. I am thankful
to Dr. Jay W. Pettegrew (psychiatry) and Dr. Thomas
60 MANDAL
Concepts in Magnetic Resonance Part A (Bridging Education and Research) DOI 10.1002/cmr.a
Albert (radiology, University of California, Los
Angeles) for support. Encouragements from Drs.
David J. Kupfer (chairman, psychiatry), Oscar L.
Lopez (neurology), John P. Williams (chairman, an-
esthesiology), Fernando E. Boada, Ph.D (radiology),
Stephen T. DeKosky (chairman, neurology), Ronald
L. Hamilton (neuropathology), Satish Iyenger
(chairman, statistics), Brian D. Ross (HMRI, Califor-
nia), and Eliezer Masliah (neuroscience, University
of California, San Diego) are appreciated. Financial
support in the form of research grants from the Amer-
ican Health Assistance Foundation, American Parkin-
son Disease Association, and Alzheimer’s Disease
Research Center (University of Pittsburgh) is duly
acknowledged. John Wiley & Sons, Inc., is acknowl-
edged for giving permission to reproduce figures.
Bradley Morneweck is appreciated for preparing Fig-
ure 18. Finally, thanks to Ms. Ratna Mandal for
excellent editorial support.
REFERENCES
1. Cady EB, Dawson MJ, Hope PL, Tofts P, de L.
Costello A, et al. 1983. Noninvasive investigation
of cerebral metabolism in newborn infants by phos-
phorous nuclear magnetic resonance spectroscopy.
Lancet 1:1059–1062.
2. Bottomley PA, Hart HR, Edelstein WA. 1984. Anat-
omy and metabolism of the normal human brain
studied by magnetic resonance at 1.5 Tesla. Radiol-
oge 150:441–446.
3. Hope PL, Cady EB, Tofts P, Hamilton PA, de L. Cost-
ello A, et al. 1984. Cerebral energy metabolism studied
with phosphorous NMR spectroscopy in normal and
birth-asphyxiated infants. Lancet 2:366–370.
4. Gillies RJ, Morse DL. 2005. In vivo magnetic reso-
nance spectroscopy in cancer. Annu Rev Biomed
Eng 7:287–326.
5. Hsu YY, Du AT, Schuff N, Weiner MW. 2001.
Magnetic resonance imaging and magnetic reso-
nance spectroscopy in dementias. J Geriatr Psychia-
try Neurol 14:145–166.
6. Knopman DS, DeKosky ST, Cummings JL, Chui H,
Corey-Bloom J, et al. 2001. Practice parameter: di-
agnosis of dementia (an evidence-based review).
Report of the Quality Standards Subcommittee of
the American Academy of Neurology. Neurology
56:1143–1153.
7. Webb PG, Sailasuta N, Kohler SJ, Raidy T, Moats
RA, et al. 1994. Automated single-voxel proton
MRS—technical development and multisite verifica-
tion. Magn Reson Med 31:365–373.
8. Wobrock T, Scherk H, Falkai R. 2005. Magnetic
resonance spectroscopy in schizophrenia. Possibil-
ities and limitations. Radiologe 45:124–130.
9. Ernst R. 1966. Nuclear magnetic double resonance
with an incoherent radio-frequency field. J Chem
Phys 45:3845–3861.
10. Solomon I. 1955. Relaxation processes in a system
of two spins. Phys Rev 99:559–565.
11. Carr HP, Purcell EM. 1954. Effects of diffusion on
free precession in nuclear magnetic resonance
experiments. Phys Rev 94:630–638.
12. Hahn E, Maxwell D. 1952. Spin-echo measurement
of nuclear spin-coupling in molecules. Phys Rev
88:1070–1084.
13. Powers R, Gronenborn A, Clore G, Bax A. 1991.
Three-dimensional triple-resonance NMR of 13C/
15N-enriched proteins using constant time evolu-
tion. J Magn Reson 94:209–213.
14. Hurd R. 1990. Gradient.enhanced spectroscopy. J
Magn Reson 87:3422–3428.
15. Sørensen O, Eich G, Levitt M, Bodenhausen G,
Ernst R. 1983. Product operator formalism for the
description of NMR pulse experiments. Prog NMR
Spectrosc 16:163–192.
16. Shaka A, Keeler JF, Freeman R. 1983. Evaluation
of a new broadband decoupling scheme: WALTZ-
16. J Magn Reson 53:313–340.
17. Bax A, Freeman R. 1981. Investigation of complex
networks of spin-spin coupling by two-dimensional
NMR. J Magn Reson 44:542–561.
18. Aue W, Bartholdi E, Ernst R. 1976. Two-dimen-
sional spectroscopy. Application to nuclear magnetic
resonance. J Chem Phys 64:2229–2246.
19. Bain A. 1984. Coherence levels and coherence path-
ways in NMR. A simple way to design phase cy-
cling procedures. J Magn Reson 56:418–427.
20. Bodenhausen G, Kogler H, Ernst R. 1984. Selection
of coherence-transfer pathways in NMR pulse
experiments. J Magn Reson 58:370–388.
21. Mandal PK, Majumdar A. 2004. A comprehensive
discussion of HSQC and HMQC pulse sequences.
Concepts Magn Reson Part A 20A:1–23.
22. Pettegrew JW, Panchalingam K, Moossy J, Martinez
J, Rao G, et al. 1988. Correlation of phosphorus-31
magnetic resonance spectroscopy and morphologic
findings in Alzheimer’s disease. Arch Neurol 45:
1093–1096.
23. Pettegrew JW, Moossy J, Withers G, McKeag D,
Panchalingam K. 1988. 31P nuclear magnetic reso-
nance study of the brain in Alzheimer’s disease
[erratum appears in J Neuropathol Exp Neurol
48(1):118–9]. J Neuropathol Exp Neurol 47:235–
248.
24. Moonen CTW, Sobering G, Vanzijl PCM, Gillen J,
Vonkienlin M, et al. 1992. Proton spectroscopic
imaging of human brain. J Magn Reson 98:556–
575.
25. Byrd SE, Tomita T, Palka PS, Darling CF, Norfray JP,
et al. 1996. Magnetic resonance spectroscopy (MRS)
in the evaluation of pediatric brain tumors, part II: clin-
ical analysis. J Natl Med Assoc 88:717–723.
MRS AND ITS APPLICATION IN ALZHEIMER’S DISEASE 61
Concepts in Magnetic Resonance Part A (Bridging Education and Research) DOI 10.1002/cmr.a

26. van der Toorn A, Dijkhuizen RM, Tulleken CA,
Nicolay K. 1995. T1 and T2 relaxation times of the
major 1H-containing metabolites in rat brain after
focal ischemia. NMR Biomed 8:245–252.
27. Moonen CT, von Kienlin M, van Zijl PC, Cohen J,
Gillen J, et al. 1989. Comparison of single-shot
localization methods (STEAM and PRESS) for in
vivo proton NMR spectroscopy. NMR Biomed
2:201–208.
28. Stanley JA. 2002. In vivo magnetic resonance spec-
troscopy and its application to neuropsychiatric dis-
orders. Can J Psychiatry 47:315–326.
29. Pettegrew JW, McClure RJ, Keshavan MS, Min-
shew NJ, Panchalingam K, et al. 1997. 31P magnetic
resonance spectroscopy studies of developing brain.
In:Keshavan MS,Murray RM, editors. Neurodevel-
opment and adult psychopathology. Cambridge:
Cambridge University Press. p 71–92.
30. Pettegrew JW, Panchalingam K, Withers G,
McKeag D, Strychor S. 1990. Changes in brain
energy and phospholipid metabolism during devel-
opment and aging in the Fischer 344 rat. J Neuropa-
thol Exp Neurol 49:237–249.
31. Kemp GJ. 2000. Non-invasive methods studying for
studying brain energy metabolism: what they show
and what it means. Dev Neurosci 22:418–428.
32. Lei H, Zhu XH, Zhang XL, Ugurbil K, Chen W.
2003. In vivo P-31 magnetic resonance spectroscopy
of human brain at 7 T: an initial experience. Magn
Reson Med 49:199–205.
33. Pettegrew JW, Klunk WE, Panchalingam K,
McClure RJ, Stanley JA. 1997. Magnetic resonance
spectroscopic changes in Alzheimer’s disease. Ann
N Y Acad Sci 826:282–306.
34. Hetherington HP, Pan JW, Spencer DD. 2002. H-1
and P-31 spectroscopy and bioenergetics in the lat-
eralization of seizures in temporal lobe epilepsy.
J Magn Reson Imaging 16:477–483.
35. Duncan JS. 1997. Imaging and epilepsy. Brain
120:339–377.
36. Gadian DG, Williams SR, Bates TE, Kauppinen
RA. 1993. NMR spectroscopy: current status and
future possibilities. Acta Neurochir Suppl (Wien)
57:1–8.
37. Ruiz-Cabello J, Vuister G, Moonen C, Van Gelde-
ren P, Cohen J, et al. 1992. Gradient-enhanced het-
eronuclear correlation spectroscopy. Theory and ex-
perimental aspects. J Magn Reson 100:282–302.
38. Bax A, Pochapsky, SS. 1992. Optimized recording of
heteronuclear multidimensional NMR spectra using
pulse field gradients. J Magn Reson 99:638–643.
39. Frahm J, Bruhn H, Gyngell ML, Merboldt KD,
Hanicke W, et al. 1989. Localized proton NMR
spectroscopy in different regions of the human brain
in vivo. Relaxation times and concentrations of cer-
ebral metabolites. Magn Reson Med 11:47–63.
40. Kim H, Thompson RB, Hanstock CC, Allen PS.
2005. Variability of metabolite yield using STEAM
or PRESS sequences in vivo at 3.0 T, illustrated
with myo-inositol. Magn Reson Med 53:760–769.
41. Duyn JH, Gillen J, Sobering G, Vanzijl PCM, Moonen
CTW. 1993. Multisection proton MR spectroscopic
imaging of the brain. Radiology 188:277–282.
42. Brown TR, Kincaid BM, Ugurbil K. 1982. NMR
chemical shift imaging in three dimensions. Proc
Natl Acad Sci U S A 79:3523–3526.
43. Schuff N, Ezekiel F, Gamst AC, Amend DL, Capiz-
zano AA, et al. 2001. Region and tissue differences
of metabolites in normally aged brain using multi-
slice 1H magnetic resonance spectroscopic imaging.
Magn Reson Med 45:899–907.
44. Rothman DL, Petroff OAC, Behar KL, Mattson RH.
1993. Localized H-1-NMR measurements of gamma-
aminobutyric-acid in human brain in vivo. Proc Natl
Acad Sci U S A 90:5662–5666.
45. Petroff OAC, Rothman DL, Behar KL, Mattson RH.
1995. Initial observations on effect of Vigabatrin on
in-vivo H-1 spectroscopic measurements of gamma-
aminobutyric-acid, glutamate, and glutamine in
human brain. Epilepsia 36:457–464.
46. Thomas MA, Hetherington HP, Meyerhoff DJ,
Twieg DB. 1991. Localization of double quantum
filtered 1H MR spectroscopy. J Magn Reson
93:485–496.
47. Keltner JR, Wald LL, Frederick BD, Renshaw PF.
1997. In vivo detection of GABA in human brain
using a localized double-quantum filter technique.
Magn Reson Med 37:366–371.
48. Thomas MA, Ryner LN, Mehta MP, Turski PA,
Sorenson JA. 1996. Localized 2D J-resolved H-1
MR spectroscopy of human brain tumors in vivo.
J Magn Reson Imaging 6:453–459.
49. Thomas MA, Yue K, Binesh N, Davanzo P, Kumar
A, et al. 2001. Localized two-dimensional shift cor-
related MR spectroscopy of human brain. Magn
Reson Med 46:58–67.
50. Cummings JL. 2004. Drug therapy—Alzheimer’s
disease. New Engl J Med 351:56–67.
51. Braak E, Griffing K, Arai K, Braak H. 1999. Neuro-
pathology of Alzheimer’s disease: what is new since
A. Alzheimer? Eur Arch Psychiatry Clin Neurosci
249:14–22.
52. Dixon RM, Bradley KM, Budge MM, Styles P,
Smith AD. 2002. Longitudinal quantitative proton
magnetic resonance spectroscopy of the hippocam-
pus in Alzheimer’s disease. Brain 125:2332–2341.
53. Cummings JL. 2000. Cognitive and behavioral het-
erogeneity in Alzheimer’s disease: seeking the neu-
robiological basis. Neurobiol Aging 21:845–861.
54. Killiany RJ, Hyman BT, Gomez-Isla T, Moss MB,
Kikinis R, et al. 2002. MRI measures of entorhinal
cortex vs hippocampus in preclinical AD. Neurol-
ogy 58:1188–1196.
55. Cummings JL. 2003. Toward a molecular neuropsy-
chiatry of neurodegenerative diseases. Ann Neurol
54:147–154.
62 MANDAL
Concepts in Magnetic Resonance Part A (Bridging Education and Research) DOI 10.1002/cmr.a

56. Hardy J, Selkoe DJ. 2002. Medicine—the amyloid
hypothesis of Alzheimer’s disease: progress and
problems on the road to therapeutics. Science
297:353–356.
57. Trojanowski JQ, Lee VMY. 2002. The role of tau
in Alzheimer’s disease. Med Clin North Am
86:615–627.
58. Casetta I, Govoni V, Granieri E. 2005. Oxidative
stress, antioxidants and neurodegenerative diseases.
Curr Pharm Des 11:2033–2052.
59. Kayed R, Head E, Thompson JL, McIntire TM,
Milton SC, et al. 2003. Common structure of solu-
ble amyloid oligomers implies common mechanism
of pathogenesis. Science 300:486–489.
60. Mandal PK, Pettegrew JW. 2004. Alzheimer’s dis-
ease: soluble oligomeric A beta(1–40) peptide in
membrane mimic environment from solution NMR
and circular dichroism studies. Neurochem Res
29:2267–2272.
61. Anderson I, Adinolfi C, Doctrow S, Huffman K, Joy
KA, et al. 2001. Oxidative signaling and inflamma-
tory pathways in Alzheimer’s disease. Neuronal Sig-
nal Transduction and Alzheimer’s Disease 67:141–
149.
62. Cummings JL, Vinters HV, Cole GM, Khachaturian
ZS. 1998. Alzheimer’s disease—etiologies, patho-
physiology, cognitive reserve, and treatment oppor-
tunities. Neurology 51:S2–17.
63. Francis PT, Palmer AM, Snape M, Wilcock GK.
1999. The cholinergic hypothesis of Alzheimer’s
disease: a review of progress. J Neurol Neurosurg
Psychiatry 66:137–147.
64. Vion-Dury J, Meyerhoff DJ, Cozzone PJ, Weiner
MW. 1994. What might be the impact on neurology
of the analysis of brain metabolism by in vivo mag-
netic resonance spectroscopy? J Neurol 241:354–71.
65. Clarke DD, Lajtha AL, Maker HS. 1989. Intermedi-
ary metabolism. In: Seigel G, Agranoff B, Albers
RW, Molinoff P, editors. Basic neurochemistry. 4th
edition. New York: Raven Press. p 541–564.
66. Bottomley PA, Cousins JP, Pendrey DL, Wagle
WA, Hardy CJ, et al. 1992. Alzheimer dementia—
quantification of energy-metabolism and mobile
phosphoesters with P-31 NMR-spectroscopy. Radi-
ology 183:695–699.
67. Degani H, Alger JR, Shulman RG, Petroff OA, Pri-
chard JW. 1987. 31P magnetization transfer studies
of creatine kinase kinetics in living rabbit brain.
Magn Reson Med 5:1–12.
68. Miller BL. 1991. A review of chemical issues in 1H
NMR spectroscopy: N-acetyl-L-aspartate, creatine
and choline. NMR Biomed 4:47–52.
69. Chance B. 1989. Meatbolic heterogeneties in rapidly
metabolizing tissues. J Appl Cardiol 4:207–221.
70. Moore CM, Frederick BD, Renshaw PF. 1999.
Brain biochemistry using magnetic resonance spec-
troscopy: relevance to psychiatric illness in the el-
derly. J Geriatr Psychiatry Neurol 12:107–117.
71. Pettegrew JW, Panchalingam K, Stanley JA,
McClure RJ. 2002. P-31 and H-1 MRSI studies of
psychosis in Alzheimer’s disease. Am J Geriatr Psy-
chiatry 10:18–19.
72. Agranoff BW. 1989. Lipids. In: Seigel G, Agranoff B,
Albers RW, Molinoff P, editors. Basic neurochemistry.
4th edition. New York: Raven Press. p 91–107.
73. Merchant TE, Glonek T. 1990. 31P NMR of phos-
pholipid glycerol phosphodiester residues. J Lipid
Res 31:479–486.
74. Brenton DP, Garrod PJ, Krywawych S, Reynolds
EO, Bachelard HS, et al. 1985. Phosphoethanol-
amine is major constituent of phosphomonester peak
detected by 31P NMR in newborn brain. Lancet
1:115.
75. Petroff OA, Prichard JW, Behar KL, Alger JR, den
Hollander JA, et al. 1985. Cerebral intracellular pH
by 31P nuclear magnetic resonance spectroscopy.
Neurology 35:781–788.
76. Ruizcabello J, Cohen JS. 1992. Phospholipid metab-
olites as indicators of cancer cell-function. NMR
Biomed 5:226–233.
77. Parnetti L, Lowenthal DT, Presciutti O, Pelliccioli
GP, Palumbo R, et al. 1996. H-1-MRS, MRI-based
hippocampal volumetry, and Tc-99m-HMPAO-
SPECT in normal aging, age-associated memory
impairment, and probable Alzheimer’s disease. J
Am Geriatr Soc 44:133–138.
78. Parnetti L, Tarducci R, Presciutti O, Lowenthal DT,
Pippi M, et al. 1997. Proton magnetic resonance
spectroscopy can differentiate Alzheimer’s disease
from normal aging. Mech Aging Dev 97:9–14.
79. Kantarci K, Jack CR, Xu YC, Campeau NG,
O’Brien PC, et al. 2000. Regional metabolic pat-
terns in mild cognitive impairment and Alzheimer’s
disease—a H-1 MRS study. Neurology 55:210–217.
80. Jessen F, Block W, Traber F, Keller E, Flacke S,
et al. 2000. Proton MR spectroscopy detects a rela-
tive decrease of N-acetylaspartate in the medial
temporal lobe of patients with AD. Neurology
55:684–688.
81. Miller BL, Moats RA, Shonk T, Ernst T, Woolley
S, Ross BD. 1993. Alzheimer disease: depiction of
increased cerebral myo-inositol with proton MR
spectroscopy. Radiology 187:433–7.
82. Klunk WE, Xu C, Panchalingam K, McClure RJ,
Pettegrew JW. 1996. Quantitative 1H and 31P MRS
of PCA extracts of postmortem Alzheimer’s disease
brain. Neurobiol Aging 17:349–57.
83. Mohanakrishnan P, Fowler AH, Vonsattel JP,
Husain MM, Jolles PR, et al. 1995. An in vitro 1H
nuclear magnetic resonance study of the temporo-
parietal cortex of Alzheimer brains. Exp Brain Res
102:503–10.
84. Shonk TK, Moats RA, Gifford P, Michaelis T, Man-
digo JC, et al. 1995. Probable Alzheimer disease:
diagnosis with proton MR spectroscopy [see com-
ment]. Radiology 195:65–72.
MRS AND ITS APPLICATION IN ALZHEIMER’S DISEASE 63
Concepts in Magnetic Resonance Part A (Bridging Education and Research) DOI 10.1002/cmr.a

85. Doraiswamy M, Charles C, Krishnan R. 1998. Pre-
diction of cognitive decline in early Alzheimer’s
disease. Lancet 352:1678.
86. Pettegrew JW, Withers G, Panchalingam K, Post JF.
1987. 31P nuclear magnetic resonance (NMR) spec-
troscopy of brain in aging and Alzheimer’s disease.
J Neural Transm 24(Suppl):261–268.
87. Pettegrew JW, Panchalingam K, Withers G,
McKeag D, Strychor S. 1990. Changes in brain
energy and phospholipid metabolism during devel-
opment and aging in the Fischer 344 rat. J Neuropa-
thol Exp Neurol 49:237–249.
88. Eckert GP, Cairns NJ, Maras A, Gattaz WF, Muller
WE. 2000. Cholesterol modulates the membrane-
disordering effects of beta-amyloid peptides in the
hippocampus: specific changes in Alzheimer’s dis-
ease. Dementia Geriatr Cogn Disord 11:181–186.
89. McLean MA, Woermann FG, Barker GJ, Duncan
JS. 2000. Quantitative analysis of short echo time
H-1-MRSI of cerebral gray and white matter. Magn
Reson Med 44:401–411.
90. Auer DP, Putz B, Kraft E, Lipinski B, Schill J,Holsboer F. 2000. Reduced glutamate in the anteriorcingulate cortex in depression: an in vivo protonmagnetic resonance spectroscopy study. Biol Psy-chiatry 47:305–313.
91. Villarreal G, Petropoulos H, Hamilton DA, Rowland
LM, Horan WP, et al. 2002. Proton magnetic reso-
nance spectroscopy of the hippocampus and occipi-
tal white matter in PTSD: preliminary results. Can J
Psychiatry 47:666–670.
92. Provencher SW. 1993. Estimation of metabolite
concentrations from localized in-vivo proton NMR-
spectra. Magn Reson Med 30:672–679.
93. Behar KL, Rothman DL, Petersen KF, Hooten M,
Delaney R, et al. 1999. Preliminary evidence of low
cortical GABA levels in localized H-1-MR spectra
of alcohol-dependent and hepatic encephalopathy
patients. Am J Psychiatry 156:952–954.
94. Rosenberg DR, MacMaster FP, Keshavan MS, Fitz-
gerald KD, Stewart CM, et al. 2000. Decrease in
caudate glutamatergic concentrations in pediatric
obsessive-compulsive disorder patients taking parox-
etine. J Am Acad Child Adolesc Psychiatry 39:
1096–1103.
95. Soares JC, Boada F, Keshavan MS. 2000. Brain
lithium measurements with Li-7 magnetic resonance
spectroscopy (MRS): a literature review. Eur Neuro-
psychopharmacol 10:151–158.
96. Soares JC, Boada F, Spencer S, Mallinger AG, Dip-
pold CS, et al. 2001. Brain lithium concentrations in
bipolar disorder patients: preliminary Li-7 magnetic
resonance studies at 3 T. Biol Psychiatry 49:437–
443.
97. Tkac I, Andersen P, Adriany G, Merkle H, Ugurbil K,
et al. 2001. In vivo H-1 NMR spectroscopy of the
human brain at 7 T. Magn Reson Med 46:451–456.
98. Haase A, Frahm J, Hanicke W, Matthaei D. 1985.
1H NMR chemical shift selective (CHESS) imag-
ing. Physics Med Biol 30:341–344.
99. Kim H, Thompson RB, Hanstock CC, Allen PS.
2005. Variability of metabolite yield using STEAM
or PRESS sequences in vivo at 3.0 T, illustrated
with myo-inositol. Magn Reson Med 53:760–769.
100. Thomas MA, Hattori N, Umeda M, Sawada T, Nar-
use S. 2003. Evaluation of two-dimensional L-
COSY and PRESS using a 3 T MRI scanner: from
phantoms to human brain in vivo. NMR Biomed
16:245–251.
101. DeKosky ST. 2003. Early intervention is the key to
successful management of Alzheimer disease. Alz-
heimer Dis Assoc Disord 17:S99–104.
102. Ohm TG, Muller H, Braak H, Bohl J. 1995. Close-
meshed prevalence rates of different stages as a tool
to uncover the rate of Alzheimer’s disease-related
neurofibrillary changes. Neuroscience 64:209–217.
103. Nitsch RM, Blusztajn JK, Pittas AG, Slack BE,
Growdon JH, Wurtman RJ. 1992. Evidence for a
membrane defect in Alzheimer disease brain. Proc
Natl Acad Sci U S A 89:1671–5.
104. Kantarci K, Petersen RC, Boeve BF, Knopman DS,
Tang-Wai DF, et al. 2004. H-1 MR spectroscopy in
common dementias. Neurology 63:1393–1398.
105. Forlenza OV, Wacker P, Nunes PV, Yacubian J,
Castro CC, et al. 2005. Reduced phospholipid
breakdown in Alzheimer’s brains: a P-31 spectros-
copy study. Psychopharmacology 180:359–365.
BIOGRAPHY
Pravat K. Mandal is a graduate from In-
dian Institute of Technology, Madras. He
did his postdoctoral work at University of
California, Davis. At present, Dr. Mandal
is an assistant professor (tenure stream) at
the Department of Psychiatry, Western
Psychiatric Institute Clinic, University of
Pittsburgh Medical School. His research
interests are Alzheimer’s disease, Parkin-
son’s disease, dementia with Lewy body disease, and the role of
anesthetics in different neurodegenerative diseases. Dr. Mandal
teaches spectroscopy for graduate students.
64 MANDAL
Concepts in Magnetic Resonance Part A (Bridging Education and Research) DOI 10.1002/cmr.a