Embed Size (px)
Citation preview

1
MAGNETIC RESONANCE SPECTROSCOPY
BioE-594- Advanced MRI
By:- Rajitha Mullapudi04/04/2006
BIOE-594 04/04/2006
Topics to be Discussed:
• What is Spectroscopy.• Basic spectroscopic techniques.• What is Magnetic resonance spectroscopy.• Methodology of MRS.• Prognosis.
2
BIOE-594 04/04/2006
What is spectroscopy:
Spectroscopy deals with interactions between electromagnetic radiation and matter.It is the study of spectra that is the dependence of physical quantities on frequency.It is often used in physical and analytical chemistry for the identification of substances through the spectrum emitted or absorbed.
BIOE-594 04/04/2006
• NMR spectrum:
– Observation of chemical shift differences provides the basis for the use of NMR as a method for spectroscopic chemical analysis for identifying chemical and molecular structure.
– Resonance frequency (chemical shifts) are plotted as a function of their intensities.
3
BIOE-594 04/04/2006
Basic spectroscopic techniques
• Continuous wave method spectroscopy.• Fourier transform spectroscopy.• Proton NMR Spectroscopy.• Carbon-13 NMR Spectroscopy.• Correlation spectroscopy.
BIOE-594 04/04/2006
Continuous wave method spectroscopy
• Throughout its first two decades, nuclear magnetic resonance practice utilized a technique known as continuous-wave (CW).
• In this technique the excitation of spins is carried out by RF magnetic field of slowly changing frequency, which is present during the entire period of spectrum recording field interacts continously with the spin system, hence the name CW.
4
BIOE-594 04/04/2006
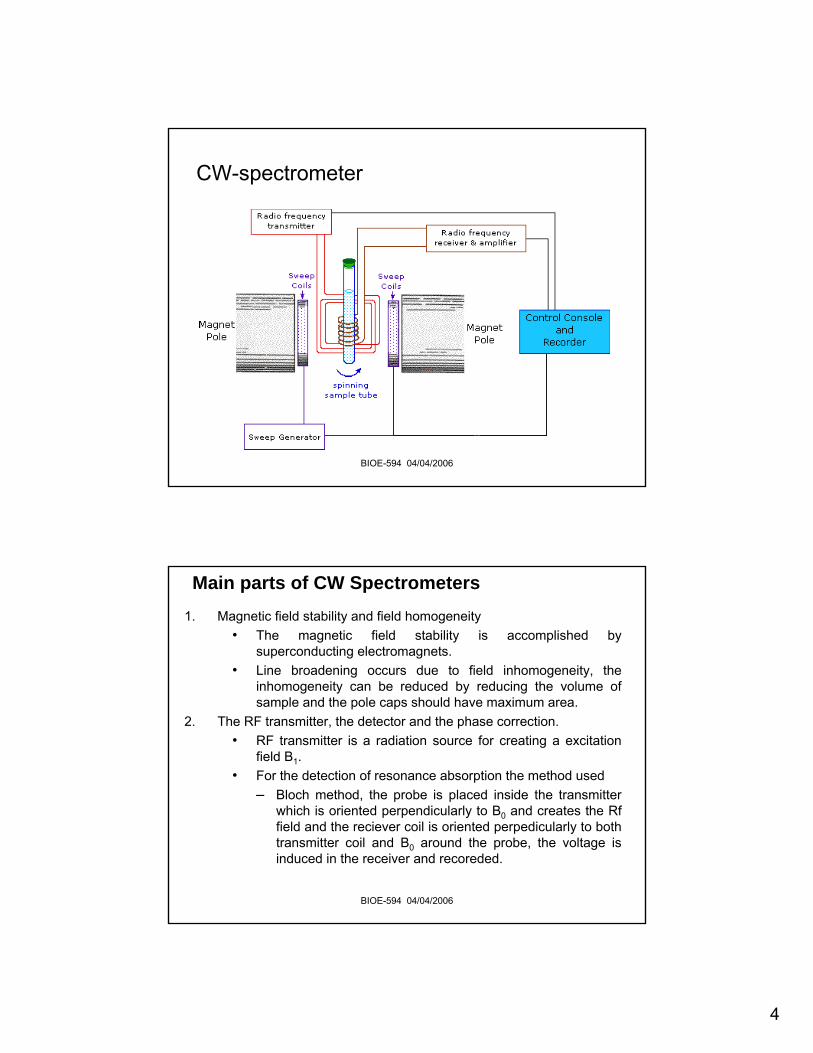
CW-spectrometer
BIOE-594 04/04/2006
Main parts of CW Spectrometers1. Magnetic field stability and field homogeneity
• The magnetic field stability is accomplished by superconducting electromagnets.
• Line broadening occurs due to field inhomogeneity, the inhomogeneity can be reduced by reducing the volume of sample and the pole caps should have maximum area.
2. The RF transmitter, the detector and the phase correction.• RF transmitter is a radiation source for creating a excitation
field B1.• For the detection of resonance absorption the method used
– Bloch method, the probe is placed inside the transmitter which is oriented perpendicularly to B0 and creates the Rffield and the reciever coil is oriented perpedicularly to both transmitter coil and B0 around the probe, the voltage is induced in the receiver and recoreded.
5
BIOE-594 04/04/2006
3. Sensitivity, spectrum accumulation.• The smaller the number of nuclei to be detected
the more sensitive is the spectrometer which is determined by the noise level. The noise level can be lowered by the elimination of possible sources of noise, a careful design of amplifiers, oscillators and power supplies, lowering the temperature of receiver coil.
• A significant increase in signal to noise ratio is possible by spectrum accumulation techniques, in which the spectra are recorded in series frequency and intensity data are added and stored in the computer connected to the spectrometer.
BIOE-594 04/04/2006
4. Spectrum integration, signal intensity measurement.
• The spectrum is integrated with the help of built in integrators.
• By measuring the step heights the intensity of the signal is measured.
5. Double resonance method.• Exciting two or more sets of nuclei with different
chemical shifts by application of two or more RF oscillators (to solve various technical problems of recording spectra).
6
BIOE-594 04/04/2006
6. NMR solvents and reference substances.• For high resolution spectra, it is advisable to
measure dilute solution.• Chloroform-d (CDCl3) is the most common solvent
for nmr measurements, due to its good solubilizingcharacter.
• Other deuterium labeled compounds, such as deuterium oxide (D2O), benzene-d6 (C6D6), acetone-d6 (CD3COCD3) are also available for use as nmr solvents.
BIOE-594 04/04/2006
Fourier Transform NMR Spectroscopy
• The FT spectrometers became widespread at the beginning of 1970’s.
• The magnetic nuclei are excited by short RF pulses of discrete frequency, and the spectroscopic information is recorded after switching off the RF field.
• An interferogram is obtained (figure) which is transformed by the computer of the spectrometer, using the principle of Fourier analysis, into the usual frequency-dependent absorption spectrum.
• The interferogram is produced by the difference between the frequency of the RF field and the larmor frequencies of the magnetic moment components induced by RF field.
7
BIOE-594 04/04/2006
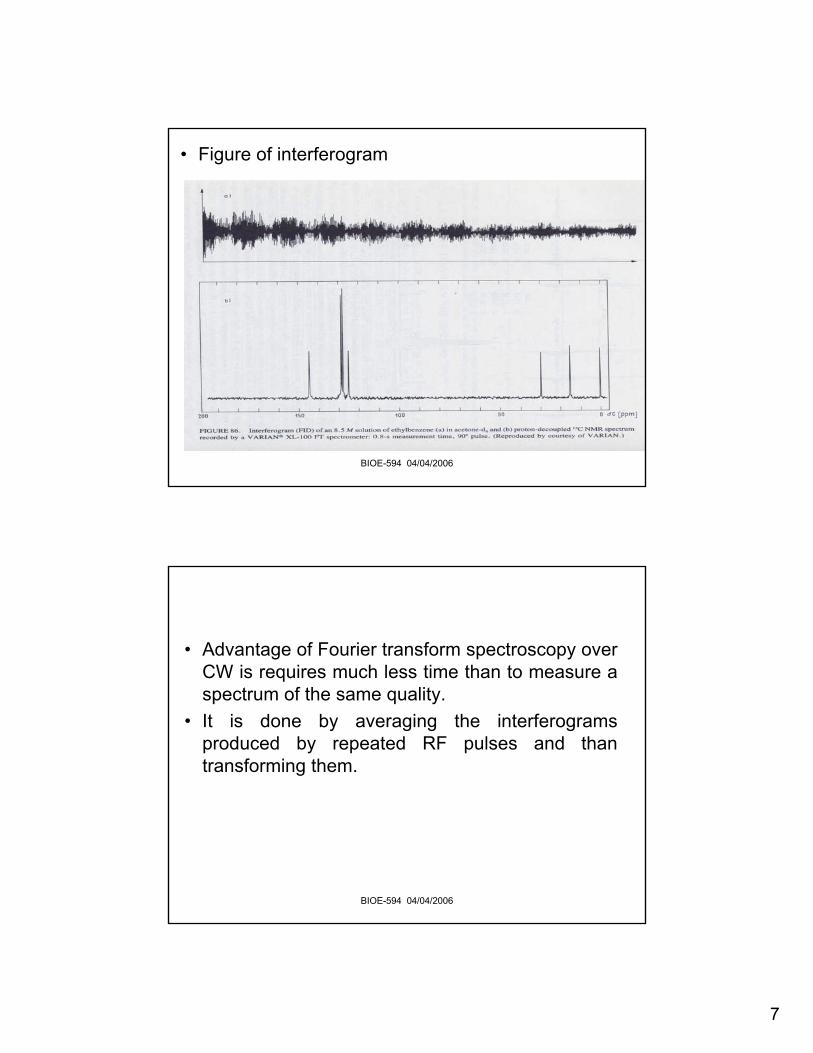
• Figure of interferogram
BIOE-594 04/04/2006
• Advantage of Fourier transform spectroscopy over CW is requires much less time than to measure a spectrum of the same quality.
• It is done by averaging the interferograms produced by repeated RF pulses and than transforming them.
8
BIOE-594 04/04/2006
Proton MR Spectroscopy
• An imaging method of detecting and measuring activity at the cellular level. It provides chemical information and is used in conjunction with magnetic resonance imaging (MRI), which gives spatial (3-dimensional) information.
• Proton NMR spectra are characterized by chemical shifts in the range +12 to -4 ppm.
BIOE-594 04/04/2006
Carbon-13 NMR Spectroscopy
• Carbon-13 NMR is the application of nuclear magnetic resonance in spectroscopy with respect to carbon. It is the carbon pendant of proton NMR and it allows the identification of carbon atoms in an organic molecule just as proton NMR identifies hydrogen atoms.
• The typical range of chemical shifts of 13C signals is larger than for 1H.
9
BIOE-594 04/04/2006
Correlation spectroscopy
• Correlation spectroscopy is one of several types of two-dimensional nuclear magnetic resonance (NMR) spectroscopy.
• Two-dimensional NMR spectra provide more information about a molecule than one-dimensional NMR spectra and are especially useful in determining the structure of a molecule, particularly for molecules that are too complicated to work with using one-dimensional NMR.
BIOE-594 04/04/2006
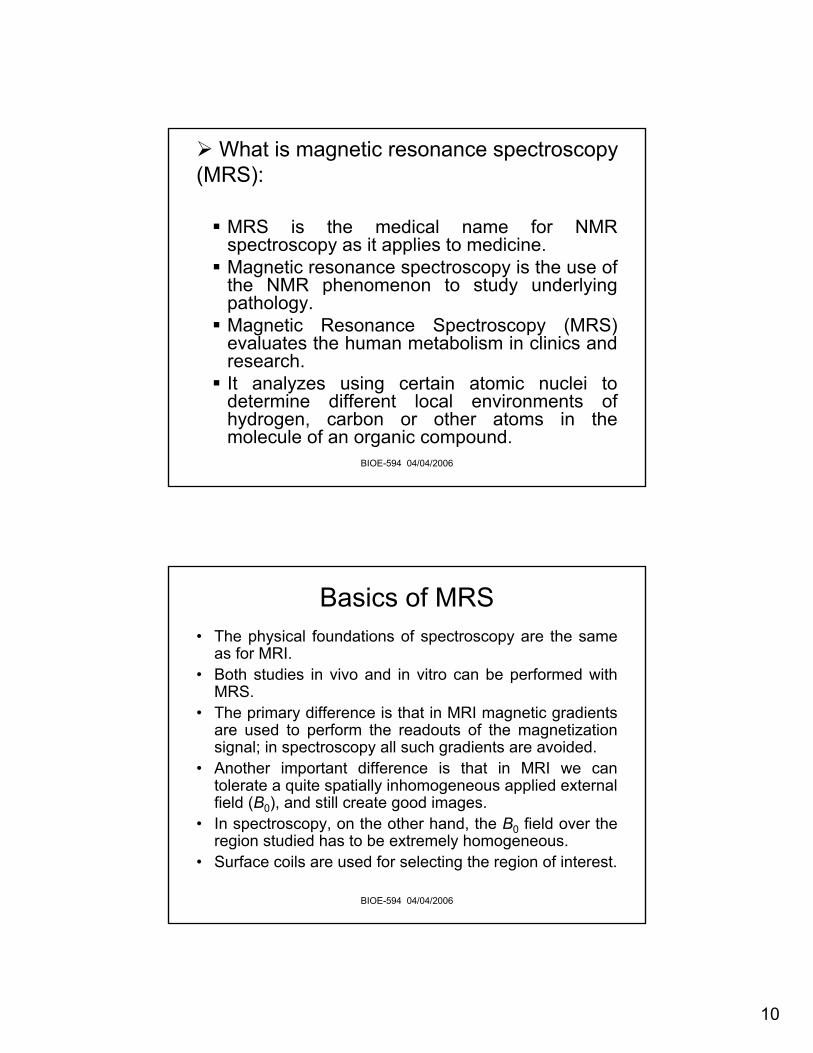
Pacific Northwest National Laboratory's high magnetic field (800 MHz) NMR spectrometer being loaded with a
sample.
10
BIOE-594 04/04/2006
What is magnetic resonance spectroscopy (MRS):
MRS is the medical name for NMR spectroscopy as it applies to medicine.Magnetic resonance spectroscopy is the use of the NMR phenomenon to study underlying pathology. Magnetic Resonance Spectroscopy (MRS) evaluates the human metabolism in clinics and research.It analyzes using certain atomic nuclei to determine different local environments of hydrogen, carbon or other atoms in the molecule of an organic compound.
BIOE-594 04/04/2006
Basics of MRS• The physical foundations of spectroscopy are the same
as for MRI. • Both studies in vivo and in vitro can be performed with
MRS.• The primary difference is that in MRI magnetic gradients
are used to perform the readouts of the magnetization signal; in spectroscopy all such gradients are avoided.
• Another important difference is that in MRI we can tolerate a quite spatially inhomogeneous applied external field (B0), and still create good images.
• In spectroscopy, on the other hand, the B0 field over the region studied has to be extremely homogeneous.
• Surface coils are used for selecting the region of interest.
11
BIOE-594 04/04/2006
• Nuclei:• Not all nuclei possess magnetic moments. Of those
that do, the spin quantum number may be greater than 1/2.
• Signals:• The factors that determine the strength of a MRS
signal depend primarily on the number of nuclei present under the coil and on the energy between the ground and excited states (the higher the better). This energy is related to the strength of the applied field B0 and the magnetic moment of the nucleus.
BIOE-594 04/04/2006
• Chemical shift• The chemical shift is frequency dependent and it is
expressed as a dimensionless number given by δ=[(Fnuc−Fref)/Fref]×106
where Fnuc is the resonance frequency of the sample and Fref is the resonance frequency of a reference sample. The chemical shift δ is expressed in ppm (parts per million) and is independent of the frequency of the magnet used.
12
BIOE-594 04/04/2006
• Spin-spin coupling:– Spin–spin coupling is the exchange of spin
between nuclei that is not propagated through space but is mediated by the binding electrons that connect the nuclei.
– Two identical spin 1/2 nuclei can exist in the following states with respect to B0.
– The last two are degenerate (i.e. identical) so that a triplet of states is created each of which can produce a unique spectrum (=triplet peak). Similarly, three such nuclei can produce a quadruplet spectrum. This coupling is independent of the applied B0 field and is measured directly in frequency units (Hz).
BIOE-594 04/04/2006
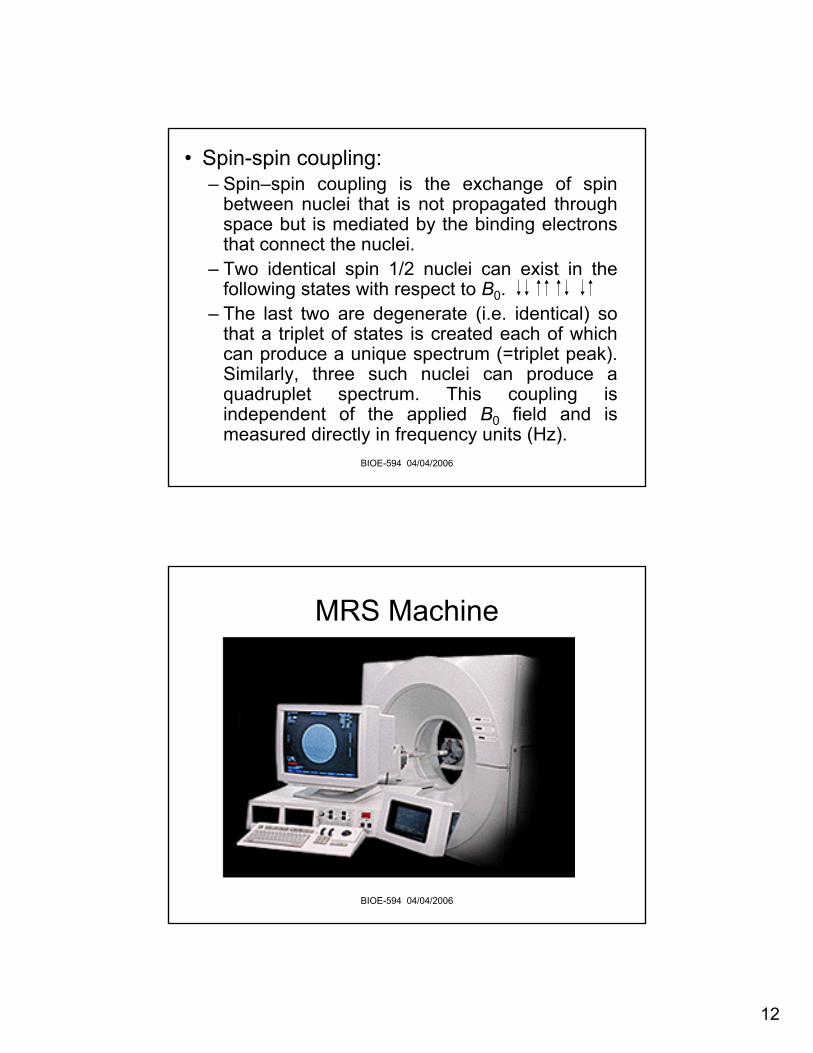
MRS Machine
13
BIOE-594 04/04/2006
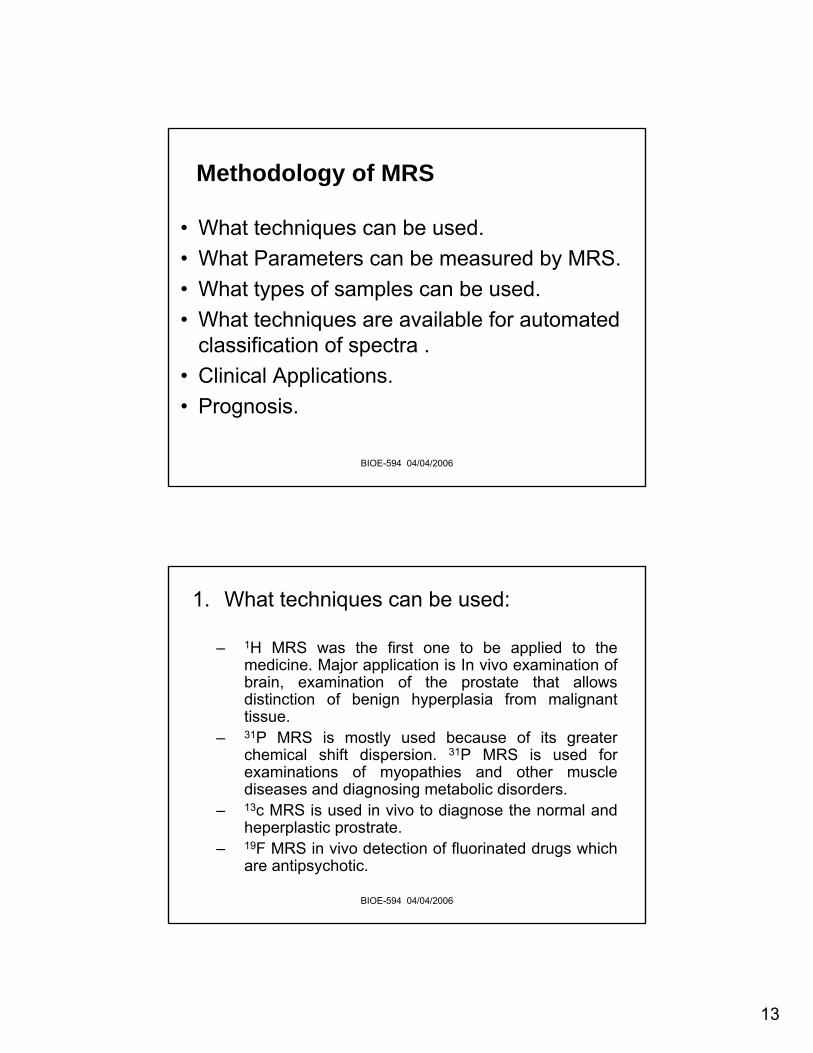
Methodology of MRS
• What techniques can be used.• What Parameters can be measured by MRS.• What types of samples can be used.• What techniques are available for automated
classification of spectra .• Clinical Applications.• Prognosis.
BIOE-594 04/04/2006
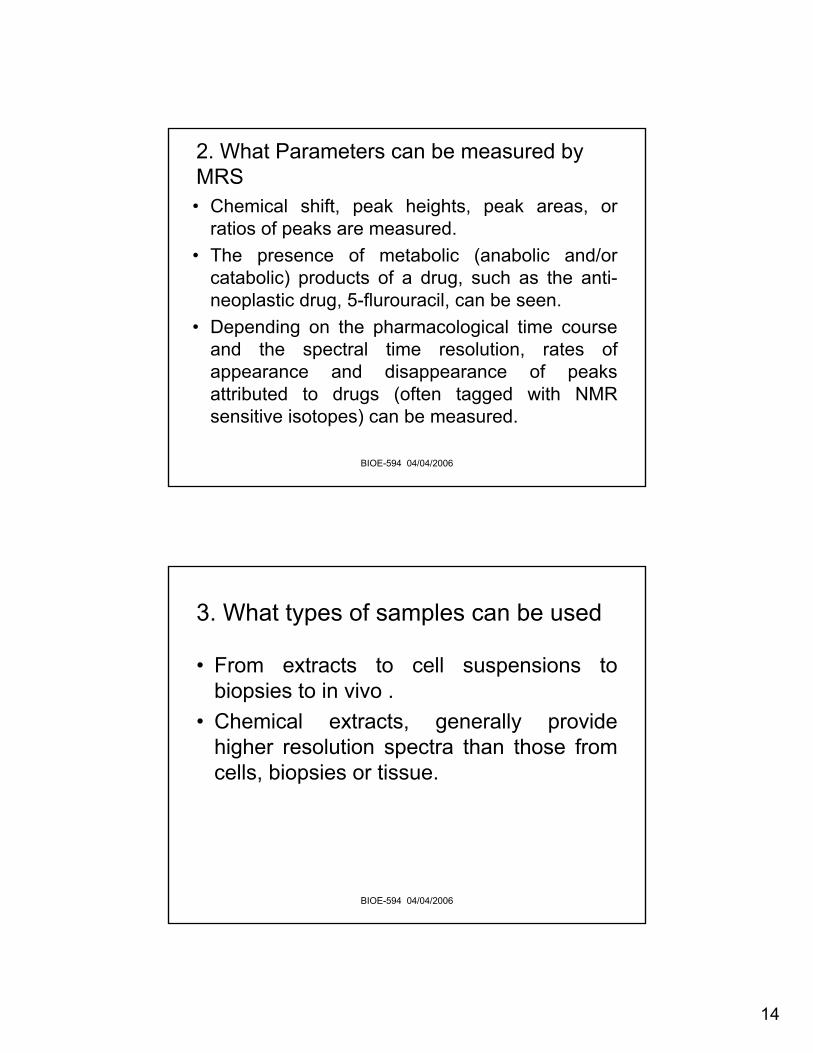
1. What techniques can be used:
– 1H MRS was the first one to be applied to the medicine. Major application is In vivo examination of brain, examination of the prostate that allows distinction of benign hyperplasia from malignant tissue.
– 31P MRS is mostly used because of its greater chemical shift dispersion. 31P MRS is used for examinations of myopathies and other muscle diseases and diagnosing metabolic disorders.
– 13c MRS is used in vivo to diagnose the normal and heperplastic prostrate.
– 19F MRS in vivo detection of fluorinated drugs which are antipsychotic.
14
BIOE-594 04/04/2006
2. What Parameters can be measured by MRS• Chemical shift, peak heights, peak areas, or
ratios of peaks are measured. • The presence of metabolic (anabolic and/or
catabolic) products of a drug, such as the anti-neoplastic drug, 5-flurouracil, can be seen.
• Depending on the pharmacological time course and the spectral time resolution, rates of appearance and disappearance of peaks attributed to drugs (often tagged with NMR sensitive isotopes) can be measured.
BIOE-594 04/04/2006
3. What types of samples can be used
• From extracts to cell suspensions to biopsies to in vivo .
• Chemical extracts, generally provide higher resolution spectra than those from cells, biopsies or tissue.
15
BIOE-594 04/04/2006
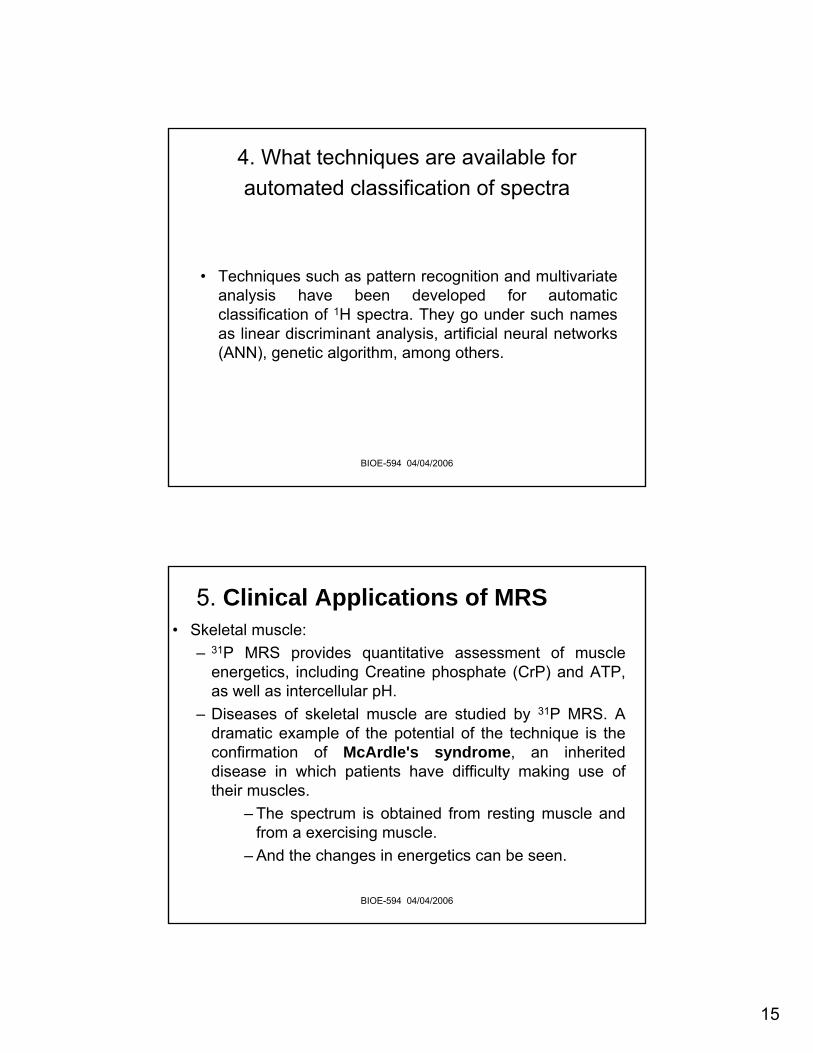
4. What techniques are available for automated classification of spectra
• Techniques such as pattern recognition and multivariate analysis have been developed for automatic classification of 1H spectra. They go under such names as linear discriminant analysis, artificial neural networks (ANN), genetic algorithm, among others.
BIOE-594 04/04/2006
5. Clinical Applications of MRS• Skeletal muscle:
– 31P MRS provides quantitative assessment of muscle energetics, including Creatine phosphate (CrP) and ATP, as well as intercellular pH.
– Diseases of skeletal muscle are studied by 31P MRS. A dramatic example of the potential of the technique is the confirmation of McArdle's syndrome, an inherited disease in which patients have difficulty making use of their muscles.
– The spectrum is obtained from resting muscle and from a exercising muscle.
– And the changes in energetics can be seen.
16
BIOE-594 04/04/2006
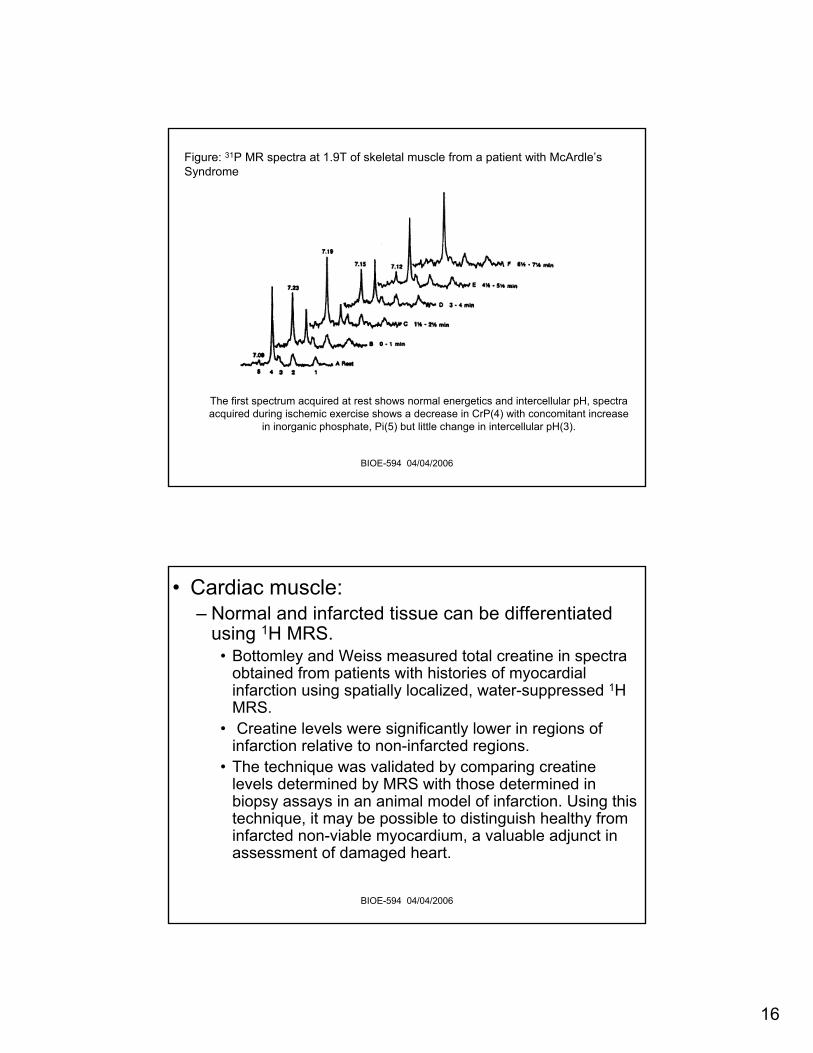
The first spectrum acquired at rest shows normal energetics and intercellular pH, spectra acquired during ischemic exercise shows a decrease in CrP(4) with concomitant increase
in inorganic phosphate, Pi(5) but little change in intercellular pH(3).
Figure: 31P MR spectra at 1.9T of skeletal muscle from a patient with McArdle’sSyndrome
BIOE-594 04/04/2006
• Cardiac muscle:– Normal and infarcted tissue can be differentiated
using 1H MRS. • Bottomley and Weiss measured total creatine in spectra
obtained from patients with histories of myocardial infarction using spatially localized, water-suppressed 1H MRS.
• Creatine levels were significantly lower in regions of infarction relative to non-infarcted regions.
• The technique was validated by comparing creatinelevels determined by MRS with those determined in biopsy assays in an animal model of infarction. Using this technique, it may be possible to distinguish healthy from infarcted non-viable myocardium, a valuable adjunct in assessment of damaged heart.
17
BIOE-594 04/04/2006
• Other Techniques used are:– Hollander and coworkers used a combination
of volume selection and 2D gradient phase encoding to suppress intense lipid signals from subcutaneous adipose and epicardiallipids, but allow signal from myocardial lipid to be observed in the human heart.
BIOE-594 04/04/2006
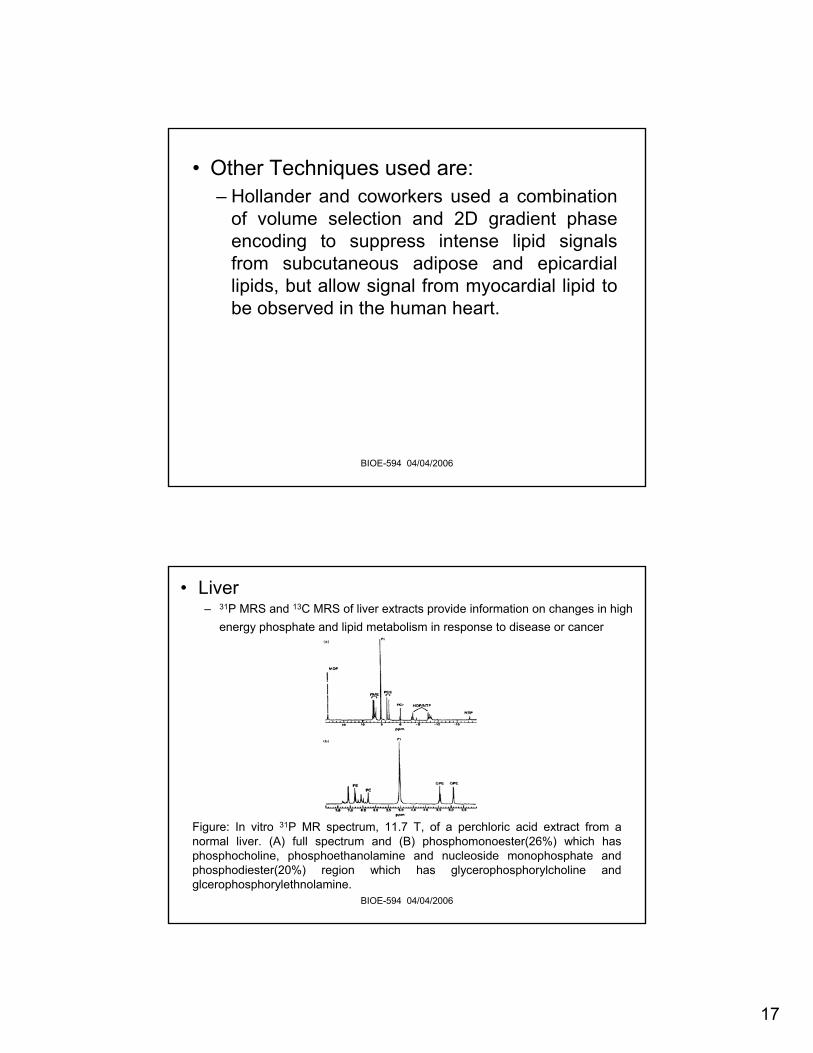
• Liver – 31P MRS and 13C MRS of liver extracts provide information on changes in high
energy phosphate and lipid metabolism in response to disease or cancer
Figure: In vitro 31P MR spectrum, 11.7 T, of a perchloric acid extract from a normal liver. (A) full spectrum and (B) phosphomonoester(26%) which has phosphocholine, phosphoethanolamine and nucleoside monophosphate and phosphodiester(20%) region which has glycerophosphorylcholine and glcerophosphorylethnolamine.
18
BIOE-594 04/04/2006
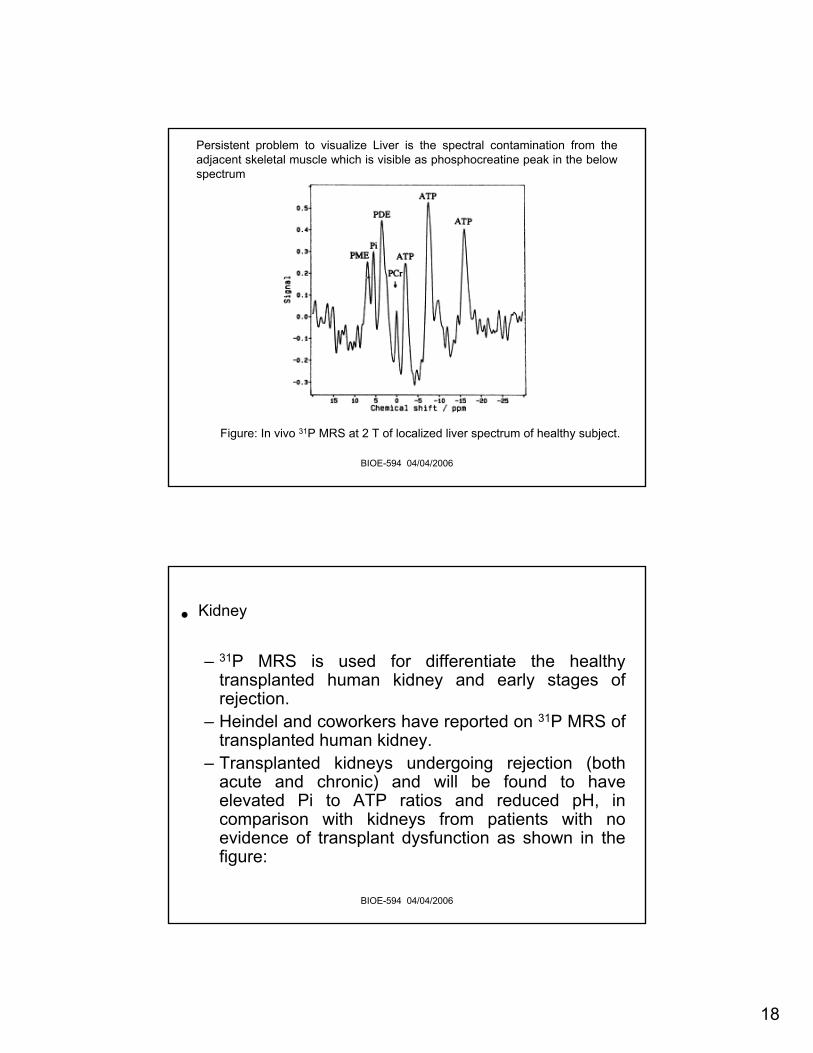
Persistent problem to visualize Liver is the spectral contamination from the adjacent skeletal muscle which is visible as phosphocreatine peak in the below spectrum
Figure: In vivo 31P MRS at 2 T of localized liver spectrum of healthy subject.
BIOE-594 04/04/2006
• Kidney
– 31P MRS is used for differentiate the healthy transplanted human kidney and early stages of rejection.
– Heindel and coworkers have reported on 31P MRS of transplanted human kidney.
– Transplanted kidneys undergoing rejection (both acute and chronic) and will be found to have elevated Pi to ATP ratios and reduced pH, in comparison with kidneys from patients with no evidence of transplant dysfunction as shown in the figure:
19
BIOE-594 04/04/2006
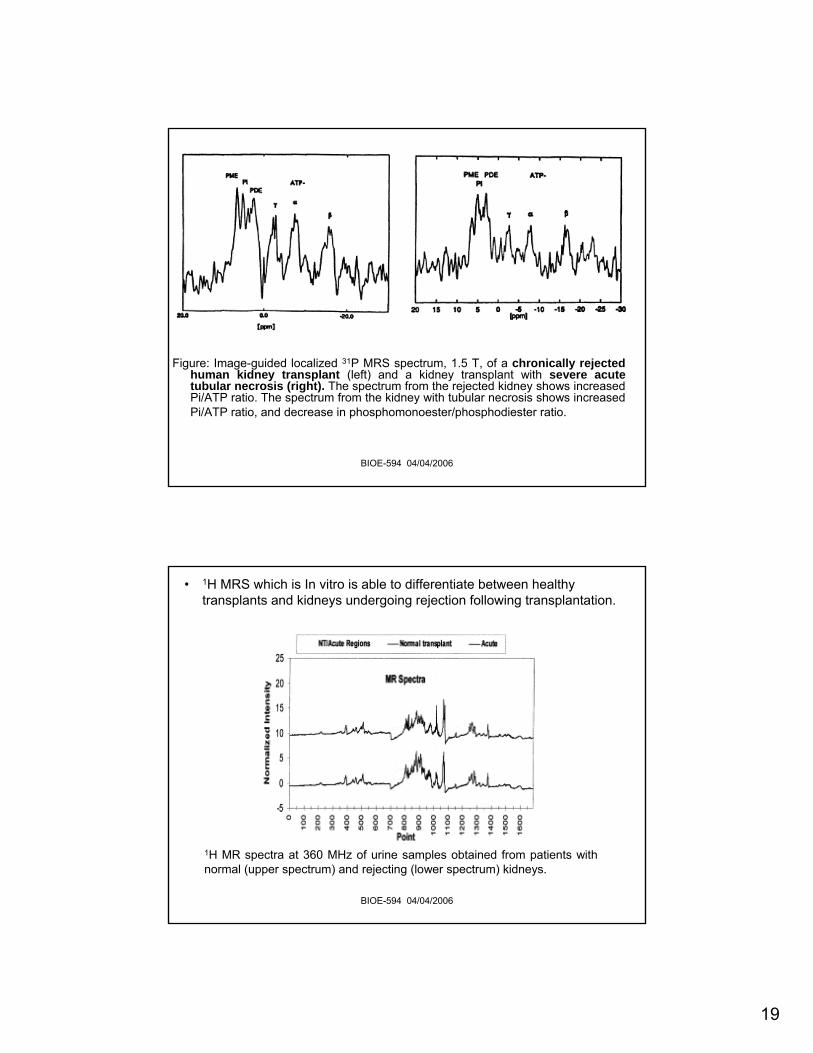
Figure: Image-guided localized 31P MRS spectrum, 1.5 T, of a chronically rejected human kidney transplant (left) and a kidney transplant with severe acute tubular necrosis (right). The spectrum from the rejected kidney shows increased Pi/ATP ratio. The spectrum from the kidney with tubular necrosis shows increased Pi/ATP ratio, and decrease in phosphomonoester/phosphodiester ratio.
BIOE-594 04/04/2006
• 1H MRS which is In vitro is able to differentiate between healthytransplants and kidneys undergoing rejection following transplantation.
1H MR spectra at 360 MHz of urine samples obtained from patients with normal (upper spectrum) and rejecting (lower spectrum) kidneys.
20
BIOE-594 04/04/2006
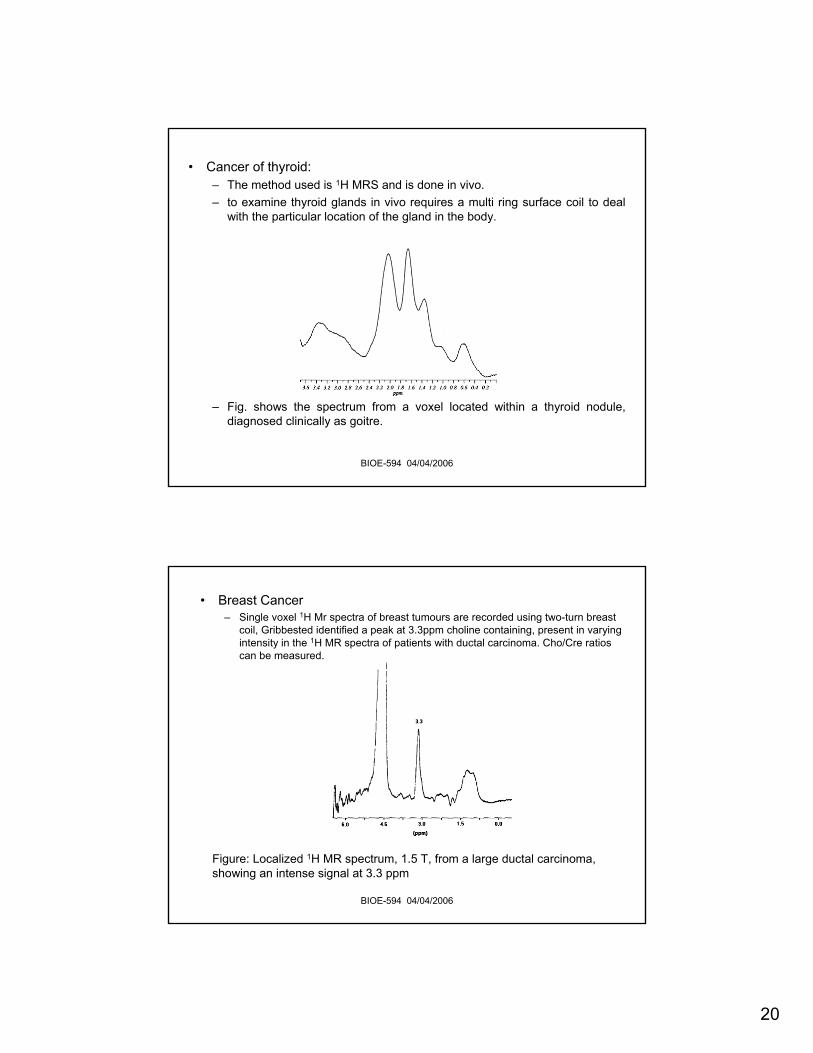
• Cancer of thyroid:– The method used is 1H MRS and is done in vivo.– to examine thyroid glands in vivo requires a multi ring surface coil to deal
with the particular location of the gland in the body.
– Fig. shows the spectrum from a voxel located within a thyroid nodule, diagnosed clinically as goitre.
BIOE-594 04/04/2006
• Breast Cancer– Single voxel 1H Mr spectra of breast tumours are recorded using two-turn breast
coil, Gribbested identified a peak at 3.3ppm choline containing, present in varying intensity in the 1H MR spectra of patients with ductal carcinoma. Cho/Cre ratios can be measured.
Figure: Localized 1H MR spectrum, 1.5 T, from a large ductal carcinoma, showing an intense signal at 3.3 ppm
21
BIOE-594 04/04/2006
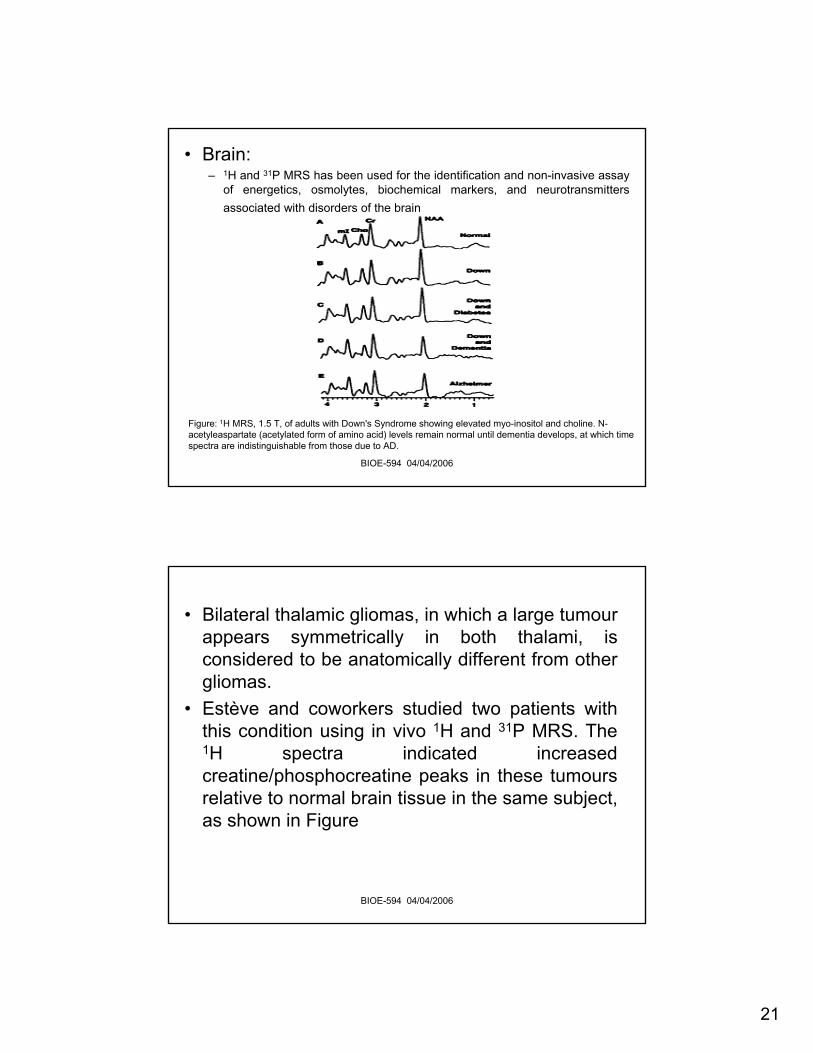
• Brain:– 1H and 31P MRS has been used for the identification and non-invasive assay
of energetics, osmolytes, biochemical markers, and neurotransmitters associated with disorders of the brain
Figure: 1H MRS, 1.5 T, of adults with Down's Syndrome showing elevated myo-inositol and choline. N-acetyleaspartate (acetylated form of amino acid) levels remain normal until dementia develops, at which time spectra are indistinguishable from those due to AD.
BIOE-594 04/04/2006
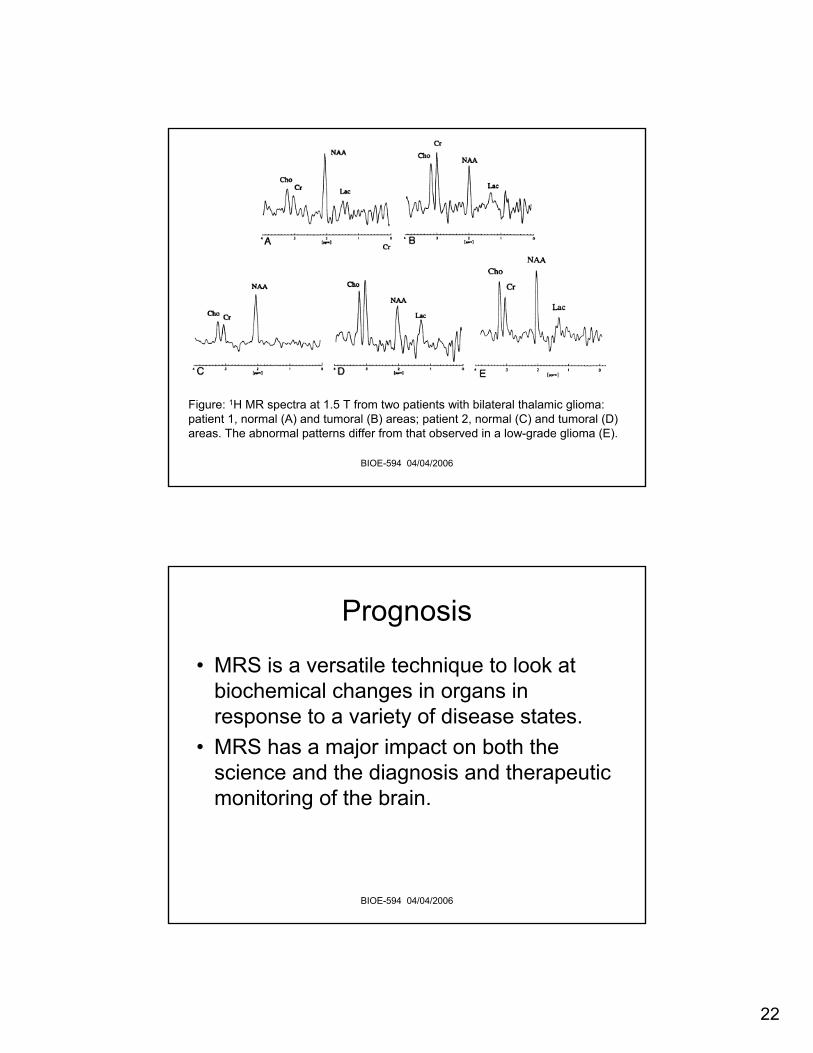
• Bilateral thalamic gliomas, in which a large tumourappears symmetrically in both thalami, is considered to be anatomically different from other gliomas.
• Estève and coworkers studied two patients with this condition using in vivo 1H and 31P MRS. The 1H spectra indicated increased creatine/phosphocreatine peaks in these tumoursrelative to normal brain tissue in the same subject, as shown in Figure
22
BIOE-594 04/04/2006
Figure: 1H MR spectra at 1.5 T from two patients with bilateral thalamic glioma: patient 1, normal (A) and tumoral (B) areas; patient 2, normal (C) and tumoral (D) areas. The abnormal patterns differ from that observed in a low-grade glioma (E).
BIOE-594 04/04/2006
Prognosis
• MRS is a versatile technique to look at biochemical changes in organs in response to a variety of disease states.
• MRS has a major impact on both the science and the diagnosis and therapeutic monitoring of the brain.
23
BIOE-594 04/04/2006
References and figures:
1. The Basics of NMR by Joseph P. Hornack.2. The Basics of MRI by Joseph P. Hornack.3. Nuclear Magnetic resonance spectroscopy volume 1 and 2 by Pal Sohar4. Progress in Nuclear magnetic resonance- Magnetic resonance
spectroscopy in medicine: Ian C. P. Smith and Laura C. Stewart