Embed Size (px)
Citation preview
1 5 m a r c h 2 0 1 8 | V O L 5 5 5 | N a T U r E | 3 5 1
LETTErdoi:10.1038/nature25781
High-resolution magnetic resonance spectroscopy using a solid-state spin sensorDavid r. Glenn1*, Dominik B. Bucher1,2*, Junghyun Lee3, mikhail D. Lukin1, hongkun Park1,4 & ronald L. Walsworth1,2
Quantum systems that consist of solid-state electronic spins can be sensitive detectors of nuclear magnetic resonance (NMR) signals, particularly from very small samples. For example, nitrogen–vacancy centres in diamond have been used to record NMR signals from nanometre-scale samples1–3, with sensitivity sufficient to detect the magnetic field produced by a single protein4. However, the best reported spectral resolution for NMR of molecules using nitrogen–vacancy centres is about 100 hertz5. This is insufficient to resolve the key spectral identifiers of molecular structure that are critical to NMR applications in chemistry, structural biology and materials research, such as scalar couplings (which require a resolution of less than ten hertz6) and small chemical shifts (which require a resolution of around one part per million of the nuclear Larmor frequency). Conventional, inductively detected NMR can provide the necessary high spectral resolution, but its limited sensitivity typically requires millimetre-scale samples, precluding applications that involve smaller samples, such as picolitre-volume chemical analysis or correlated optical and NMR microscopy. Here we demonstrate a measurement technique that uses a solid-state spin sensor (a magnetometer) consisting of an ensemble of nitrogen–vacancy centres in combination with a narrowband synchronized readout protocol7–9 to obtain NMR spectral resolution of about one hertz. We use this technique to observe NMR scalar couplings in a micrometre-scale sample volume of approximately ten picolitres. We also use the ensemble of nitrogen–vacancy centres to apply NMR to thermally polarized nuclear spins and resolve chemical-shift spectra from small molecules. Our technique enables analytical NMR spectroscopy at the scale of single cells.
In recent years, optically probed nitrogen–vacancy (NV) centres in diamond have become the leading modality for magnetic sensing at short length scales (nanometres to micrometres) under ambient conditions, with wide-ranging application in the physical and life sciences10. So far, two key challenges have limited the spectral resolu-tion of NMR detection using NV centres (NV-NMR). First, NV-NMR has been demonstrated only in nanometre-scale measurement volumes, in which the thermal (Boltzmann) spin polarization is too small to observe, but statistical fluctuations in the spin polarization11 are large and easily detected12. However, such nanometre-scale samples have short, diffusion-limited spin–noise correlation times that give rise to broad NMR spectral lines (typically much broader than 1 kHz)13. Second, the interrogation duration for NV-NMR detection techniques has generally been limited by the spin-state lifetime of the NV centre (T1 ≈ 3 ms), which is orders of magnitude shorter than the coherence times of nuclear spins in bulk liquid samples (T2 ≈ 1 s). Recent studies have shown that quantum memories can greatly extend the useful NV spin lifetime14,15. Nonetheless, such techniques have unfavourable sen-sitivity scaling with spectral resolution, η ∝ (Δ f)−1/2, because the NV probe must be in a non-interacting state while the memory is active5, and are still fundamentally limited by spin diffusion in the sample when applied at the nanometre scale. Here, we address these challenges
and achieve an NV-NMR spectral resolution of around 1 Hz by: (i) probing micrometre-scale measurement volumes to obtain a signal that is domi nated by the thermal spin polarization, which is not limited by diffusion; and (ii) using a synchronized readout protocol to sense NMR signals coherently for an arbitrary duration (up to around 103 s).
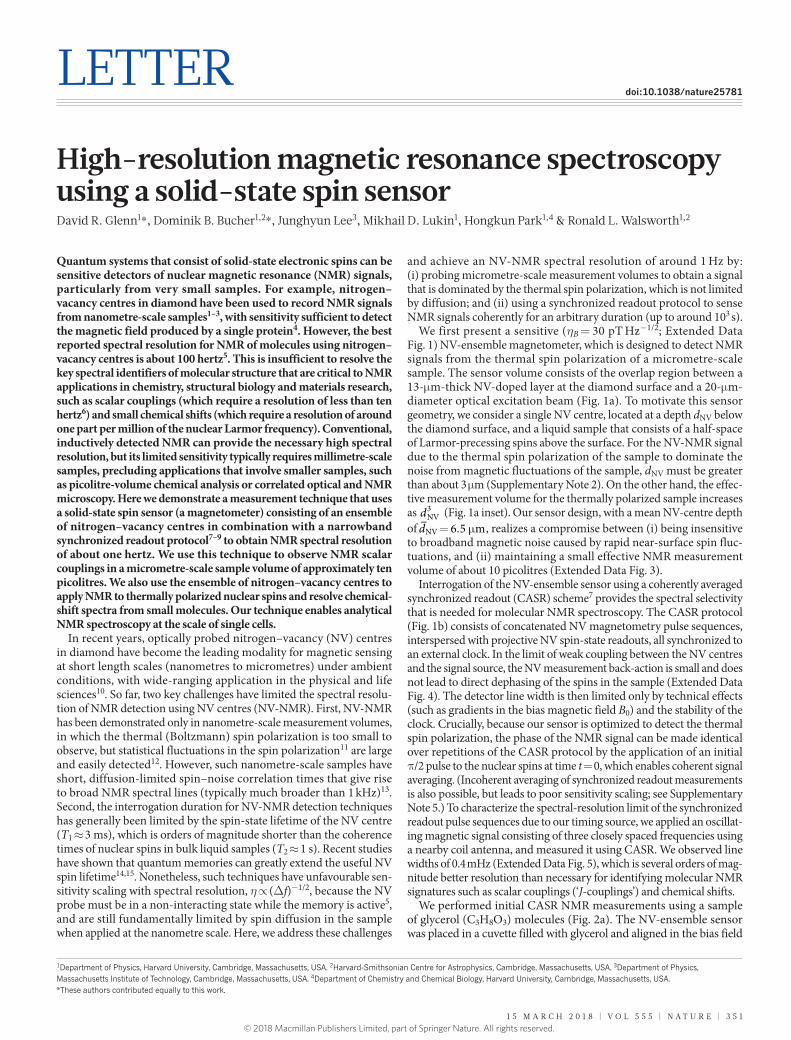
We first present a sensitive (ηB = 30 pT Hz−1/2; Extended Data Fig. 1) NV-ensemble magnetometer, which is designed to detect NMR signals from the thermal spin polarization of a micrometre-scale sample. The sensor volume consists of the overlap region between a 13-μ m-thick NV-doped layer at the diamond surface and a 20-μ m- diameter optical excitation beam (Fig. 1a). To motivate this sensor geometry, we consider a single NV centre, located at a depth dNV below the diamond surface, and a liquid sample that consists of a half-space of Larmor-precessing spins above the surface. For the NV-NMR signal due to the thermal spin polarization of the sample to dominate the noise from magnetic fluctuations of the sample, dNV must be greater than about 3 μ m (Supplementary Note 2). On the other hand, the effec-tive measurement volume for the thermally polarized sample increases as dNV
3 (Fig. 1a inset). Our sensor design, with a mean NV-centre depth of = . μd 6 5 mNV , realizes a compromise between (i) being insensitive to broadband magnetic noise caused by rapid near-surface spin fluc-tuations, and (ii) maintaining a small effective NMR measurement volume of about 10 picolitres (Extended Data Fig. 3).
Interrogation of the NV-ensemble sensor using a coherently averaged synchronized readout (CASR) scheme7 provides the spectral selectivity that is needed for molecular NMR spectroscopy. The CASR protocol (Fig. 1b) consists of concatenated NV magnetometry pulse sequences, interspersed with projective NV spin-state readouts, all synchronized to an external clock. In the limit of weak coupling between the NV centres and the signal source, the NV measurement back-action is small and does not lead to direct dephasing of the spins in the sample (Extended Data Fig. 4). The detector line width is then limited only by technical effects (such as gradients in the bias magnetic field B0) and the stability of the clock. Crucially, because our sensor is optimized to detect the thermal spin polarization, the phase of the NMR signal can be made identical over repetitions of the CASR protocol by the application of an initial π /2 pulse to the nuclear spins at time t = 0, which enables coherent signal averaging. (Incoherent averaging of synchronized readout measurements is also possible, but leads to poor sensitivity scaling; see Supplementary Note 5.) To characterize the spectral-resolution limit of the synchronized readout pulse sequences due to our timing source, we applied an oscillat-ing magnetic signal consisting of three closely spaced frequencies using a nearby coil antenna, and measured it using CASR. We observed line widths of 0.4 mHz (Extended Data Fig. 5), which is several orders of mag-nitude better resolution than necessary for identifying molecular NMR signatures such as scalar couplings (‘J-couplings’) and chemical shifts.
We performed initial CASR NMR measurements using a sample of glycerol (C3H8O3) molecules (Fig. 2a). The NV-ensemble sensor was placed in a cuvette filled with glycerol and aligned in the bias field
1Department of Physics, Harvard University, Cambridge, Massachusetts, USA. 2Harvard-Smithsonian Centre for Astrophysics, Cambridge, Massachusetts, USA. 3Department of Physics, Massachusetts Institute of Technology, Cambridge, Massachusetts, USA. 4Department of Chemistry and Chemical Biology, Harvard University, Cambridge, Massachusetts, USA.*These authors contributed equally to this work.
© 2018 Macmillan Publishers Limited, part of Springer Nature. All rights reserved.
3 5 2 | N a T U r E | V O L 5 5 5 | 1 5 m a r c h 2 0 1 8
LetterreSeArCH
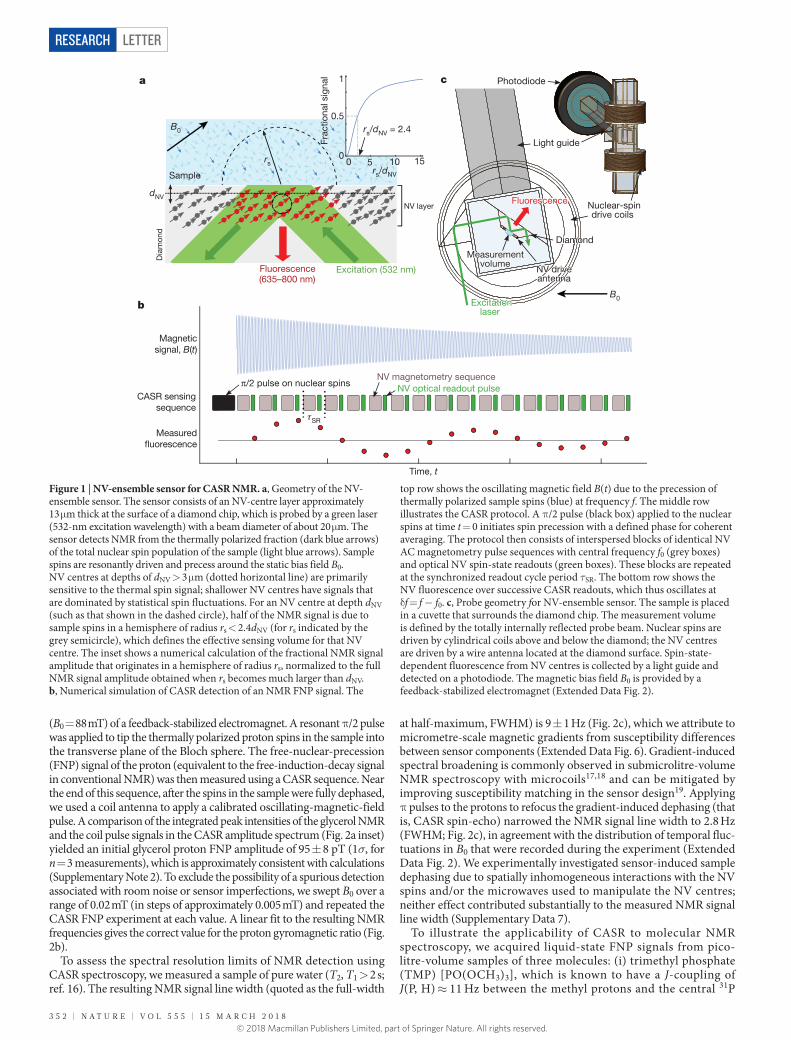
(B0 = 88 mT) of a feedback-stabilized electromagnet. A resonant π /2 pulse was applied to tip the thermally polarized proton spins in the sample into the transverse plane of the Bloch sphere. The free- nuclear-precession (FNP) signal of the proton (equivalent to the free-induction-decay signal in conventional NMR) was then measured using a CASR sequence. Near the end of this sequence, after the spins in the sample were fully dephased, we used a coil antenna to apply a calibrated oscillating- magnetic-field pulse. A comparison of the integrated peak intensities of the glycerol NMR and the coil pulse signals in the CASR amplitude spectrum (Fig. 2a inset) yielded an initial glycerol proton FNP amplitude of 95 ± 8 pT (1σ, for n = 3 measurements), which is approximately consistent with calculations (Supplementary Note 2). To exclude the possibility of a spurious detection associated with room noise or sensor imperfections, we swept B0 over a range of 0.02 mT (in steps of approximately 0.005 mT) and repeated the CASR FNP experiment at each value. A linear fit to the resulting NMR frequencies gives the correct value for the proton gyromagnetic ratio (Fig. 2b).
To assess the spectral resolution limits of NMR detection using CASR spectroscopy, we measured a sample of pure water (T2, T1 > 2 s; ref. 16). The resulting NMR signal line width (quoted as the full-width
at half-maximum, FWHM) is 9 ± 1 Hz (Fig. 2c), which we attribute to micrometre-scale magnetic gradients from susceptibility differences between sensor components (Extended Data Fig. 6). Gradient-induced spectral broadening is commonly observed in submicrolitre-volume NMR spectroscopy with microcoils17,18 and can be mitigated by improving susceptibility matching in the sensor design19. Applying π pulses to the protons to refocus the gradient-induced dephasing (that is, CASR spin-echo) narrowed the NMR signal line width to 2.8 Hz (FWHM; Fig. 2c), in agreement with the distribution of temporal fluc-tuations in B0 that were recorded during the experiment (Extended Data Fig. 2). We experimentally investigated sensor-induced sample dephasing due to spatially inhomogeneous interactions with the NV spins and/or the microwaves used to manipulate the NV centres; neither effect contributed substantially to the measured NMR signal line width (Supplementary Data 7).
To illustrate the applicability of CASR to molecular NMR spectroscopy, we acquired liquid-state FNP signals from pico-litre-volume samples of three molecules: (i) trimethyl phosphate (TMP) [PO(OCH3)3], which is known to have a J-coupling of J(P, H) ≈ 11 Hz between the methyl protons and the central 31P
B0
Excitation (532 nm)Fluorescence(635–800 nm)
dNV
rsD
iam
ond
Sample
NV layer
Light guide
Photodiode
Nuclear-spindrive coils
Diamond
Measurementvolume
NV driveantenna
B0Excitationlaser
Fluorescence
a c
b
Magneticsignal, B(t)
CASR sensingsequence
Measured�uorescence
SR
Time, t
π/2 pulse on nuclear spinsNV magnetometry sequence
NV optical readout pulse
0
0.5
1
Frac
tiona
l sig
nal
100 5 15rs/dNV
rs/dNV = 2.4
Figure 1 | NV-ensemble sensor for CASR NMR. a, Geometry of the NV-ensemble sensor. The sensor consists of an NV-centre layer approximately 13 μ m thick at the surface of a diamond chip, which is probed by a green laser (532-nm excitation wavelength) with a beam diameter of about 20 μ m. The sensor detects NMR from the thermally polarized fraction (dark blue arrows) of the total nuclear spin population of the sample (light blue arrows). Sample spins are resonantly driven and precess around the static bias field B0. NV centres at depths of dNV > 3 μ m (dotted horizontal line) are primarily sensitive to the thermal spin signal; shallower NV centres have signals that are dominated by statistical spin fluctuations. For an NV centre at depth dNV (such as that shown in the dashed circle), half of the NMR signal is due to sample spins in a hemisphere of radius rs < 2.4dNV (for rs indicated by the grey semicircle), which defines the effective sensing volume for that NV centre. The inset shows a numerical calculation of the fractional NMR signal amplitude that originates in a hemisphere of radius rs, normalized to the full NMR signal amplitude obtained when rs becomes much larger than dNV. b, Numerical simulation of CASR detection of an NMR FNP signal. The
top row shows the oscillating magnetic field B(t) due to the precession of thermally polarized sample spins (blue) at frequency f. The middle row illustrates the CASR protocol. A π /2 pulse (black box) applied to the nuclear spins at time t = 0 initiates spin precession with a defined phase for coherent averaging. The protocol then consists of interspersed blocks of identical NV AC magnetometry pulse sequences with central frequency f0 (grey boxes) and optical NV spin-state readouts (green boxes). These blocks are repeated at the synchronized readout cycle period τSR. The bottom row shows the NV fluorescence over successive CASR readouts, which thus oscillates at δ f = f − f0. c, Probe geometry for NV-ensemble sensor. The sample is placed in a cuvette that surrounds the diamond chip. The measurement volume is defined by the totally internally reflected probe beam. Nuclear spins are driven by cylindrical coils above and below the diamond; the NV centres are driven by a wire antenna located at the diamond surface. Spin-state-dependent fluorescence from NV centres is collected by a light guide and detected on a photodiode. The magnetic bias field B0 is provided by a feedback-stabilized electromagnet (Extended Data Fig. 2).
© 2018 Macmillan Publishers Limited, part of Springer Nature. All rights reserved.
1 5 m a r c h 2 0 1 8 | V O L 5 5 5 | N a T U r E | 3 5 3
Letter reSeArCH
nuclear spin20; (ii) xylene [(CH3)2C6H4], which has substantially different chemical shifts (about 5 p.p.m.) associated with the car-bon ring structure and with the satellite methyl groups; and (iii) ethyl formate [HCOOC2H5], which has three different chemical shifts and two unequal J-couplings. The CASR NMR spectrum for TMP (Fig. 3a) shows clearly resolved peaks due to the J-coupling between the protons and the spin-1/2 31P nucleus, with a splitting
of Δ fJ ≈ 13 ± 1 Hz. The CASR NMR spectrum for xylene (Fig. 3b) shows peaks split by 5.3 ± 0.5 p.p.m. (equivalent to a difference in chem-ical-shift frequency of Δ fCS ≈ 20 ± 2 Hz at our bias field), consistent with a previously reported21 value for the chemical shift. The observed peak intensity ratio of about 2.2:1 in the xylene NMR power spectrum corresponds to the relative nuclear abundance of 6:4, with the protons in high-electron-density methyl groups shifted to lower frequency. The
CA
SR
�uo
resc
ence
sig
nal
Time, t (ms)
0 50 100 150 200 900 950
0 5 1510 20
CA
SR
am
plit
ude
spec
trum
f (kHz)t (ms)
t (ms)
80 pT
95 ± 8 pT 2 4 6 8 10
CA
SR
sig
nal
12
948 950 952942 944 946
CA
SR
pow
er s
pec
trum
Frequency, f (Hz)
0 50 100–50–100
Glycerol FNP
FWHM = 30 ± 2 Hz
Water FNP
FWHM = 9 ± 1 Hz
Water echo
FWHM = 2.8 ± 0.3 Hz
CA
SR
pow
er s
pec
trum
Frequency, f (MHz)
3.7640 3.7644 3.7648 3.7652
88.41 88.42 88.43B0 (mT)
3.7640
3.7645
3.7650
f res
(MH
z)
a b c
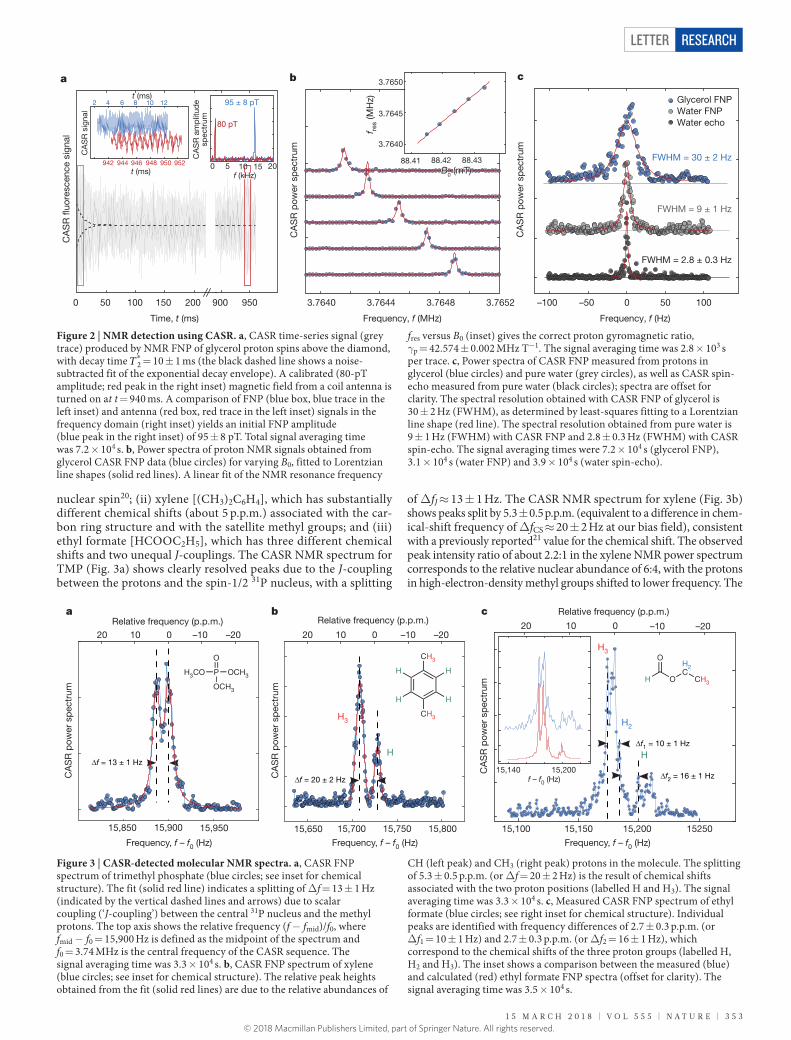
Figure 2 | NMR detection using CASR. a, CASR time-series signal (grey trace) produced by NMR FNP of glycerol proton spins above the diamond, with decay time
⁎T 2 = 10 ± 1 ms (the black dashed line shows a noise-
subtracted fit of the exponential decay envelope). A calibrated (80-pT amplitude; red peak in the right inset) magnetic field from a coil antenna is turned on at t = 940 ms. A comparison of FNP (blue box, blue trace in the left inset) and antenna (red box, red trace in the left inset) signals in the frequency domain (right inset) yields an initial FNP amplitude (blue peak in the right inset) of 95 ± 8 pT. Total signal averaging time was 7.2 × 10⁴ s. b, Power spectra of proton NMR signals obtained from glycerol CASR FNP data (blue circles) for varying B0, fitted to Lorentzian line shapes (solid red lines). A linear fit of the NMR resonance frequency
fres versus B0 (inset) gives the correct proton gyromagnetic ratio, γp = 42.574 ± 0.002 MHz T−1. The signal averaging time was 2.8 × 10³ s per trace. c, Power spectra of CASR FNP measured from protons in glycerol (blue circles) and pure water (grey circles), as well as CASR spin-echo measured from pure water (black circles); spectra are offset for clarity. The spectral resolution obtained with CASR FNP of glycerol is 30 ± 2 Hz (FWHM), as determined by least-squares fitting to a Lorentzian line shape (red line). The spectral resolution obtained from pure water is 9 ± 1 Hz (FWHM) with CASR FNP and 2.8 ± 0.3 Hz (FWHM) with CASR spin-echo. The signal averaging times were 7.2 × 10⁴ s (glycerol FNP), 3.1 × 10⁴ s (water FNP) and 3.9 × 10⁴ s (water spin-echo).
Frequency, f – f0 (Hz)
Δf1 = 10 ± 1 Hz
Δf2 = 16 ± 1 HzΔf = 20 ± 2 Hz
Δf = 13 ± 1 Hz
CA
SR
pow
er s
pec
trum
15,100 1525015,150 15,200
H3
H2
H
Relative frequency (p.p.m.)
01020 –10 –20
15,140 15,200
15,650 15,700 15,750 15,800
Frequency, f – f0 (Hz)
H
CA
SR
pow
er s
pec
trum
H3
Relative frequency (p.p.m.)
01020 –10 –20
15,850 15,900 15,950
Frequency, f – f0 (Hz)
CA
SR
pow
er s
pec
trum
Relative frequency (p.p.m.)01020 –10 –20
H3CO P
O
OCH3
OCH3
CH3
CH3
H
H H
H
H O
OH2C
CH3
a b c
f – f0 (Hz)
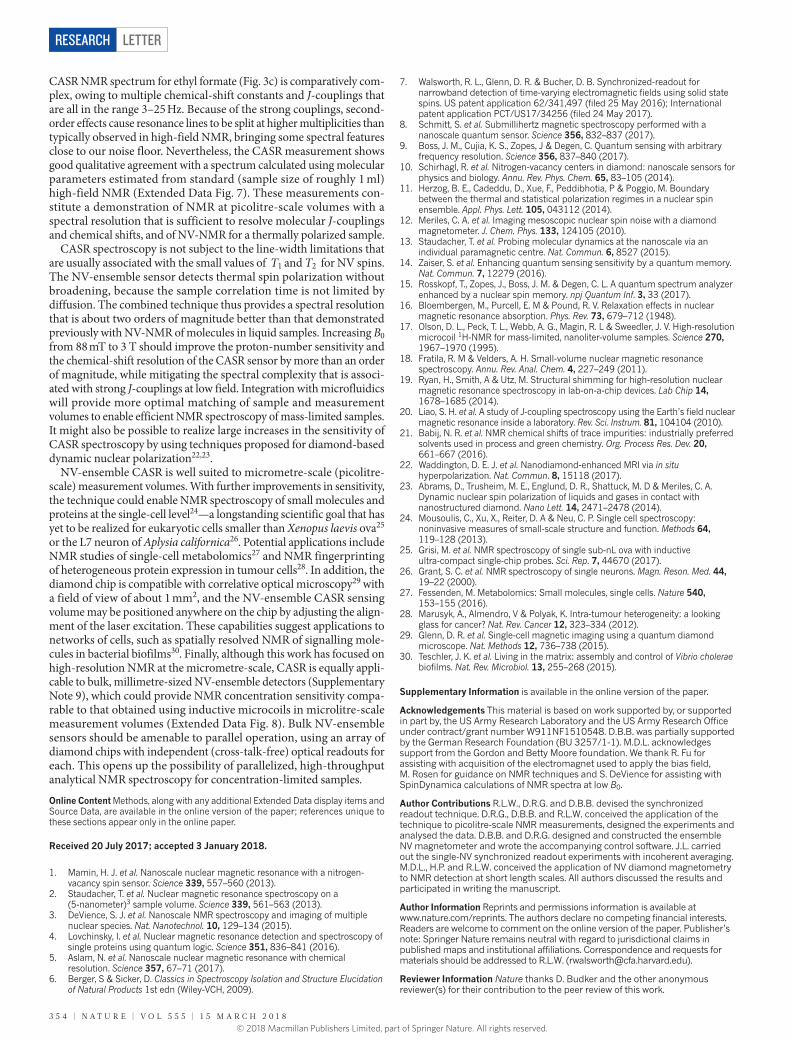
Figure 3 | CASR-detected molecular NMR spectra. a, CASR FNP spectrum of trimethyl phosphate (blue circles; see inset for chemical structure). The fit (solid red line) indicates a splitting of Δ f = 13 ± 1 Hz (indicated by the vertical dashed lines and arrows) due to scalar coupling (‘J-coupling’) between the central 31P nucleus and the methyl protons. The top axis shows the relative frequency (f − fmid)/f0, where fmid − f0 = 15,900 Hz is defined as the midpoint of the spectrum and f0 = 3.74 MHz is the central frequency of the CASR sequence. The signal averaging time was 3.3 × 10⁴ s. b, CASR FNP spectrum of xylene (blue circles; see inset for chemical structure). The relative peak heights obtained from the fit (solid red lines) are due to the relative abundances of
CH (left peak) and CH3 (right peak) protons in the molecule. The splitting of 5.3 ± 0.5 p.p.m. (or Δ f = 20 ± 2 Hz) is the result of chemical shifts associated with the two proton positions (labelled H and H3). The signal averaging time was 3.3 × 10⁴ s. c, Measured CASR FNP spectrum of ethyl formate (blue circles; see right inset for chemical structure). Individual peaks are identified with frequency differences of 2.7 ± 0.3 p.p.m. (or Δ f1 = 10 ± 1 Hz) and 2.7 ± 0.3 p.p.m. (or Δ f2 = 16 ± 1 Hz), which correspond to the chemical shifts of the three proton groups (labelled H, H2 and H3). The inset shows a comparison between the measured (blue) and calculated (red) ethyl formate FNP spectra (offset for clarity). The signal averaging time was 3.5 × 10⁴ s.
© 2018 Macmillan Publishers Limited, part of Springer Nature. All rights reserved.
3 5 4 | N a T U r E | V O L 5 5 5 | 1 5 m a r c h 2 0 1 8
LetterreSeArCH
CASR NMR spectrum for ethyl formate (Fig. 3c) is comparatively com-plex, owing to multiple chemical-shift constants and J-couplings that are all in the range 3–25 Hz. Because of the strong couplings, second- order effects cause resonance lines to be split at higher multiplicities than typically observed in high-field NMR, bringing some spectral features close to our noise floor. Nevertheless, the CASR measurement shows good qualitative agreement with a spectrum calculated using molecular parameters estimated from standard (sample size of roughly 1 ml) high-field NMR (Extended Data Fig. 7). These measurements con-stitute a demonstration of NMR at picolitre-scale volumes with a spectral resolution that is sufficient to resolve molecular J-couplings and chemical shifts, and of NV-NMR for a thermally polarized sample.
CASR spectroscopy is not subject to the line-width limitations that are usually associated with the small values of T1 and T2 for NV spins. The NV-ensemble sensor detects thermal spin polarization without broadening, because the sample correlation time is not limited by diffusion. The combined technique thus provides a spectral resolution that is about two orders of magnitude better than that demonstrated previously with NV-NMR of molecules in liquid samples. Increasing B0 from 88 mT to 3 T should improve the proton-number sensitivity and the chemical-shift resolution of the CASR sensor by more than an order of magnitude, while mitigating the spectral complexity that is associ-ated with strong J-couplings at low field. Integration with microfluidics will provide more optimal matching of sample and measurement volumes to enable efficient NMR spectroscopy of mass-limited samples. It might also be possible to realize large increases in the sensitivity of CASR spectroscopy by using techniques proposed for diamond-based dynamic nuclear polarization22,23.
NV-ensemble CASR is well suited to micrometre-scale (picolitre- scale) measurement volumes. With further improvements in sensitivity, the technique could enable NMR spectroscopy of small molecules and proteins at the single-cell level24—a longstanding scientific goal that has yet to be realized for eukaryotic cells smaller than Xenopus laevis ova25 or the L7 neuron of Aplysia californica26. Potential applications include NMR studies of single-cell metabolomics27 and NMR fingerprinting of heterogeneous protein expression in tumour cells28. In addition, the diamond chip is compatible with correlative optical microscopy29 with a field of view of about 1 mm2, and the NV-ensemble CASR sensing volume may be positioned anywhere on the chip by adjusting the align-ment of the laser excitation. These capabilities suggest applications to networks of cells, such as spatially resolved NMR of signalling mole-cules in bacterial biofilms30. Finally, although this work has focused on high-resolution NMR at the micrometre-scale, CASR is equally appli-cable to bulk, millimetre-sized NV-ensemble detectors (Supplementary Note 9), which could provide NMR concentration sensitivity compa-rable to that obtained using inductive microcoils in microlitre-scale measurement volumes (Extended Data Fig. 8). Bulk NV-ensemble sensors should be amenable to parallel operation, using an array of diamond chips with independent (cross-talk-free) optical readouts for each. This opens up the possibility of parallelized, high-throughput analytical NMR spectroscopy for concentration-limited samples.
Online Content Methods, along with any additional Extended Data display items and Source Data, are available in the online version of the paper; references unique to these sections appear only in the online paper.
received 20 July 2017; accepted 3 January 2018.
1. Mamin, H. J. et al. Nanoscale nuclear magnetic resonance with a nitrogen-vacancy spin sensor. Science 339, 557–560 (2013).
2. Staudacher, T. et al. Nuclear magnetic resonance spectroscopy on a (5-nanometer)3 sample volume. Science 339, 561–563 (2013).
3. DeVience, S. J. et al. Nanoscale NMR spectroscopy and imaging of multiple nuclear species. Nat. Nanotechnol. 10, 129–134 (2015).
4. Lovchinsky, I. et al. Nuclear magnetic resonance detection and spectroscopy of single proteins using quantum logic. Science 351, 836–841 (2016).
5. Aslam, N. et al. Nanoscale nuclear magnetic resonance with chemical resolution. Science 357, 67–71 (2017).
6. Berger, S & Sicker, D. Classics in Spectroscopy Isolation and Structure Elucidation of Natural Products 1st edn (Wiley-VCH, 2009).
7. Walsworth, R. L., Glenn, D. R. & Bucher, D. B. Synchronized-readout for narrowband detection of time-varying electromagnetic fields using solid state spins. US patent application 62/341,497 (filed 25 May 2016); International patent application PCT/US17/34256 (filed 24 May 2017).
8. Schmitt, S. et al. Submillihertz magnetic spectroscopy performed with a nanoscale quantum sensor. Science 356, 832–837 (2017).
9. Boss, J. M., Cujia, K. S., Zopes, J & Degen, C. Quantum sensing with arbitrary frequency resolution. Science 356, 837–840 (2017).
10. Schirhagl, R. et al. Nitrogen-vacancy centers in diamond: nanoscale sensors for physics and biology. Annu. Rev. Phys. Chem. 65, 83–105 (2014).
11. Herzog, B. E., Cadeddu, D., Xue, F., Peddibhotia, P & Poggio, M. Boundary between the thermal and statistical polarization regimes in a nuclear spin ensemble. Appl. Phys. Lett. 105, 043112 (2014).
12. Meriles, C. A. et al. Imaging mesoscopic nuclear spin noise with a diamond magnetometer. J. Chem. Phys. 133, 124105 (2010).
13. Staudacher, T. et al. Probing molecular dynamics at the nanoscale via an individual paramagnetic centre. Nat. Commun. 6, 8527 (2015).
14. Zaiser, S. et al. Enhancing quantum sensing sensitivity by a quantum memory. Nat. Commun. 7, 12279 (2016).
15. Rosskopf, T., Zopes, J., Boss, J. M. & Degen, C. L. A quantum spectrum analyzer enhanced by a nuclear spin memory. npj Quantum Inf. 3, 33 (2017).
16. Bloembergen, M., Purcell, E. M & Pound, R. V. Relaxation effects in nuclear magnetic resonance absorption. Phys. Rev. 73, 679–712 (1948).
17. Olson, D. L., Peck, T. L., Webb, A. G., Magin, R. L & Sweedler, J. V. High-resolution microcoil 1H-NMR for mass-limited, nanoliter-volume samples. Science 270, 1967–1970 (1995).
18. Fratila, R. M & Velders, A. H. Small-volume nuclear magnetic resonance spectroscopy. Annu. Rev. Anal. Chem. 4, 227–249 (2011).
19. Ryan, H., Smith, A & Utz, M. Structural shimming for high-resolution nuclear magnetic resonance spectroscopy in lab-on-a-chip devices. Lab Chip 14, 1678–1685 (2014).
20. Liao, S. H. et al. A study of J-coupling spectroscopy using the Earth’s field nuclear magnetic resonance inside a laboratory. Rev. Sci. Instrum. 81, 104104 (2010).
21. Babij, N. R. et al. NMR chemical shifts of trace impurities: industrially preferred solvents used in process and green chemistry. Org. Process Res. Dev. 20, 661–667 (2016).
22. Waddington, D. E. J. et al. Nanodiamond-enhanced MRI via in situ hyperpolarization. Nat. Commun. 8, 15118 (2017).
23. Abrams, D., Trusheim, M. E., Englund, D. R., Shattuck, M. D & Meriles, C. A. Dynamic nuclear spin polarization of liquids and gases in contact with nanostructured diamond. Nano Lett. 14, 2471–2478 (2014).
24. Mousoulis, C., Xu, X., Reiter, D. A & Neu, C. P. Single cell spectroscopy: noninvasive measures of small-scale structure and function. Methods 64, 119–128 (2013).
25. Grisi, M. et al. NMR spectroscopy of single sub-nL ova with inductive ultra-compact single-chip probes. Sci. Rep. 7, 44670 (2017).
26. Grant, S. C. et al. NMR spectroscopy of single neurons. Magn. Reson. Med. 44, 19–22 (2000).
27. Fessenden, M. Metabolomics: Small molecules, single cells. Nature 540, 153–155 (2016).
28. Marusyk, A., Almendro, V & Polyak, K. Intra-tumour heterogeneity: a looking glass for cancer? Nat. Rev. Cancer 12, 323–334 (2012).
29. Glenn, D. R. et al. Single-cell magnetic imaging using a quantum diamond microscope. Nat. Methods 12, 736–738 (2015).
30. Teschler, J. K. et al. Living in the matrix: assembly and control of Vibrio cholerae biofilms. Nat. Rev. Microbiol. 13, 255–268 (2015).
Supplementary Information is available in the online version of the paper.
Acknowledgements This material is based on work supported by, or supported in part by, the US Army Research Laboratory and the US Army Research Office under contract/grant number W911NF1510548. D.B.B. was partially supported by the German Research Foundation (BU 3257/1-1). M.D.L. acknowledges support from the Gordon and Betty Moore foundation. We thank R. Fu for assisting with acquisition of the electromagnet used to apply the bias field, M. Rosen for guidance on NMR techniques and S. DeVience for assisting with SpinDynamica calculations of NMR spectra at low B0.
Author Contributions R.L.W., D.R.G. and D.B.B. devised the synchronized readout technique. D.R.G., D.B.B. and R.L.W. conceived the application of the technique to picolitre-scale NMR measurements, designed the experiments and analysed the data. D.B.B. and D.R.G. designed and constructed the ensemble NV magnetometer and wrote the accompanying control software. J.L. carried out the single-NV synchronized readout experiments with incoherent averaging. M.D.L., H.P. and R.L.W. conceived the application of NV diamond magnetometry to NMR detection at short length scales. All authors discussed the results and participated in writing the manuscript.
Author Information Reprints and permissions information is available at www.nature.com/reprints. The authors declare no competing financial interests. Readers are welcome to comment on the online version of the paper. Publisher’s note: Springer Nature remains neutral with regard to jurisdictional claims in published maps and institutional affiliations. Correspondence and requests for materials should be addressed to R.L.W. ([email protected]).
reviewer Information Nature thanks D. Budker and the other anonymous reviewer(s) for their contribution to the peer review of this work.
© 2018 Macmillan Publishers Limited, part of Springer Nature. All rights reserved.
Letter reSeArCH
MethOdSNV ensemble sensor. The NV ensemble sensor was based on a 2 mm × 2 mm × 0.5 mm diamond chip, created using high-purity chemical vapour depo-sition (CVD) with 99.999% 12C isotopic purity and a bulk nitrogen concentration of [14N] < 8.5 × 1014 cm−3 (Element Six). Modification of the CVD gas mix during the final stage of growth yielded a 13-μ m-thick nitrogen-enriched top layer ([14N] ≈ 4.8 × 1018 cm−3, measured by secondary ion mass spectrometry). The diamond was electron-irradiated (flux of 1.3 × 1014 cm−2 s−1) for 5 h, and annealed in vacuum (800 °C) for 12 h, yielding an NV concentration of [NV] ≈ 3 × 1017 cm−3. The ensemble
⁎T 2 dephasing time for NV centres in this diamond, measured using
Ramsey spectroscopy, was ⁎
T 2 ≈ 750 ns. The NV-ensemble T2 decoherence time, measured using a Hahn-echo sequence, was 6.5 μ s.
For NMR measurements, the diamond was cut so that the top face was perpen-dicular to the [100] crystal axis and the lateral faces were perpendicular to [110]. All four edges of the top face were then polished at 45° (Delaware Diamond Knives), resulting in a truncated square pyramid, with a top face area of 1 mm × 1 mm. This angle polishing allowed total internal reflection of the laser beam (see Fig. 1a) to prevent direct illumination of the NMR sample. Excitation light was provided by a diode-pumped solid-state laser at 532 nm (Coherent Verdi G7), directed through an acousto-optic modulator (AOM) (IntraAction ASM802B47) to produce 5-μ s pulses. The first approximately 1 μ s of each pulse was used to optically read the spin state of the NV ensemble and the remainder of the pulse repolarized the NVs. The AOM was driven by a digitally synthesized 80-MHz sinusoid (Tektronix AWG 7122C), amplified to 33 dBm (Minicircuits ZHL-03-5WF), and the total laser power at the sensor volume was 150 mW. The laser was focused to an approxi-mately 20-μ m-diameter waist near the position of the NV sensor layer, resulting in an optical intensity of 48 kW cm−2 (comparable to the typical NV saturation intensity Isat ≈ 100 kW cm−2).
For all NMR experiments, the diamond was mounted by gluing (Epoxy Technology Inc., EPO-TEK 301) to a 3-mm glass prism (Thorlabs PS905) and placed inside a sample cuvette (FireflySci Type4 Microfluorescence Cuvette). The diamond was then rotated so that a [111] diamond crystal axis was aligned to the static bias magnetic field B0. NV centres aligned along this axis were used for sensing, whereas those along the other three [111] directions were far off-resonance and contributed only to the background fluorescence. (The background fluores-cence contribution from non-aligned NV centres was minimized by adjusting the linear polarization angle of the excitation laser.) The magnetic-field alignment was carried out by overlapping the pulsed electron spin resonance (ESR) frequencies of the three non-aligned axes with one another. The bias magnetic field strength was B0 = 88 mT, such that the resonance frequency of the | ms = 0⟩ → | ms = − 1⟩ spin transition for the aligned NV centres was fNV-Larmor = 400 MHz. (The | ms = 0⟩ → | ms = + 1⟩ resonance frequency was 5,340 MHz.)
NV magnetometry pulse sequences for magnetic resonance detection were carried out on the | ms = 0⟩ → | ms = − 1⟩ transition. Microwaves were delivered using a straight length of wire (0.25-mm diameter) positioned above the diamond, approximately 0.4 mm away from the NV sensing volume. The 400-MHz carrier frequency and the pulse modulation were both synthesized digitally (Tektronix AWG 7122C); pulses were then amplified to 40 dBm (Minicircuits ZHL-100W-52-S+ ) and coupled into the wire, yielding a NV Rabi frequency of fΩ = 5.6 MHz. (The maximum achievable NV Rabi frequency using the full output of the amplifier was fΩ = 16.6 MHz.) An XY8-4 or XY8-6 dynamical decoupling sequence was used to detect magnetic resonance signals selectively around 3.755 MHz, which is the proton Larmor frequency at B0 = 88 mT. The phase of the final π /2 pulse of the sequence was optimized to give a fluorescence corresponding to a mixed state of the NV (that is, equal to the mean fluorescence over one Rabi oscillation), to make the fluorescence signal linearly sensitive to small magnetic-field amplitudes. For an ideal two-level quantum system, this condition would correspond to a 90° phase shift between the initial and final π /2 pulses; in practice, the small drive detunings associated with the 14NV hyperfine structure required manual optimization of the phase. To reject laser intensity noise and microwave power fluctuations, the phase of the final π /2 pulse of every second synchronized readout magnetometry sub-sequence was shifted by 180° relative to the nominal value, and successive pairs of readouts were amplitude-subtracted. Thus, one synchronized readout time-series data point was recorded for every two magnetometry subsequences.
Spin-state-dependent fluorescence from the NV centres was collected with a glass (BK-7) light guide (Edmund Optics 5-mm Aperture, 120 mm L, Low NA Hexagonal Light Pipe) and delivered to a balanced photodiode module (Thorlabs PDB210A). To eliminate scatter from the excitation laser, an interference filter (Semrock BLP01-647R) was placed between the light guide and the detector. A small fraction of the excitation beam was split off upstream of the diamond chip and directed to the second channel of the balanced diode module. A glass slide mounted on a motorized stage (Thorlabs PRM1Z8) in the second path enabled
automated re-balancing between averages during long synchronized readout signal acquisitions. When the NV centres were fully polarized in | ms = 0⟩, the light- induced fluorescence signal produced a single-channel (unbalanced) photocurrent of 30 μ A. Immediately after applying a microwave π pulse, the single-channel photo current was 28 μ A, indicating a maximum fluorescence contrast of about 7%. The difference signal of the photodiode module (with onboard transimpedance gain of 1.75 × 10⁵ V A−1) was further amplified by 3 dB and low-pass-filtered at 1 MHz using a low-noise pre-amplifier unit (Stanford Research SR-560), then recorded with a digital-to-analogue converter (DAQ) (National Instruments NI-USB 6281). The DAQ bandwidth was 750 kHz and the digitization was on-demand, triggered by a transistor–transistor logic (TTL) pulse from the arbitrary-waveform generator (AWG) used to control the experiment. The delay between the rising edges of the AOM gate pulse and the DAQ trigger was optimized for maximum spin-state-dependent fluorescence signal.Synchronized readout protocol and data analysis. The synchronized readout protocol, including CASR detection of NMR, consists of a series of repeated NV AC magnetometry subsequences, with each subsequence followed by a projective NV spin-state readout. The protocol is defined with respect to a particular central frequency f0. The repeated AC magnetometry subsequences are all identical, each consisting of an initial π /2 pulse, followed by a train of π pulses applied at a rate of 2f0, and ending with another π /2 pulse. The initial and final π /2 pulses are chosen to have a relative phase shift, such that the final NV spin population is linearly dependent on the amplitude of the oscillating magnetic-field signal. (The choice of linear, rather than quadratic, dependence of the final NV population on magnetic field strength is important for minimizing sensitivity to noise due to sample fluctu-ations and diffusion; see Supplementary Note 10). At every synchronized readout step, the accumulated NV spin population is measured via spin-state-dependent fluorescence and the NV spin is optically repolarized. The delay between the start of successive magnetometry subsequences in the synchronized readout protocol is an integer number k of periods at the central frequency, τSR = k/f0. The range of signal frequencies f that can be detected without aliasing is therefore given by f0 ± 1/(2τSR).
In the experiments described here, the synchronized readout cycle period τSR, the reciprocal central synchronized readout detection frequency 1/f0 = 1/(3.74065 MHz) = 267.3 ns, and the reciprocal NV drive frequency 1/fNV-Larmor = 1/(400 MHz) = 2.5 ns were all chosen to be exact integer multiples of the clock period of the timing generator (Tektronix AWG 7122C), τclock = 1/(12 GHz) = 0.083 ns. (The use of integer frequency sub-multiples effectively determined the exact value of B0 used in our experiments; non-integer sub- multiples may be used if necessary, at the expense of introducing a series of discrete spectral artefacts into the synchronized readout spectrum.) The NV magnetometry pulse sequence (XY8-4 or XY8-6) was saved in the memory of the AWG and its output was gated by a TTL signal from a programmable pulse generator (Spincore PulseBlasterESR-PRO 500 MHz). The PulseBlaster gate determined the number of synchronized readout iterations per experiment nSR, resulting in a synchro-nized readout measurement duration of T = nSRτSR. When detecting the NMR signals using CASR (in experiments shown in Figs 2, 3), the pulse blaster also generated the TTL pulse for gating the proton-driving radio-frequency pulses. All FNP experiments used a single proton π /2 pulse at the start of the experi-ment (t = 0); the water echo experiment (Fig. 2c) used proton π pulses also at t = 40 ms and t = 120 ms. Each readout of the synchronized readout protocol was saved in a numerical array, giving a time series of length nSR. Individual time series were averaged Navg times to improve the signal-to-noise ratio. A summary of the synchronized readout parameters for each experiment described in the main text is as follows: glycerol FNP (Fig. 2a), XY8-4 sub-sequences, τSR = 24.06 μ s, nSR = 4 × 10⁴, T = 0.962 s, Navg = 7.5 × 10⁴; glycerol FNP (Fig. 2b), XY8-4 sub- sequences, τSR = 24.06 μ s, nSR = 2 × 10³, T = 0.048 s, Navg = 5.8 × 10⁴; glycerol FNP (Fig. 2c), XY8-4 sub-sequences, τSR = 24.06 μ s, nSR = 4 × 10⁴, T = 0.962 s, Navg = 7.5 × 10⁴; water FNP (Fig. 2c), XY8-4 sub-sequences, τSR = 24.06 μ s, nSR = 8 × 10⁴, T = 1.925 s, Navg = 1.6 × 10⁴; water echo (Fig. 2c), XY8-4 sub- sequences, τSR = 24.06 μ s, nSR = 8 × 10⁴, T = 1.925 s, Navg = 2.0 × 10⁴; molecule FNPs (Fig. 3a, b), XY8-6 sub-sequences, τSR = 24.06 μ s, nSR = 4 × 10⁴, T = 0.962 s, Navg = 3.4 × 10⁴; molecule FNP (Fig. 3c), XY8-6 sub-sequences, τSR = 24.06 μ s, nSR = 4 × 10⁴, T = 0.962 s, Navg = 3.6 × 10⁴; coil signal (Extended Data Fig. 6c), XY8-4 sub-sequences, τSR = 1.2 ms, nSR = 2.5 × 10⁶, T = 3,000 s, Navg = 1.
For CASR-NMR measurements, the first 20 time-series data points, which coincided with the proton π /2 pulse plus approximately 50 times the coil ring-down time, were discarded from the recorded time-series data. After averaging in the time domain, the data were mean-subtracted and then Fourier transformed and fitted using MATLAB. Each spectrum was fitted to both Lorentzian and Gaussian line shapes, and the model with smaller residuals (the Lorentzian in all cases except that of Fig. 3b) was selected for display. Unless otherwise speci-
© 2018 Macmillan Publishers Limited, part of Springer Nature. All rights reserved.
LetterreSeArCH
fied, all spectra shown in the figures are power spectra, calculated as the squared absolute value of the Fourier-transformed time-series data. (This differs from the convention of standard NMR, where spectra are typically presented as the real or imaginary part of the Fourier transform; the difference is accounted for in the form of the fit functions used.) Before squaring to obtain the power spectrum, the com-plex Fourier-transformed data were smoothed (boxcar convolution) using a square filter width of 1.0 Hz (Fig. 2c, spin echo), 1.5 Hz (Fig. 2c, FNPs), 2.5 Hz (Fig. 3a, b) or 3.0 Hz (Fig. 3c). When uncertainties are quoted for the spectral line width or the splitting parameters, they were estimated by repeating the full experiment (including all averages) and fitting procedure n ≥ 3 times, then calculating the sample standard deviation
∑σ=
− ⟨ ⟩−
/x xn
( )1j
j2 1 2
over the ensemble of fitted parameters. Uncertainties reported are 1σ in every case.Electromagnet. The bias magnetic field B0 was produced by an air-cooled electro-magnet (Newport Instruments Type A). The pole pieces were cylindrical, 10 cm in diameter, with an adjustable gap set to 3 cm. The main coils (each 1,900 turns of copper strip, with room-temperature resistance R = 4.5 Ω ) were driven (Hewlett Packard HP 6274) with a continuous current of about 650 mA to produce a nominal field of B0 ≈ 88 mT. We operated at B0 ≤ 0.1 T to obtain a relatively low NV Larmor frequency fNV-Larmor = 400 MHz, at which inexpensive power amplifiers for generating NV drive pulses are readily available. The choice of B0 = 88 mT enabled the NV and proton Larmor frequencies to be integer sub-multiples of the AWG clock frequency, as described in Methods section ‘Synchronized readout protocol and data analysis’. A secondary coil pair (diameter, 10 cm; gap, 7 cm; 15 turns each) was manually wound around the poles to enable precise field stabilization without the need for very small adjustments to the main current supply. The secondary coils were driven by a voltage-controlled current supply (Thorlabs LDC205C), controlled by the analogue output channel of a DAQ (National Instruments PCI 6036E).Magnetic bias field stabilization. The static bias field B0 generated by the electro-magnet was stabilized actively using two feedback systems. On short time scales, the field stabilization relied on a secondary NV-diamond magnetometer performing continuous-wave ESR measurements. The secondary magnetometer was posi-tioned between the electromagnet poles, approximately 1 cm away from the primary ensemble NV-NMR sensor (Extended Data Fig. 2). The continuous-wave ESR microwave-frequency modulation was locked to the main synchronized read-out experiment using the same AWG (Tektronix AWG 7122C) to ensure that any cross-talk between the detectors was coherent over averages of the synchronized readout protocol and could be removed during data analysis. (This precaution proved unnecessary in most of the CASR NMR experiments because the contin-uous-wave ESR drive power was too weak to produce a measureable effect on the CASR sensor.) The excitation laser, light collection optics and microwave drive for the secondary experiment were all independent from those of the main syn-chronized readout magnetic resonance sensor. This enabled feedback control over magnetic-field fluctuations (primarily due to current noise in the main coils) with a bandwidth of about 12.5 Hz, resulting in short-term (around 30 min) field stability, σB ≈ 15 nT (root-mean-square).
To correct slow drifts between the main magnetic resonance sensor and the secondary field-stabilization sensor, we paused the synchronized readout protocol between averages periodically (every 5 min) and performed pulsed ESR
measurements on the primary NV-diamond sensor. Any measured magnetic-field drifts were used to correct the set-point of the fast feedback loop to ensure long-term (about 50 h) stability, σB ≈ 23 nT (root-mean-square). We therefore conclude that residual B0 fluctuations limit the observed proton NMR line width to approxi-mately Γ ≈ 2[2ln(2)]1/2 × 23 nT × 42.58 MHz T−1 = 2.3 Hz (FWHM).
All continuous-wave ESR measurements were carried out using both the | ms = 0⟩ → | ms = − 1⟩ and the | ms = 0⟩ → | ms = + 1⟩ transitions of the aligned NV centres, to distinguish resonance shifts due to changes in temperature31 and magnetic field. For fast-feedback measurements on the secondary field- stabilization sensor, we monitored only four discrete optically detected magnetic resonance (ODMR) frequencies to maximize bandwidth. This system was potentially susceptible to second-order feedback errors associated with simul-taneous changes in B0 and temperature. We therefore anchored the secondary field- stabilization sensor thermally to a piece of black-anodized aluminium and stabilized its temperature actively using absorption from a separate DPSS laser (Thorlabs DJ532-40). Temperature control was not required for slow feedback on the main magnetic resonance sensor, where we acquired a full ODMR spectrum (58 frequency points) to fully account for all drifts in magnetic field, temperature and optical contrast.NMR drive coils. Radio-frequency pulses for driving sample proton spins were produced by a pair of cylindrical coils wound around the sample cuvette. This geometry, with 1.1-cm coil diameter and 1.2-cm centre-to-centre spacing, provided a combination of strong drive fields and convenient optical access to the NV-ensemble sensor. The coils were 22 turns each, connected in series and coupled to the current source (Rigol DG 1032) with a standard network of variable matching and coupling capacitors32. After tuning, the resonance frequency was 3.75 MHz and the quality factor (Q) of the coil was 140. Driving the coils on resonance, we obtained a maximum nuclear-spin Rabi frequency of fΩ,nuc ≈ 8 kHz.NMR samples. Deionized water was obtained from Ricca Chemical Company (part number 9150-5). p-xylene, glycerol, trimethyl phosphate and ethyl formate were purchased from Sigma Aldrich (catalogue numbers 296333, G9012, 241024 and 112682, respectively) and used without dilution or modification. The glycerol sample may have contained some atmospherically absorbed water (less than 20% by volume).Comparison between CASR and microcoils. We compared the sensitivity and measurement volume of NV-NMR sensing using CASR with recently demon-strated micrometre-scale inductive detectors (Extended Data Fig. 8). The compari-son was based primarily on data from a review of microscale detectors33, with the addition of two more recent results25,34. We excluded data points from the review that correspond to demonstrations of magnetic resonance imaging; only measure-ments of multi-component spectra were included. Sensitivities for the inductive detectors were extrapolated to a common bias field of B0 = 14.1 T.Data availability. The data that support the findings of this study are available from the corresponding author on reasonable request. Source Data for Figs 2 and 3 are available with the online version of the paper.
31. Acosta, V. M. et al. Temperature dependence of the nitrogen-vacancy magnetic resonance in diamond. Phys. Rev. Lett. 104, 070801 (2010).
32. Wheeler, D. D. & Conradi, M. S. Practical exercises for learning to construct NMR/MRI probe circuits. Concepts Magn. Reson. 40A, 1–13 (2012).
33. Badilita, V. et al. Microscale nuclear magnetic resonance: a tool for soft matter research. Soft Matter 8, 10583–10597 (2012).
34. Finch, G., Yilmaz, A. & Utz, M. An optimized detector for in-situ high-resolution NMR in microfluidic devices. J. Magn. Reson. 262, 73–80 (2016).
© 2018 Macmillan Publishers Limited, part of Springer Nature. All rights reserved.
Letter reSeArCH
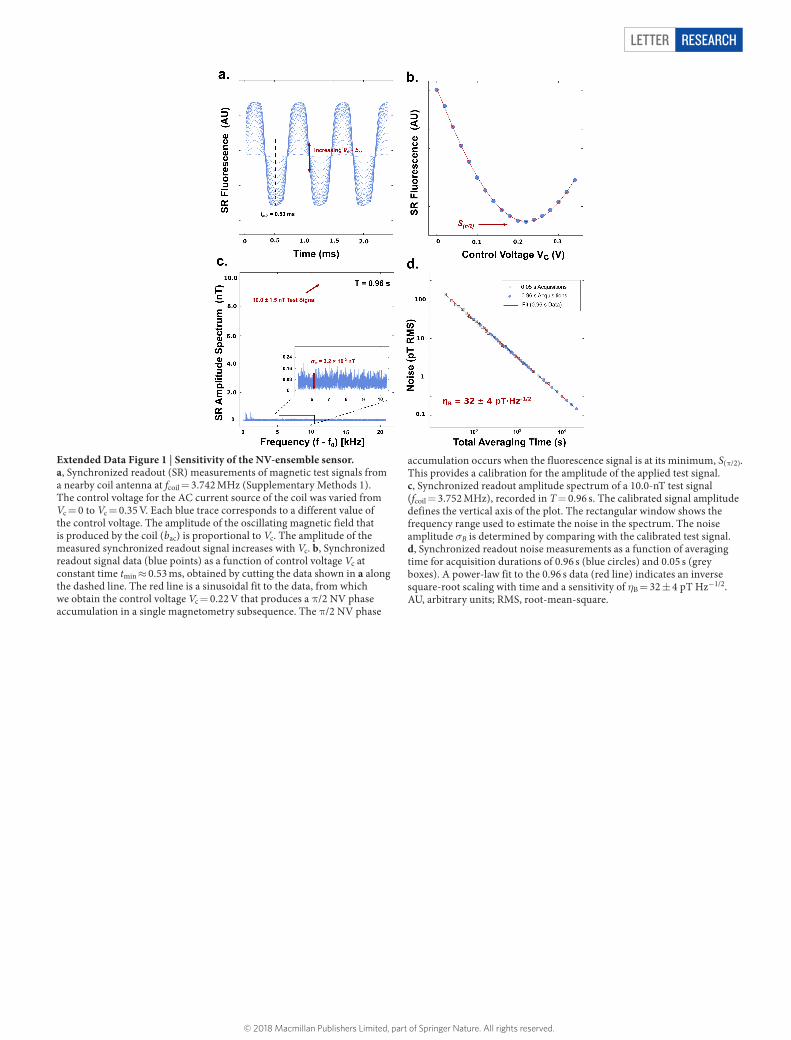
Extended Data Figure 1 | Sensitivity of the NV-ensemble sensor. a, Synchronized readout (SR) measurements of magnetic test signals from a nearby coil antenna at fcoil = 3.742 MHz (Supplementary Methods 1). The control voltage for the AC current source of the coil was varied from Vc = 0 to Vc = 0.35 V. Each blue trace corresponds to a different value of the control voltage. The amplitude of the oscillating magnetic field that is produced by the coil (bac) is proportional to Vc. The amplitude of the measured synchronized readout signal increases with Vc. b, Synchronized readout signal data (blue points) as a function of control voltage Vc at constant time tmin ≈ 0.53 ms, obtained by cutting the data shown in a along the dashed line. The red line is a sinusoidal fit to the data, from which we obtain the control voltage Vc = 0.22 V that produces a π /2 NV phase accumulation in a single magnetometry subsequence. The π /2 NV phase
accumulation occurs when the fluorescence signal is at its minimum, S(π/2). This provides a calibration for the amplitude of the applied test signal. c, Synchronized readout amplitude spectrum of a 10.0-nT test signal (fcoil = 3.752 MHz), recorded in T = 0.96 s. The calibrated signal amplitude defines the vertical axis of the plot. The rectangular window shows the frequency range used to estimate the noise in the spectrum. The noise amplitude σB is determined by comparing with the calibrated test signal. d, Synchronized readout noise measurements as a function of averaging time for acquisition durations of 0.96 s (blue circles) and 0.05 s (grey boxes). A power-law fit to the 0.96 s data (red line) indicates an inverse square-root scaling with time and a sensitivity of ηB = 32 ± 4 pT Hz−1/2. AU, arbitrary units; RMS, root-mean-square.
© 2018 Macmillan Publishers Limited, part of Springer Nature. All rights reserved.
LetterreSeArCH
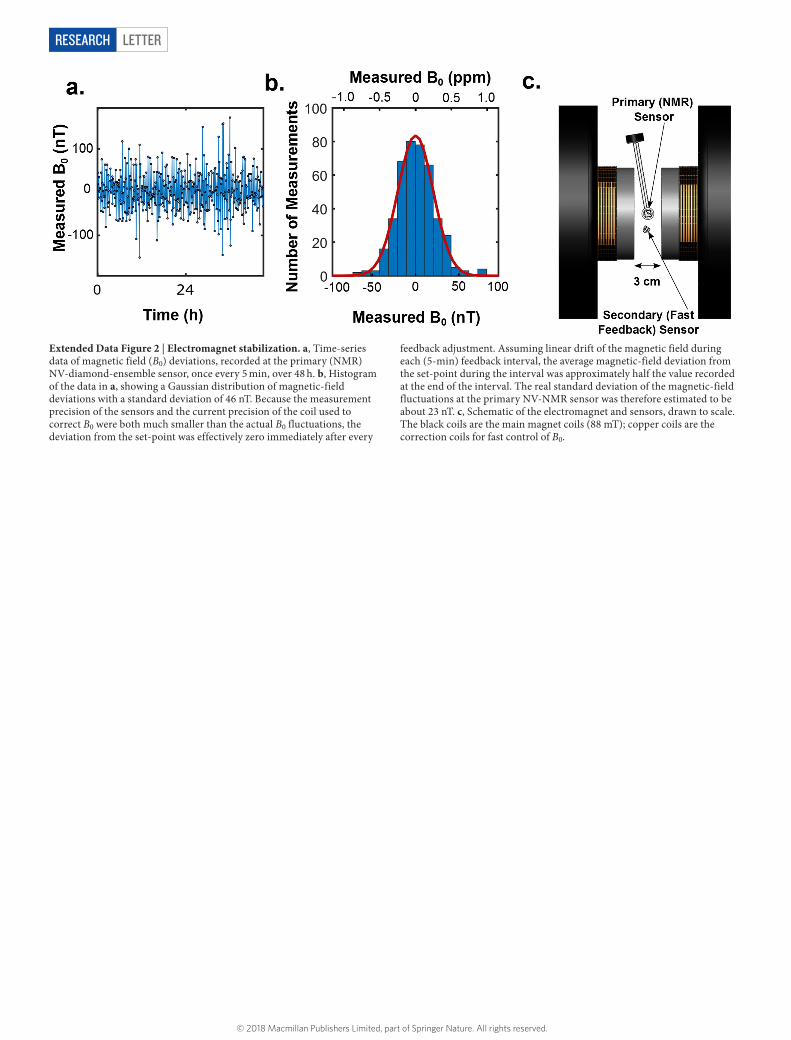
Extended Data Figure 2 | Electromagnet stabilization. a, Time-series data of magnetic field (B0) deviations, recorded at the primary (NMR) NV-diamond-ensemble sensor, once every 5 min, over 48 h. b, Histogram of the data in a, showing a Gaussian distribution of magnetic-field deviations with a standard deviation of 46 nT. Because the measurement precision of the sensors and the current precision of the coil used to correct B0 were both much smaller than the actual B0 fluctuations, the deviation from the set-point was effectively zero immediately after every
feedback adjustment. Assuming linear drift of the magnetic field during each (5-min) feedback interval, the average magnetic-field deviation from the set-point during the interval was approximately half the value recorded at the end of the interval. The real standard deviation of the magnetic-field fluctuations at the primary NV-NMR sensor was therefore estimated to be about 23 nT. c, Schematic of the electromagnet and sensors, drawn to scale. The black coils are the main magnet coils (88 mT); copper coils are the correction coils for fast control of B0.
© 2018 Macmillan Publishers Limited, part of Springer Nature. All rights reserved.
Letter reSeArCH
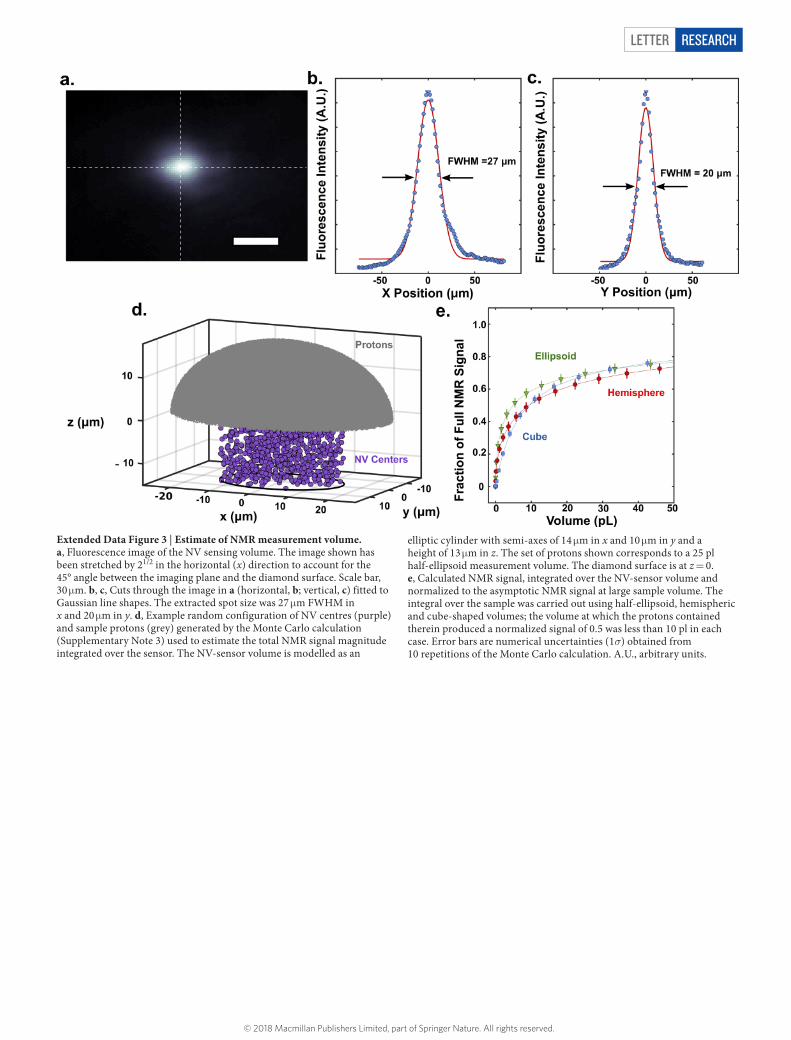
Extended Data Figure 3 | Estimate of NMR measurement volume. a, Fluorescence image of the NV sensing volume. The image shown has been stretched by 21/2 in the horizontal (x) direction to account for the 45° angle between the imaging plane and the diamond surface. Scale bar, 30 μ m. b, c, Cuts through the image in a (horizontal, b; vertical, c) fitted to Gaussian line shapes. The extracted spot size was 27 μ m FWHM in x and 20 μ m in y. d, Example random configuration of NV centres (purple) and sample protons (grey) generated by the Monte Carlo calculation (Supplementary Note 3) used to estimate the total NMR signal magnitude integrated over the sensor. The NV-sensor volume is modelled as an
elliptic cylinder with semi-axes of 14 μ m in x and 10 μ m in y and a height of 13 μ m in z. The set of protons shown corresponds to a 25 pl half-ellipsoid measurement volume. The diamond surface is at z = 0. e, Calculated NMR signal, integrated over the NV-sensor volume and normalized to the asymptotic NMR signal at large sample volume. The integral over the sample was carried out using half-ellipsoid, hemispheric and cube-shaped volumes; the volume at which the protons contained therein produced a normalized signal of 0.5 was less than 10 pl in each case. Error bars are numerical uncertainties (1σ) obtained from 10 repetitions of the Monte Carlo calculation. A.U., arbitrary units.
© 2018 Macmillan Publishers Limited, part of Springer Nature. All rights reserved.
LetterreSeArCH
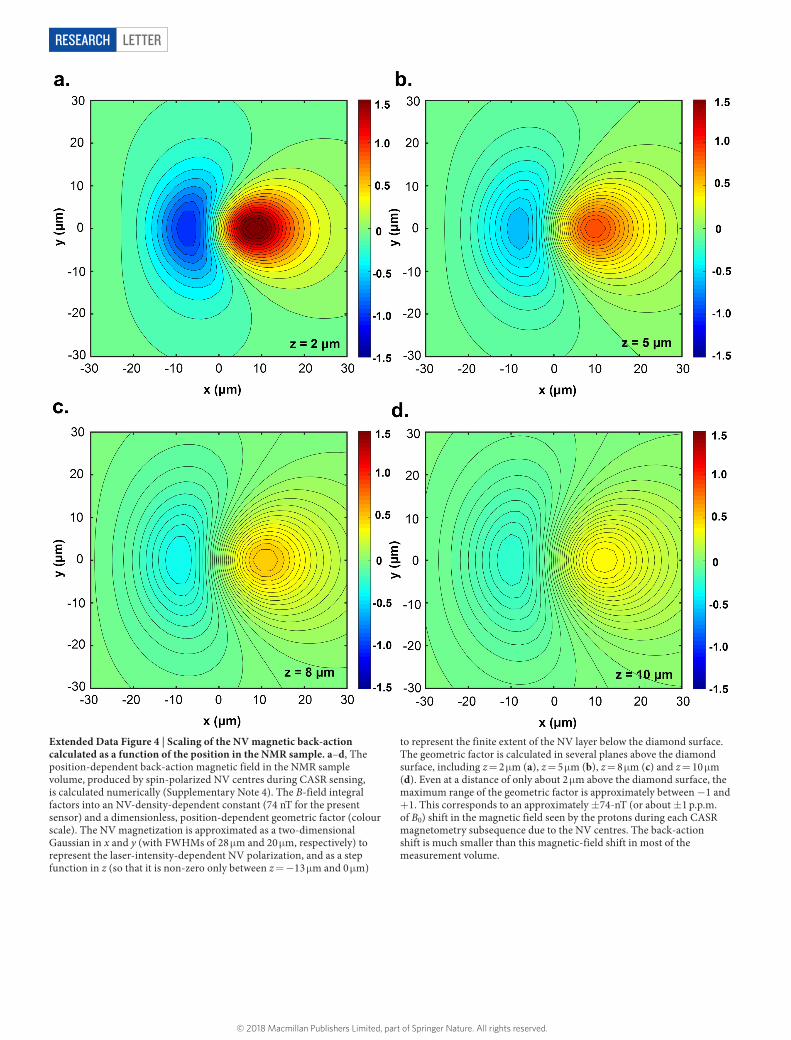
Extended Data Figure 4 | Scaling of the NV magnetic back-action calculated as a function of the position in the NMR sample. a–d, The position-dependent back-action magnetic field in the NMR sample volume, produced by spin-polarized NV centres during CASR sensing, is calculated numerically (Supplementary Note 4). The B-field integral factors into an NV-density-dependent constant (74 nT for the present sensor) and a dimensionless, position-dependent geometric factor (colour scale). The NV magnetization is approximated as a two-dimensional Gaussian in x and y (with FWHMs of 28 μ m and 20 μ m, respectively) to represent the laser-intensity-dependent NV polarization, and as a step function in z (so that it is non-zero only between z = − 13 μ m and 0 μ m)
to represent the finite extent of the NV layer below the diamond surface. The geometric factor is calculated in several planes above the diamond surface, including z = 2 μ m (a), z = 5 μ m (b), z = 8 μ m (c) and z = 10 μ m (d). Even at a distance of only about 2 μ m above the diamond surface, the maximum range of the geometric factor is approximately between − 1 and + 1. This corresponds to an approximately ± 74-nT (or about ± 1 p.p.m. of B0) shift in the magnetic field seen by the protons during each CASR magnetometry subsequence due to the NV centres. The back-action shift is much smaller than this magnetic-field shift in most of the measurement volume.
© 2018 Macmillan Publishers Limited, part of Springer Nature. All rights reserved.
Letter reSeArCH
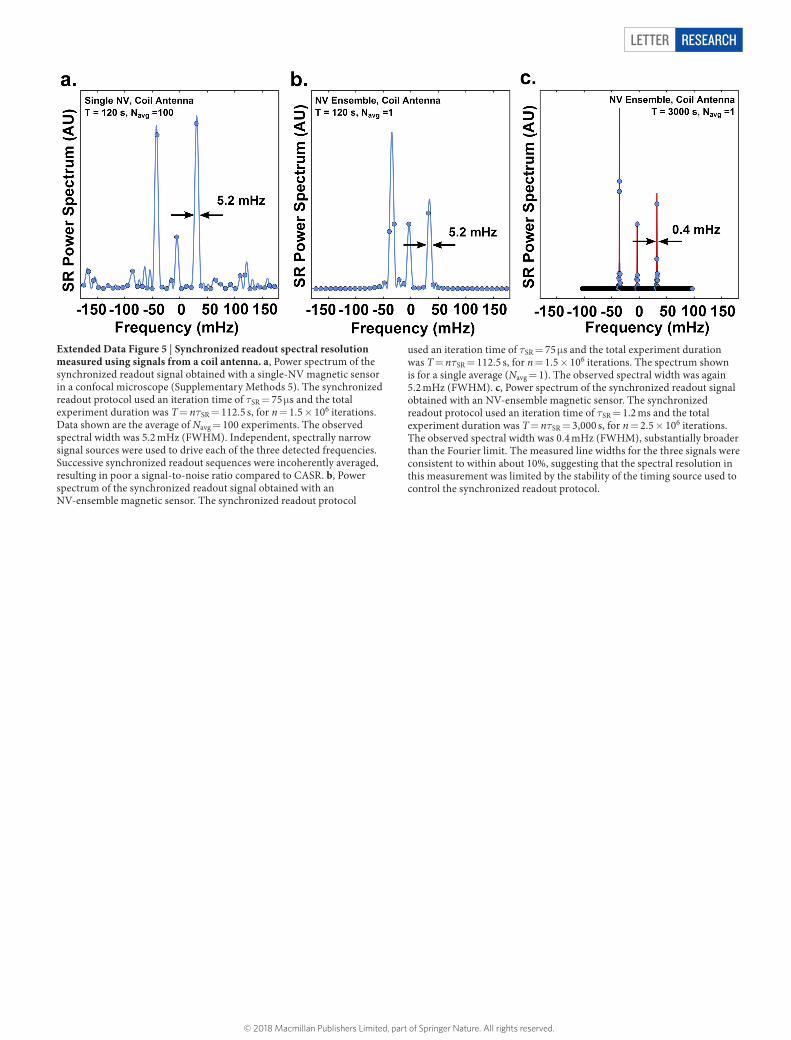
Extended Data Figure 5 | Synchronized readout spectral resolution measured using signals from a coil antenna. a, Power spectrum of the synchronized readout signal obtained with a single-NV magnetic sensor in a confocal microscope (Supplementary Methods 5). The synchronized readout protocol used an iteration time of τSR = 75 μ s and the total experiment duration was T = nτSR = 112.5 s, for n = 1.5 × 10⁶ iterations. Data shown are the average of Navg = 100 experiments. The observed spectral width was 5.2 mHz (FWHM). Independent, spectrally narrow signal sources were used to drive each of the three detected frequencies. Successive synchronized readout sequences were incoherently averaged, resulting in poor a signal-to-noise ratio compared to CASR. b, Power spectrum of the synchronized readout signal obtained with an NV-ensemble magnetic sensor. The synchronized readout protocol
used an iteration time of τSR = 75 μ s and the total experiment duration was T = nτSR = 112.5 s, for n = 1.5 × 10⁶ iterations. The spectrum shown is for a single average (Navg = 1). The observed spectral width was again 5.2 mHz (FWHM). c, Power spectrum of the synchronized readout signal obtained with an NV-ensemble magnetic sensor. The synchronized readout protocol used an iteration time of τSR = 1.2 ms and the total experiment duration was T = nτSR = 3,000 s, for n = 2.5 × 10⁶ iterations. The observed spectral width was 0.4 mHz (FWHM), substantially broader than the Fourier limit. The measured line widths for the three signals were consistent to within about 10%, suggesting that the spectral resolution in this measurement was limited by the stability of the timing source used to control the synchronized readout protocol.
© 2018 Macmillan Publishers Limited, part of Springer Nature. All rights reserved.
LetterreSeArCH
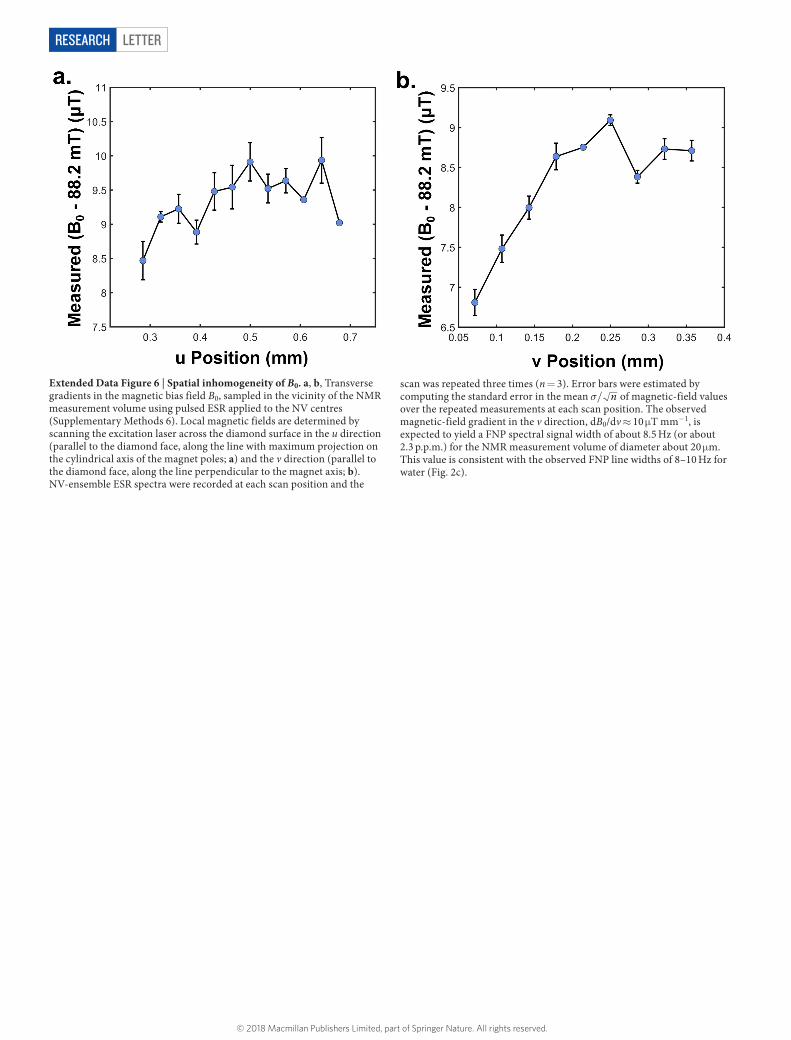
Extended Data Figure 6 | Spatial inhomogeneity of B0. a, b, Transverse gradients in the magnetic bias field B0, sampled in the vicinity of the NMR measurement volume using pulsed ESR applied to the NV centres (Supplementary Methods 6). Local magnetic fields are determined by scanning the excitation laser across the diamond surface in the u direction (parallel to the diamond face, along the line with maximum projection on the cylindrical axis of the magnet poles; a) and the v direction (parallel to the diamond face, along the line perpendicular to the magnet axis; b). NV-ensemble ESR spectra were recorded at each scan position and the
scan was repeated three times (n = 3). Error bars were estimated by computing the standard error in the mean σ/ n of magnetic-field values over the repeated measurements at each scan position. The observed magnetic-field gradient in the v direction, dB0/dv ≈ 10 μ T mm−1, is expected to yield a FNP spectral signal width of about 8.5 Hz (or about 2.3 p.p.m.) for the NMR measurement volume of diameter about 20 μ m. This value is consistent with the observed FNP line widths of 8–10 Hz for water (Fig. 2c).
© 2018 Macmillan Publishers Limited, part of Springer Nature. All rights reserved.
Letter reSeArCH
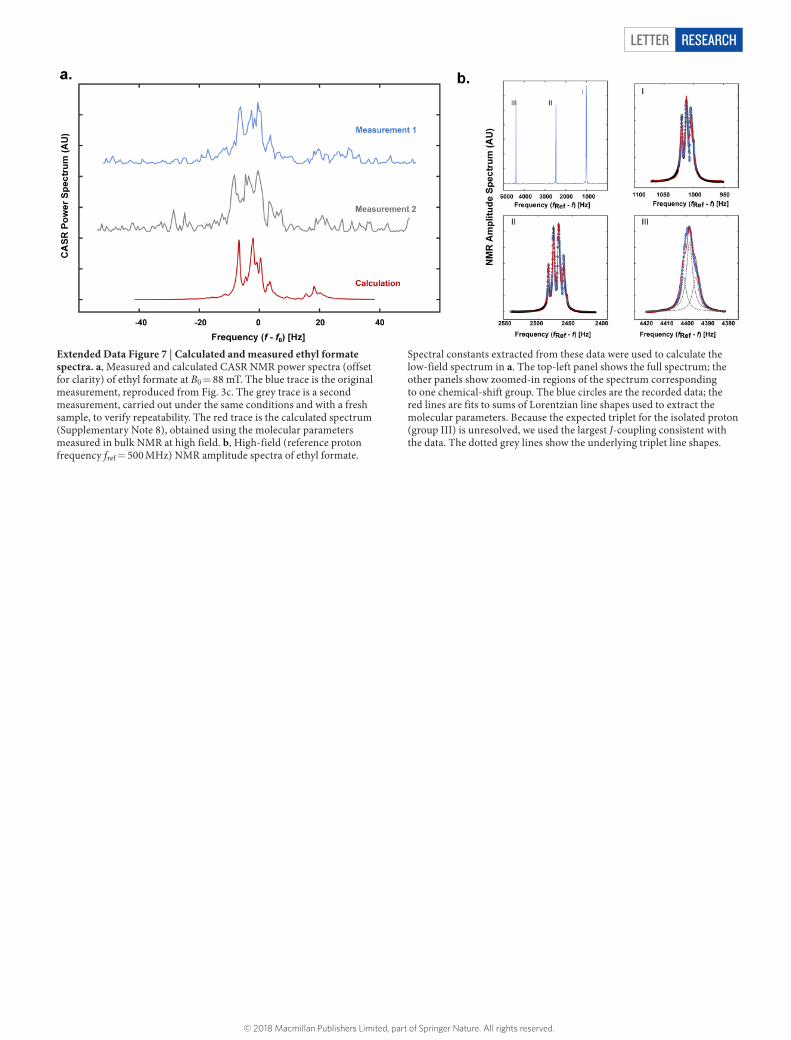
Extended Data Figure 7 | Calculated and measured ethyl formate spectra. a, Measured and calculated CASR NMR power spectra (offset for clarity) of ethyl formate at B0 = 88 mT. The blue trace is the original measurement, reproduced from Fig. 3c. The grey trace is a second measurement, carried out under the same conditions and with a fresh sample, to verify repeatability. The red trace is the calculated spectrum (Supplementary Note 8), obtained using the molecular parameters measured in bulk NMR at high field. b, High-field (reference proton frequency fref = 500 MHz) NMR amplitude spectra of ethyl formate.
Spectral constants extracted from these data were used to calculate the low-field spectrum in a. The top-left panel shows the full spectrum; the other panels show zoomed-in regions of the spectrum corresponding to one chemical-shift group. The blue circles are the recorded data; the red lines are fits to sums of Lorentzian line shapes used to extract the molecular parameters. Because the expected triplet for the isolated proton (group III) is unresolved, we used the largest J-coupling consistent with the data. The dotted grey lines show the underlying triplet line shapes.
© 2018 Macmillan Publishers Limited, part of Springer Nature. All rights reserved.
LetterreSeArCH
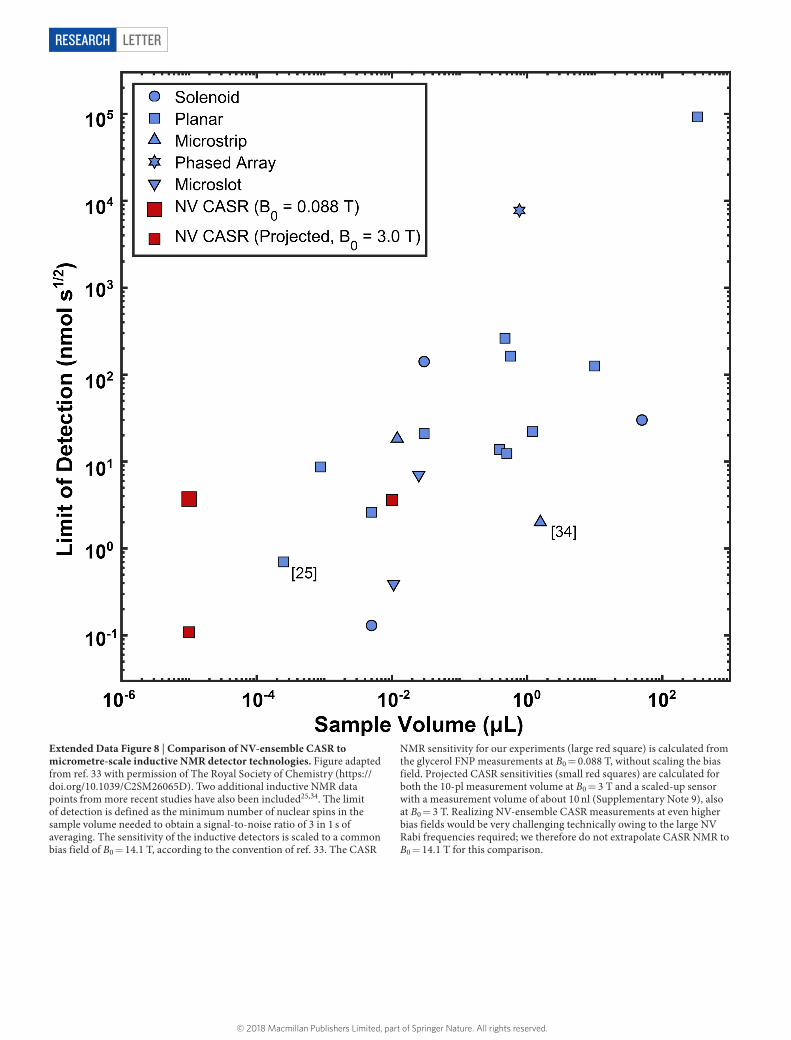
Extended Data Figure 8 | Comparison of NV-ensemble CASR to micrometre-scale inductive NMR detector technologies. Figure adapted from ref. 33 with permission of The Royal Society of Chemistry (https://doi.org/10.1039/C2SM26065D). Two additional inductive NMR data points from more recent studies have also been included25,34. The limit of detection is defined as the minimum number of nuclear spins in the sample volume needed to obtain a signal-to-noise ratio of 3 in 1 s of averaging. The sensitivity of the inductive detectors is scaled to a common bias field of B0 = 14.1 T, according to the convention of ref. 33. The CASR
NMR sensitivity for our experiments (large red square) is calculated from the glycerol FNP measurements at B0 = 0.088 T, without scaling the bias field. Projected CASR sensitivities (small red squares) are calculated for both the 10-pl measurement volume at B0 = 3 T and a scaled-up sensor with a measurement volume of about 10 nl (Supplementary Note 9), also at B0 = 3 T. Realizing NV-ensemble CASR measurements at even higher bias fields would be very challenging technically owing to the large NV Rabi frequencies required; we therefore do not extrapolate CASR NMR to B0 = 14.1 T for this comparison.
© 2018 Macmillan Publishers Limited, part of Springer Nature. All rights reserved.