Embed Size (px)
Citation preview
8/2/2019 Magnetic Field Stimulation
http://slidepdf.com/reader/full/magnetic-field-stimulation 1/20
ELECTRO- AND MAGNETOBIOLOGY, 20(3), 263–280 (2001)
MAGNETIC FIELD STIMULATION OF
HYBRIDOMA CELLS IN VITRO
Debatosh Datta,* Prabuddha K. Kundu,† and Atul Deshpande
Cellular Engineering Laboratory, School of Biomedical Engineering,Indian Institute of Technology-Bombay, Powai, Bombay 400 076,
India
ABSTRACT
Non-ionizing physical field interactions with cells, both in situ and in vitro,
is of current interest globally. This is from various directions—starting from
their abilities to induce permanent modifications in cell behavior in situ,
through carcinogenesis and mutagenesis, to utilizing field effects for possibly
enhancing the viable cell population in vitro. This results in parallel increase
in some high-value, low-volume biochemical production. In the present study,
screening experiments were carried out with a unique cell line—hybridoma
(OKT3) (secreting monoclonal antibodies [MAbs] against T3 surface antigens
of human peripheral CD4 cells)—for a possible enhancement in the yield of
extremely high value product (MAb). Overall, in the absence of any such data
globally, there is apparently an urgent need for screening of such ‘‘field ef-
fects’’ on various other cell types in vitro for various reasons; e.g., low cost
of manipulation, nonpolluting nature of interactions, distinct possibility of en-
hancement of produced biochemical titers, etc. In the present study, we ob-
served various responses of the cell population both to magnetic fields alone
and in combination with other known chemical stimulants of viable biomass
(mono- and poly-lysine). Fifty hertz, 0.8 mT magnetic field and below, in
conjunction with bulkier poly-lysine molecules, needs to be investigated fur-
ther for a possible resonance-induced anti-interaction between these known
mitogens and their cell surface receptors, which possibly could be extrapolated
* Corresponding author. E-mail: [email protected]† Current address: Bio-Rad Laboratories (I) Ltd., New Delhi, India
263
Copyright 2001 by Marcel Dekker, Inc. www.dekker.com
8/2/2019 Magnetic Field Stimulation
http://slidepdf.com/reader/full/magnetic-field-stimulation 2/20
264 DATTA, KUNDU, AND DESHPANDE
to other growth factor-receptor interactions in magnetic field environments,
in situ.
Key Words: Antibody titer; Hybridoma cells; Magnetic field
INTRODUCTION
Scarcity of research done on the biological effects of magnetic fields (MFs)
stands in sharp contrast to the abundance of bioelectric effects (1). There are sev-
eral reasons. First, living systems are operating in an aqueous environment in
which ions and polyelectrolytes play major functional roles. With the exception
of bird orientation and navigation and bacterial geotactic responses, biomagnetic
effects have not been known to play any major physiological roles. Second, inter-
actions of the Earth’s MF (about 0.5 G or 50 µT) with biomolecules or tissues
approach the energy level of the inherent thermal energy. Third, there are inherent
difficulties in investigating biomagnetic effects. Many of the earlier experiments
on MF effects in living tissue or organisms were not reproducible. However, with
the recent increase in electrical gadgets and appliances, and their ubiquitous pres-
ence around us, the induced surrounding MFs in our environment have brought
about attention to possible health hazards, especially the link between exposure
to such radiation and the incidence of cancer (2). Moreover, recent studies have
shown that the environmental effects originate primarily from the magnetic com-
ponent of the electromagnetic field (EMF) (1). Therefore, there has been a flurry
of research activity in this area, though the results have been far from conclusive.This is not to belie the fact that there is some concrete evidence as to the effects,
but the clinching hypothesis is yet to be determined.
The effects include healing of fractured bones (3), skin regeneration of ex-
perimental animals (4), increase in the permeability of cell membranes (5), effects
on cellular metabolism (6), increase in Na–K ATPase activity (7), and enhance-
ment of transcription and translation (8,9). Two decades have elapsed since the
first chronically unhealed fracture (nonunion) patient was treated successfully at
Columbia with time-varying magnetic fields (3). In the interval since then, more
than a quarter of a million such patients have been treated with this method
throughout the world. Success rates and time to bony union are comparable to
those produced by bone grafting. Unlike surgical repair, EMFs carry no known
risks (tangible), cause no discomfort, and are considerably more cost effective.The cellular effects of appropriately configured EMFs address specific aspects of
the pathology underlying a fracture nonunion. These include modifications of cel-
lular calcium metabolism and mineralization (10,11), synthesis of the extracellular
matrix (12–14), and new blood vessel formation (angiogenesis) (15).
Interest in the cellular effects of EMFs originated from research in nucleated
red blood cells (16). Available data point toward the presence of two general
8/2/2019 Magnetic Field Stimulation
http://slidepdf.com/reader/full/magnetic-field-stimulation 3/20
MAGNETIC FIELD EFFECTS ON HYBRIDOMA CELLS IN CULTURE 265
features, among others. First, a relationship exists between the electrical and mag-
netic perturbation and the redistribution of first messengers (e.g., Ca2 ions) onthe cell surface and/or their influx into a cell. Second, a consequent global process
of chromatin decondensation and nuclear volume increase occurs, as an early reac-
tivation step, before the onset of protein, RNA, and DNA syntheses (17).
Forgacs et al. (18), Antonopoulos et al. (19), and Santoro et al. (20) studied
the cytological effects of low frequency (LF) 50-Hz EMFs on animal and human
cells in vitro. On the other end of the spectrum, Bras et al. (21) studied the orienta-
tional behavior of microtubules assembled in the presence of strong MFs, and
Norimura et al. (22) undertook experiments in order to verify whether a strong
MF would have any biological effects on the cell growth, viability, and radiation
response of mammalian cells. Results suggest that exposure to a static MF of 4
T or stronger may lead to physiological and growth abnormalities at the cellular
level. Similarly, Zhang et al. (23) reported that exposure to static MFs of 6.34 T
coupled with ionizing radiation decreased cell survival, whereas fields of 0.3 and
0.7 T had no effect on cell survival. They concluded that (i) MFs decreased the
colony-forming abilities of cultured mammalian cells; (ii) MFs could affect the
cell cycle; (iii) a stronger MF strength does not always have stronger biological
effects; and (iv) the gradient of an MF may be an important factor when combined
with ionizing radiation. Raylman et al. (24) also reported that strong static MFs
inhibit the growth of cancer cells in vitro. This has immense application to the
understanding and treatment of cancers.
The presence of a magneto-sensor system, e.g., proteins, must be considered
when looking into the plethora of molecular-level phenomena taking place. Even
though the sensor remains elusive, the pathway for the events may be correlatedto the increase in Ca2 ion concentration as a second messenger, leading to eleva-
tion of transcription and translation (1). Kim et al. (25) suggested that the mecha-
nism of biological effects of extremely low frequency (ELF) electric and MFs
may involve induced changes of Ca2 transport through plasma membrane ion
channels. Results demonstrate that low-intensity electric fields can alter calcium
distribution in cells, most probably due to the effect on receptor-operated Ca2
and/or ion channels. Once EMFs have acted upon key events—most of which
occur within 6 hr from binding of the mitogen to membrane—all processes related
to the cell proliferation, such as RNA synthesis, gene expression, and subsequent
DNA synthesis (i.e., late events), are affected. Data and physical modeling
strongly support the hypothesis that biological and physical windows must exist
for effects to occur.Reproducibility of results depends on the extent to which the variables are
considered. Exposure conditions, as well as the type and physiological status of
the cell to be exposed to EMFs, are important. Despite strong and reproducible
effects on cell proliferation, low-intensity EMFs seem not to have any genotoxic
effects. Later research, however, has proposed that exposure of cells to 60-Hz
fields does not initiate tumor development, but rather may promote the process
8/2/2019 Magnetic Field Stimulation
http://slidepdf.com/reader/full/magnetic-field-stimulation 4/20
266 DATTA, KUNDU, AND DESHPANDE
once initiated. This view is supported by studies that show that exposure to EMFs
accelerates tumorigenesis in experimental animals exposed to carcinogens (26,27).The effects of EMFs on translational activity are even more dramatic. The remark-
able feature is the observation that the molecular weight distribution of polypep-
tides synthesized during EMF exposure and sudden elevated heat shock proteins
(e.g., hsp 70) are virtually identical. The fact that some heat shock proteins are
affected by exposure to EMFs may provide another model for determining the
mechanism at the cellular level (9). This also indicates that exposure to EMFs
increases the transcription rate of certain proteins relative to the unexposed popu-
lation, and that their amino acid composition is altered due to this.
Our present work deals with low-frequency magnetic field (LFMF) exposure
to hybridoma cells. There is little research reported on the effects of magnetic
field exposure to hybridoma cells, and its subsequent effect on cellular growth
and secretion. Hybridoma cells secrete monoclonal antibodies (MAbs) which con-
stitute the ‘‘heart’’ of all in vitro diagnostic kits. In addition, the molecules are
widely used for in vivo diagnostic imaging and drug delivery maneuvers. One of
the major drawbacks of these molecules’ widespread usage is the prohibitive cost.
In the current work, physical (EMF) stimulation of hybridoma cells as a means
of MAb production enhancement was studied. It was earlier observed by Datta
et al. (28) that LFMF has a definite role in hybridoma growth and secretion. Thus,
in the present work, we probed whether exposure to LFMF in the presence or
absence of chemical growth stimulants, e.g., l-lysine (29) and homopolymers of
l-lysine of varying molecular weights (1000–7500), could minimize the growth
phase and maximize secretion by the cells in culture, thereby enhancing efficiency
of the production cycle.
MATERIALS AND METHODS
Cell Line, Media, and Additives
The cell line used for screening was OKT3, a mouse–mouse hybridoma,
secreting MAb (IgG) against CD3 peripheral molecule of a T cell (NCCS, Pune,
India). The OKT3 cell line was maintained in Iscoves’ modification of Dulbecco’s
media (IMDM) (Sigma Chemical Co., St. Louis, MO) supplemented with 0.044
M NaHCO3, 0.025 M glucose, 40 units/ml penicillin G, 400 µg/ml streptomycin
sulfate, 0.002 ml/ml gentamycin sulfate (v/v), and 400 µg/ml mycostatin. A 10%
fetal calf serum (FCS, Gibco BRL, Grand Island, NY) supplement was added tothe culture. The cells were then cultured in 5% CO2 (v/v) atmosphere in an incuba-
tor (Jouan, France) at 37°C and 100% relative humidity.
The experimental population of cells was cultured inside a magnetic coil,
excited by a current. After the predetermined time of exposure to an MF, the
culture was harvested and assays were conducted. The main equipment comprised
a coil, current amplifier with dual DC voltage supply, and function generators
(ElectroLab, India). The current was delivered by applying a voltage as deter-
8/2/2019 Magnetic Field Stimulation
http://slidepdf.com/reader/full/magnetic-field-stimulation 5/20
MAGNETIC FIELD EFFECTS ON HYBRIDOMA CELLS IN CULTURE 267
mined by the required MF, for a mean time of 6.5 hr daily. An oscilloscope
(Hewlett Packard, Palo Alto, CA) was used to determine the voltage ( V p-p andV rms) and frequency of the signal across the coil. The axial magnetic field was
measured by a gaussmeter (Bell Technologies Inc., Orlando, FL).
Coil for Generation of an MF
An air core coil (solenoid) was fabricated on a polyvinyl chloride (PVC)
pipe of length 0.30 m and 0.136 m internal diameter. Four layers of wire were
wound on the PVC tubing and all were connected in parallel to obtain an adequate
magnetic field. The four layers (separated from each other by presban paper) were
enamel-coated copper wires. Of the four wires, two were 33 SWG with a diameter
of 0.254 mm (current capacity 94 mA) and with 35.1 turns/cm. The remainingtwo were 36 SWG (0.193 mm diameter, 54 mA current capacity) and had 45.70
turns/cm. Resistance of each layer of the coil was 135, 144, 300, and 326 ohm.
All four layers were connected in parallel so that the total resistance was 50.2 Ω,
and the net current carrying capacity of the coil became 300 mA. The field
strength on the axis of the coil (the length of which was 2.5 times its diameter)
was observed to be fairly constant in a segment of 0.13 m (sufficient for exposing
a 24-well plate to uniform MF). After the circuit was set up and the coil was
activated with the proper signal, the MF inside the coil was measured by a gauss-
meter fitted with the Hall probe. After standardizing the probe, it was inserted
into the coil for measurement of the MF. The field was found to be stable over
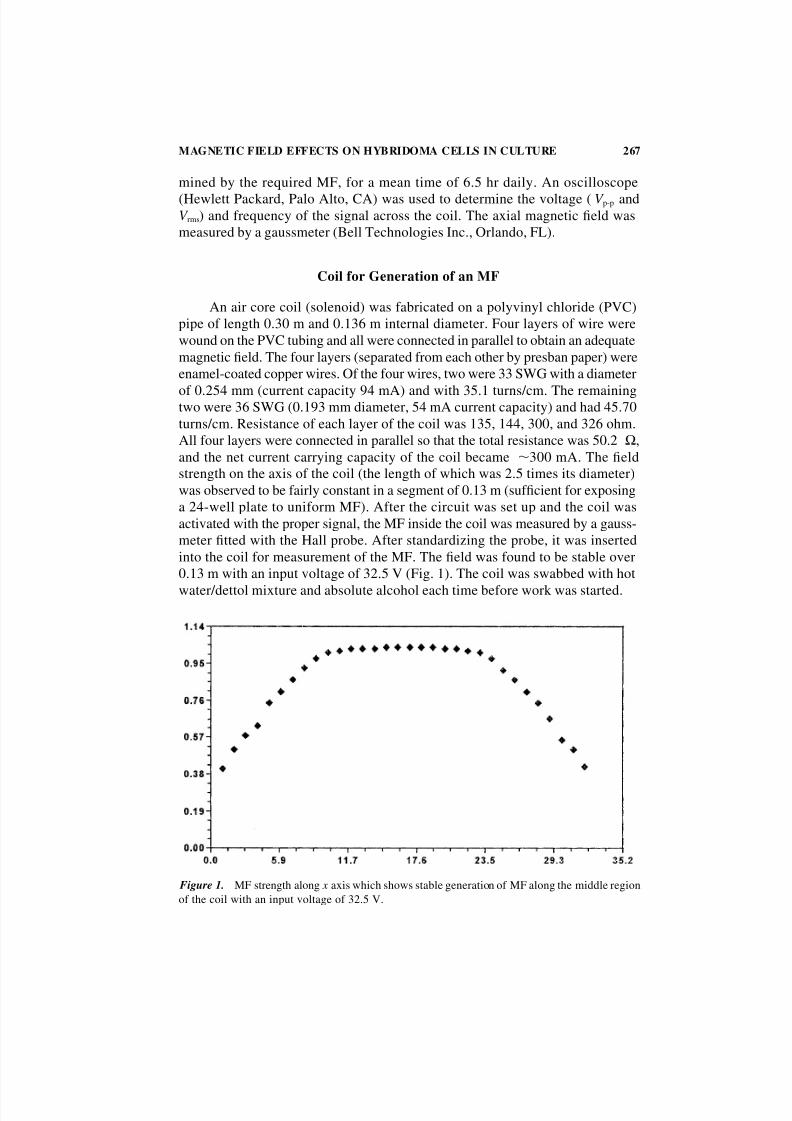
0.13 m with an input voltage of 32.5 V (Fig. 1). The coil was swabbed with hot
water/dettol mixture and absolute alcohol each time before work was started.
Figure 1. MF strength along x axis which shows stable generation of MF along the middle region
of the coil with an input voltage of 32.5 V.
8/2/2019 Magnetic Field Stimulation
http://slidepdf.com/reader/full/magnetic-field-stimulation 6/20
268 DATTA, KUNDU, AND DESHPANDE
The MF Parameters and Protocol for Screening
The cells were cultured in 24-well culture plates (Flow Labs, U.S.A.) in
5% CO2 atmosphere and 37°C in a water-jacketed incubator (Jouan, France). The
experimental plate was exposed to the predetermined MF for 6–7 hr and the other
plate was kept as control.
In this set of experiments, physical stimulation was studied in isolation as
well as in various combinations with l-lysine, mono- and poly-mediated chemical
stimulations. The objective of such physical and physicochemical stimulations
was to get higher viable cell counts and product concentrations.
Analytical Methods
Viable cell counts were made using a cell counting chamber (Rohem, India)
and the trypan blue dye (0.4%) exclusion technique, and the stimulation index
(SI) was calculated. The SI is defined as the ratio of population of the experimental
cells to the population of control cells at a given time. Because it is a ratio of the
same physical parameters, it does not have any units. It gives an insight into the
effect (stimulatory or repressive) that a molecule has over the cells under experi-
mentation versus the control population.
SI Experimental(T )
Control(T )
The culture media were isolated, centrifuged at 1000 rpm, and the superna-tants stored at 20°C for further analyses. Culture supernatants were analyzed
qualitatively and quantitatively for identification of changes in the metabolite pat-
terns and secretion profile of the cell line by sodium dodecyl sulfate-polyacryl-
amide gel electrophoresis (SDS-PAGE), enzyme-linked immunosorbent assay
(ELISA), and fast protein liquid chromatography (FPLC). The percentage of gel
used was 8%, the volume of sample loaded in each lane was in the range 10–15
µl. The current applied during the passage of samples through stacking gel was
15 mA and that during the running gel was 20 mA. The gels were stained with
Coomassie brilliant blue.
FPLC (Pharmacia, Sweden) parameters were as follows: 1 MPa pressure at
a flow rate of 0.4 ml/min. Absorbance of the eluted volume was screened (280
nm) in a UV spectrophotometer. The column used was Superose-12 (Pharmacia,Sweden) and the volume loaded was 100 µl.
Antibody titer was measured by direct ELISA technique for the detection
and quantitation of monoclonal antibody: 50 µl samples from OKT3 supernatants
were incubated in separate wells of the microtiter plate at 4°C overnight. Washings
were done with phosphate buffer saline (PBS)–Tween-20, and then 0.2% bovine
serum albumin (w/v) was added to the wells and incubated at 37°C for 2 hr.
Washing was again done with PBS–Tween-20 to remove unbound components.
8/2/2019 Magnetic Field Stimulation
http://slidepdf.com/reader/full/magnetic-field-stimulation 7/20
MAGNETIC FIELD EFFECTS ON HYBRIDOMA CELLS IN CULTURE 269
Anti-mouse–rabbit antibody conjugated with enzyme alkaline phosphatase was
added to the wells and incubated at 37°C for 1.5 hr. Any nonspecific binding wasremoved by washing with PBS–Tween-20 for five to six times, and substrate
solution ( p-nitrophenol phosphate) was added to each well, followed by incuba-
tion at 37°C for 10 min. Control samples of known IgG content were assayed
simultaneously. Absorbance was taken at 405 nm.
RESULTS AND DISCUSSION
Growth curves derived from viable cell counts of the exposed cells from all
studied parameters showed significant differences in their growth patterns versus
the controls. Study of secretory patterns also showed an elevated production of
MAb by the exposed population. However, the synergistic effect of both chemicaland physical stimulation was not very evident in the experiments, but we did get
some interesting results. All of the exposed cell populations were exposed to mean
times of 6 hr, 34 min–7 hr.
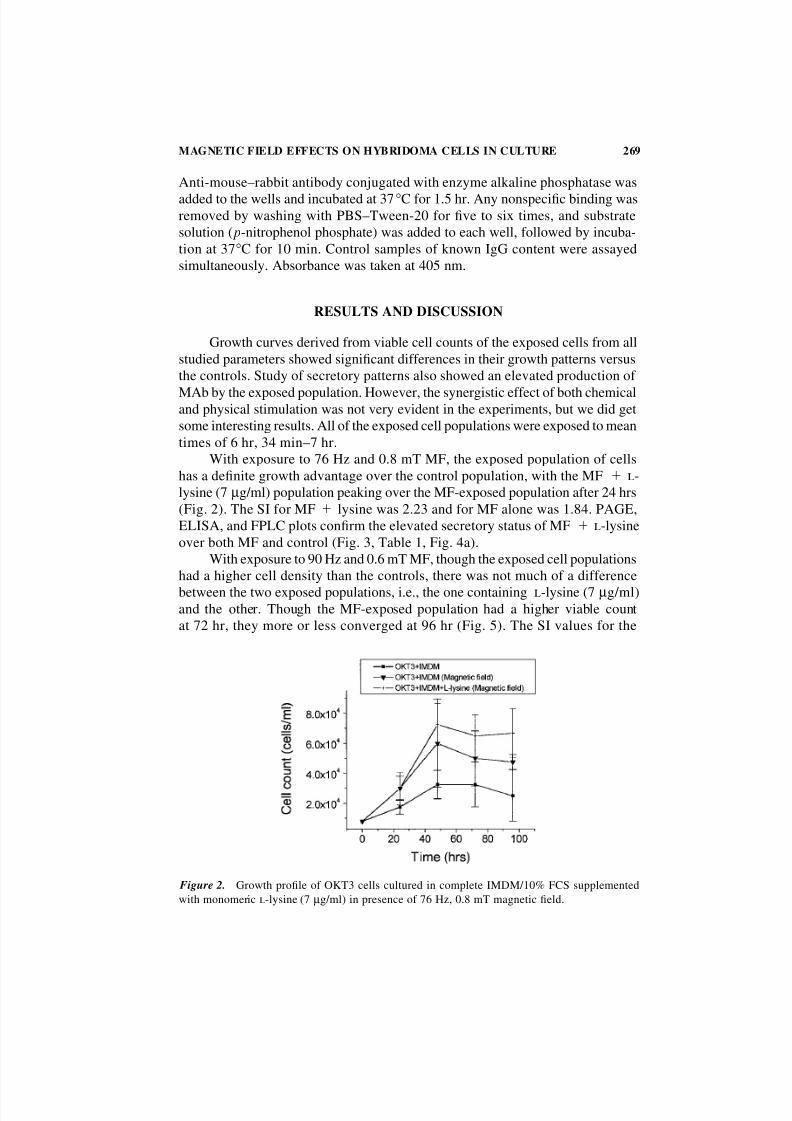
With exposure to 76 Hz and 0.8 mT MF, the exposed population of cells
has a definite growth advantage over the control population, with the MF l-
lysine (7 µg/ml) population peaking over the MF-exposed population after 24 hrs
(Fig. 2). The SI for MF lysine was 2.23 and for MF alone was 1.84. PAGE,
ELISA, and FPLC plots confirm the elevated secretory status of MF l-lysine
over both MF and control (Fig. 3, Table 1, Fig. 4a).
With exposure to 90 Hz and 0.6 mT MF, though the exposed cell populations
had a higher cell density than the controls, there was not much of a difference
between the two exposed populations, i.e., the one containing l-lysine (7 µg/ml)and the other. Though the MF-exposed population had a higher viable count
at 72 hr, they more or less converged at 96 hr (Fig. 5). The SI values for the
Figure 2. Growth profile of OKT3 cells cultured in complete IMDM/10% FCS supplemented
with monomeric l-lysine (7 µg/ml) in presence of 76 Hz, 0.8 mT magnetic field.
8/2/2019 Magnetic Field Stimulation
http://slidepdf.com/reader/full/magnetic-field-stimulation 8/20
270 DATTA, KUNDU, AND DESHPANDE
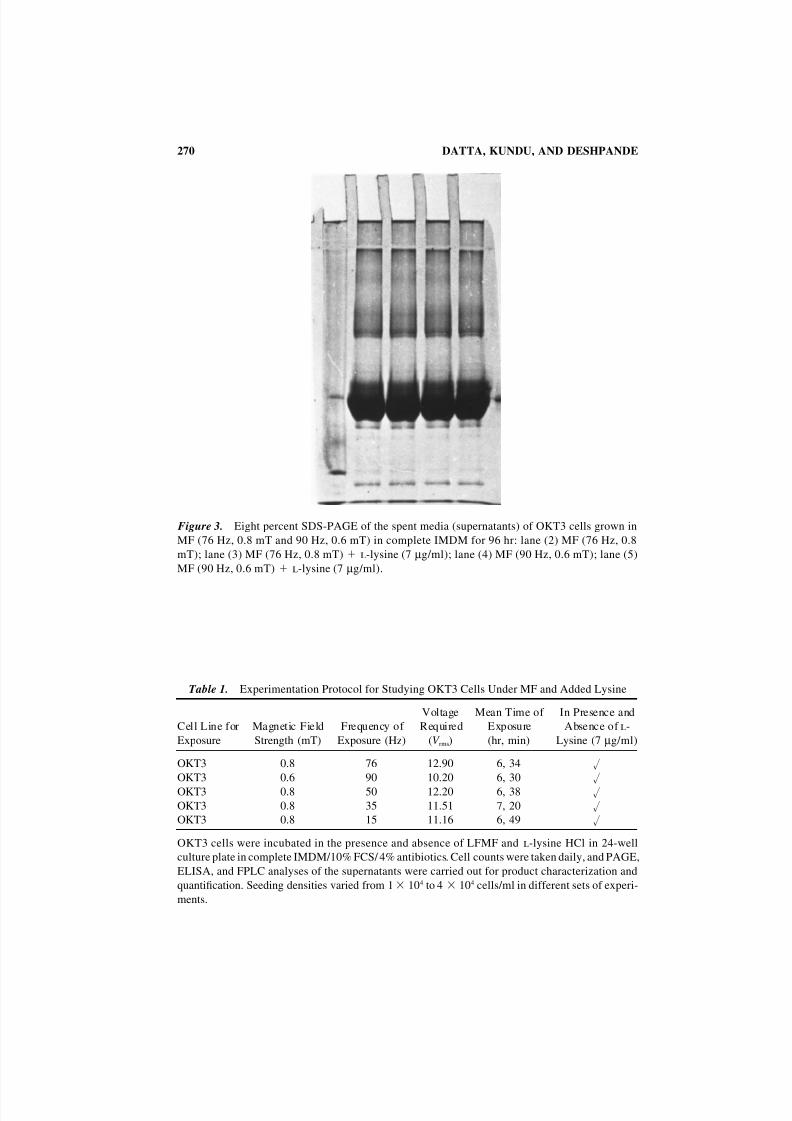
Figure 3. Eight percent SDS-PAGE of the spent media (supernatants) of OKT3 cells grown in
MF (76 Hz, 0.8 mT and 90 Hz, 0.6 mT) in complete IMDM for 96 hr: lane (2) MF (76 Hz, 0.8
mT); lane (3) MF (76 Hz, 0.8 mT) l-lysine (7 µg/ml); lane (4) MF (90 Hz, 0.6 mT); lane (5)
MF (90 Hz, 0.6 mT) l-lysine (7 µg/ml).
Table 1. Experimentation Protocol for Studying OKT3 Cells Under MF and Added Lysine
Voltage Mean Time of In Presence and
Cell Line for Magnetic Field Frequency of Required Exposure Absence of l-
Exposure Strength (mT) Exposure (Hz) (V rms) (hr, min) Lysine (7 µg/ml)
OKT3 0.8 76 12.90 6, 34
OKT3 0.6 90 10.20 6, 30
OKT3 0.8 50 12.20 6, 38
OKT3 0.8 35 11.51 7, 20
OKT3 0.8 15 11.16 6, 49
OKT3 cells were incubated in the presence and absence of LFMF and l-lysine HCl in 24-well
culture plate in complete IMDM/10% FCS/ 4% antibiotics. Cell counts were taken daily, and PAGE,
ELISA, and FPLC analyses of the supernatants were carried out for product characterization and
quantification. Seeding densities varied from 1 104 to 4 104 cells/ml in different sets of experi-
ments.
8/2/2019 Magnetic Field Stimulation
http://slidepdf.com/reader/full/magnetic-field-stimulation 9/20
MAGNETIC FIELD EFFECTS ON HYBRIDOMA CELLS IN CULTURE 271
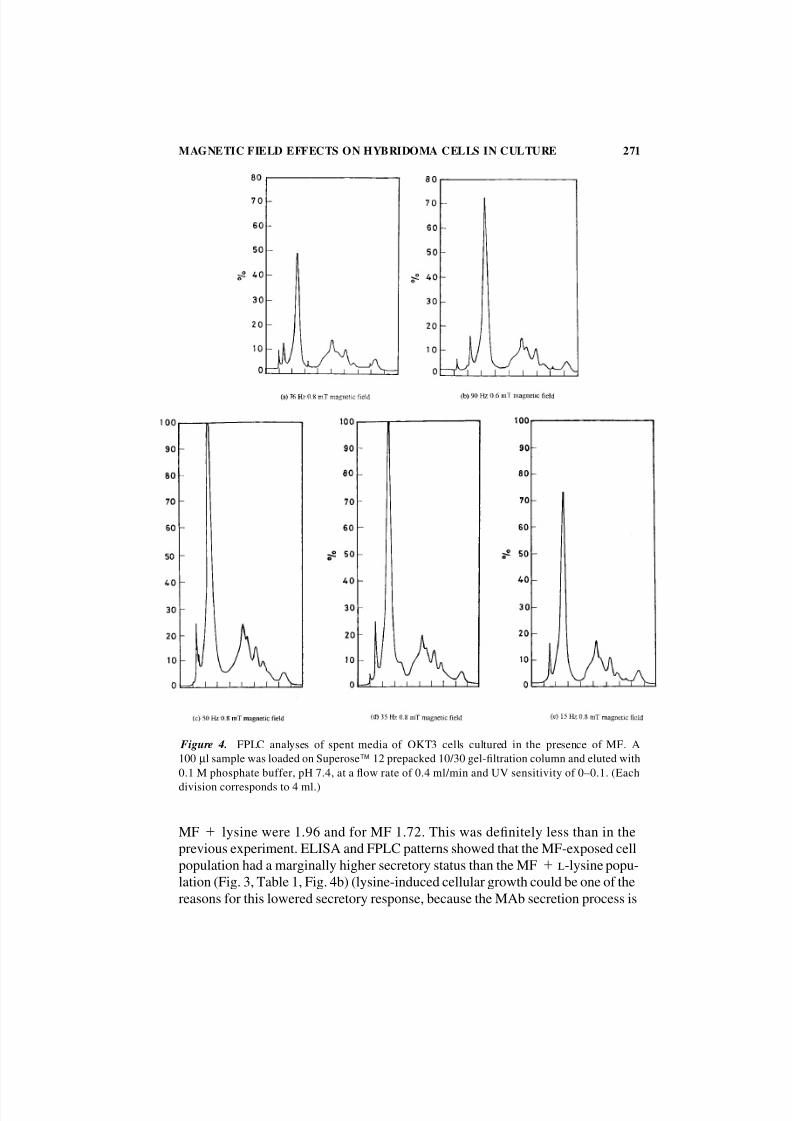
Figure 4. FPLC analyses of spent media of OKT3 cells cultured in the presence of MF. A
100 µl sample was loaded on Superose 12 prepacked 10/30 gel-filtration column and eluted with
0.1 M phosphate buffer, pH 7.4, at a flow rate of 0.4 ml/min and UV sensitivity of 0–0.1. (Each
division corresponds to 4 ml.)
MF lysine were 1.96 and for MF 1.72. This was definitely less than in the
previous experiment. ELISA and FPLC patterns showed that the MF-exposed cell
population had a marginally higher secretory status than the MF l-lysine popu-
lation (Fig. 3, Table 1, Fig. 4b) (lysine-induced cellular growth could be one of the
reasons for this lowered secretory response, because the MAb secretion process is
8/2/2019 Magnetic Field Stimulation
http://slidepdf.com/reader/full/magnetic-field-stimulation 10/20
272 DATTA, KUNDU, AND DESHPANDE
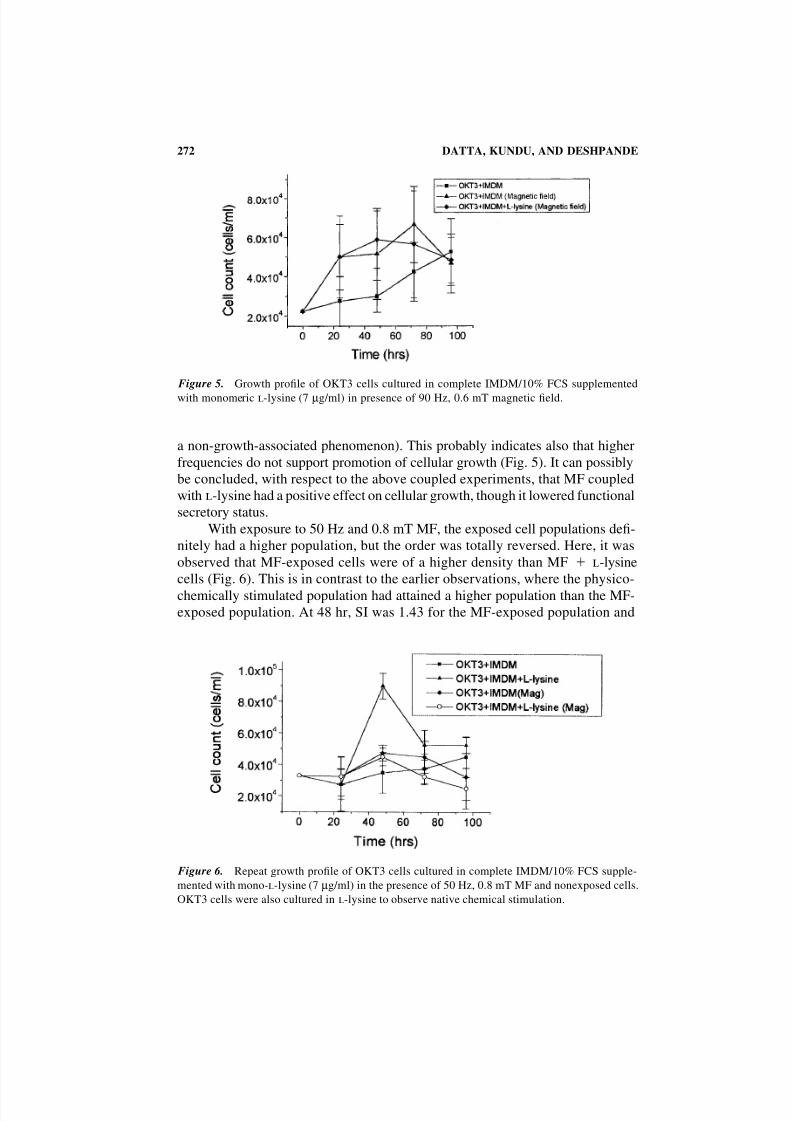
Figure 5. Growth profile of OKT3 cells cultured in complete IMDM/10% FCS supplemented
with monomeric l-lysine (7 µg/ml) in presence of 90 Hz, 0.6 mT magnetic field.
a non-growth-associated phenomenon). This probably indicates also that higher
frequencies do not support promotion of cellular growth (Fig. 5). It can possibly
be concluded, with respect to the above coupled experiments, that MF coupled
with l-lysine had a positive effect on cellular growth, though it lowered functional
secretory status.
With exposure to 50 Hz and 0.8 mT MF, the exposed cell populations defi-
nitely had a higher population, but the order was totally reversed. Here, it was
observed that MF-exposed cells were of a higher density than MF l-lysine
cells (Fig. 6). This is in contrast to the earlier observations, where the physico-
chemically stimulated population had attained a higher population than the MF-
exposed population. At 48 hr, SI was 1.43 for the MF-exposed population and
Figure 6. Repeat growth profile of OKT3 cells cultured in complete IMDM/10% FCS supple-
mented with mono-l-lysine (7 µg/ml) in the presence of 50 Hz, 0.8 mT MF and nonexposed cells.
OKT3 cells were also cultured in l-lysine to observe native chemical stimulation.
8/2/2019 Magnetic Field Stimulation
http://slidepdf.com/reader/full/magnetic-field-stimulation 11/20
MAGNETIC FIELD EFFECTS ON HYBRIDOMA CELLS IN CULTURE 273
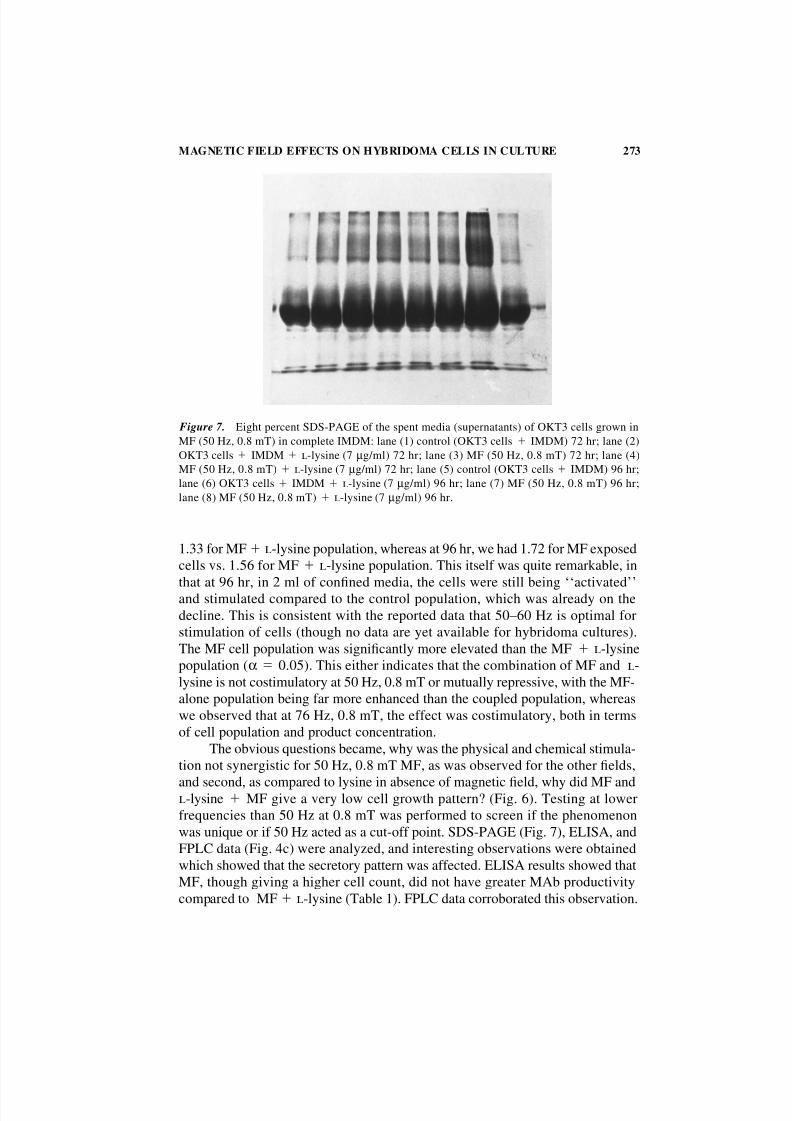
Figure 7. Eight percent SDS-PAGE of the spent media (supernatants) of OKT3 cells grown in
MF (50 Hz, 0.8 mT) in complete IMDM: lane (1) control (OKT3 cells IMDM) 72 hr; lane (2)
OKT3 cells IMDM l-lysine (7 µg/ml) 72 hr; lane (3) MF (50 Hz, 0.8 mT) 72 hr; lane (4)
MF (50 Hz, 0.8 mT) l-lysine (7 µg/ml) 72 hr; lane (5) control (OKT3 cells IMDM) 96 hr;
lane (6) OKT3 cells IMDM l-lysine (7 µg/ml) 96 hr; lane (7) MF (50 Hz, 0.8 mT) 96 hr;
lane (8) MF (50 Hz, 0.8 mT) l-lysine (7 µg/ml) 96 hr.
1.33 for MF l-lysine population, whereas at 96 hr, we had 1.72 for MF exposed
cells vs. 1.56 for MF l-lysine population. This itself was quite remarkable, in
that at 96 hr, in 2 ml of confined media, the cells were still being ‘‘activated’’and stimulated compared to the control population, which was already on the
decline. This is consistent with the reported data that 50–60 Hz is optimal for
stimulation of cells (though no data are yet available for hybridoma cultures).
The MF cell population was significantly more elevated than the MF l-lysine
population (α 0.05). This either indicates that the combination of MF and l-
lysine is not costimulatory at 50 Hz, 0.8 mT or mutually repressive, with the MF-
alone population being far more enhanced than the coupled population, whereas
we observed that at 76 Hz, 0.8 mT, the effect was costimulatory, both in terms
of cell population and product concentration.
The obvious questions became, why was the physical and chemical stimula-
tion not synergistic for 50 Hz, 0.8 mT MF, as was observed for the other fields,
and second, as compared to lysine in absence of magnetic field, why did MF andl-lysine MF give a very low cell growth pattern? (Fig. 6). Testing at lower
frequencies than 50 Hz at 0.8 mT was performed to screen if the phenomenon
was unique or if 50 Hz acted as a cut-off point. SDS-PAGE (Fig. 7), ELISA, and
FPLC data (Fig. 4c) were analyzed, and interesting observations were obtained
which showed that the secretory pattern was affected. ELISA results showed that
MF, though giving a higher cell count, did not have greater MAb productivity
compared to MF l-lysine (Table 1). FPLC data corroborated this observation.
8/2/2019 Magnetic Field Stimulation
http://slidepdf.com/reader/full/magnetic-field-stimulation 12/20
274 DATTA, KUNDU, AND DESHPANDE
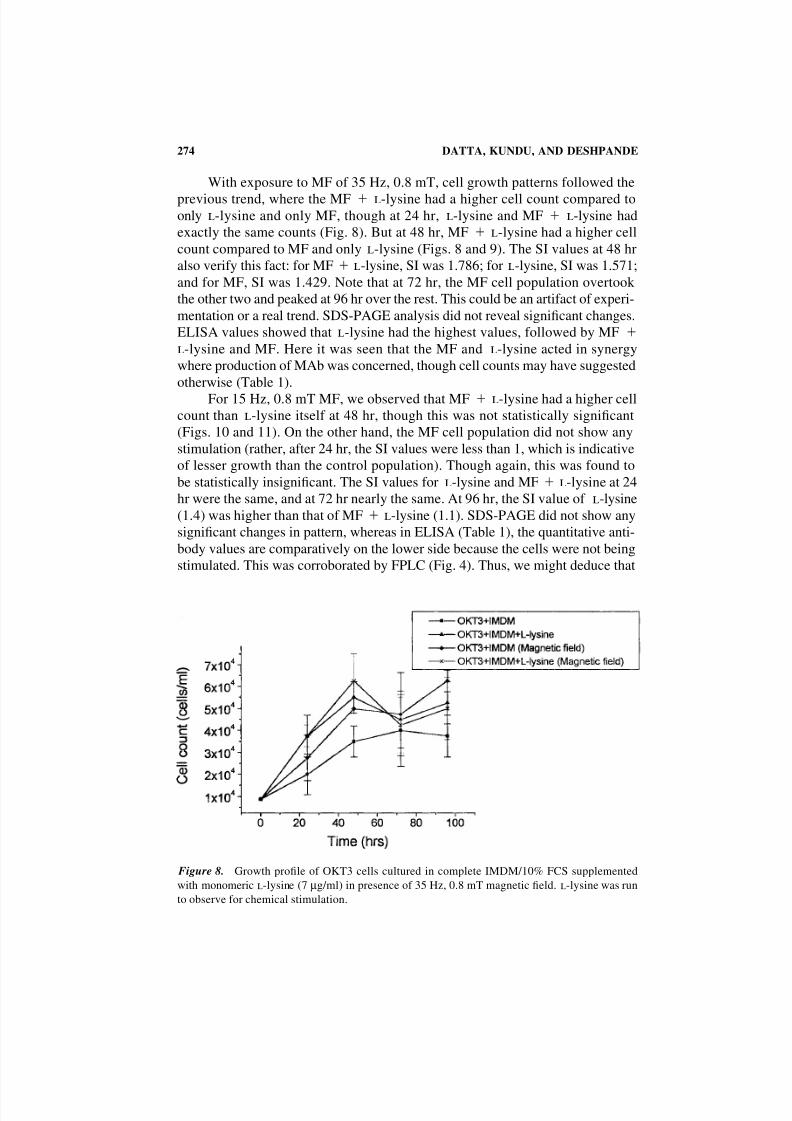
With exposure to MF of 35 Hz, 0.8 mT, cell growth patterns followed the
previous trend, where the MF l-lysine had a higher cell count compared toonly l-lysine and only MF, though at 24 hr, l-lysine and MF l-lysine had
exactly the same counts (Fig. 8). But at 48 hr, MF l-lysine had a higher cell
count compared to MF and only l-lysine (Figs. 8 and 9). The SI values at 48 hr
also verify this fact: for MF l-lysine, SI was 1.786; for l-lysine, SI was 1.571;
and for MF, SI was 1.429. Note that at 72 hr, the MF cell population overtook
the other two and peaked at 96 hr over the rest. This could be an artifact of experi-
mentation or a real trend. SDS-PAGE analysis did not reveal significant changes.
ELISA values showed that l-lysine had the highest values, followed by MF
l-lysine and MF. Here it was seen that the MF and l-lysine acted in synergy
where production of MAb was concerned, though cell counts may have suggested
otherwise (Table 1).
For 15 Hz, 0.8 mT MF, we observed that MF l-lysine had a higher cell
count than l-lysine itself at 48 hr, though this was not statistically significant
(Figs. 10 and 11). On the other hand, the MF cell population did not show any
stimulation (rather, after 24 hr, the SI values were less than 1, which is indicative
of lesser growth than the control population). Though again, this was found to
be statistically insignificant. The SI values for l-lysine and MF l-lysine at 24
hr were the same, and at 72 hr nearly the same. At 96 hr, the SI value of l-lysine
(1.4) was higher than that of MF l-lysine (1.1). SDS-PAGE did not show any
significant changes in pattern, whereas in ELISA (Table 1), the quantitative anti-
body values are comparatively on the lower side because the cells were not being
stimulated. This was corroborated by FPLC (Fig. 4). Thus, we might deduce that
Figure 8. Growth profile of OKT3 cells cultured in complete IMDM/10% FCS supplemented
with monomeric l-lysine (7 µg/ml) in presence of 35 Hz, 0.8 mT magnetic field. l-lysine was run
to observe for chemical stimulation.
8/2/2019 Magnetic Field Stimulation
http://slidepdf.com/reader/full/magnetic-field-stimulation 13/20
MAGNETIC FIELD EFFECTS ON HYBRIDOMA CELLS IN CULTURE 275
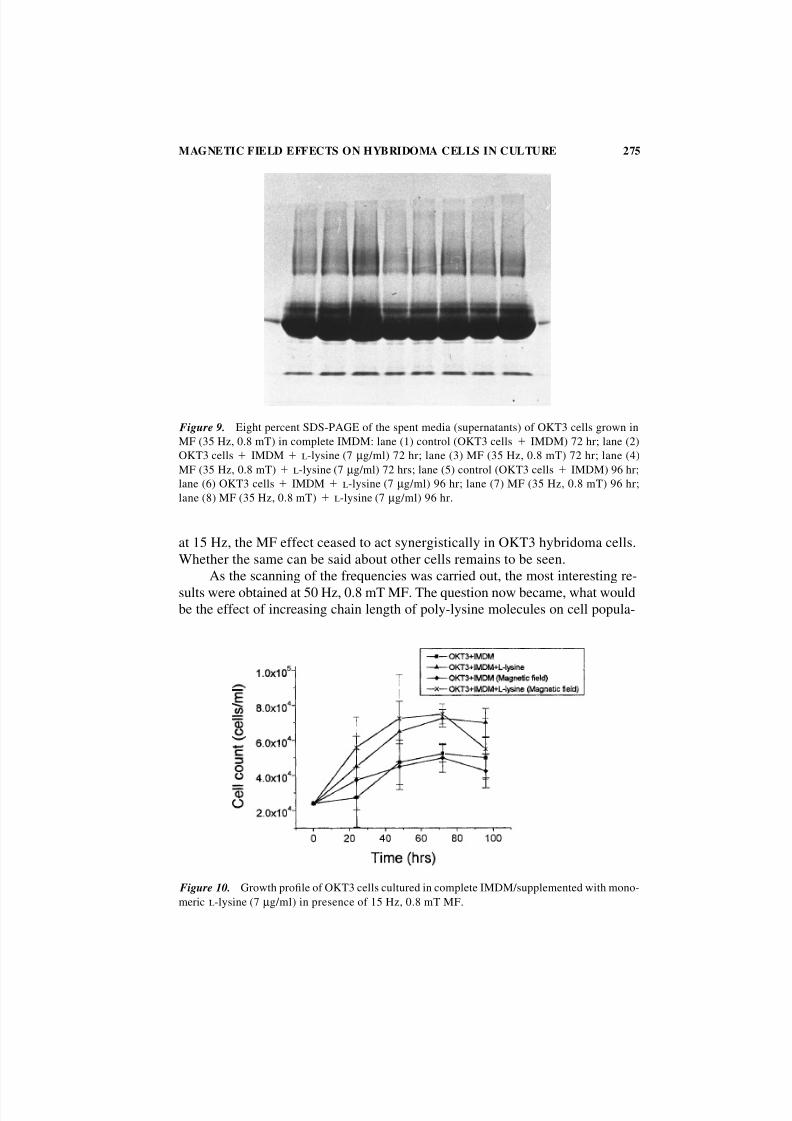
Figure 9. Eight percent SDS-PAGE of the spent media (supernatants) of OKT3 cells grown in
MF (35 Hz, 0.8 mT) in complete IMDM: lane (1) control (OKT3 cells IMDM) 72 hr; lane (2)
OKT3 cells IMDM l-lysine (7 µg/ml) 72 hr; lane (3) MF (35 Hz, 0.8 mT) 72 hr; lane (4)
MF (35 Hz, 0.8 mT) l-lysine (7 µg/ml) 72 hrs; lane (5) control (OKT3 cells IMDM) 96 hr;
lane (6) OKT3 cells IMDM l-lysine (7 µg/ml) 96 hr; lane (7) MF (35 Hz, 0.8 mT) 96 hr;
lane (8) MF (35 Hz, 0.8 mT) l-lysine (7 µg/ml) 96 hr.
at 15 Hz, the MF effect ceased to act synergistically in OKT3 hybridoma cells.
Whether the same can be said about other cells remains to be seen.
As the scanning of the frequencies was carried out, the most interesting re-
sults were obtained at 50 Hz, 0.8 mT MF. The question now became, what wouldbe the effect of increasing chain length of poly-lysine molecules on cell popula-
Figure 10. Growth profile of OKT3 cells cultured in complete IMDM/supplemented with mono-
meric l-lysine (7 µg/ml) in presence of 15 Hz, 0.8 mT MF.
8/2/2019 Magnetic Field Stimulation
http://slidepdf.com/reader/full/magnetic-field-stimulation 14/20
276 DATTA, KUNDU, AND DESHPANDE
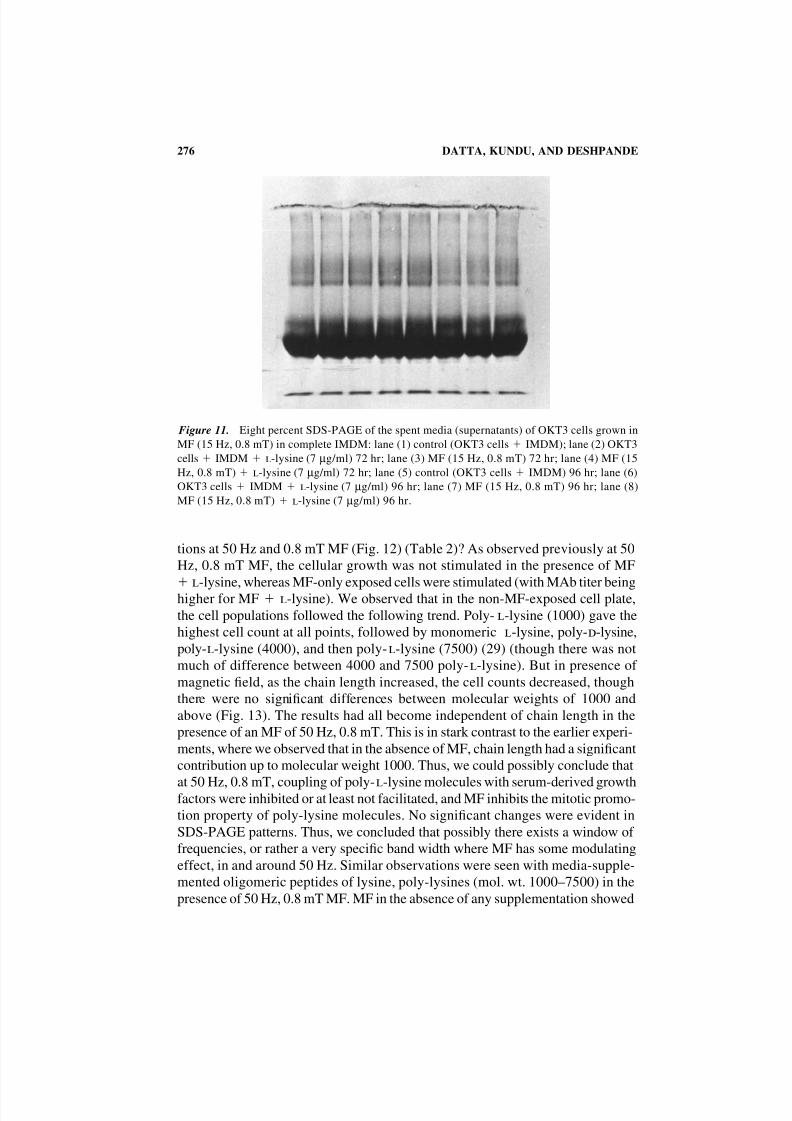
Figure 11. Eight percent SDS-PAGE of the spent media (supernatants) of OKT3 cells grown in
MF (15 Hz, 0.8 mT) in complete IMDM: lane (1) control (OKT3 cells IMDM); lane (2) OKT3
cells IMDM l-lysine (7 µg/ml) 72 hr; lane (3) MF (15 Hz, 0.8 mT) 72 hr; lane (4) MF (15
Hz, 0.8 mT) l-lysine (7 µg/ml) 72 hr; lane (5) control (OKT3 cells IMDM) 96 hr; lane (6)
OKT3 cells IMDM l-lysine (7 µg/ml) 96 hr; lane (7) MF (15 Hz, 0.8 mT) 96 hr; lane (8)
MF (15 Hz, 0.8 mT) l-lysine (7 µg/ml) 96 hr.
tions at 50 Hz and 0.8 mT MF (Fig. 12) (Table 2)? As observed previously at 50
Hz, 0.8 mT MF, the cellular growth was not stimulated in the presence of MF
l
-lysine, whereas MF-only exposed cells were stimulated (with MAb titer beinghigher for MF l-lysine). We observed that in the non-MF-exposed cell plate,
the cell populations followed the following trend. Poly-l-lysine (1000) gave the
highest cell count at all points, followed by monomeric l-lysine, poly-d-lysine,
poly-l-lysine (4000), and then poly-l-lysine (7500) (29) (though there was not
much of difference between 4000 and 7500 poly-l-lysine). But in presence of
magnetic field, as the chain length increased, the cell counts decreased, though
there were no significant differences between molecular weights of 1000 and
above (Fig. 13). The results had all become independent of chain length in the
presence of an MF of 50 Hz, 0.8 mT. This is in stark contrast to the earlier experi-
ments, where we observed that in the absence of MF, chain length had a significant
contribution up to molecular weight 1000. Thus, we could possibly conclude that
at 50 Hz, 0.8 mT, coupling of poly-l-lysine molecules with serum-derived growthfactors were inhibited or at least not facilitated, and MF inhibits the mitotic promo-
tion property of poly-lysine molecules. No significant changes were evident in
SDS-PAGE patterns. Thus, we concluded that possibly there exists a window of
frequencies, or rather a very specific band width where MF has some modulating
effect, in and around 50 Hz. Similar observations were seen with media-supple-
mented oligomeric peptides of lysine, poly-lysines (mol. wt. 1000–7500) in the
presence of 50 Hz, 0.8 mT MF. MF in the absence of any supplementation showed
8/2/2019 Magnetic Field Stimulation
http://slidepdf.com/reader/full/magnetic-field-stimulation 15/20
MAGNETIC FIELD EFFECTS ON HYBRIDOMA CELLS IN CULTURE 277
Table 2. Experimental Protocol for Studying the Effects of MF Coupled with Various Chain
Lengths of Oligolysines
Voltage Mean Time of
Cell Line for MF Frequency of Required Exposure Additive
Exposure Strength (mT) Exposure (Hz) (V rms) (hr, min) (7 µg/ml)
OKT-3 0.8 50 11.72 7, 54 l-Lysine HCl
OKT-3 0.8 50 11.68 7, 50 l-Lysine HCl
(1000)
OKT-3 0.8 50 11.69 7, 45 d-Lysine HCl
(1000)
OKT-3 0.8 50 11.73 7, 34 l-Lysine HCl
(4000)
OKT-3 0.8 50 11.70 7, 40 l-Lysine HCl
(7500)
To determine the effect of chain length of polymeric lysine molecules (oligopeptides) and their
effect on the cells in conjunction with MF of fixed parameters, OKT3 cells were incubated in the
presence and absence of LFMF and l-lysine HCl and its various polymers in a 24-well culture plate
in complete IMDM/10% FCS/4% antibiotics. Cell counts were taken daily while PAGE, ELISA,
and FPLC analyses were carried out with spent media. Seeding density was 2.1 104 cells/ml.
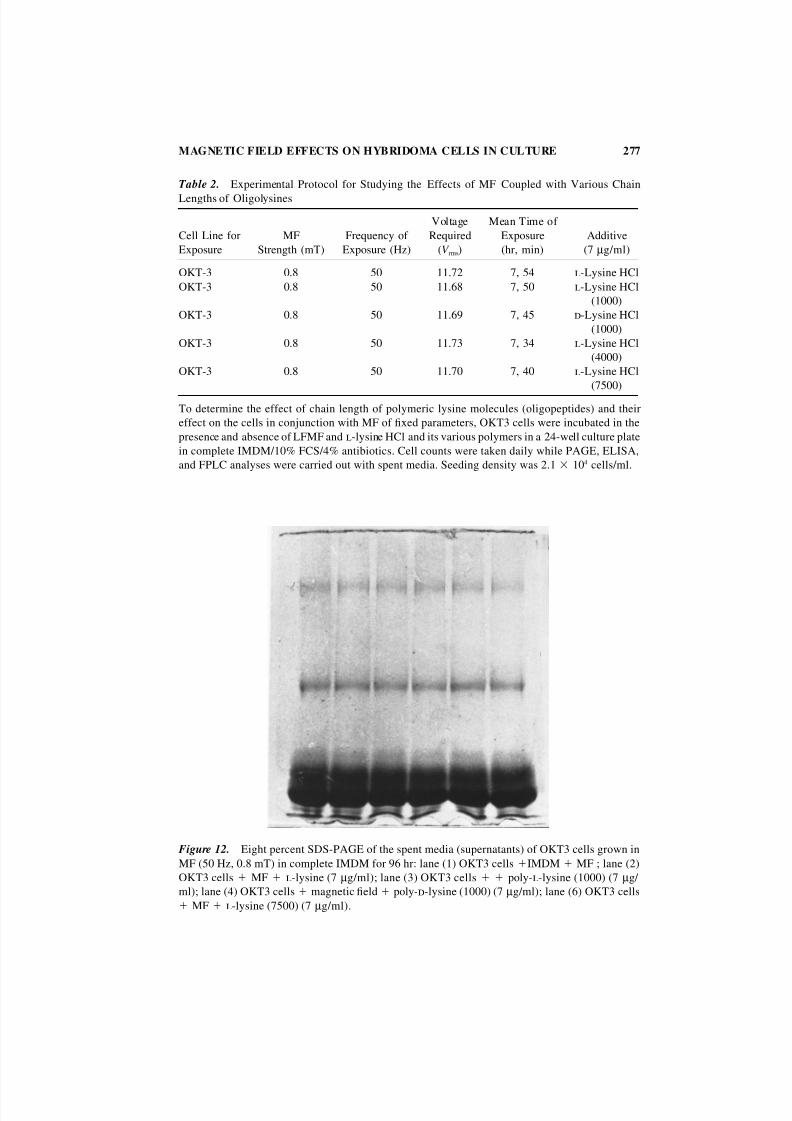
Figure 12. Eight percent SDS-PAGE of the spent media (supernatants) of OKT3 cells grown in
MF (50 Hz, 0.8 mT) in complete IMDM for 96 hr: lane (1) OKT3 cells IMDM MF ; lane (2)
OKT3 cells MF l-lysine (7 µg/ml); lane (3) OKT3 cells poly-l-lysine (1000) (7 µg/
ml); lane (4) OKT3 cells magnetic field poly-d-lysine (1000) (7 µg/ml); lane (6) OKT3 cells
MF l-lysine (7500) (7 µg/ml).
8/2/2019 Magnetic Field Stimulation
http://slidepdf.com/reader/full/magnetic-field-stimulation 16/20
278 DATTA, KUNDU, AND DESHPANDE
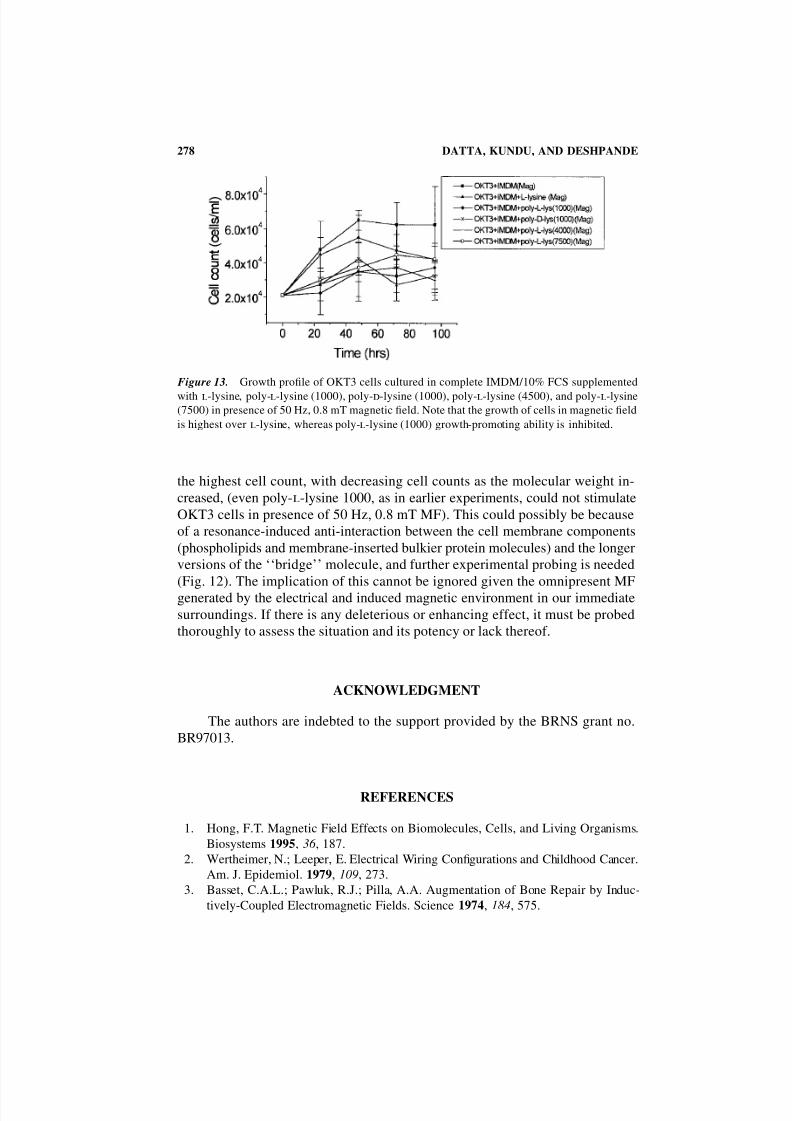
Figure 13. Growth profile of OKT3 cells cultured in complete IMDM/10% FCS supplemented
with l-lysine, poly-l-lysine (1000), poly-d-lysine (1000), poly-l-lysine (4500), and poly-l-lysine(7500) in presence of 50 Hz, 0.8 mT magnetic field. Note that the growth of cells in magnetic field
is highest over l-lysine, whereas poly-l-lysine (1000) growth-promoting ability is inhibited.
the highest cell count, with decreasing cell counts as the molecular weight in-
creased, (even poly-l-lysine 1000, as in earlier experiments, could not stimulate
OKT3 cells in presence of 50 Hz, 0.8 mT MF). This could possibly be because
of a resonance-induced anti-interaction between the cell membrane components
(phospholipids and membrane-inserted bulkier protein molecules) and the longer
versions of the ‘‘bridge’’ molecule, and further experimental probing is needed
(Fig. 12). The implication of this cannot be ignored given the omnipresent MF
generated by the electrical and induced magnetic environment in our immediate
surroundings. If there is any deleterious or enhancing effect, it must be probed
thoroughly to assess the situation and its potency or lack thereof.
ACKNOWLEDGMENT
The authors are indebted to the support provided by the BRNS grant no.
BR97013.
REFERENCES
1. Hong, F.T. Magnetic Field Effects on Biomolecules, Cells, and Living Organisms.
Biosystems 1995, 36 , 187.
2. Wertheimer, N.; Leeper, E. Electrical Wiring Configurations and Childhood Cancer.
Am. J. Epidemiol. 1979, 109, 273.
3. Basset, C.A.L.; Pawluk, R.J.; Pilla, A.A. Augmentation of Bone Repair by Induc-
tively-Coupled Electromagnetic Fields. Science 1974, 184, 575.
8/2/2019 Magnetic Field Stimulation
http://slidepdf.com/reader/full/magnetic-field-stimulation 17/20
MAGNETIC FIELD EFFECTS ON HYBRIDOMA CELLS IN CULTURE 279
4. Herbst, E. Response of Rat Skin Flaps to Sinusoidal Electromagnetic Fields. In Pro-
ceedings of the Ninth Annual Conference of the IEEE Engineering in Medicine and Biology Society, 1987; 1– 4, 75.
5. Liburdy, R.P.; Tenforde, T.S. Magnetic Field Interactions with Phospholipid Bilayer
Interaction. In Proceedings of the Ninth Annual Conference of the IEEE Engineering
in Medicine and Biology Society, 1987; 1–4, 81.
6. Shepperd, A.R. Effect of a 60 Hz Magnetic Field on a Spontaneously Active Neu-
ronal System. In Proceedings of the Ninth Annual Conference of the IEEE Engi-
neering in Medicine and Biology Society, 1987; 1– 4, 79.
7. Blank, M.; Soo, L.; Papstein, V. Bioelectrochem. Bioener. 1995, in press.
8. Blank, M.; Khorkova, O.; Goodman, R. Changes in Polypeptide Distribution Stimu-
lated by Different Levels of Electromagnetic and Thermal Stress. Bioelectrochem.
Bioener. 1994, 33, 109.
9. Blank, M.; Khorkova, O.; Goodman, R. Similarities in the Proteins Synthesized by
Sciara Salivary Gland Cells in Response to Electromagnetic Fields and Heat Shock.
Bioelectrochem. Bioener. 1993, 31, 27.
10. Basset, C.A.L.; Choski, H.R.; Hernandez, E.; Pawluk, R.J.; Strop, M. The Effect of
Pulsing Electromagnetic Fields on Cellular Calcium and Calcification of Non-
unions. In Electrical Properties of Bone and Cartilage: Experimental Effects and
Clinical Applications; Brighton, C.T., Black, J., Pollack, S.R., Eds.; Grune & Strat-
ton: New York, 1979; 427–441.
11. Aaron, R.K.; McK.Ciombor, D.; Jolly, G. Stimulation of Experimental Endochon-
dral Ossification by Low-Energy Pulsing Electromagnetic Fields. J. Bone Miner.
Res. 1989, 4, 227.
12. Fitton-Jackson, S. Biophysical Studies of Pulsing Magnetic Field Interaction with
Biological Systems. I. NATO ASI Ser. A. 1985, 97 , 537.
13. Norton, L.A.; Witt, D.W.; Rovetti, L.A. Pulsed Electromagnetic Fields Alter Pheno-
typic Expression in Chrodroblasts in Tissue Culture. J. Orthop. Res. 1988, 6 , 685.
14. Murray, J.C.; Farndale, R.W. Modulation of Collagen Production in Cultured Fibro-
blasts by a Low-Frequency, Pulsed Magnetic Field. Biochim. Biophys. Acta 1985,
838, 98.
15. Yen-Patton, G.P.A.; Patton, W.F.; Beer, D.M.; Jacobson, B.S. Endothelial Cell Re-
sponse to Pulsed Electromagnetic Fields: Stimulation of Growth Rate and Angiogen-
esis In Vitro. J. Cell. Physiol. 1988, 134, 37.
16. Harrington, D.B.; Becker, R.O. Electrical Stimulation of RNA & Protein Synthesis
in the Frog Erythrocyte. Exp. Res. 1973, 76 , 95.
17. Rinsertz, N.R.; Bolund, L. Activation of Hen Erythrocyte Deoxyribonucleo Protein.
Exp. Cell Res. 1969, 55, 205.
18. Forgacs, Z.; Thuroczy, G.; Paksy, K.; Szabo, L.D. Effect of Sinusoidal 50 Hz Mag-
netic Field on the Testosterone Production of Mouse Primary Leydig Cell Culture.Bioelectromagnetics 1998, 19, 429.
19. Antonopoulos, A.; Yang, B.; Stamm, A.; Heller, W.D.; Obe, G. Cytological Effects
of 50 Hz Electromagnetic Fields on Human Lymphocytes In Vitro. Mutat. Res. 1995,
346 , 151.
20. Santoro, N.; Lisi, A.; Pozzi, D.; Pasquali, E.; Serafino, A.; Grimaldi, S. Effect of
Extremely Low Frequency (ELF) Magnetic Field Exposure on Morphological and
Biophysical Properties of Human Lymphoid Cell Line (Raji). Biochim. Biophys.
Acta 1997, 1357 , 281.
8/2/2019 Magnetic Field Stimulation
http://slidepdf.com/reader/full/magnetic-field-stimulation 18/20
280 DATTA, KUNDU, AND DESHPANDE
21. Bras, W.; Diakun, G.P.; Diaz, J.F.; Maret, G.; Kramer, H.; Bordas, J.; Medrano, F.J.
The Susceptibility of Pure Tubulin to High Magnetic Fields: A Magnetic Birefrin-gence and X-ray Fiber Diffraction Study. Biophys. J. 1998, 74, 1509.
22. Norimura, T.; Imada, H.; Kunugita, N.; Yoshida, N.; Nikaido, M. Effects of Strong
Magnetic Fields on Cell Growth and Radiation Response of Human T-Lymphocytes
in Culture. Sangyo Ika Daigaku Zasshi 1993, 15, 103.
23. Zhang, X.R.; Kobayashi, H.; Hayakawa, A.; Ishigaki, T. An Evaluation of the Bio-
logical Effects of Three Different Modes of Magnetic Fields on Cultured Mammalian
Cells. Nagoya J. Med. Sci. 1995, 58, 157.
24. Raylman, R.R.; Clavo, A.C.; Wahl, R.L. Exposure to Strong Static Magnetic Field
Slows the Growth of Human Cancer Cells in Vitro. Bioelectromagnetics 1996, 17 ,
358.
25. Kim, Y.V.; Conover, D.L.; Lotz, W.G.; Cleary, S.F. Electric Field-Induced Changes
in Agonist-Stimulated Calcium Fluxes of Human HL-60 Leukemia Cells. Bio-
electromagnetics 1998, 19, 366.
26. Hiraoka, M.; Miyakoshi, J.; Li, Y.P.; Shung, B.; Takebe, H.; Abe, M. Induction of
c-fos Gene Expression by Exposure to a Static Magnetic Field in HeLaS3 Cells.
Cancer Res. 1992, 52, 6522.
27. Goodman, R.; Andrew, C.; Basset, L.; Henderson, A.S. Pulsing Electromagnetic
Fields Induce Cellular Transcription. Science 1983, 220, 1283.
28. Senthilkumar, M.; Kundu, P.K.; Datta, D. Studies on High-Density Culture of Hy-
bridoma Cells (AE9D6) In Vitro. ISAO97, 1997 (abstract).
29. Datta, D.; Kundu, P.K.; Senthilkumar, M. l-Lysine Promotes Growth and Secretion
of Hybridoma Cell Line (AE9D6) In Vitro. ISAO97, 1997 (abstract).
30. Datta, D.; Kundu, P.K.; Biswas, S. Effect of Cationic Amino Acid, l-Lysine and
Its Polymers on the Growth and Secretion of Hybridoma Cell Line OKT3. Hybrid-
oma 1999, submitted for publication.

8/2/2019 Magnetic Field Stimulation
http://slidepdf.com/reader/full/magnetic-field-stimulation 19/20

8/2/2019 Magnetic Field Stimulation
http://slidepdf.com/reader/full/magnetic-field-stimulation 20/20
Copyright of Electro- & Magnetobiology is the property of Marcel Dekker Inc. and its content may not be
copied or emailed to multiple sites or posted to a listserv without the copyright holder's express written
permission. However, users may print, download, or email articles for individual use.