Embed Size (px)
Citation preview
MAFIC AND FELSIC DERIVED SOILS IN THE GEORGIA PIEDMONT: PARENT
MATERIAL UNIFORMITY, RECONSTRUCTION, AND TRACE METAL
CONTENTS
by
DIXIE A. HAMILTON
(Under the Direction of Larry West)
ABSTRACT
Felsic and mafic/ultamafic rocks will weather to form soils having different
characteristics. Three pedons were chosen based on differing parent materials. Particle
size and chemical properties were characterized by standard methods, and clay
mineralogy was evaluated using x-ray diffraction. Sand Zr and whole soil trace metals
were measured on the ICP-MS, using HF dissolution. Particle-size separates and trace
metals were reconstructed using Zr as the immobile constituent. Soils developed from
mafic/ultramafic parent materials had thinner sola and higher pH, CEC, and base
saturation than the pedon developed from felsic rocks. 2:1 clays dominated the
mafic/ultramafic sites and kaolinite dominated the felsic site. Parent material
discontinuities were seen at the mafic/ultramafic sites using sand:silt and Ti:Zr ratios.
Reconstruction analysis of the clays found that substantial clay neoformation occurred in
the argillic horizons at all three sites, and trace metal reconstruction found that metals
were residually accumulating at the mafic/ultramafic sites.
INDEX WORDS: Felsic, Ultramafic, Mafic, Reconstruction analysis, Trace metals

MAFIC AND FELSIC DERIVED SOILS IN THE GEORGIA PIEDMONT: PARENT
MATERIAL UNIFORMITY, RECONSTRUCTION, AND TRACE METAL
CONTENTS
by
DIXIE A. HAMILTON
B.S.A, University of Georgia, 1996
A Thesis Submitted to the Graduate Faculty of The University of Georgia in Partial
Fulfillment of the Requirements for the Degree
MASTER OF SCIENCE
ATHENS, GEORGIA
2002

© 2002
Dixie A. Hamilton
All Rights Reserved
MAFIC AND FELSIC DERIVED SOILS IN THE GEORGIA PIEDMONT: PARENT
MATERIAL UNIFORMITY, RECONSTRUCTION, AND TRACE METAL
CONTENTS
by
DIXIE A. HAMILTON
Major Professor: Larry West
Committee: William Miller Paul Schroeder
Electronic Version Approved: Maureen Grasso Dean of the Graduate School The University of Georgia December 2002

iv
DEDICATION
This thesis is dedicated to my two beautiful children, Hanna and Will, and my
loving and patient husband, Todd.

v
ACKNOWLEDGEMENTS
Dr. Larry West, Dr. Paul Schroeder, Dr. William Miller, Dr. Sayed Hassan, Dr. Joey Shaw, Dr. Phil Schroeder, Patrick Davies, Jody Boyce, John Rema, Carolee Belew, Keith
Harris, Bob Evon, Rick Joslyn, Jennifer Treadway, Evelyn Albright, Soil Mineralogy classes of 1998 and 2000, Staff of UGA Soil Characterization Lab, Office Staff of Crop and Soil Sciences Department, and last but not least Todd Wood and Wayne and Donna
Hamilton for their love, patience, and free baby sitting services.

vi
TABLE OF CONTENTS
Page
ACKNOWLEDGEMENTS.............................................................................................v
LIST OF TABLES .......................................................................................................viii
LIST OF FIGURES........................................................................................................ix
CHAPTER
1 INTRODUCTION..........................................................................................1
2 LITERATURE REVIEW...............................................................................4
Geology of the Study Area.........................................................................4
Clay Mineralogy ........................................................................................5
Sand and Silt Mineralogy...........................................................................8
Weathering Trends.....................................................................................9
Reconstruction Analysis...........................................................................10
Trace Metal Contents ...............................................................................13
3 MATERIALS AND METHODS..................................................................16
Site Selection ...........................................................................................16
Pedon Description and Sampling..............................................................18
Sample Preparation ..................................................................................18
Characterization Analysis ........................................................................18
Clay Mineralogy ......................................................................................19
Elemental Analysis ..................................................................................19

vii
Reconstruction Analysis...........................................................................20
Trace Metal Analysis ...............................................................................21
4 RESULTS AND DISCUSSIONS.................................................................22
Physical Properties...................................................................................22
Chemical Properties .................................................................................29
Clay Mineralogy ......................................................................................31
Parent Material Uniformity ......................................................................39
Particle Size Reconstruction.....................................................................43
Trace Metal Abundance ...........................................................................47
5 CONCLUSIONS..........................................................................................63
REFERENCES..............................................................................................................66
APPENDICES...............................................................................................................71
A Soil Descriptions ..........................................................................................71

viii
LIST OF TABLES
Page
Table 1: Particle-size data and reconstruction for all three sites......................................23
Table 2: Mean metal concentrations of genetic horizons ................................................47

ix
LIST OF FIGURES
Page
Figure 1: Particle size distribution, sand:silt ratio and Ti:Zr ratio for Site1.....................24
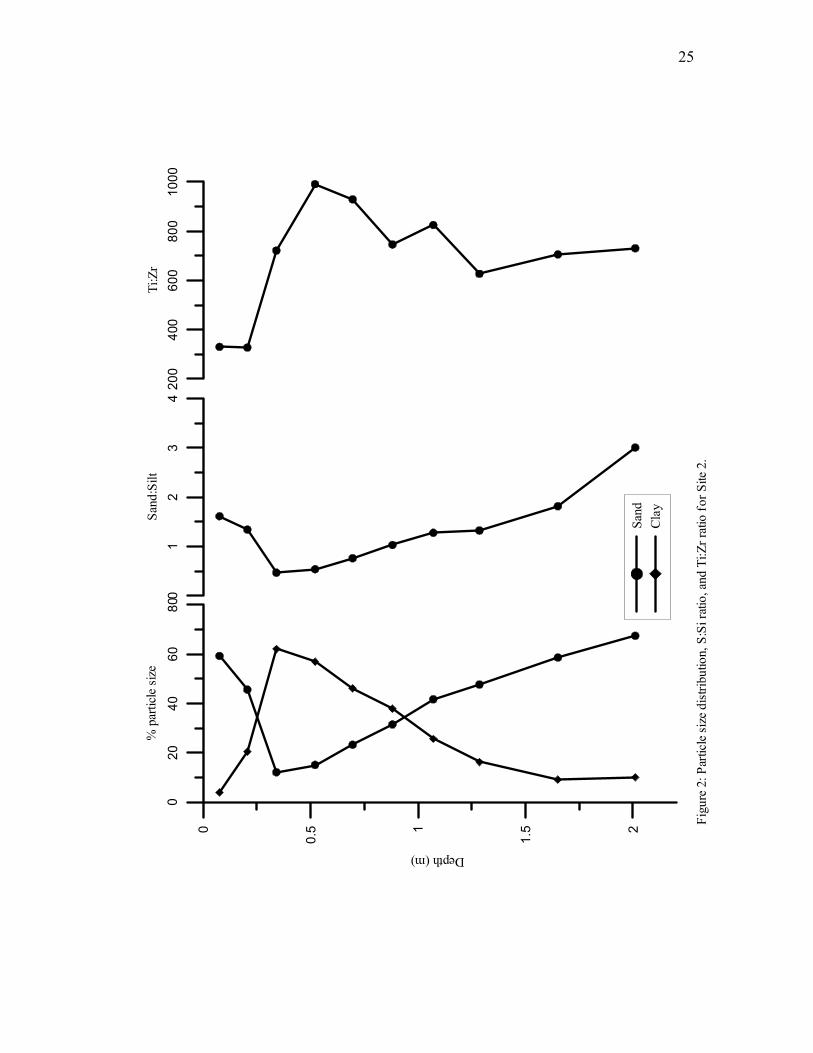
Figure 2: Particle size distribution, sand:silt ratio and Ti:Zr ratio for Site2.....................25
Figure 3: Particle size distribution, sand:silt ratio and Ti:Zr ratio for Site3.....................26
Figure 4: Bulk density measurements for all three sites..................................................28
Figure 5: CEC and base saturation for all three sites ......................................................30
Figure 6: Mg-ethylene glycol saturation XRD patterns for Site1 ....................................32
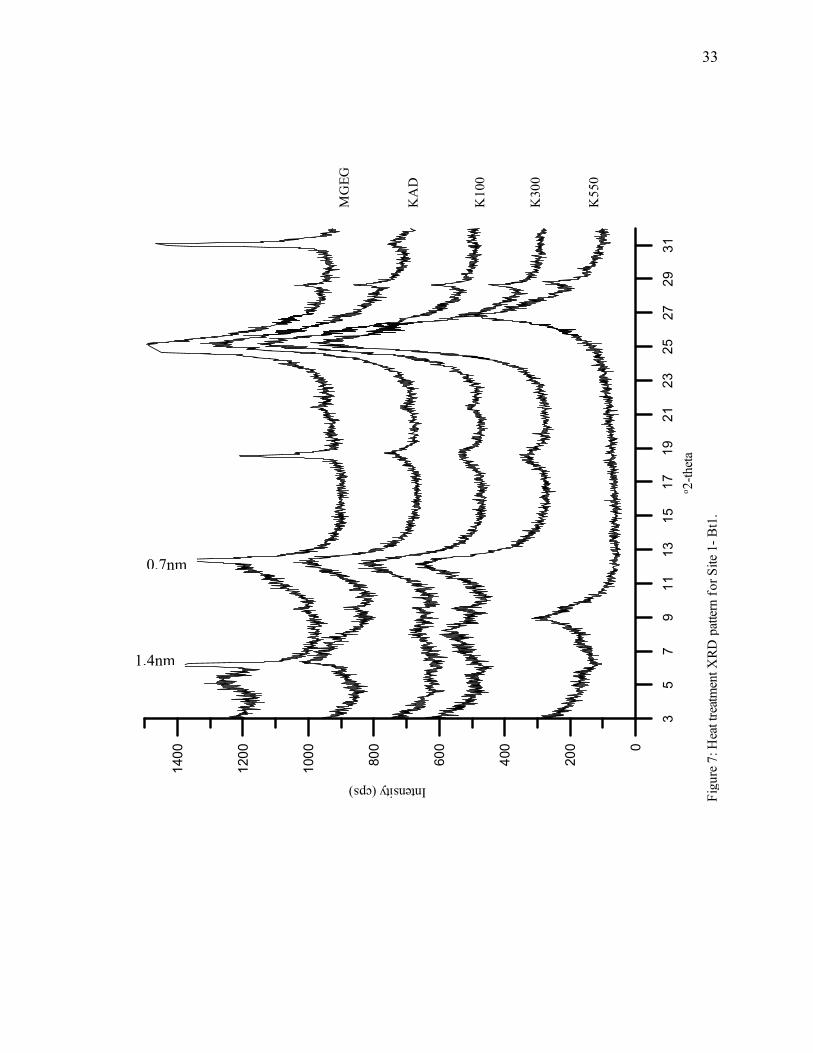
Figure 7: Heat treatment XRD pattern for Site1- Bt1 .....................................................33
Figure 8: Heat treatment XRD pattern for Site1- Cr5 .....................................................34
Figure 9: Mg-ethylene glycol saturation XRD patterns for Site2 ....................................37
Figure 10: Heat treatment XRD pattern for Site2- Bt .....................................................38
Figure 11: Mg-ethylene glycol saturation XRD patterns for Site1 ..................................40
Figure 12: Heat treatment XRD pattern for Site3- Bt1 ...................................................41
Figure 13: Gains or losses of sand and clay for all three sites .........................................45
Figure 14a and 14b: Raw data of trace metals for Site1.............................................48-49
Figure 15a and 15b: Reconstruction of trace metals for Site1....................................51-52
Figure 16a and 16b: Raw data of trace metals for Site2.............................................53-54
Figure 17a and 17b: Reconstruction of trace metals for Site2....................................56-57
Figure 18a and 18b: Raw data of trace metals for Site3.............................................58-59
Figure 19a and 19b: Reconstruction of trace metals for Site3....................................61-62

1
CHAPTER 1
INTRODUCTION
Appreciable acreage of soils developed over mafic and ultramafic rocks occur in
the Southern Piedmont of Georgia. These rocks are remnant of ocean floor smears or
cumulate melts over felsic basement rock that have formed during the opening and
closing of the Iapetus Ocean approximately 700Ma (Higgins et al., 1988; Odom and
Fullagar, 1984). Felsic Grenvillian basement is completely faulted and folded, but very
little occurrence is seen the Georgia Piedmont, suggesting that the piedmont has formed
mainly from younger igneous and metamorphic terrains (McConnel and Costello, 1984;
Rast, 1989). The majority of soils in the piedmont have weathered from high to low
grade metasediments and felsic grading through mafic metavolcanic magmatites, schists,
and gneisses, which are intruded by granitic plutons (Vincent et al., 1990).
Ultramafic and mafic parent materials will weather to soils containing many 2:1
types of clay, resulting in shrink/swell characteristics, which affects landuse suitability.
Differences in soil mineral assemblages and weathering have not been studied
extensively in this region. Based on previous studies of parent material weathering in
North Carolina and the Blue Ridge Mountains of the southeast, clay mineralogy of soils
formed from mafic and ultramafic parent materials were expected to have a broad range
of minerals including smectitic, chloritic, and kaolinitic clays (Ogg and Smith, 1993;
Norfleet and Smith, 1989; Graham et al, 1989b; Norfleet et al., 1993). The occurrence of
expandable 2:1 clays limit the water flow through the pedon, creating shallow and sticky

2
soils not suitable for agriculture or development. Felsic parent materials commonly
transform directly to kaolinitic group minerals in the southeast (Kretzschmar et al., 1997).
Parent material uniformity was important to this study because it is a major
assumption in reconstruction techniques to understand clay concentration in Bt horizons
and gains and losses of trace metals. Stolt et al. (1993a) used clay-free sand/silt ratios,
Ti/Zr ratios, and index mineral content in the Virginia piedmont to evaluate
disconformities in landscape positions. They found that this was a good technique to
evaluate parent material uniformity. Evidence in soils in the Georgia Piedmont, such as
abrupt particle size changes and differing sand mineralogies suggests that there may be a
capping overlying the residual parent materials. However, data supporting this
hypothesis is sparse.
Little research has been reported on the pathways of textural differentiation
between A or E horizons and Bt horizons for soil in the Piedmont. Multiple hypotheses
can be used to explain formation of this common chararacteristic including clay
translocation and accumulation from overlying horizons, clay neoformation in Bt
horizons, and a thin capping of a less clayey second parent material. Stolt et al. (1993b),
using reconstruction methods, found that clay gains in Bt horizons coincided with sand
and silt loss almost to equilibrium. However, clay films are commonly reported in most
soils in the southeast suggesting clay translocation is also an active process.
Heavy metal release in mafic and ultramfic soils is important for understanding
land use limitations of these soils. Plant growth may be limited because of high heavy
metal content and low concentration of major nutrients (Freitas and Mooney, 1996).
Studies have shown that certain trace metals, Ni especially, will residually accumulate in

3
soils as parent materials weather and major cations are lost (Freitas and Mooney, 1996;
Medina et al., 1994; Nabais et al, 1996; and Robinson et al., 1997). Cu, Zn, Pb, Mn, Ni,
and Co have been found to concentrate in B-horizons (Zeissink, 1971), and Fe- and Mn-
oxides have been described as a concentrating agent for trace metals (Carpenter et al.,
1975; Suarez and Langmuir, 1974). Also, trace metals were found to reside in clay lattice
structures (Tiller, 1958; White 1957).
Because of limited understanding of processes leading to clay accumulation in Bt
horizons, clay mineral weathering and formation, and trace metal distribution with depth
for Piedmont soils with contrasting parent materials, this study was initiated with the
following objectives:
1) to evaluate property differences among soils developed from contrasting parent
materials,
2) to evaluate parent material uniformity in these soils
3) to quantify particle size gains and losses with reconstruction analysis
4) to quantify minor element gains and losses with raw data and reconstruction
analysis.

4
CHAPTER 2
LITERATURE REVIEW
Geology of the Study Area:
Because of their long history of orogenies and associtated metamorphism, rocks
in the Georgia Piedmont are complex with substantial variability in lithology and mineral
composition. In the Precambrian, the western edge of the Appalachian Mountains existed
as Grenville basement rock although little evidence of these rocks are found in Georgia
(McConnel and Costello (1984). Near the end of the Precambrian, approximately 700
Ma, the Iapetus Ocean began to form, rifting the Grenville basement rocks apart (Odom
and Fullagar, 1984). Subsequent closure of the Iapetus Ocean in the late Proterozoic
caused a transgression against the Laurentian shield, on the northwest side of the
orogeny. Sedimentation of clastic marine deposits during Cambrian times formed the
Carolina slate belt and these sediments measured as much as 5 km thick in places. These
clastic formations transitioned into Carboniferous rocks that began forming in the upper
Devonian (Rast, 1989).
The most influential orogenic event relating to the closure of Iapetus Ocean in the
southern Appalachians was the Alleghanian, which followed the Acadian orogeny.
Harris and Bayer (1979) reported that the Alleghanian orogeny to be one large thrust
against the Laurentian craton. Higgins et al. (1988) suggested that the subduction zones
dipped oceanward. Therefore, thrust sheets on the oceanward edge were stacked on top of

5
the more terrestrial sheets, with smears of Iapetus Ocean floor such as the Soapstone
Ridge in Atlanta, Georgia overlying everything.
The Southern Piedmont geology is mainly composed of high to low grade
metasediments and felsic rocks that grade through mafic metavolcanic magmatites,
schists, and gneisses, which are intruded through by granitic plutons (Vincent et al.,
1990). The major occurrences of ultramafic and mafic rocks in the Piedmont of Georgia
are associated with the Charlotte Belt and the Carolina Slate Belt, and these two belts are
thought to represent a single volcanic sedimentary event (Tobisch and Glover, 1969).
Clay Mineralogy:
Parent material is one of the five soil forming factors recognized by Jenny (1914)
and can have a large affect on soil mineralogy. In the southeastern Piedmont, felsic
parent materials weather to soils with clays dominated by kaolinite. As the parent
material grades to mafic and ultramafic rocks, 2:1 and 2:1:1 clay minerals become more
abundant. Ogg and Smith (1993) reported the clay fraction of two pedons derived from
ultramafic rocks in the Carolina Blue Ridge Piedmont was primarily talc and kaolinite,
and in a third pedon, smectite. Secondary minerals formed from amphibole and pyroxene
were kaolinite, a 2:1 interstratified mineral, and smectite. Primary chlorite weathered to a
2:1 interstratified mineral, kaolinite, vermiculite, and randomly interstratified chlorite-
vermiculite. Talc weathered to smectite, and the weathering of ferromagnesian minerals
produced goethite.
Soils in Italy formed from serpentinite contained low charge vermiculite and
smectite (Bonifacio et al., 1997). The low charge vermiculite formed in conditions of

6
free drainage while smectite occurred in soils with lower porosity and poor drainage.
These authors also found that these clays could alter to hydroxy-interlayered smectite or
vermiculite, followed by alteration into a chlorite-like mineral. Alexander et al. (1990)
reported smectite and chlorite to be the primary clay minerals of soils formed from
peridotite in California.
Kaolinite was the most abundant clay mineral in Hapludults formed from parent
materials intermediate between mafic and felsic in the Virginia Piedmont (Wysocki et al.,
1998). The next most common mineral in these soils was hydroxy-interlayered
vermiculite with mica, quartz, and vermiculite present. Kaolinite increased with depth
and hydroxy interlayered vermiculite decreased with depth.
In the highly weathered soils formed from ultramafic and mafic parent materials
in Thailand, Yoshinga et al. (1989) found halloysite as the major clay fraction
constituent. In contrast, kaolinite was the major clay mineral in a younger pedon formed
from basaltic lava flows. Other minor components of the soils were smectite,
vermiculite, chlorite, illite, and their derivatives.
In a study of clay mineralogy and weathering sequences of soils in the Blue Ridge
Front of North Carolina, Graham et al (1989b) found colluvial soils in the area to have
abundant 2:1 phyllosilicates and chlorite in the clay fraction because the parent material
had been physically weathered during transport as well as chemically weathered in situ.
Vermiculite and hydroxy-interlayered vermiculite (HIV) were found in both colluvial and
residual soils. However, hydroxy-interlayered vermiculite present in saprolite underlying
the colluvial soils was not found in the saprolite of the soils formed over residuum. The
primary mineral, chlorite, was physically altered to clay size in the colluvial soils but was

7
relatively stable and not chemically altered to a secondary mineral. In constrast, sand-
sized biotite weathered to produce both vermiculite and kaolinite. The most common
clay-size mineral in C-horizons was gibbsite thought to form from the release of Al and
Si from parent material. Alternatively, these authors recognized that the Al needed for
gibbsite formation may have been leached from overlying horizons, which were more
acid. Almadine in the parent material weathered to produce hematite, but goethite was
common in the clay fraction.
Norfleet et al. (1993) reported gibbsite, kaolinite, and HIV to be the most
common clay minerals in soils developed from felsic parent materials in the Blue Ridge
Mountains. The mineralogy was affected by the amount of precipitation, which controls
the amount of Si in the soil solution. The low silica, high precipitation environment
favored gibbsite formation, and conversely, a low precipitation, high silica environment
favored kaolinite formation. HIV was found throughout the soils. These workers
suggested that gibbsite and kaolinite competed for Al and existed inversely to each other
(Norfleet et al., 1993). For example, the more gibbsite was present, the less kaolinite was
present. However, they also reported that low levels of Si in the soil solution inhibited
neoformation of kaolinite and favored the formation of gibbsite. Rebertus et al. (1986)
also reported observing this antigibbsite effect in highly acid soils, where biotite
weathered to kaolinite. Gibbsite was found near the weathering rock, a zone of more
basic pH, and HIV was more prevalent in the more acid upper horizons.
Kretzschmar et al. (1997) studied clay mineral formation in two pedons in the
Piedmont. In both pedons, kaolinite pseudomorphs developed from biotite. In the pedon
developed from a gneiss parent material, however, halloysite was the initial product of
8
biotite weathering in saprolite, which transformed to kaolinite in horizons near the
surface.
Sand and Silt Mineralogy:
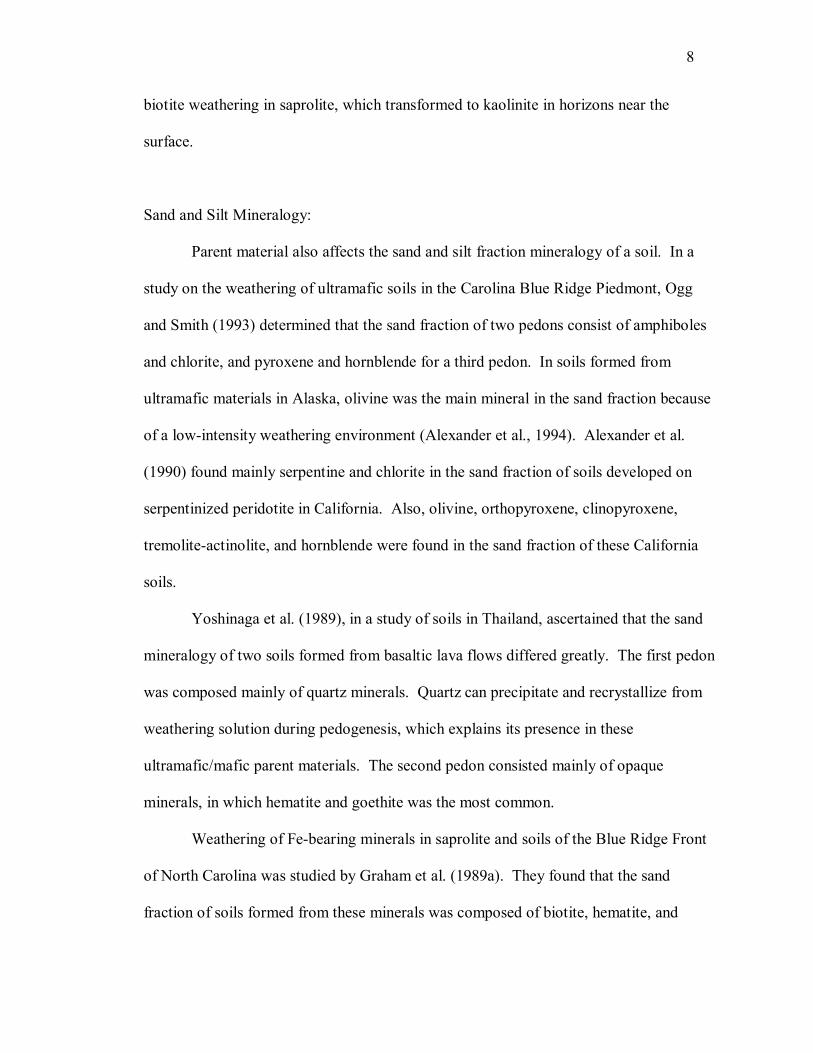
Parent material also affects the sand and silt fraction mineralogy of a soil. In a
study on the weathering of ultramafic soils in the Carolina Blue Ridge Piedmont, Ogg
and Smith (1993) determined that the sand fraction of two pedons consist of amphiboles
and chlorite, and pyroxene and hornblende for a third pedon. In soils formed from
ultramafic materials in Alaska, olivine was the main mineral in the sand fraction because
of a low-intensity weathering environment (Alexander et al., 1994). Alexander et al.
(1990) found mainly serpentine and chlorite in the sand fraction of soils developed on
serpentinized peridotite in California. Also, olivine, orthopyroxene, clinopyroxene,
tremolite-actinolite, and hornblende were found in the sand fraction of these California
soils.
Yoshinaga et al. (1989), in a study of soils in Thailand, ascertained that the sand
mineralogy of two soils formed from basaltic lava flows differed greatly. The first pedon
was composed mainly of quartz minerals. Quartz can precipitate and recrystallize from
weathering solution during pedogenesis, which explains its presence in these
ultramafic/mafic parent materials. The second pedon consisted mainly of opaque
minerals, in which hematite and goethite was the most common.
Weathering of Fe-bearing minerals in saprolite and soils of the Blue Ridge Front
of North Carolina was studied by Graham et al. (1989a). They found that the sand
fraction of soils formed from these minerals was composed of biotite, hematite, and

9
goethite. Magnetite in parent rock was also present in overlying saprolite but was not
present in the soil. Almandine began weathering in the parent rock by forming oxides
grain surfaces and along fractures. Chlorite appeared resistant to weathering. Biotite
weathered throughout the profile to kaolinite as pseudomorphs.
Little information is available on the silt mineralogyy of soil. In one study,
Yoshinaga et al. (1989) found that Thai soils formed from basaltic lava flows contained
hematite as the main component in the silt fraction. These soils also contained
kennedyite, indicating advanced weathering and ultramafic/mafic parent materials.
Weathering Trends:
Ogg and Smith (1993) reported that secondary clay mineral formation was both a
solid-state transformation and neogenesis. In a study of pedogenesis of serpentinite in a
catena in Italy, Bonifacio et al. (1997) found that the early stage of soil formation from
serpentinite was a process of acidification related to soil organic matter. Later pedogenic
processes were lessivage of clay minerals and iron oxide formation, which resulted in
formation of Alfisols.
In a study of parent material effects on chemical and mineralogical characteristics
of soils in Virginia Piedmont, Wysocki et al. (1988) found that mineralogical differences
in parent materials were unimportant because of chemical preweathering of the saprolite.
Clay formation from the saprolite was found to be a process of physical breakdown and
dispersion. Kaolinite occurred in the C-horizon from neoformation or translocation from
overlying horizons.

10
Schroeder et al. (2000) examined weathering trends for the Daniel Springs
metagabbro in Greene County. The metagabbro was composed of plagioclase,
hornblende, epidote, biotite, quartz, and ilmenite, which weathered to randomly ordered
mixed-layer mica/vermiculite/smectite, kaolinite, goethite, and vermiculite in the
saprolite. The concentrations of plagioclase, amphibole, vermiculite, and ilmenite
decreased upwards through the soil profile. Kaolinite was the dominant mineral in the B-
horizon.
Rice et al. (1985) explored the weathering sequence of a metagabbro in Stanly
County, North Carolina. The metagabbro was composed of chlorite, hornblende, quartz,
and calcic plagioclase feldspar. The chlorite weathered to regularly interstratified
chlorite/vermiculite, which then weathered to smectite. Hornblende was found to
transform to smectite and goethite, and the feldspar rapidly weathered to kaolinite. The
quartz remained stable throughout the profile. The presence of 2:1 clays was found to
restrict water flow through the profile, which decreased the amount of weathering and
caused a shallow pedon.
Reconstruction Analysis:
Gains and losses of mobile soil constituents during soil formation can be
reconstructed for a pedon if certain assumptions can be met (Brewer, 1976). The most
critical of these assumptions are that the soil is developed from a single parent material
and that an immobile component can be identified and measured. Commonly, elemental
Zr or Ti in the sand or silt fraction, which represents resistant Ti and Zr bearing minerals,
is used as the immobile constituent.

11
Stolt et al. (1993a) used reconstruction analysis principles to evaluate the
variability of soil development in different landscape positions, variability within soil
horizons, and parent material uniformity on several pedons in the Virginia Piedmont and
Blue Ridge Highlands. Their results showed that variability in soil development between
landscapes positions was minimal. Variability between horizons was greatest within the
C-horizon which suggested that pedogenesis in the upper horizons caused the soils to
develop similar properties. These authors used clay-free particle size distribution,
sand/silt ratios, Ti/Zr ratios, and index mineral contents to distinguish parent material
discontinuities.
Stolt et al. (1993b) used reconstruction techniques to examine the gains and losses
of soil constituents among different landscape positions and to evaluate the validity of
using reconstruction to study the relationships between soil genesis and landscape
position. Sand and silt weathering, the resulting weathering constituent transport and
leaching, clay illuviation and accumulation of Fe-oxides were modeled. In Piedmont
soils, gains and losses of clay, sand, and silt did not differ for landscape position. In
Piedmont soils formed from mica gneiss, clay eluviation was in equilibrium with sand
and silt weathering to clay. This was not the case in the more schistose material of the
Blue Ridge Highlands. Gains in Al and Fe paralleled gains in clay. Stolt et al. (1992)
found that 20 to 36% of the rock mass was lost during the transformation of hard rock to
saprolite, and of that loss, 73 to 82% was a loss of Al and Si.
Brimhall and Dietrich (1986) reported on relationship between chemical
composition, volume, density, porosity, and strain on ultramafic, Ni-rich parent materials
in Oregon. These authors proposed two models to quantify metal concentration in a

12
weathering profile: 1) residual enrichment where immobile metal cations are
concentrated by loss of mobile constituents and 2) supergene enrichment, where mobile
metals are leached from one zone and reprecipitated in another. These workers found that
Ni-enrichment of the upper soil profile was through residual weathering at a site on Eight
Dollar Mountain, OR. In contrast, at a site on nearby Nickel Mountain, elevated Ni
concentrations in the soil was due to both residual and supergene enrichment.
Merrits et al. (1992) used the mass balance techniques put forth by Brimhall and
Dietrich (1986) to study soil evolution of marine terraces in northern California. These
workers proposed use of a mass-transport function,τj,w, to evaluate mobility of an element
in a soil-rock system. If τj,w equaled 0, then the element showed no mobility in the
system, if τj,w was greater than 1, then the element was enriched, and if τj,w was less than
1, then the element was leached. The study found that Na, Ca, Mg, K, and Si all had a
net loss in the soil profile, with Si having the greatest lost because it was the most
prevalent in the parent material. Fe and Al showed redistribution within the soil column.
Schroeder et al. (2002) applied the elemental reconstruction procedure to Elberton
granite and Shoulderbone chlorite schist in Georgia. The granite showed losses in Mg,
Na, and Ca and gains in Fe, Al, and H. However, there was a net gain of Si and Al,
suggesting that there was input into the system from an external source. The mass
transport function of Merrits et al. (1992), τ showed positive mobility of Ca, Si, Fe, Al
and H from the A-horizon to the B-horizon. The chlorite schist expressed mass loss for
all elements except Al when the bedrock transitioned to the C-horizon. Again, gains of
Fe, Al, and H were seen in the B-horizon, as well as a gain in K. Increases in H and K

13
were due to organic matter input. An overall increase of Si and Al seen in the A and B-
horizons also suggests an external input into the system for the Shoulderbone site.
Trace metals contents:
Heavy metal release in mafic and ultramafic soils is important for understanding
land use limitations of these soils. Mafic and ultramafic soils may limit plant growth
because of high heavy metal content, low concentration of major nutrients, and limited
water holding capacity (Freitas and Mooney, 1996). Also, soil contamination by heavy
metals would be easier to assess when background levels of these elements are known.
Several studies have evaluated trace metal release from primary minerals and
resulting concentration or loss in developed soil horizons. In laterites, Ni and Co were
concentrated by a factor of 5 (Hotz, 1964). Gorden et al. (1958) found that Cu was
greatly accumulated in Arkansas bauxite soils and Pb and Zn slightly concentrated.
Conversely, Ginsburg et al. (1960) found that Cu and Pb were less abundant in soils than
in parent material. Several studies have shown trace metals, such as Cu, Zn, Pb, Mn, Ni,
and Co to concentrate in B-horizons (Zeissink, 1971). Tiller (1958) found that trace
elements were concentrated in surface horizons by translocation of plant growth.
Carpenter et al. (1975) found Fe and Mn oxides to be accumulating trace metals, which
were supported by Suarez and Langmuir’s (1974) study that found Ni, Co, Cu, Zn, Cd
and Pb concentrated in the Fe and Mn oxide fraction of the soil. Clay minerals adsorbed
minor amounts of trace metals and more were incorporated into clay mineral lattices
(Tiller, 1958; White, 1957).

14
A number of studies on trace elements taken up by vegetation from mafic and
ultramafic soils have been done. Kram et al. (1997) studied basic cation concentrations
in regional soils in the Czech Republic. These particular soils received as much as 230
mmol H m-2 yr-1 and 470 mmol SO42- in precipitation, creating a very acid soil
environment. However, because of lithology basic cation content varied from site to site.
The net output of basic cations was calculated by estimating the difference between
atmospheric inputs minus stream water output. The leucogranite-derived soil showed an
increase in dissolved Si and Al and had less basic cation output in stream water because
of its resistant to weathering. The serpentinite-derived soil was more weatherable, so an
increase in basic cation output was observed. These soils also had a greater concentration
of Mg and Si being leached out of the system than being added by atmospheric
deposition. The larger output was because of the high amoung of Mg in the serpentinite
bedrock. The research discovered that the mafic bedrock released 1000 time more
exchangeable Mg than the leucogranite. Potassium concentrations were greater in the
leucogranitic soils, and although Ca content was greater in these soils, more
exchangeable Ca was present in the serpentinitic soils. This occurred because the mafic
soils contained less Al and the pH valued competed with the Ca for exchangeable sites.
This study found that poor tree growth occurred on the serpitinitic soils because of K
deficiency and Mg, and Ni toxicity.
Many more studies have been conducted on plants growing in soils derived from
mafic and ultramafic parent materials. These studies have explored a wide range of
findings from metal contents of leaves to growth inhibition due to metal toxicity. A study
of Ni content in serpentinitic soils showed that 0.1µmol exchangeable Ni in the upper

15
15cm of the soil and 0.2 µmol of exchangeable Ni in the lower 30-60 cm (Nabais et al.,
1996). This study also found Ni content of phloem and zylem in Carcase ilex higher in
mafic soils than in plants grown in soils weathered from felsic parent materials.
Robinson et al. (1997) found that a variety of ultramafic serpintinitc soils in the Dun
Mountain Ophiolitic Belt, South Island, New Zealand contained 138 µg Ca, 66 µg Fe,
1622 µg Mg, 50 µg Nm, and 42 µg Ni g-1. The high levels of Mg and Ni may have
contributed to phytotoxicity. Another study by Medina et al. (1994) explored the
accumulation of trace elements and the limiting factors of vegetation in a serpintine
derived soil. They found that K limited forest vegetation growth in one case and P in
another. Also, Ni accumulated 1.2 µmol g-1 dry mass in a plant species considered to by
a Ni-hyperaccumulator.

16
CHAPTER 3
MATERIALS AND METHODS
Site Selection:
Three sites were selected for study based primarily on differences in parent
material so that a range from felsic to ultramafic parent rocks was represented. All sites
were chosen to be on stable hillslope summits with minimal anthropogenic disturbance.
The vegetation on Sites 1 and 2 consisted of mixed hardwoods and pines. Site 3 was
located in a field with grass cover and had not been under cultivation for some time. All
the sites were located within the Central-eastern Piedmont of Georgia, having a mean
annual temperature of 23C and mean annual rainfall of 123 cm year-1 (Hodler and
Schretter, 1986).
The following is a general description of the geology/mineralogy of three sites
used for this study.
Site 1: Chlorite Schist
An ellipsoid of chlorite-actinolite schist occurs northwest of Shoulderbone Creek in the
Shoulderbone 7.5 minute quadrangle of Hancock County. The ultramafic dike crosses
Georgia Highway 16. Immediately to the northeast, the chlorite-actinolite schist occured
interlayered with biotite-muscovite schist. A thin section described by Vincent et al.
(1990) shows the schist to be composed of medium grained chlorite, actinolite, and
pyroxene that is partially to entirely altered into actinolite. The same thin section revealed

17
a crude alignment of the chlorite grain, suggesting foliation, with very few anthophyllite
grains paralleling the chlorite.
Site 2: Metagabbro
Metagabbro commonly occurs in Greene County, Georgia. Lovingood (1983) and
Conway (1986) mapped metagabbro in the Daniel Springs area. Lovingood was able to
distinguish the mineral assemblages by means of thin sectioning. Plagioclase (An37-42),
hornblende, and epidote/clinozoisite predominated, with biotite, titanomagnetite, sphene,
apatite, pyrite, sericite, and quartz being accessory. In a similar thin section study,
Conway (1986) found that amphibole, plagioclase, epidote/clinozoisite, Mg-chlorite,
opaques, rutile, muscovite/serecite, and trace amounts of quartz and carbonate minerals
comprised the metagabbro. Schroeder et al. (2000) found that the metagabbro contained
44% plagioclase (An40), 40% hornblende, 3% epidote, 6% quartz, 4% biotite, and 3%
ilmenite/titanomagnetite/titantite/rutile/sphene.
Site 3: Mica Schist
Felsic parent materials underlie the Plant Sciences research farm, located on
Oconee County. The Geologic Map of Georgia (1976) showed the northern two-thirds of
the farm located on biotitic gneiss/feldspathic biotite and the southern part of the farm
underlain by amphibolite/mica schist/biotitic gneiss. Preliminary survey of the site
showed the base rock to be mica schist. However, the soil may have been derived from a
combination of these parent materials.

18
Pedon Description and Sampling:
A pit was dug at each site, using a backhoe, to a depth of approximately 1.5 m at
Sites 1 and 2 and 2.2. m at Site 3. Each pedon was described from the pit wall (Appendix
A), using standard terminology (Soil Survey Staff, 1999). Classification of the soils at
the three sites is given in Table 1. Deep saprolite and rock samples were described and
sampled from undisturbed cores taken by hydraulic probe (Sites 1 and 3) or from a
bucket auger (Site 2). Sampling was by horizon. Bulk density and thin section samples
were taken from the pit wall.
Sample Preparation:
Bulk samples were air dried for a period of one week and then crushed with a
wooden roller and passed through a 2mm sieve. The samples were stored in closed and
labeled paper containers until analysis.
Characterization Analysis:
Particle size distribution of the pedons was determined by the pipette and sieve
method (Kilmer and Alexander, 1949). The pH was determined by a 2:1 deionized water
to sample suspension after a 30 minute equilibrium (Soil Survey Staff, 1996). Oven-dry
bulk density was determined by the clod method after equilibration at 90 oC (Soil Survey
Staff, 1996). Exchangeable cations were extracted by a mechanical extractor using 1N pH
7 ammonium acetate (Soil Survey Staff, 1996). Ca, Mg, Na, and K concentrations were
measured by atomic absorption.
Cation exchange capacity was measured by saturating the exchange sites with Na,
using 1N, pH 8.2 sodium acetate. The samples were then washed twice with ethanol to
19
remove any excess sodium. Ammonium acetate was then passed through the samples so
that NH4 replaced the Na on exchange sites. The Na was then measured by atomic
absorption (Soil Survey Staff, 1996).
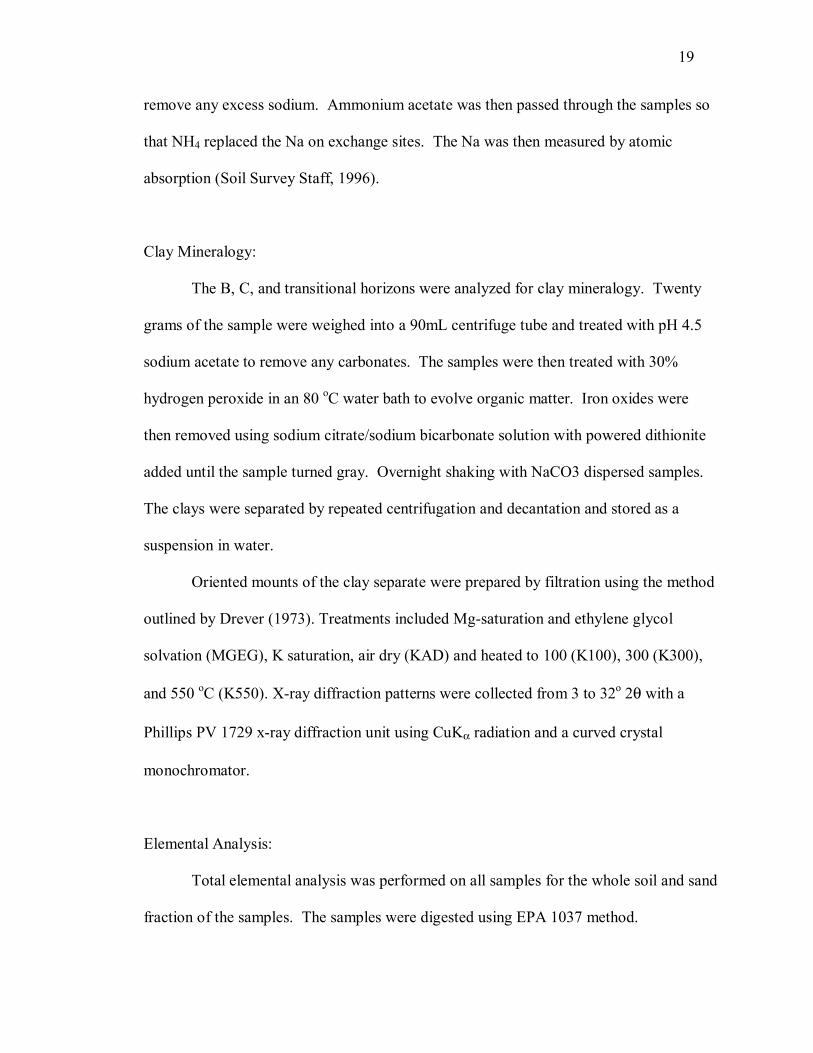
Clay Mineralogy:
The B, C, and transitional horizons were analyzed for clay mineralogy. Twenty
grams of the sample were weighed into a 90mL centrifuge tube and treated with pH 4.5
sodium acetate to remove any carbonates. The samples were then treated with 30%
hydrogen peroxide in an 80 oC water bath to evolve organic matter. Iron oxides were
then removed using sodium citrate/sodium bicarbonate solution with powered dithionite
added until the sample turned gray. Overnight shaking with NaCO3 dispersed samples.
The clays were separated by repeated centrifugation and decantation and stored as a
suspension in water.
Oriented mounts of the clay separate were prepared by filtration using the method
outlined by Drever (1973). Treatments included Mg-saturation and ethylene glycol
solvation (MGEG), K saturation, air dry (KAD) and heated to 100 (K100), 300 (K300),
and 550 oC (K550). X-ray diffraction patterns were collected from 3 to 32o 2θ with a
Phillips PV 1729 x-ray diffraction unit using CuKα radiation and a curved crystal
monochromator.
Elemental Analysis:
Total elemental analysis was performed on all samples for the whole soil and sand
fraction of the samples. The samples were digested using EPA 1037 method.

20
Hydrofluoric acid was used in conjunction with a mixture of hydrochloric acid, sulfuric
acid, and nitric acid to dissolve the solid samples in a microwave. Boric acid was used as
the neutralizing agent. The whole samples were then analyzed by Inductively Coupled
Plasma Mass Spectrometer for Cr, Co, Ni, Cu, Zn, As, Se, Mo, Cd, and Pb and the sand
fraction was analyzed for Ti and Zr.
Reconstruction Analysis:
Because of lithologic and mineralogical zonation in the saprolite, an arithmetic
mean of properties of C and Cr horizons was used as the base horizon for reconstruction
analysis. Total sand fraction Zr re-calculated to a fine earth basis was used as the
immobile constituent for reconstruction. Particle size gains and losses were calculated,
using reconstruction analysis equations (Wang and Arnold, 1973; Brewer, 1976; Smeck
and Wilding, 1980; Stolt et al., 1993) presented below:
Xs = Ds*Ws Xp = VF*Dp*Wp Vs*Ds*Rs = Vp*Dp*Rp VF = Vp/Vs Where:
Ds = bulk density of present-day soil horizon (g 100 cm-3) Dp = bulk density of parent material (g 100 cm-3) Rs = weight concentration of reference constituent in present-day soil (g
100 g-1) Rp = weight concentration of reference constituent in parent material (g
100 g-1) Ws = concentration by weight of mobile constituent in present-day soil (g
100 g-1) Wp = concentration by weight of mobil constituent in parent material (g
100 g-1) Xs = present volume concentration of mobile constituent (g 100 cm-3) Xp = original volume concentration of mobile constituent (g 100 cm-3) Vs = volume of present-day soil (cm3)

21
Vp = volume of parent material (cm 3) VF = volume factor
If VF <1, then less than one unit volume of parent material was necessary to form a
present-day soil horizon, and if VF >1, then more than one unit volume of parent material
was needed. The difference in unit volume (Xs-Xp) indicates a gain (>0) or loss (<0) of
constituent due to pedogenesis.
To estimate total soil gains and losses, the difference per unit volume for each horizon
must be multiplied by the thickness of the horizon:
Σ ((g*100 cm-3) * horizon thickness (cm))
Trace Metal Analysis:
The raw data was analyzed for trends in accumulation and leaching of the minor
elements, Cr, Co, Ni, Cu, Zn, As, Se, Mo, Cd, and Pb. Also, reconstruction based on the
above mathematical theory was applied to the raw data. Trends were examined from
reconstruction procedures.

22
CHAPTER 4
RESULTS AND DISCUSSIONS
Physical Properties:
Although the soils had similar vegetation cover, topography, climate, and soil age,
each soil classified differently because of the difference in parent materials (Table 1).
Ultramafic chlorite schist underlay Site 1, Site 2 was underlain by intermediate mafic
metagabbro, and felsic mica schist underlay Site 3. All three sites were located in
relatively undisturbed areas on the summit hillslope component with slopes ranging from
2% to 4%. Sites 1 and 2 were located in mixed hardwood and pine forests, while Site 3
was located in a field that had not undergone agricultural practices for some time. The
soils were well drained. Ochric epipedons and argillic horizons were common for all
sites.
Clay distribution exhibited similarities between the sites (Figures 1, 2, and 3).
Commonly, the clay increased between A and Bt horizons and reached a peak of around
60% at 50 cm. The clay increase and the identification of clay films in the field indicated
that the soil at all three sites had undergone sufficient pedogensis to form argillic
horizons (Soil Survey Staff, 1999). From the maxima, clay content at all sites decreased
to minimums in C or Cr horizons. At Sites 1 (Figure 1) and Site 2 (Figure 2) the
minimums were 2% and 10%, respectively, and these minimums were reached within 1
m of the soil surface. Sites 1 and 2 had shallower sola than Site 3 because the presence of

23
Table 1: Particle-size data and reconstruction for all three sites. Particle-size distribution Bulk Volume Gain or Loss Horizon Depth sand silt clay Density Factor sand silt clay sum* cm ----------------------%---------------------- g cm-3 ---------g 100 cm-3---------- Site 1; chlorite schist; fine, mixed, superactive, thermic Typic Hapludalf Ap 0-11 60.2 32.3 7.5 1.51 1.9 -197 -19 5 -211AB 11-18 48.9 29.9 21.2 1.67 1.9 -216 -21 29 -208Bt1 18-39 25.3 17.2 57.5 1.50 0.6 -51 5 84 38 Bt2 39-61 49.0 18.3 32.7 1.59 0.6 -15 7 50 42 CB 61-94 68.3 16.0 15.7 1.69 0.8 -15 -4 24 4 Cr1 94-137 76.2 15.1 8.7 2.06 1.3 -39 -15 14 -40 Cr1 137-178 79.1 19.9 1.0 2.01 0.6 64 18 0 82 Cr2 178-229 81.3 17.2 1.5 1.96 Cr2 229-279 80.8 18.1 1.2 1.94 Cr2 279-305 77.3 20.5 2.2 1.92 Cr2 305-381 77.1 20.6 2.3 1.96 Cr3 381-399 83.0 16.1 0.9 1.95 Cr4 399-406 82.5 15.9 1.6 1.96 Cr5 406-414 74.1 23.5 2.3 1.96 Sum A-CB horizons (g 100 cm-2) -5593 -230 3902 -1921 Site 2; metagabbro; fine, mixed, active, thermic Ultic Hapludalf A 0-15 59.3 36.8 3.9 1.51 1.9 -120 -54 -37 -210Bt 15-26 45.6 34.0 20.4 1.64 2.3 -177 -76 -18 -271Btss1 26-42 12.0 25.8 62.1 1.57 1.3 -126 -35 68 -93 Btss2 42-62 15.0 28.0 56.9 1.75 0.9 -71 -2 80 7 Bt' 62-77 23.3 30.6 46.2 1.80 1.0 -64 0 61 -3 BC 77-99 31.5 30.6 37.9 1.81 1.0 -54 -3 46 -11 C 99-115 41.7 32.7 25.6 1.8 0.8 -10 15 29 34 Cr1 115-142 47.7 36.1 16.3 1.87 Cr1 142-188 58.6 32.3 9.1 1.82 Cr2 188-214 67.5 22.4 10.0 1.89 Sum A-CB horizons (g 100 cm-2) -9313 -2296 3857 -7751 Site 3; mica schist; fine, kaolinitic, thermic Typic Hapludult Ap 0-13 58.9 21.7 19.4 1.76 0.4 73 20 31 124 Bt1 13-40 24.7 18.7 56.6 1.43 0.1 28 23 80 131 Bt2 40-68 23.6 18.0 58.3 1.53 0.1 29 23 89 141 Bt3 68-96 23.8 32.0 44.2 1.43 0.2 21 38 62 121 BC1 96-105 37.1 27.5 35.4 1.48 0.5 16 18 49 83 BC2 105-150 48.0 26.0 26.0 1.43 0.6 21 9 33 63 B/C 150-184 60.6 24.7 14.6 1.52 0.7 40 7 17 64 C1 184-204 66.9 23.2 9.9 1.62 0.9 37 -4 9 43 C2 204-234 66.5 25.9 7.6 1.19 0.6 37 6 5 48 C3 234-254 72.4 23.0 4.7 1.38 1.5 -16 -35 -5 -56 C4 254-276 70.7 25.8 3.4 1.34

24
020
4060
8010
0%
par
ticle
siz
e
43210
Depth (m)1
23
45
6S:
Si20
030
040
050
060
070
080
0Ti
:Zr
Sand
Cla
y
Figu
re 1
: Par
ticle
siz
e di
strib
utio
n, S
:Si r
atio
, and
Ti:Z
r rat
io f
or S
ite 1
.
25
020
4060
80%
par
ticle
size
2
1.51
0.50
Depth (m)0
12
34
Sand
:Silt
200
400
600
800
1000
Ti:Z
r
Sand
Clay
Figu
re 2
: Par
ticle
size
dist
ribut
ion,
S:S
i rati
o, a
nd T
i:Zr r
atio
for S
ite 2
.

26
020
4060
80%
par
icle
size
6420Depth (m)
0.5
11.
52
2.5
33.
5Sa
nd:S
ilt40
8012
016
020
024
0Ti
:Zr
Sand
Cla
y
Figu
re 3
: Par
ticle
size,
S:S
i rat
io, a
nd T
i:Zr r
atio
for S
ite 3
.

27
expandable 2:1 clays restricted water movement through the upper horizons and
decreased the depth of weathering.
There was a general decrease in sand with an increase in clay in the upper
horizons and then sand increased with depth. Silt remained constant throughout profiles
of Site 1and Site 2 with a slight increase in the top two surface horizons. Silt generally
increased with depth at Site 3 and was variable throughout the profile. Sand decrease
was the result of sand-sized primary minerals weathering to secondary silt and clay
minerals. An increase in silt was not seen because the silt grains subsequently weathered
to clay minerals.
The depth of weathering was not consistent across the study areas. Soil thickness
for Sites 1, 2, and 3 were 414 cm, 214 cm, and 675 cm, respectively. Site 1 had
approximately 300 cm of saprolite, Site 2 had 100 cm, and Site 3 had 500 cm. Ultramafic
and mafic parent materials, such as in Sites 1 and 2 exhibited the formation of 2:1 and
2:1:1 clay minerals in the argillic horizons and deeper, resulting in restricted water
movement through the profiles and thus, less depth of weathering.
Bulk density (Figure 4) was variable and ranged from approximately 1.5 to 2.0,
and bulk density of parent material was 2.6 g/cm3. At sites 1 and 2, which were described
as having Cr rather than C-horizons, the bulk density was 1.8 to 2.0 in saprolite horizons.
The bulk density in Site 3 was extremely variable and was higher in A and Bt horizon
than in saprolitic C-horizon.

28
11.
21.
41.
61.
82
2.2
Bulk
den
sity
(g/c
m3 )
86420
Depth (m)
Site
1Si
te 2
Site
3
Figu
re 4
: Bul
k de
nsity
mea
sure
men
ts f
or a
ll th
ree
site
s

29
Chemical Properties:
The cation exchange capacity (CEC) was higher in the soils formed over
ultramafic and mafic parent materials than the soil formed over felsic rocks (Figure 5) as
was expected. Sites 1 and 2 had higher charged 2:1 clays present, resulting in more cation
exchange sites for the soils. Although Site 1 had the highest CEC levels of the three
soils, the upper two horizons showed less than 20 cmol kg-1. The CEC increased with
depth to approximately 60 cmol kg-1 in the argillic and then doubled to 100 cmol kg-1 in
the Cr4. It then decreased back to 45 cmol kg-1 in the last Cr horizon before bedrock was
reached.
The upper two horizons of Site 2 exhibited a lower CEC than deeper horizons,
reading less than 10 cmol kg-1. The CEC increased to 20 cmol kg-1 by Bt2, then
decreased to 11.5 in the horizon before the bedrock. The relatively low levels of charge
in the upper horizons of Sites 1 and 2 suggest that these horizons may have had a
different parent material. The CEC for Site 3 was fairly low and variable, ranging from
2.5 to 10 cmol kg-1. All three sites had an increase in CEC in the argillic horizon. CEC
was higher for the ultramafic and mafic sites because higher activity clays were formed
from the primary minerals of the parent rock than from the felsic site, which
predominately forms 1:1 kaolinite.
Base Saturation also followed the general trend of the CEC (Figure 5) for Sites 2
and 3, where base saturation was low in the top two horizons, increased in the Argillic
horizon, and either remained fairly constant with depth or continued to increase with
depth, such as in Site 2 where it reached a maximum of 92% in the horizon overlaying
the parent rock. Site 1 had a fairly constant value of 50 to 60% saturation throughout.

30
020
4060
8010
012
0C
EC (c
mol
/kg)
86420
Depth (m)
020
4060
8010
0%
Bas
e Satu
ratio
n
Site
1Si
te 2
Site
3
Figu
re 5
: CEC
and
base
satu
ratio
n at
all t
hree
sites
.

31
Base saturation was greater in Sites 1 and 2 due to the presence of more base metals in
the bedrock, which were released upon weathering and persisted in the environment. The
felsic parent material of Site 3 had low levels of bases in the mica schist, resulting in a
low base saturation.
The pH values of soils formed over ultramafic and mafic parent materials were
more basic than that formed over felsic rock. Site 1 increased from pH 5 to pH 7 in Cr
horizons. Site 2 increased also from pH 5 at the surface to pH 8 in the saprolite. Site 3
ranged from pH 4 to pH 5.
Clay Mineralogy:
Soils formed from basic parent materials contain more expandable clays than soils
formed from acidic rocks. Mafic and ultramafic parent materials contain higher
concentrations of ferromagnesian minerals than do felsic parent materials. As these
primary minerals weather, the high concentrations of basic cations released favor the
formation and stability of 2:1 and 2:1:1 clays. The 2:1 clays also are expandable, limiting
water movement through the soil which results in less leaching of Si out of the soil
environment and also contributes to the persistence of 2:1 and 2:1:1 clays. Sites 1 and 2,
formed over ultramafic and mafic parent rock, respectively, had an abundance of 2:1:1
and 2:1 clay minerals. Site 3, formed from felsic parent rock, was predominantly made
up of 1:1 clays.
X-ray diffraction data for Site 1, underlain by ultramafic chlorite schist, indicate
the dominant minerals present are vermiculite and smectite with minor amounts of
kaolinite and talc (Figs. 6-8). The sharp 1.4 nm peak with MGEG in all horizons is

32
35
79
1113
1517
1921
2325
2729
31o 2
-thet
a
0
500
1000
1500
2000
2500
Intensity (cps)
Figu
re 6
: Mg-
Ethy
lene
glyc
ol s
atur
ation
XRD
pat
terns
for
Site
1.
Cr5Cr4
Cr3
Cr1
CB
Bt2
Bt1
0.7nm
1.4nm
33
35
79
1113
1517
1921
2325
2729
31o 2
-thet
a
0
200
400
600
800
1000
1200
1400
Intensity (cps)
Figu
re 7
: Hea
t tre
atmen
t XRD
pat
tern
for S
ite 1
- Bt1
.
K55
0
K30
0
K10
0
KA
D
MG
EG
0.7nm
1.4nm

34
35
79
1113
1517
1921
2325
2729
31o 2
-thet
a
0
200
400
600
800
1000
1200
1400
1600
1800
2000
Intensity (cps)
MG
EG
KA
D
K10
0
K30
0
K55
0
Figu
re 8
: XR
D p
atte
rn S
ite 1
- Cr5
.
0.7nm
1.4nm

35
indicative of chlorite or vermiculite, and its sharpness and the presence of a second order
0.7 nm peak suggest chlorite (Fig. 6). However, with K saturation and heat treatment, the
peak collapses and the sharp 0.7 nm peak disappears (Fig. 7 and 8) which is characteristic
of vermiculite rather than chlorite. Incomplete collapse of the 1.4 nm peak with K
saturation and heating in Bt1, Bt2, and CB horizons suggest Al interlayering of the
vermiculite (HIV), but interlayering appears to be minimal in deeper Cr horizons (Figs. 7
and 8).
Smectite is relatively abundant in all horizons, but the amount decreases in
weathered Bt horizons apparently due to dissolution and/or weathering to kaolinite whose
abundance is at a maximum in the Bt horizons (Fig. 6). Smectite abundance in the Cr5
horizon suggests it is an early weathering product in this warm humid environment.
Peaks at 0.93 and 0.47 nm indicate the presence of anthophyllite (Figs. 6, 7, and 8) in all
horizons, and abundance of this mineral decreases in the more weathered Bt1 through
Cr1 horizons.
A peak at 0.83 nm in the Cr1-Cr5 horizons (Fig. 6) is attributed to randomly
interstratification of kaolinite with smectite. This identification is tentative, however. The
peak disappears or broadens to a great degree with K saturation and heat treatments as the
0.7 nm peak disappears. This peak is not present in the Bt1, Bt2, and CB horizons
although a broad shoulder on the 0.7 nm peak is present which is also apparently
randomly-interstratifed kaolinite-smectite. With K heating to 550o C, the shoulder
disappears and only a 1.0 nm peak remains as would be expected for interstratified
smectite-kaolinite.The mineral sequence in this pedon suggests rapid transformation of
chlorite minerals in the bedrock to vermiculite and smectite in Cr horizons. In more
36
weathered Bt horizons, Al interlayering of vermiculite is occurring, and smectite appears
to be weathering to kaolinite although this process is ongoing to a limited extent in
deeper Cr horizons. Under the humid conditions of the Southeast and thus the advanced
state of soil weathering, all minerals are assumed to weather to kaolinite eventually.
Site 2 (Figures 9 and 10), formed from mafic metagabbro, showed an increase in
smectite with depth. The A-horizon had a small 1.4 nm peak, and because of limited
collapse was interpreted as hydroxy-interlayered vermiculite (HIV). Also present in this
horizon was a moderate 0.7 nm kaolinite peak, small 4.85 gibbsite peak, and trace
amounts of quartz. The appearance of smectite began in the Bt horizon with a very small
peak at 1.7 nm, and the gibbsite peak was less expressed. In the Btss2 horizon, the
smectite peak became better expressed. HIV and kaolinite were also still present, and the
gibbsite and quartz peaks entirely disappeared. By the Cr2-horizon, the smectite
dominated the profile and vermiculite was less abundant and appeared to have less
interlayering. Kaolinite was present still in moderate amounts. Kaolinite was present in
the horizons right above bedrock, suggesting a quick transformation from primary
minerals to kaolinite. The primary ferromagnesian minerals in the parent rock,
hornblende and epidote/clinozoisite weathered to form the 2:1 smectites and vermiculites
seen in the pedon. The less weathered deeper horizons better expressed the presence of
2:1 clays. Closer to the soil surface, kaolinite formed from the weathering of 2:1 clays
and plagioclase feldspars became common.

37
35
79
1113
1517
1921
2325
2729
31o 2
-thet
a
0
400
800
1200
1600
2000
Intensity (cps)
Figu
re 9
: Mg-
Ethy
lene
gly
col s
atur
ated
XR
D p
atter
n fo
r Site
2.
Cr2
CBCBts
s2
Bt1
A
0.7nm
1.4nm

38
35
79
1113
1517
1921
2325
2729
31o 2
-thet
a
0
400
800
1200
1600
2000
Intensity (cps)
MG
EG
KA
D
K10
0
K30
0
K55
0
Figu
re 1
0: H
eat t
reat
men
t XR
D p
atte
rn f
or S
ite 2
- Bt.
0.7nm
1.4nm

39
X-ray diffraction patterns for Site 3 (Figures 11 and 12), underlain by felsic mica
schist, were consistent throughout the profile. The domination clay was kaolinite. HIV
was present in moderate amounts, slightly decreasing with depth. The 1.0 nm mica peak
remained present throughout with little variability. The 0.7 nm kaolinite peak dominated
all the horizons with only trace amounts of 0.42 nm diagnostic quartz peaks present. A
minor amount of halloysite was present in the C14-horizon. Felsic primary minerals such
as feldspars and micas altered directly to kaolinite. Halloysite was found in the C14
horizon because of the seasonally saturated conditions.
Parent Material Uniformity:
Reconstruction analysis of soils assumed that the parent materials at each site
were uniform. Sand to silt ratios, particle size distribution, and Ti to Zr ratios were
examined to test this assumption. The data suggested that parent materials were not
uniform throughout the profiles at the sites.
At Site 1, S:Si ratio increases between the Bt1 and Bt2 horizons at 39 cm, reaches
a maximum in the Cr1 horizon at 94 cm, and remains relatively constant in deeper
horizons (Fig. 1). Variations in the S:Si ratio in horizons below 3.5 m are attributed to
lithologic variation in the schistose parent material. The changes in the S:Si ratio in the
soil solum have two possible explanations. Low amounts of sand relative to silt in upper
horizons could be the result of sand loss as it weathers to silt, clay, and soluble products.
In deeper horizons, weathering intensity is lower and less sand weathered and its amount
relative to silt increased. An alternate explanation for the change in the S:Si ratio is that

40
35
79
1113
1517
1921
2325
2729
31o 2
-thet
a
0
400
800
1200
Intensity (cps)
Figu
re 1
1: M
g-Et
hyle
ne g
lyco
l sat
urat
ion
XR
D p
atte
rns
for S
ite 3
.
BC
2
Bt3
Bt1
Ap
0.7nm
1.4nm

41
35
79
1113
1517
1921
2325
2729
31o 2
-thet
a
0
400
800
1200
1600
2000
Intensity (cps)
Figu
re 1
2: H
eat t
reat
men
t XR
D p
atte
rns
for S
ite 3
- Bt1
.
MG
EG
KA
D
K10
0
K30
0
K55
0
0.7nm
1.4nm

42
the upper 3 horizons were derived from a different parent material than lower horizons
and the upper parent material had less sand relative to silt than the lower parent material.
Particle size data cannot be used to confirm or deny either explanation.
A similar trend is seen for the Ti:Zr ratios for Site 1 (Fig. 1). The ratio is low in
the surface horizon, increases to a maximum in the Bt2 horizon, and subsequently
decreases at lower depths. This distribution could be attributed to Ti weathering in
surface horizons and translocation into Bt horizons. However, Ti bearing minerals are not
commonly considered to be weatherable. Thus, these data are interpreted as indicating
that the upper two horizons of this pedon are developed in a different parent material than
the underlying horizons. The variability in the Ti:Zr ratio in Cr horizons was attributed to
mineral zonation of the parent rock.
Site 2 was similar to site one. There was a decrease in the S:Si ratio (Figure 2)
from the A to the Btss1 horizons. Unlike the change in the S:Si ratio at Site 1, this change
is not easily explained by weathering of sand. In upper horizons where weathering
intensity is greatest, the amount of sand relative to silt increases which cannot be
explained by loss of sand through weathering. Thus, this change in the S:Si ratio is
interpreted as indicating the upper two horizons of this pedon have developed in a
different parent material than the underlying horizons. Ti:Zr ratio (Figure 2) for the sand
separate increased abruptly at the same position as the change in the S:Si ratio and then
remained fairly constant with depth, which supports a capping of a second parent material
at this site. Ti-bearing mineral weathering could result in the ratio increase, but the
increase coincided with S:Si ratio decrease and was so abrupt that it was interpreted as a
parent material discontinuity.

43
As in Sites 1 and 2, the S:Si ratio at Site 3 (Figure 3) showed an abrupt decrease
between the Ap and Bt1 horizons suggesting a potential difference in parent material.
However, the Ti:Zr ratio (Figure 3) changed little across this boundary suggesting a
uniform parent material. Both S:Si and Ti:Zr ratios varied considerably in the saprolite,
suggesting lithologic zonation of the schist parent material.
Particle Size Reconstruction:
Two major assumptions were made for the reconstruction process: 1) the parent
material is uniform within a profile and 2) there is a stable base element constituent. As
discussed above, the parent material showed potential unconformities at all three sites.
For Sites 1 and 2, the upper two horizons were noted to be a capping of a different parent
material. Such capping was less clear but remains a possibility for Site 3. In addition to
lithologic discontinuities in near surface horizons, Sites 1 and 3 had considerable
variation in S:Si and Ti:Zr ratios in C and Cr horizons. Thus, it was felt that use of a
single (deepest) C or Cr horizon as the base for reconstruction might result in erroneous
results since the data indicated considerable variations in relatively unweathered C and Cr
horizons. Thus, the mean of C or Cr horizons at each site was used as the base horizon
upon which horizons in the solum were reconstructed.
Analytical results for Zr in the sand fraction were not as good as expected. Compared to
known standards, the recovery of Zr was only 50%. The low recovery was assumed to be
due to incomplete dissolution of Zr bearing minerals in the digestion procedure.
Uncorrected Zr data were used for reconstruction under the assumption that the recovery
rate was consistent for all horizons. Since the Zr bearing minerals are resistant to

44
weathering, this assumption should be valid. Recovery of Ti was near 100%, and Ti was
also used as the immobile constituent for selected reconstruction analysis of clay.
Absolute quantities of clay gained and lost were not the same as those derived from use
of Zr, but overall trends were the same for each pedon.
Site 1 (Table 1 and Figure 13), using the averages of Cr2 through Cr5 as base
values, showed a clay gain in the argillic horizon, with the amount of gain decreasing in
the lower B and C/Cr horizons. Decrease in clay gain in the upper two horizons indicated
the rate of clay formation was less than the rate of clay eluviation and/or dissolution.
However, there was evidence that these horizons were formed from a capping of a second
parent material, thus the gain in clay could be an error from using the bottom Cr horizon
as the base analysis horizon. Sand was lost throughout the profile as it weathered to silt,
clay, and ionic species. Silt showed net loss in the upper, most weathered horizon, but
had little gain or loss in the lower horizons.
Site 2 (Table 1 and Figure 13) was very similar to Site 1. Cr1 and Cr2 horizon
averages were used as base values for analysis. There was a clay loss in the upper two
horizons, but this again could be caused by the parent material difference. Again sand
was lost to weathering throughout the profile, and silt was fairly consistent with little gain
or loss.
For Site 3, Cr4 through Cr13 was averaged for base element, Zr. This site was the
most problematic due to mineral zonation. The results showed a gain in sand, silt, and
clay in most horizons of the profile, which is highly unlikely and probably the result of
zonation. The parent material nonconformity could not be worked around in this case
and caused the reconstruction calculations to be erroneous.

45
-3
00-2
00-1
000
100
Gai
n or
loss
of
sand
, Mg/
100m
3
2.52
1.51
0.50
Depth (m)
Site
1Si
te 2
Site
3
-40
040
8012
0
Gai
n or
loss
of c
lay,
Mg/
100
m3
Figu
re 1
3: G
ains
or l
osse
s of
san
d an
d cl
ay f
or a
ll th
ree
site
s.

46
Evidence showed that two pathways brought about clay gains in the argillic
horizons. Translocation was evident by the net loss of total materials in the upper
horizons and the presence of clay films in the argillic horizon. However, the net loss may
also be due to particle dissolution and the clay films may be the result of micro-
translocation. More than likely, the net loss seen in the upper two horizons was probably
an artifact of the calculations because the upper two horizons were formed from a
different parent material.
The argillic horizons for Sites 1 and 2 (Table 1) had minimal loss or gain of total
material as seen in sums of the horizons, suggesting the loss of sand was balanced by the
formation of clay. The balance of sand and loss and clay gain plus the substantial net
gain in clay in the sola suggests that clay neoformation was the dominant process leading
to clay-rich Bt horizons.
Volume factors for the upper two horizons for Sites 1 and 2 (Table 1) were
approximately two, meaning that it took 2 units of parent material to weather to 1 unit of
soil. However, the upper two horizons have already been shown to be formed in a
capping of a second parent material. The lower horizon volume factors for Site 1 were
mainly under 1, indicating that less than one unit of rock weathered to form 1 unit of soil.
For Site 2, the volume factors were approximately 1, meaning that roughly 1 unit of
parent material was needed to create 1 unit of soil. Again, Site 3 could not be
reconstructed because of the mineral zonation.

47
Trace Metal Abundance:
Percent recoveries based on a standard reference soil exceeded 80% for all metals
studied. Site 1 with a chlorite schist parent material had the highest overall metal
concentrations (all horizons) and Site 3 with a felsic parent material had the lowest (Table
2). Metal concentrations at Site 2 (metagabbro) were intermediate (Table 2). This relative
metal abundance agrees with the expected trend that as the amount of ferromagnesian
minerals in the parent material increased, the content of metals increased.
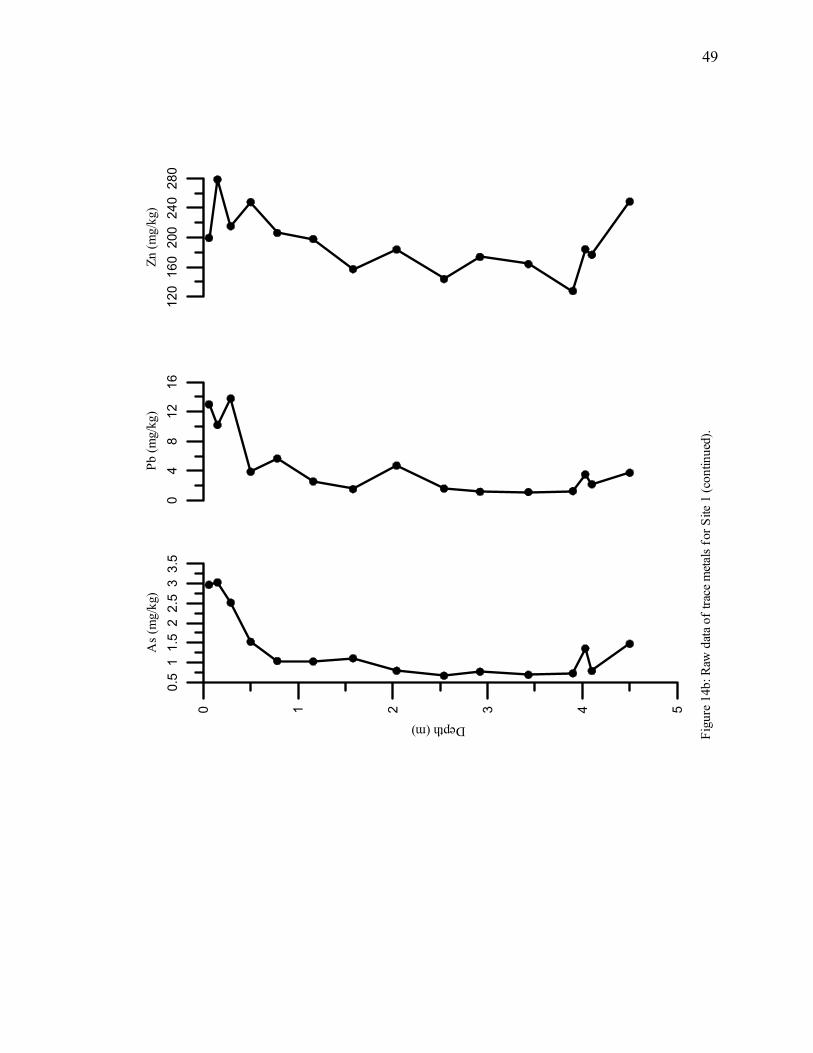
At Site 1, metal concentration of the A-horizon was in general different than
concentrations in underlying horizons (Table 2, Figure 14), which supports the
interpretation that the upper horizons at this site are developed in a capping of a different
parent material. A-horizon concentrations of Cr and Ni were lower than Bt-horizon
concentrations while concentrations of the other metals in the A were either higher than
or similar to those in Bt horizons (Table 2, Figure 14). Concentrations of Cr, Co, and Cu
in Bt horizons were similar to concentrations in Cr horizons. However, Bt horizons
concentrations of Ni, Zn, As, and Pb were higher than concentrations in Cr horizons and
the trend with depth suggests a potential residual concentration of these metals as mobile
constituents are lost as the soil weathers (Table 2; Figure 14).
Table 2: Mean metal concentrations of genetic horizons. Cr Co Ni Cu Zn As Pb Site 1 2 3 1 2 3 1 2 3 1 2 3 1 2 3 1 2 3 1 2 3 Horizon A 526 58 53 153 42 1.9 970 23 13 41 27 11 199 180 32 3.0 3.0 3.9 13 18 13Bt 753 31 67 95 43 3.1 1871 62 27 72 96 27 232 156 78 2.0 2.6 6.3 9 10 22BC 683 16 71 92 45 2.4 1839 62 23 43 97 28 206 155 88 1.0 1.9 3.3 6 6 29C/Cr 745 10 62 88 45 6.7 1372 55 27 160 93 28 167 150 83 0.9 1.3 1.5 2 5 53R 333 -- 36 63 -- 6.9 270 -- 30 11 -- 13 248 -- -- 1.5 -- 0.7 4 -- 23

48
40
080
012
00C
r (m
g/kg
)
543210Depth (m)
4080
120
160
200
Co (m
g/kg
)0
800
1600
2400
Ni (
mg/
kg)
020
040
060
0C
u (m
g/kg
)
Figu
re 1
4a: R
aw d
ata o
f tra
ce m
etals
for s
ite 1
.
49
0.5
11.
52
2.5
33.
5A
s (m
g/kg
)
543210
Depth (m)
04
812
16Pb
(mg/
kg)
120
160
200
240
280
Zn (m
g/kg
)
Figu
re 1
4b: R
aw d
ata o
f tra
ce m
etals
for S
ite 1
(con
tinue
d).

50
If residual concentration was the mechanism by which metal concentration in Bt -
horizons was elevated to levels higher than those in Cr horizons, reconstruction analysis
should indicate that no gain or loss had occurred in the Bt-horizons. Reconstruction for
Ni and Zn indicated that the Bt1-horizon had experienced a loss and the rest of the solum
had no change for these two cations (Figure 15). Thus, elevated concentration of Ni and
Zn in Bt horizons at this site is interpreted as being due to residual concentration of the
cations. The reconstructed loss of Ni and Zn may be due to mixing of the overlying
capping of a second parent material.
In contrast to Ni and Zn, reconstruction of As indicated a net gain in Bt-horizons
(Figure 15). This gain may be the result of As application to the soil surface in agri-
chemicals when the site was in cropland and subsequent translocation to deeper horizons.
Reconstruction of Pb indicated that only the Bt1-horizon had a gain relative to Cr-
horizons (Figure 15). A plausible explanation for a gain in only this horizon is not
available and evaluation of the solum as a whole suggests that elevated Pb in the solum is
also due to residual concentration. Reconstruction of the metals for which Bt- and Cr-
horizons concentrations were similar (Cr, Co, and Cu) indicated that there had been a loss
or little change of these cations in Bt-horizons (Figure 15).
Similar to Site 1, concentrations of most metals in the upper two horizons (A and
Bt) of Site 2 supported the interpretation that these horizons were developed in a capping
of a second parent material (Table 2, Figure 16). Concentrations of Zn in Btss- and B’t-
horizons were similar to those in Cr horizons, and Btss and concentrations of Co were
less than those in Cr horizons (Table 2, Figure 16). Concentrations of Ni, Cu, As, and Pb

51
-0
.04
-0.0
20
Cr (
g/cm
2 )
1.6
1.2
0.8
0.40
Depth (m)
-0.0
04-0
.002
0C
o (g
/cm
2 )-0
.08
-0.0
40
Ni (
g/cm
2 )-0
.02
-0.0
10
Cu
(g/cm
2 )
Figu
re 1
5a: R
econ
stru
ctio
n of
trac
e meta
ls fo
r Site
1.

52
0
2E-0
05A
s (g/
cm2 )
1.6
1.2
0.8
0.40
Depth (m)
00.
0002
Pb (g
/cm
2 )-0
.008
-0.0
040
Zn (g
/cm
2 )
Figu
re 1
5b: R
econ
stru
ctio
n of
trac
e m
etal
s fo
r Site
1 (c
ontin
ued)
.

53
010
2030
4050
60Cr
(mg/
kg)
2.42
1.6
1.2
0.8
0.40
Depth (m)
1020
3040
5060
70C
o (m
g/kg
)20
3040
5060
7080
Ni (
mg/
kg)
4080
120
Cu
(mg/
kg)
Figu
re 1
6a: R
aw d
ata o
f tra
ce m
etals
for s
ite 2
.

54
11.
52
2.5
33.
5A
s (m
g/kg
)
2.42
1.6
1.2
0.8
0.40
Depth (m)
48
1216
20Pb
(mg/
kg)
120
140
160
180
200
Zn (m
g/kg
)
Figu
re 1
6b: R
aw d
ata o
f tra
ce m
etals
for S
ite 2
(con
tinue
d).
55
in Btss- and B’t-horizons were higher than those in Cr-horizons which again suggests that
these elements may have undergone residual concentration as the soil developed.
Reconstruction for Ni and Cu indicated that the Bt-horizon had experienced a loss
and the rest of the solum had no change for these two cations (Figure 17). Thus, elevated
concentration of Ni and Zn in Bt horizons at this site is interpreted as being due to
residual concentration of the cations. In contrast, reconstruction of Cr and As indicated a
net gain in Bt- and Btss-horizons (Figure 17). Reconstruction of Pb indicated that only
the Btss1-horizon had a gain relative to Cr- horizons (Figure 17). As at Site 1, a plausible
explanation for a gain in only this horizon is not available and evaluation of the solum as
a whole suggests that elevated Pb in the solum is also due to residual concentration.
Reconstruction of the metals for which Bt- and Cr-horizons concentrations were similar
or showed a loss in Btss-horizons (Co and Zn) indicated that there had been a loss or little
change of these cations in Bt-horizons (Figure 17).
At Site 3, concentrations of all metals quantified except Co were lower in A-
horizons than in underlying Bt-horizons (Table 2, Figure 18). Low A-horizon
concentrations relative to those of Bt-horizons may be due to movement of the metals
adsorbed to translocated clay. Alternately, the low relative metal concentrations could
suggest a capping of a second parent material. Most of the metal cations had similar or
lower concentrations in Bt-horizons than in C-horizons at this site. The exceptions were
Cr, which was slightly elevated relative to Cr-horizons and As which had concentrations
considerably higher than Cr-horizons. Because of mineral and lithologic zonation and its
confounding effects on reconstruction, no attempt was made to reconstruct the metal

56
0
0.00
040.
0008
Cr (
g/cm
2 )
1.21
0.8
0.6
0.4
0.20
Depth (m)
-0.0
016
-0.0
008
0Co
(g/cm
2 )-0
.002
0N
i (g/
cm2 )
-0.0
040
Cu
(g/c
m2 )
Figu
re 1
7a: R
econ
struc
tion
of tr
ace m
etals
for
Site
2.

57
04E
-005
As
(g/c
m2 )
1.21
0.8
0.6
0.4
0.20
Depth (m)
08E
-005
Pb (g
/cm
2 )-0
.004
-0.0
020
Zn (g
/cm
2 )
Figu
re 1
7b: R
econ
stru
ctio
n of
trac
e met
als f
or S
ite 2
(con
tinue
d).

58
040
8012
0C
r (m
g/kg
)
86420
Depth (m)
010
2030
4050
Co
(mg/
kg)
1020
3040
5060
Ni (
mg/
kg)
010
2030
4050
Cu
(mg/
kg)
Figu
re 1
8a: R
aw d
ata
of tr
ace
met
als
for s
ite 3
.

59
02
46
8A
s (m
g/kg
)
86420
Depth (m)
020
4060
8010
0Pb
(mg/
kg)
-40
040
8012
0160
Zn (m
g/kg
)
Figu
re 1
8b: R
aw d
ata o
f tra
ce m
etals
for S
ite 3
(con
tinue
d).

60
concentrations at this site. The compositional variability with depth at this site is reflected
in high variability of metal concentrations with depth (Fig. 19).
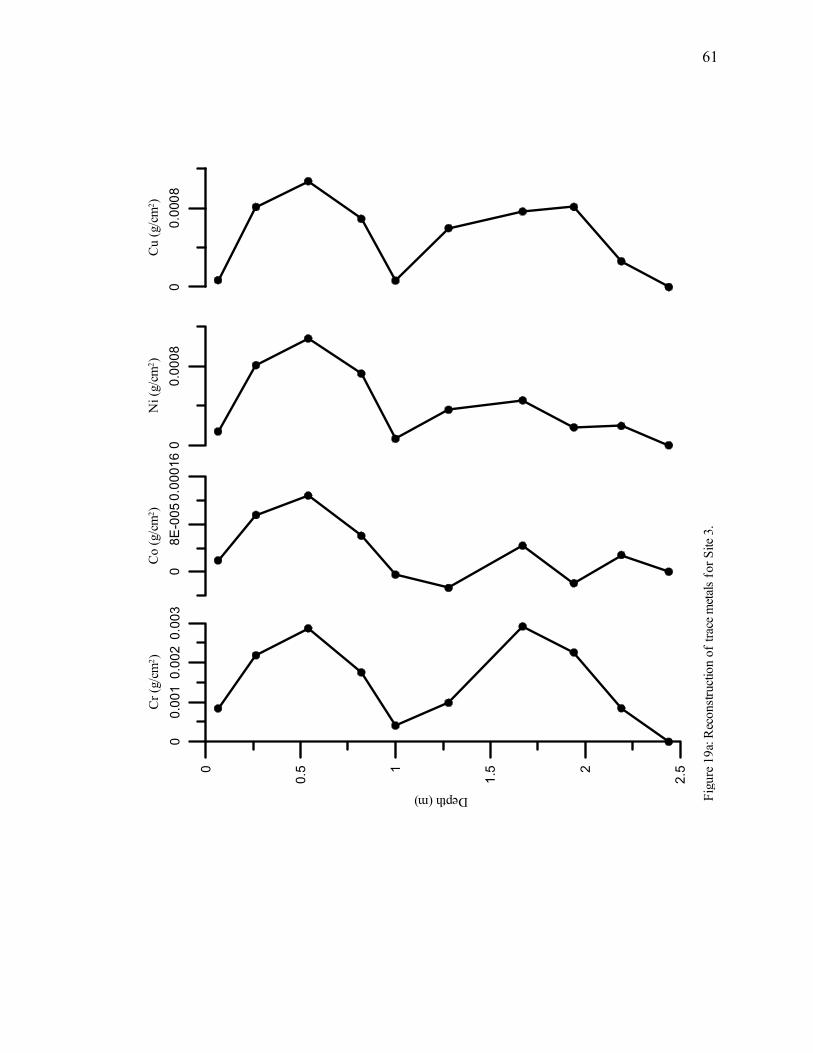
61
00.
001
0.00
20.
003
Cr (
g/cm
2 )
2.52
1.51
0.50
Depth (m)
08E
-005
0.00
016
Co
(g/c
m2 )
00.
0008
Ni (
g/cm
2 )0
0.00
08C
u (g
/cm
2 )
Figu
re 1
9a: R
econ
struc
tion
of tr
ace m
etals
for
Site
3.

62
00.
0002
0.00
04A
s (g/
cm2 )
2.52
1.51
0.50
Depth (m)
-0.0
008
00.
0008
Pb (g
/cm2 )
00.
002
0.00
4Zn
(g/c
m2 )
Figu
re 1
9b: R
econ
stru
ction
of
trace
met
als
for S
ite 3
(con
tinue
d).

63
CHAPTER 5
CONCLUSIONS
Physical and chemical property differences between the three study sites were
mainly contributed to parent material differences. The sites were located within the same
humid climate, on hillslope summits, of roughly the same geologic age, and had the same
vegetation cover. The argillic horizons reached a maximum of 60% clay and depths to
bedrock ranged from 2m to almost 7m. However, the sola for Sites 1 and 2 were thinner
due to the presence of 2:1 expandable clays, which restricted water flow through the
profile and decreased the depth of weathering. CEC and base saturation were higher for
Sites 1 and 2 and very low for Site 3. High CEC was also the result of 2:1 clay presence,
and base element concentration was high in chlorite schist and the metagabbro, causing
more base elements to persist in the soil environment upon rock weathering.
The clay mineralogy of all 3 sites varied greatly. Site 1, underlain by chlorite
schist was predominantly vermiculite in the deep Cr horizons suggesting the parent
material chlorite rapidly weathered to vermiculite. The vermicuite then weathered to
smectite, kaolinite, and interlayered kaolinite/smectite, which persisted throughout the
pedon. The vermiculite became more weathered closer to the surface and kaolinite
became more predominate as was expected in the advanced weathering stages of these
soils. Site 2, underlain by metagabbro also exhibited 2:1 clays. Smectite was present
throughout the profile, increasing with depth. Small amounts of vermiculite and
moderate amounts of kaolinite were also present. Site 3, underlain by felsic mica schist

64
weathered directly to kaolinite. Psuedomorphs of mica-like kaolinite increased with
depth. In the C14 horizon, halloysite was present due to the saturated horizon conditions.
Parent material uniformity was one of the major assumptions used for
reconstruction and thus, was tested for using clay-free S:Si, Ti:Zr, and particle size data.
Sites 1 and 2 had an abrupt change in the S:Si and Ti:Zr for the upper two horizons,
suggesting a capping of a second parent material. Variable Ti:Zr captured the original
zonation of the parent material. Site 3 was extremely variable, suggesting extreme parent
material zonations in the mica schist.
In reconstruction of particle size of sola horizons, the loss of sand was generally
balanced by the gain in clay at Sites 1 and 2. This balance suggests that the major
pathway of clay accumulation in the argillic horizons was by clay neoformation. Clay
films were present in Bt- horizons indicating that clay translocation had also occurred.
However, distance of translocation could not be determined and quantity of translocated
clay was small compared to that neoformed.
Concentrations of many of the trace metals in A-horizons of Sites 1 and 2 were
substantially different than those in Bt- and Btss-horizons. Because in many cases, metal
concentrations were higher in A-horizons than in underlying Bt horizons, the difference
is not attributed to downward movement and is interpreted as supporting a capping of a
second parent material. Metal concentrations that were higher in Bt- than in Cr-horizons
at these two sites were attributed to residual concentration of the metal, as mobile
components were lost during soil development. The only trace metal that consistently
exhibited a gain relative to amounts expected in Bt-horizons after pedogenesis was As.

65
Reasons for this are not clear but may be related to agricultural additions and subsequent
leaching into B-horizons.

66
REFERENCES
Alexander, E.B., C. Adamson, R.C. Graham, and P.J. Zinke. 1990. Mineralogy and classification of soils on serpentinized peridotite of the Trinity Ophiolite, California. Soil Sci. 149:138-43.
Alexander, E.B., and C.L. Ping, and P. Krosse. 1994. Podzolization in ultramafic
materials in Southeast Alaska. Soil Sci. 157:46-52. Bonifacio, E., E. Zanini, V. Boero, and M. Franchini-Angela. 1997. Pedogenesis in a soil
catena on serpentinite in north-western Italy. Geoderma. 75:33-51. Brewer, R. 1976. Fabric and mineral analysis. Krieger Publ., New York. Brimhall, G.H, and W.E. Dietrich. 1986. Constitutive mass balance relations between
chemical composition, volume, density, porosity, and strain in metasomatic hydrochemical systems: Results on weathering and pedogenesis. Geochim. Cosmochim. Acta 51:567-587.
Carpenter, R. H., T.A. Pope, and R.C. Smith. 1975. Fe-Mn coatings in stream sediment
geochemical surveys. J. of Geochem. Exp. 4:349-363. Conway, K.M. 1986. The geology of the northern two-thirds of the Philomathc
Quadrangle, GA. Geology Department, University of Georgia, Athens, GA. Drever, J.E. 1973. The preparartion of oriented clay mineral specimens for X-ray
diffraction anaysis by a filter-membrane technique. Am. Mineral. 58: 553-554. Freitas, H., and H. Mooney. 1996. Effects of water stress and soil texture on the
performance of two Bromus hordeaceus ecotypes from sandstone and serpentine soils. Acta Ecol. 17:307-317.
Ginsburg, I.I., K.N. Mukanov, and N.P. Poluzerov. 1960. Copper and lead in the soils of
the Uspenskew copper deposit of central Kazakhstan. Geochemistry. 4:402-411. Gordon, M., J.I. Travey, and M.W. Ellis. 1958. Geology of the Arkansas bauxite region. U.S. Geol. Surv. Prof. Paper 229:268. Graham, R.C., S.B. Weed, L.H. Bowen, and S.W. Buol. 1989a. Weathering of iron
bearing minerals in soils and saprolite on the North Carolina Blue Ridge Front: I. Sand-size primary minerals. Clays Clay Miner. 37:19-28.
67
Graham, R.C., S.B. Weed, L.H. Bowen, D.D. Amarasiriwardena, and S. W. Buol. 1989b. Weathering of iron-bearing minerals in soils and saprolite on the North Carolina Blue Ridge Front: II. Clay mineralogy. Clays Clay Miner. 37:29-40.
Georgia Geological Survey. 1976. Geologic map of Georgia: Georgia Geologic Survey
Map SM 3. scale 1:500,000. Harris, L.D., and K.C. Byer. 1979. Sequential development of the Appalachian orogen
above a master decollement- a hypothesis. Geology. 7:568-572. Higgins, M. W., R. L Atkins, T. J. Crawford, R. F. Crawford, III, R. Brooks, and R. B.
Cook. 1988. The structure, stratigraphy, tectononstratigraphy, and evolution of the Southernmost Part of the Appalachian Orogen. U.S. Geological Survey Professional Paper 1475, U.S. Government Printing Office, Washington
Hodler, T.W., and H.A. Schretter. 1986. The atlas of Georgia. Institute of Community
Area Development, The University of Georgia, Athens, GA. 273. Hotz, P.E. 1964. Nickeliferous laterites in northwestern California and southwestern
Oregon. Econ. Geol. 59:356-396. Jenny, H. 1941. Factors of soil formation. McGraw-Hill Book Co., Inc., New York. Kilmer, V.J., and L.T. Alexander. 1949. Methods of making mechanical analysis of soils.
Soil Sci. 68:15-24. Kram, P., J. Hruska, B.S. Wenner, C.T. Driscoll, and C.E. Johnson. 1997. The
biogeochemistry of basic cations in two forest catchments with contrasting lithology in the Czech Republic. Biogeochemistry. 37:173-202.
Kretzschmar, R., W.P. Robarge, A. Amoozegar, and M.J. Vepraskas. 1997. Biotite
alteration to halloysite and kaolinite in soil-saprolite profiles developed from mica schist and granite gneiss. Geoderma. 75:155-170.
Lovingood, D. 1983. The geology of the southern one-third of the Philomathc and
northern one third of the Crawfordville, Geofigia Quadrangles. Geology Department, University of Georgia, Athens, GA.
McConnel, K.I., and J.D. Costello. 1984. Basement-cover rock relationships along the
western edge of Blue Ridge Thrust sheet in Georgia. Geol. Soc. Am. Spec. Pap. 194:263-280.
Medina, E., E. Cuevas, J. Figueroa, and A.E. Lugo. 1994. Mineral content of leaves from
trees growing on serpentine soils under contrasting rainfall regimes in Puerto Rico. Plant Soil 158:13-21.

68
Merrits, D.J., O.A. Chadwick, D.M Hendricks, G.H. Brimhall, and C.J. Lewis. 1992. The mass balance of soil evolution on late Quaternary marine terraces, northern California. Geol. Soc. Am. Bull. 104:1456-1470.
Nabais, C., H. Freitas, J. Hagemeyer, and S.W. Breckle. 1996. Radial distribution of Ni
in stemwood of Quercus ilex L. trees grown on serpentine and sand loam (umbirc leptosol) soils of NE-portugal. Plant Soil 183:181-185.
Nance, R.D. 1987. Model for the Precambrian evolution of the Avalon terrane in
southern New Brunswick, Canada. Geology 15:753-756. Norfleet, M.L., and B.R. Smith. 1989. Weathering and Mineralogical classification of
selected soils in the Blue Ridge Mountains of South Carolina. Soil Sci. Soc. Am. J. 53:1771-1778.
Norfleet, M.L., A.D. Karathanasis, and B.R. Smith. 1993. Soil solution composition
relative to mineral distribution in Blue Ridge Mountain Soils. Soil Sci. Soc. Am. J. 57:1375-1380.
Odom, A.L., and P.D. Fullagar. 1984. Rb-Sr whole-rock and inherited zircon ages of the
plutonic suite of the Crossnore Complex, southern Appalachians, and their implications regarding the time of opening of the Iapetus Ocean. Geol. Soc. Am. Spec. Pap. 194:255-280.
Ogg, C.M., and B.R. Smith. 1993. Mineral transformation in Carolina Blue Ridge
piedmont soils weathered from ultramafic rocks. Soil Sci. Soc. Am. J. 57:461-472.
Rast, N. 1989. The Geology of North America Vol. A, The Geology of North America- An overview. The Geological Society of America. Rebertus, R.A., S.B. Weed, and S.W. Buol. 1986. Transformations of biotite to kaolinite
during saprolite- soil weathering. Soil Sci. Soc. Am. J. 50:810-819. Rice, Jr., T.J., S.W. Buol, and S.B. Weed. 1985. Soil-saprolite profiles derived from
mafic rocks in the North Carolina piedmont: I. Chemical, morphological, and mineralogical characteristics and transformations. Soil Sci. Soc. Am. J. 49:171-178.
Robinson, B.H., R.R. Brooks, J.H. Kirkman, P.E.H. Gregg, and H.V. Alvarez. 1997.
Edaphic influences on a New Zealand ultramafic (“serpentine”) flora: A statistical approach. Plant Soil 188:11-20.

69
Schroeder, P.A., N.D. Melear, L.T. West, and D.A. Hamilton. 2000. Meta-gabbro weathering in the Georgia Piedmont, USA: Implication for global silicate weathering rates. Chem. Geol. 163:235-245.
Schroeder, P.A., J.J. LeGolvan, and M.F. Roden. 2002. Weathering of ilmenite from
granite and chlorite schist in the Georgia Piedmont, USA. Submitted to Am. Min. Smeck, N.E., and L.P. Wilding. 1980. Quantitative evaluation of pedon formation in
calcareous glacial deposits in Ohio. Soil Sci. Soc. Am. J. 45:95-102. Soil Survey Staff. 1996. Soil survey laboratory methods manual. Soil Surv. Invest. Rep.
42. USDA_SCS, Natl. Soil Survey Center, Lincoln, NE. Soil Survey Staff. 1999. Soil Taxonomy. A basic system of soil classification for making
and interpreting soil surveys. 2nd Ed. USDA-NRCS. U.S. Government Print. Office, Washington, D.C.
Stolt, M.H., J.C. Baker, and T.W. Simpson. 1992. Characterization and genesis of
saprolite derived from gneissic rocks of Virginia. Soil Sci. Soc. Am. J. 56:531-539.
Stolt, M.H., J.C. Baker, and T.W. Simpson. 1993a. Soil-landscape relationships in
Virginia: I. Soil variability and parent material uniformity. Soil Sci. Soc. Am. J. 57:414-421.
Stolt, M.H., J.C. Baker, and T.W. Simpson. 1993b. Soil-landscape relationships in
Virginia: II. Reconstruction analysis and soil genesis. Soil Sci. Soc. Am. J. 57:422-428.
Suarez, D.L., and D. Langmuir. 1974. Heavy metal relations in soil: Implication to waste
disposal. Geo. Soc. Am. Abs. with Prog. annual meeting (Miami). 976. Tiller, K.G. 1958. The geochemistry of basaltic materials and associated soils of
Southeastern South Australia. J. of Soil Sci. 9:225-241. Tobisch, O.T. and L. Glover III. 1969. Metamorphic changes across part of the Carolina
slate belt- Charlotte belt boundary, North Carolina and Virginia.U.S. Geol. Surv. Prof. Pap. 650-C: 107-109.
Vincent, H. R., K. I. McConnell, and P. C. Perley. 1990. Department of Natural
Resources, Environmental Protection Division, and Georgia Geological Survey, Information Circular 82. Geology of Selected Mafic and Ultramafic Rocks of Georgia: An Overview. Atlanta.
Wang, C., and R.W. Arnold. 1973. Quantifying pedogenesis for soils with
discontinuities. Soil Sci. Soc. Am. Proc. 37:271-278.

70
White, M.L. 1957. The occurrence of zinc in soil. Econ. Geol. 52:645-651. Wysocki, D.A., D.A. Lietzke, and L.W. Zelazny. 1988. Effects of parent material
weathering on chemical and mineralogical properties of selected hapludults in the Virginia Piedmont. Soil Sci. Soc. Am. J. 52:196-203.
Yoshinga, N., K. Yoshiro, and M. Nakai. 1989. Mineralogy of red- and yellow-colored
soils from Thailand. Soil Sci. Plant Nutr. 35:181-206. Zeissink, H.E. 1971. Trace element behavior in two nickeliferous laterite profiles. Chem. Geol. 7:25-36.

71
Appendix A
Site 1
Location: Intersection Georgia Highway 16 and Veazy Road just northwest of Shoulder
Bone Creek in Hancock County Vegetation: Mixed hardwoods and pine Slope: 5% Landform: Piedmont Geomorphic surface: Upland Hillslope component: Summit Parent material: Chlorite-actinolite
schist
Described by: Bob Evon, Rick Joslyn, Larry West, Dixie Wood, and Spring 1998 University of Georgia soil mineralogy class
Horizon Depth (cm) Soil Description (colors for moist soil unless stated) Ap 0-11 Very dark grayish brown (10YR3/2) loamy sand; moderate
fine granular; friable; abrupt clear boundary. AB 11-18 Yellowish brown (10YR5/4) sandy loam; moderate fine
granular; very friable; clear smooth boundary. Bt1 18-39 Strong brown (7.5YR5/6) sandy clay loam; moderate
medium subangular blocky; friable; clear smooth boundary. Bt2 39-61 Strong brown (7.5YR5/6) sandy clay loam; moderate
medium subangular blocky; friable; clear smooth boundary.
CB 61-94 Yellowish brown (10YR5/8) and dark yellowish brown (10YR4/6) sandy clay loam; weak platy; friable; clear smooth boundary.
Cr1 94-178 Weathered chlorite schist; clear smooth boundary. Cr2 178-381 Weathered chlorite schist; clear boundary. Cr3 381-399 Weathered chlorite schist; clear boundary.
72
Cr4 399-406 Weathered chlorite schist; clear boundary. Cr5 406-414 Weathered chlorite schist; clear boundary. R 414-416+ Chlorite schist
Site 2 Location: Approximately 1 mile N on Bethesda Rd. of the intersection of Bethesda Rd.
and State Rd. 44 in Greene County Vegetation: Mixed hardwoods and pine Slope: 3% Landform: Piedmont Geomorphic surface: Upland Hillslope component: Summit Parent material: Metagabbro
Described by: Bob Evon, Jennifer Treadway, Larry West, Dixie Wood, and Spring 2000 University of Georgia soil mineralogy class
Horizon Depth (cm) Soil Description (colors for moist soil unless stated) A 0-15 Very dark grayish brown (10YR3/2) sandy loam; moderate
fine granular; friable; 1% quartz fragments; clear smooth boundary.
Bt 15-26 Yellowish red (5YR5/8) clay; common thin strong brown
(7.5YR4/6) clay films; moderate medium subangular blocky; friable; clear smooth boundary.
Btss1 26-42 Yellowish red (5YR5/8) clay; few fine red (2.5YR4/8)
concentrations, few fine brown (7.5YR4/2) depletions; common thin yellowish red (5YR4/6) clay films; weak medium subangular blocky; friable; few pressure faces; clear smooth boundary.
Btss2 42-62 Strong brown (7.5YR5/8) clay; many fine pink (5YR7/3)
depletions; common thins yellowish red (5YR4/6) clay films; weak medium subangular blocky; friable; common pressure faces; clear smooth boundary.
Bt’ 62-77 Strong brown (7.5YR4/6) clay; many fine brown (7.5YR5/2) depletions; moderate medium prismatic; friable; abrupt smooth boundary.

73
BC 77-99 Dark yellowish brown (10YR4/6) clay; common fine pink
(5YR7/3) concentrations; few fine strong brown (7.5YR5/8) concentrations; few fine yellow (10YR7/8) concentrations; few fine white (10YR8/1) depletions; weak platy; friable; clear smooth boundary.
C 99-115 Yellow (10YR7/8) loam; few fine yellowish red (5YR4/6)
concentrations; common fine white (10YR8/1) depletions; few fine black (5Y2.5/1) depletions; few thin very dark grayish brown (10R3/2) clay films; massive; clear boundary.
Cr1 115-188 Weathered metagabbro. Cr2 188-214+ Weathered metagabbro.
Site 3 Location: University of Georgia, Plant Sciences Farm, Oconee County, Intersection of
Georgia Highway 53 and Hog Mountain Road. Vegetation: Grass Slope: 6% Landform: Piedmont Geomorphic surface: Upland Hillslope component: Summit Parent material: Mica schist
Described by: Larry West and Dixie Wood Horizon Depth (cm) Soil Description (colors for moist soil unless stated) Ap 0-13 Yellowish red (5YR4/6) sandy loam; weak coarse
subangular blocky; very friable; common fine roots; abrupt smooth boundary.
Bt1 13-40 Red (2.5YR4/6) clay; common thin faint red (2.5YR4/6)
clay films on ped faces; weak coarse prismatic parting to moderate subangular blocky; friable; common very fine roots; many very fine pores; clear smooth bondary. Bt2 40-68 Red (2.5YR4/6) clay loam; common thin faint red
(2.5YR4/6) clay films on ped faces; moderate fine
74
subangular blocky; friable; common very fine roots; many very fine pores; gradual smooth boundary.
Bt3 68-96 Red (2.5YR4/6) clay loam; few medium yellow (10YR7/8)
depletions; few thin faint red (2.5YR4/6) clay films on ped faces; moderate medium angular blocky and subangular blocky; friable; few very fine roots; few very fine pores; 1% 30mm rock fragments; few mica flakes; clear smooth boundary.
BC1 96-105 Red (2.5YR4/6) clay loam; few medium yellow (10YR7/8)
depletions; few thin faint red (2.5YR4/6) clay films on ped faces; moderate medium subangular blocky; friable; common mica flakes; few 2 cm thick horizontal quartzite veins; few 5mm thick horizontal discontinuous veins of mica schist; clear smooth boundary.
BC2 105-150 Red (2.5YR4/6) loam; few reddish yellow (7.5YR7/8)
depletions; very few dark brown (7.5YR3/2) depletions; few thin faint red (2.5YR4/6) clay films on ped surfaces; weak medium prismatic parting to moderate medium subangular blocky; friable; few very fine pores; many mica flakes; few medium white (10YR8/1) packets of kaolinite; clear smooth bondary.
B/C 150-184 Red (2.5YR4/6) loam; few thin color red (2.5YR4/6)
clay films on ped faces; weak fine platy parting to weak medium subangular blocky; few very fine pores; many mica flakes; 40% weathered schist fragments red (10R4/6), reddish yellow (7.5YR6/8), dark brown (7.5YR3/2), dark red (10R3/6), and yellow (10YR7/8) inclined 10 degrees from horizontal; few medium lenses of weathered quartzite; clear smooth boundary.
C1 184-204 Red (10R4/6), reddish yellow (7.5YR6/8), dark brown
(7.5YR3/2), dark red (10R3/6), and yellow (10YR7/8) weathered schist; few fine color white(10YR8/1) pockets of kaolinite; weak fine platy; friable; abrubt boundary.
C2 204-234 Red (10R4/6); 2% dark reddish brown (5YR3/2) and 2%
brownish yellow (10YR6/8) weathered schist; lenses of white (10YR8/1) kaolinite; weak fine platy; abrupt smooth boundary.
C3 234-254 Dark red (10R3/6); 20% yellow (10YR7/8) and 2% dark

75
brown (7.5YR3/2) weathered schist; many quartzite lenses; weak fine platy; abrupt smooth boundary.
C4 254-276 Reddish yellow (7.5YR6/6) and red (10R4/6) weathered
schist; common white (10YR8/1) kaolinite; common pockets of black manganese staining; massive; abrupt smooth.
C5 276-293 Yellowish brown (10YR5/6) weathered schist; few fine red
(2.5YR4/6); few white (10YR8/1) kaolinite; massive; clear smooth boundary.
C6 293-324 Red (2.5YR4/6) weathered schist; few fine yellowish
brown (10YR5/6); few white (10YR8/1) kaolinite; massive; clear smooth boundary.
C7 324-357 Red (2.5YR4/6) and yellowish brown (10YR5/6)
weathered schist; few white (10YR8/1) kaolinite; massive; clear smooth boundary.
C8 357-410 Red (2.5YR4/6) with 20% yellowish brown (10YR5/6)
weathered schist; few white (10YR8/1) kaolinite; few 5mm black manganese streaks; massive; clear boundary.
C9 410-456 Red (10R4/6) weathered schist; common white (10YR8/1) kaolinite; few quartizite lenses; few weathered 5mm black
grains with yellowish brown (10YR5/6) and then red (10R4/6) halo; clear boundary.
C10 456-564 Red (10R4/6) and yellowish brown (10YR5/6) weathered
schist; common white (10YR8/1) kaolinite; few quartzite lenses; clear boundary.
C11 564-601 Red (10R4/6) weathered schist; few yellowish brown
(10YR5/6); common white (10YR8/1) kaolinite; few quartzite; few black manganese staining; clear boundary.
C12 601-650 Red (10R4/6) and yellowish brown (10YR5/6) weathered
schist; common white (10YR8/1) kaolinite; few quartzite lenses; clear boundary.
C13 650-675 Red (10R4/6) weathered schist; few yellowish
brown (10YR5/6); common white (10YR8/1) kaolinite; few quartzite; 40% black manganese staining; clear boundary.
C14 675-680 White (10YR8/1) kaolinite; few light red (10R6/6); few

76
quartzite fragments; clear boundary. R 680-682+ Mica schist