Embed Size (px)
Citation preview

BORON DYNAMICS IN VOLCANIC ASH-DERIVED SOILS FROM THE PACIFIC
COASTAL PLAIN OF GUATEMALA
by
MARIA FERNANDA TERRAZA PIRA
(Under the Direction of Malcolm Sumner and Miguel L. Cabrera)
ABSTRACT
Boron (B) is an essential trace element for plants and animals, and its range
between deficiency and toxicity is the narrowest among all the micronutrients in soils.
Volcanic ash-derived soils naturally have low B contents, and crops growing in these
regions suffer severe symptoms of B deficiency that compromise their yields and quality.
B availability in soils is governed by adsorption and desorption reactions on mineral and
organic functional groups, and a deep understanding of the surface chemistry of these
components is essential to successfully managing this nutrient at the field scale. The
purpose of this study was to understand the physicochemical reactions of B with soils
from the Pacific coastal plain of Guatemala so that recommendations for economically
important crops in the region could be improved. An organomineral characterization of a
set of 23 soils belonging to five different soil orders revealed B is adsorption is
controlled by amorphous aluminosilicates (allophane and imogolite), Fe
oxy(hydroxydes), 1:1 clay minerals, and recalcitrant fractions of organic matter. The
maximum B adsorption capacities for these soils — that are geographically close but
differ greatly in their chemical properties — were obtained from Langmuir isotherms of

the data and varied from 3 to 130 mg B kg-1
; with the degree of reversibility of the
adsorption reactions depending on the andic character of the soil. Because the andic
character of a soil can be estimated by a measurement of pH in a sodium fluoride (NaF)
suspension, this test is tentatively proposed for predicting the potential of a soil to fix B.
An estimation method to calculate appropriate field B rates for highly fixing soils based
on adsorption equilibria is proposed. When these estimated B rates were applied in the
field, deficient soil levels were improved and maintained in sufficiency ranges without
causing toxicity during the elongation stage of sugarcane, which was the response crop
model used to test the rates in two commercial farms in Guatemala. The increased plant
absorption and improved yields demonstrate that the correct management of B has good
potential to positively impact agricultural productions in Central America and other
volcanic regions in the world.
INDEX WORDS: micronutrients, boron adsorption, boron desorption, hysteresis,
andic character, allophane, imogolite, organic matter thermal
stability, volcanic ash-derived soils, boron rates, boron fixation,
boron availability, plant response

BORON DYNAMICS IN VOLCANIC ASH-DERIVED SOILS FROM THE PACIFIC
COASTAL PLAIN OF GUATEMALA
by
MARIA FERNANDA TERRAZA PIRA
Ch.E., Universidad de San Carlos de Guatemala, Guatemala, 2013
A Dissertation Submitted to the Graduate Faculty of The University of Georgia in Partial
Fulfillment of the Requirements for the Degree
DOCTOR OF PHILOSOPHY
ATHENS, GEORGIA
2017

© 2017
Maria Fernanda Terraza Pira
All Rights Reserved

BORON DYNAMICS IN VOLCANIC ASH-DERIVED SOILS FROM THE PACIFIC
COASTAL PLAIN OF GUATEMALA
by
MARIA FERNANDA TERRAZA PIRA
Major Professor: Miguel L. Cabrera
Committee: Malcolm E. Sumner
Aaron Thompson
David E. Radcliffe
Mussie Y. Habteselassie
Anish Malladi
Electronic Version Approved:
Suzanne Barbour
Dean of the Graduate School
The University of Georgia
May 2017

iv
DEDICATION
To God, by whose infinite love and through the inspiration of St. Francis of
Assisi, makes me discover how to contribute with joy to the commitment of caring for
creation. “Through the greatness and the beauty of creatures one comes to know by
analogy their maker” (Wis 13: 5)
To my family, the pillars that supported me with love and accompaniment in the
development and completion of this stage of life
To my mentor, friend, and role model: Malcolm Sumner; for allowing me to give
continuity to the legacy of his career
To the memory of Ana María de Pira, RIP

v
ACKNOWLEDGEMENTS
I express deep gratitude to my mentor, Malcolm Sumner, and the members of my
committee: Miguel Cabrera, Aaron Thompson, David Radcliffe, Mussie Habteselassie,
Anish Malladi, and Alain Plante; to the Nordic team, especially to Juan Leal and Gerardo
Leal; to the Research Department of IMSA, Guatemala; and to my international graduate
students friends and peers at UGA.

vi
TABLE OF CONTENTS
Page
ACKNOWLEDGEMENTS .................................................................................................v
LIST OF TABLES ............................................................................................................. ix
LIST OF FIGURES ........................................................................................................... xi
CHAPTER
1 INTRODUCTION AND LITERATURE REVIEW ........................................1
1.1 Boron chemistry in soils ........................................................................4
1.2 Volcanic ash-derived soils .....................................................................8
1.3 Questions of study and objectives ........................................................10
References ..................................................................................................13
2 BORON ADSORPTION AND DESORPTION ON VOLCANIC ASH-
DERIVED SOILS ............................................................................................18
2.1Abstract .................................................................................................19
2.2 Introduction ..........................................................................................20
2.3 Materials and methods .........................................................................24
2.4 Results and discussion .........................................................................28
2.5 Conclusions ..........................................................................................35
References ..................................................................................................36

vii
3 MINERAL CHARACTERISTICS OF VOLCANIC ASH-DERIVED SOILS
AFFECTING BORON ADSORPTION .........................................................55
3.1 Abstract ................................................................................................56
3.2 Introduction ..........................................................................................57
3.3 Materials and methods .........................................................................59
3.3 Results and discussion .........................................................................62
3.4 Conclusions ..........................................................................................73
References ..................................................................................................74
4 EFFECTS OF ORGANO-MINERAL PROPERTIES OF VOLCANIC ASH-
DERIVED SOILS ON BORON ADSORPTION ............................................90
4.1 Abstract ................................................................................................91
4.2 Introduction ..........................................................................................92
4.3 Materials and methods .........................................................................94
4.4 Results and discussion .........................................................................96
4.5 Conclusions ........................................................................................100
References ................................................................................................101
5 ESTIMATION OF BORON RATES BASED ON ADSORPTION
EQUILIBRIUM FOR HIGHLY FIXING SOILS .........................................115
5.1 Abstract ..............................................................................................116
5.2 Introduction ........................................................................................117

viii
5.3 Materials and methods .......................................................................119
5.4 Results and discussion .......................................................................122
5.5 Conclusions ........................................................................................126
References ................................................................................................127
CONCLUSIONS..............................................................................................................138

ix
LIST OF TABLES
Page
Table 2.1: Selected properties of the 25 volcanic ash soils and 5 non-volcanic soils used
for comparison .......................................................................................................41
Table 2.2: Langmuir isotherm parameters for the soils studied .........................................43
Table 2.3: Simple regression equations relating bB and SSA for 25 volcanic ash-derived
soils ....................................................................................................................44
Table 2.4: Multiple linear regression models relating SSA with soil properties ...............45
Table 2.5: Regression analysis between selected variables and bB for 25 volcanic ash-
derived soils ...........................................................................................................46
Table 3.1: Selected soil characteristics of the agricultural sites sampled (from Terraza
Pira et al., 2017) .....................................................................................................80
Table 3.2: Soil mineral characteristics ...............................................................................81
Table 3.3: Thermal analysis interpretation for mineral clay fraction ................................82
Table 3.4: Mösbauer spectroscopy Iron (Fe) phase identification and crystallinity index
(CI) ....................................................................................................................84
Table 3.5: Mösbauer spectroscopy temperature of ordination of short-range-order (SRO)
Fe phases ................................................................................................................85
Table 3.6: Correlation coefficients between clay surface properties and kaolinite de-
hydroxylation temperature .....................................................................................86
Table 4.1: Soil organic matter fractionation based on thermal resistance .......................105

x
Table 4.2: Centroid parameter values for cluster analysis ...............................................106
Table 5.1: Selected physical and chemical properties of soils from the
experimental sites.................................................................................................131
Table 5.2: Estimated boron rates (EBR) based on adsorption equilibrium .....................132
Table 5.3: Soil B availability 3 and 6 months after application .......................................133
Table 5.4: Foliar B contents for sugarcane 6 months after planting ................................134
Table 5.5: Sugarcane yields for different boron rates at site 1 (Buganvilia) ...................135
Table 5.6: Sugarcane yields for different boron rates in site 2 (Velasquez) ....................136
xi
LIST OF FIGURES
Page
Figure 1.1: Dissociation of boric acid ..................................................................................4
Figure 2.1: Boron adsorbed as a function of solution B concentration for surface soils:
(A) Socorro and (B) San Patricio. Adsorption data are indicated by squares with
the solid line representing the Langmuir adsorption isotherm...............................47
Figure 2.2: Comparison of B adsorption isotherms for the volcanic surface soil El
Mirador (A) and the non-volcanic surface soil El Rama (B). Solid lines represent
Langmuir equation fit for the two soils, circles represent adsorption data. Both
soils have clay contents of 401 g kg-1
....................................................................48
Figure 2.3: Relationship between pH in NaF and acid-oxalate extractable Al which
approximates the abundance of allophane in the Guatemalan volcanic ash-derived
soils ....................................................................................................................49
Figure 2.4: Adsorption-desorption isotherm for the volcanic ash-derived surface soil El
Mirador showing strong hysteresis ........................................................................50
Figure 2.5: Relationship between pH in NaF and B desorption index (DI). DI = ndes/nads,
where ndes and nads are the slopes of the linearized desorption and adsorption
isotherms, respectively ...........................................................................................51
Figure 2.6: Relationship between pH in NaF and amount of B adsorbed at equilibrium
with 1.0 mg B L-1
in solution. Black circles represent soils from central Escuintla;
white circles represent soils from eastern and western Escuintla, Suchitepéquez,

xii
Retalhuleu and Santa Rosa. Dotted lines correspond to 95% confidence band
(CB), dashed lines correspond to 95% prediction bands (PB). CB refers to the
probability that the true best-fit line for the population lies within the interval. PB
refers to the probability that the value of the dependent variable for a given value
of the independent variable will be found within the interval range around the
linear regression line ..............................................................................................52
Figure 2.7: Ability of linear models to predict B adsorbed at equilibrium with 1.0 mg B L-
1 in solution using pH in NaF as a single variable. Black circles represent initial
set of soils; white circles represent independent samples to test prediction. Dotted
lines correspond to 95% confidence band (CB), dashed lines correspond to 95%
prediction bands (PB). CB refers to the probability that the true best-fit line for
the population lies within the interval. PB refers to the probability that the value
of the dependent variable for a given value of the independent variable will be
found within the interval range around the linear regression line. Top figure (7a)
corresponds to soils from central Escuintla; bottom figure (7b) corresponds to
soils from eastern and western Escuintla, Suchitepéquez, Retalhuleu and Santa
Rosa ....................................................................................................................53
Figure 3.1: Allophane/imogolite content as a function of the pyrophosphate/oxalate
extractable-Al ratio, Alp/Alo ...................................................................................87
Figure 3.2: Water evolution (top) modeled as the sum of hidden peaks as a function of
temperature and DSC curve (bottom) for Andisol, Puyumate ...............................88

xiii
Figure 3.3: Exponential correlation between percent water loss as evolved water
estimated from peak modeling and DSC and content of SRO aluminosilicates in
clay fraction calculated from selective dissolutions ..............................................89
Figure 4.1: Linear correlation of soil organic matter (SOM) with (a) specific surface area
(SSA) and (b) B maximum adsorption capacity (bB). Both are statistically
significant at p = 0.05 ..........................................................................................107
Figure 4.2: Standardized coefficients of multiple linear regressions of specific surface
area (SSA) and B maximum adsorption capacity (bB) as dependent variables, and
soil organic matter (SOM) and allophane and imogolite content as explanatory
variables. Bars represent 95% confidence intervals ............................................108
Figure 4.3: Exponential decay of clay specific surface area (SSA) as a function of
C:allophane ratio ..................................................................................................109
Figure 4.4: CO2 evolution during organic matter thermal oxidation and peak modeling for
soils from site Socorro (R2 = 0.9992) ..................................................................110
Figure 4.5: Agglomerative Hierarchical Clustering (AHC) dendrogram illustrating three
clusters based on organomineral characteristics. Numbers on y axis correspond to
the soil number, followed by a letter indicating soil order: Andisols (A),
Mollisols (M), Entisols (E), Vertisols (V), and Alfisol (F) .................................111
Figure 4.6: Correlation loading plot for factors one and two. Red lines correspond to
explanatory variables (X) and blue empty circles correspond to dependent
variables (Y).........................................................................................................112

xiv
Figure 4.7: Correlation loading plot for factors one and two. Red dots correspond to
explanatory variables (X), blue circles to dependent variables (Y), and green
squares to soil samples belonging to clusters 1, 2, and 3 .....................................113
Figure 4.8: PLS Standardized coefficients for specific surface area (SSA) and B
maximum adsorption capacity (bB). Bars correspond to 95% confidence
intervals ................................................................................................................114
Figure 5.1: Increase in soil B availability (Delta B) after application of boron rates (EBR)
estimated from B adsorption equilibria. Delta B calculated as the difference
between each treatment and the control plot ........................................................137
1
CHAPTER 1
INTRODUCTION AND LITERATURE REVIEW
Boron (B) is an essential micronutrient or trace element because it is required in very
small amounts relative to other plant nutrients to promote health and yield of numerous
crops. According to Gupta (1993), B deficiency is the most widespread of all the known
essential trace elements over a wide range of plant species throughout the world;
consequently, crops on B-deficient soils cannot reach their full yield and quality
potentials. Since its discovery as an essential trace element in the early twentieth century,
the study of B chemistry in agriculture has grown rapidly (Shorrocks, 1997).
The range between toxic and adequate B concentrations in soil and plant systems is
narrower than for any other nutrient element (Goldberg, 1993). For the majority of plant
systems the only effective way B can be acquired is from the soil solution through the
roots, as it is generally not mobile in phloem vascular tissue (with few exceptions) and it
is not readily translocated from older to younger plant tissues. Consequently, foliar
applications of B only meet the requirements of the tissue to which they are applied,
frequently causing B starvation in other parts of the plant. For instance, when banana
plants that were deficient in B were sprayed with B solutions of various concentrations,
this resulted in leaf toxicity and no improvement in B deficiency symptoms, such as
rosetting of the stem and “witches broom” in the roots (M. Avila, personal
communication, 2013). Parent rock, its weathering products, and soil organic matter are

2
the primary sources of B for plants, while chemical fertilizers (boric acid and borate salts)
are the most common sources of B used to control deficiencies in crops (Gupta, 1993).
High B concentrations in irrigation water can cause B toxicity, particularly, in arid and
semi-arid regions (Goldberg et al., 2005).
Primary cell wall structure and membrane function are closely linked to adequate B
nutrition; but its role in plant metabolic reactions is still a subject of considerable debate
(Ganie et al., 2013). Many of the postulated metabolic roles of B in higher plant growth
and development are considered secondary effects of the primary structural role of B as a
component of the (RGII) fraction of cell wall pectin (Bonilla et al., 2009).
Evidence of rapid changes in membrane functions (e.g., phosphorus (P) uptake,
proton release, and enzymatic reactions) induced by B deficiencies might support
metabolic functions of B beyond its structural role as a cell wall stabilizer. Evidence
exists to show that B is a critical component in the formation of the plasma membrane in
pollen tubes (Jackson, 1989), and that organogenesis is affected by B deficiency as B
complexes are implicated in cell-to-cell signaling (Bonilla et al., 2009). For instance, the
symbiotic interaction between leguminous plants and rhizobia that triggers the
development of root nodules is a specific organogenesis process regulated by molecular
plant-bacterium interactions that are negatively impacted under B deficient conditions
(Bolaños et al., 1996; Stougaard, 2000; Brewin, 2004).
Because the range between toxic and deficient B levels in soils and plants is very
narrow, both excessive and deficient levels can be encountered in a crop during a single
season (Reisenauer et al., 1973). M. Avila (personal communication, 2013) found that
zones of deficiency and toxicity could occur on the same leaf after foliar applications of

3
B highlighting the immobility of B in plants. The levels of deficiency, sufficiency, and
toxicity for different crops vary depending upon plant part and tissue age under
consideration. For instance, the whole above-ground part of alfalfa is considered to be B
deficient when B concentrations are less than 15 mg B kg-1
(dry matter basis) and toxic
above 200 mg B kg-1
at the early bloom stage, whereas the top one third of the plant
shortly before flowering is considered to be B deficient at less than 20 mg B kg-1
and
toxic above 100 mg B kg-1
(Gupta, 1993). Regardless of the crop, symptoms of B
deficiency generally appear first in younger tissues and toxicity in older tissue, because of
the characteristic immobility of B in plants.
Mortvedt and Woodruff (1993) present details of US state recommendations for B
applications to various crops. For crops with high B requirements, such as alfalfa and
cabbage, recommended soil-application rates range up to 4.5 kg B ha-1
; while for those
crops with medium B requirements, such as cotton and tomato, the range lies between 0.2
and 2.2 kg B ha-1
; and for crops with low B requirements, such as beans and grasses the
rates are about 0.5 kg B ha-1
. Most recommended B rates and methods of application
have not changed significantly during the past several decades in the United States
(Mortvedt and Woodruff, 1993) because B leaching from the root zone and, to a lesser
extent, crop removal are the main pathways responsible for compromising B availability
to crops. Without any testing, these recommended rates have been adopted in other
regions of the world where soil conditions are very dissimilar. In soils containing
minerals with large surface areas, such as iron and aluminum oxides and hydroxides and
amorphous aluminosilicates such as allophane and imogolite the main problem limiting B
availability is not leaching but probably B fixation by surface complexation reactions; as

4
a result in many cases these US based rates are too low and fail to solve deficiency
problems. Hence, the physicochemical reactions between B and soil surfaces need to be
studied to fully understand which factors govern the availability of this essential and
frequently deficient element.
1.1 Boron chemistry in soils
In aqueous solution, B does not form B+3
cations because it has a high ionization
potential resulting in the formation of covalent rather than ionic bonds with oxygen
(Cotton and Wilkinson, 1980). Boric acid is a neutral planar molecule that behaves as a
very weak Lewis acid by accepting a hydroxyl ion to form the tetrahedral borate anion
(figure 1.1). The equilibrium constant for the hydrolysis reaction of boric acid is 5.75 x
10-10
(pK = 9.24) (Bassett, 1980). Under relatively low concentrations (≤ 0.025 mol B L-
1) only mononuclear B species are present while at higher concentrations stable
polymeric ions exist with rapid depolymerization upon dilution of the solution (Cotton
and Wilkinson, 1980).
Figure 1.1: Dissociation of boric acid
Members of the tourmaline group are the most common B-containing minerals in
soils (Whetstone et al., 1942). These minerals are borosilicates that contain about 3% B
5
in their structure. Despite their presence in some soil environments, these minerals are
highly resistant to weathering and virtually insoluble (Goldberg, 1993). On the other
hand, hydrated B minerals are very soluble, and occur as deposits usually produced by
chemical precipitation after evaporation of brine and/or seawater in arid regions
(Goldberg, 1993). Boron can also be present in phyllosilicate clay minerals substituting in
the tetrahedral layer for either Si or Al with contents varying from 10 to 500 mg kg-1
in
muscovite, 10 to 30 mg kg-1
in kaolinite, and less than 50 mg kg-1
in chlorite (Harder,
1970).
Sorption reactions govern the amount of B available for plant uptake as plants
respond only to B in the soil solution and not to the amount of B adsorbed on the solid
phase (Ryan et al., 1977; Keren et al., 1985). Therefore, factors that affect B availability
in soils are all related to the effects that they have on adsorption/desorption reactions. For
instance, because B becomes less available to plants with increasing solution pH it is
common to observe B deficiency after liming acid soils. This is due to the bell-shaped
adsorption envelope (adsorption as a function of pH) of B with soil surfaces, where a
maximum adsorption peak is observed at a pH value approximately equal to the log K for
borate protonation (Sposito, 2008). Soil texture and clay mineralogy also play important
roles in B availability. The amount of B adsorbed is dependent on soil texture and
increases with increasing clay content (Mezuman and Keren, 1981; Elrashidi and
O’connor, 1982), because clay minerals are one of the surfaces responsible for soil B
adsorption.
The main B adsorbing surfaces in soils are iron and aluminum oxides, clay
minerals, carbonates, organic matter, and amorphous aluminosilicates. Boron adsorption

6
has been highly correlated with soil aluminum oxide content (Harada and Tamai, 1968;
Bingham et al., 1971), while the iron oxide content was a significant variable in multiple
regression equations explaining the variance in adsorbed B (Elrashidi and O’Connor,
1982). On a unit weight basis, B adsorption is greater for aluminum than iron oxides
(Sims and Bingham, 1968; Goldberg and Glaubig, 1985), most likely due to the higher
surface area of the former. In these studies, B adsorption on aluminum and iron oxide
minerals is considered to be by ligand exchange with reactive surface hydroxyl groups
(Goldberg et al., 1993; Su and Suarez, 1995).
Common 1:1 and 2:1 clay minerals also adsorb B on their edge hydroxyl sites. For
2:1 clays the reaction can be limited by the degree of isomorphous substitutions that
generate permanent charge (Keren and O´Connor, 1982). For instance, pyrophyllite (an
ideal 2:1 clay mineral with no permanent charge) has a greater B adsorption capacity than
illite and montmorillonite (Keren and O´Connor, 1982) due to a lower repulsion of B in
solution. Boron adsorption by clay minerals is a two-step process. First, B adsorbs onto
the particle edges, to further migrate and become incorporated structurally into
tetrahedral sites replacing structural Si and Al (Fleet, 1965; Couch and Grim, 1968).
Because on a unit weight basis clay minerals adsorb significantly less B than do most
oxide minerals, it is more appropriate to compare B adsorption capacities on a surface
area basis. However, since B adsorbs on the edges of clay minerals — the surface areas
of which are difficult to determine— this comparison is not always straightforward
(Goldberg, 1997).
Calcium carbonate also acts as an important B adsorbing surface in calcareous soils
(Goldberg and Forster, 1991) through exchange with carbonate groups (Goldberg, 1997).

7
The B adsorption maxima for soil samples after removal of calcium carbonate were
statistically significantly lower than those for untreated soils, indicating that calcium
carbonate is an important sink for B adsorption in calcareous soils (Goldberg and Forster,
1991).
The mechanisms by which B adsorbs on isolated natural and synthetic humic
materials have been well studied, but the conclusions concerning the effect of organic
matter in whole soil B reactions are not yet clear. Boron forms tetrahedrally coordinated
surface complexes on dicarboxylic acid sites, alpha-hydroxy carboxylic acid sites, and
diphenols on synthetic and natural humic substances (Lemarchand et al., 2005; Tossel,
2006; Goldberg, 2014), but within an organomineral assemblage organic materials have
been reported to reduce the capacity of the pure mineral to adsorb B. For instance, Al
hydroxide shows a decrease in adsorption capacity when coated with organic matter (Xu
and Peak, 2007), and allophane showed a reduced capacity to sorb B even after it was
reacted with an organic compound known to have high B affinity and adsorption capacity
(Reinert et al., 2011).
For allophane, an X-ray amorphous clay-size mineral comprised of hollow nano-
spherules, which is commonly associated with volcanic ash-derived soils (Parfitt, 2009),
B can presumably substitute for Si in the inner tetrahedral layer of the nano-spherules (Su
and Suarez, 1997) as well as being surface adsorbed in trigonal and tetrahedral
coordination with aluminol groups of the gibbsite-like outer sheet. On a per mass basis
allophane and iron and aluminum oxides adsorb B to the same extent which is higher
than for clay minerals. According to Su and Suarez (1997), B can coprecipitate with
allophane during synthesis in tetrahedrally coordinated positions, presumably by

8
substituting for Si in that layer. The authors suggest that the structurally coprecipitated B
is expected to be more resistant to release than the surface adsorbed B.
Boron containing minerals generally do not control B activity in soil solution
because they are either too insoluble (tourmaline group minerals) or too soluble (hydrated
B minerals). Thus, the amount of B in soil solution is usually controlled by B adsorption-
desorption reactions (Goldberg, 1997). In most soils, B adsorption is readily reversible
with the adsorption and desorption isotherms corresponding closely and exhibiting little
or no hysteresis. The apparent irreversibility of B sorption has been attributed to
conversion of readily desorbable B surface complexes into less readily desorbable
complexes, incorporation of B into tetrahedral sites of clay minerals, and B diffusion into
particle interiors.
1.2 Volcanic ash-derived soils
Volcanic ash-derived soils are distributed exclusively in regions where active and
recently extinct volcanoes are located. These soils correspond to about 1% of the world’s
land surface, though they represent a crucial land resource due to high populations living
in these regions, and their inherent fertility stemming from an enhanced ability to
accumulate organic carbon. They are generally classified as Andosols in the World
Reference Base for Soil Resources (WRB classification) (IUSS Working Group WRB,
2015) and as Andisols in the U.S. Soil Taxonomy (Soil Survey Staff, 2014). These names
are derived from “Ando soils” whose etymology corresponds to dark (An) and soils (do)
in Japanese (Takahashi and Shoji, 2002).

9
The principal regions of the world where Andisols are distributed are summarized
by Takahashi and Shoji (2002) as follows: in Europe, Italy, Sicily, Sardinia, and France
(Massif – Central); in Africa and the Indian Ocean, Kenya, Rwanda, Tanzania, Ethiopia,
Cameroon, Malagasy, Mauritius and Reunion, Canary Islands, Uganda, Sudan, and Zaire;
in the Americas, Alaska, British Columbia, Washington, Oregon, California, Mexico,
Costa Rica, Panama, Honduras, Guatemala, El Salvador, Nicaragua, West Indies,
Ecuador, Colombia, Peru, Chile, Argentina, and Bolivia; in Asia and the Pacific, Hawaii,
Aleutian Islands, Kamchatka Peninsula, Japan, Korea, Micronesia, Philippines,
Indonesia, Papua New Guinea, Solomon Islands, Vanuatu, Fiji, Samoa, Tonga, and New
Zealand. Approximately 60% of volcanic ash derived-soils occur in tropical regions.
The central concepts required for a soil to be classified as an Andisol are that it
must be developing in volcanic ejecta and/or pyroclastic material, and that its colloidal
fraction must be dominated by short-range-order minerals, and/or Al-humus complexes.
Some soils narrowly fail to meet the criteria to be classified as Andisols, but their
behavior is similar, and they might have sufficient andic character to make them behave
essentially as Andisols.
Previous studies on Mexican and Hawaiian volcanic ash-derived soils have
revealed high B adsorption capacities due to the presence of large amounts of amorphous
minerals, Al-humus complexes, and organic matter. Bingham et al. (1971) reported
maximum adsorption capacities ranging from 2.64 to 5.30 mmol B per 100 g of soil (285
- 572 mg B kg-1
) for volcanic ash-derived soils. Boron adsorption was positively
correlated with amorphous aluminum minerals extracted with NaOH. For similar soils in
southern Chile, Schalscha et al. (1973) reported adsorption capacities ranging from 2.98

10
to 18.87 mmol B per 100 g soil (322 – 2038 mg B kg-1
) which are about 20 to 40 times
greater than those reported for non-allophanic soils. The adsorption capacities for the
Chilean soils were positively correlated with allophane content estimated by Al and Si
extracted with NaOH and with specific surface area.
Crops growing on these high B-fixing soils often suffer from severe deficiency
symptoms with little to no response to fertilizer application at normal rates that are
typically prescribed in other regions to manage B deficiency. Because B can become
toxic at fairly low concentrations in soil solution, farmers in Andic regions are often
unwilling to risk applying too much B to their crops despite the presence of deficiency
symptoms. This is due to the lack of understanding of B dynamics in volcanic ash-
derived soils and this can limit agricultural productivity in these regions.
1.3 Questions for study and objectives
The main question that this study poses is how does B interact with soils derived from
volcanic-ash that renders it unavailable for plant uptake, and how should applications of
this essential micronutrient in deficient crops be managed based on the physicochemical
characteristics of andic soils. The overall goal is to quantify the extent of B adsorption on
a set of volcanic ash-derived soils from the Pacific coastal plain of Guatemala, and to
propose management recommendations for deficient crops. Central to this goal is the
need for enhanced understanding of how soil mineral and organic components interact
with this nutrient so that chemical reactions and transport can be modeled.

11
Objective 1: To identify the soils with the greatest importance for crop production on
the Guatemalan Pacific Coastal Plain and to completely characterize their
physicochemical properties and clay mineralogy.
Hypothesis 1: The clay fractions of soils from the Pacific coastal plain have high
contents of amorphous minerals and organic matter both of which have high potentials
for B adsorption.
Approach 1: To achieve the first objective the clay fraction was separated to identify
the minerals present by X-ray diffraction, estimate the proportion of the active aluminum
and iron phases by selective dissolution and Mössbauer spectroscopy, and identify the
different fractions of organic matter in the soils by thermal analysis coupled with
measurement of CO2 and H2O evolution by infrared gas analysis to identify the mineral
and organic surface functional groups responsible for B adsorption.
Objective 2: To determine B adsorption isotherms for soils having a range of
chemical characteristics, and to correlate the adsorption capacities with their andic
character while comparing their reactivities with a set of non-andic soils.
Hypothesis 2: A quantified measurement of the andic character of the soils is directly
proportional to the B adsorption capacity.
Approach 2: To achieve this objective, 25 agricultural soils were selected for the
evaluation of B adsorption at constant temperature and natural soil pH. A variety of soil
properties (organic matter and clay content, effective CEC, surface area, amorphous Al
and Si, and pH in NaF as a measure of the andic character of the soils) were also
determined to correlate with the adsorption capacities of the soils. An additional set of 5
12
non-andic soils were included to contrast the differences between soil mineralogical
categories. The 5 reference soils were collected in the departments of Jinotega and
Matagalpa in Nicaragua, and one from the Georgia Piedmont.
Objective 3: To evaluate B desorption from soils and the effect of andic properties on
this process.
Hypothesis 3: The desorption process is not reversible but hysteretic, and the amount
of B desorbed from the solid phase increases with decreasing andic character of the soils.
Approach 3: Boron desorption was investigated by replacing aliquots of B-free
solution in tubes containing soil previously equilibrated with B solutions of different
concentrations (from the B isotherm), and determine B desorption after re-equilibrating
the suspension.
Objective 4: To evaluate crop responses to the B rates estimated from the adsorption
equilibria at two sites on the Pacific coastal plain of Guatemala using a commercially
important crop as a response model for availability of the applied B.
Hypothesis 4: The application of B fertilizer at a rate estimated from adsorption
capacities provides adequate B for plant uptake and corrects the B deficiency in the crop.
Approach 4: Two field experiments were set up to evaluate soil available B (hot
water soluble), sugarcane yields, and B uptake after application of rates estimated from
adsorption capacities.

13
References
Basset, R.L. 1980. A critical evaluation of the thermodynamic data for B ions, ion pairs,
complexes, and polyanions in aqueous solution at 298.15 K and 1 bar. Geochim.
Cosmochim. Acta. 44:1151-1160.
Bingham, F.T., A.L. Page, N.T. Coleman, and K. Flach.1971 Boron adsorption
characteristics of selected soils from Mexico and Hawaii. Soil Sci. Soc. Am. J. 35:
546–550.
Bolaños, L., N.J. Brewin, and I. Bonilla. 1996. Effects of boron on Rhizobium-legume
cell-surface interactions and nodule development. Plant Physiol. 110:1249-1256.
Bonilla, I., D. Blevins, and L. Bolaños. 2009. Boron Functions in Plants: Looking
Beyond the Cell Wall. Plant Physiology and Development 6th
edition. Sinauer
Associates. http://6e.plantphys.net/essay05.01.html (accessed 1 Dec. 2016).
Brewin, N. J. 2004. Plant cell wall remodelling in the Rhizobium-legume symbiosis. Crit.
Rev. Plant Physiol. 23:293-316.
Cotton, F.A., and G. Wilkinson. 1980. Advanced Inorganic Chemistry, 4th
ed. John Wiley
& Sons. New York, NY.
Couch, E.L., and R.E. Grim. 1968. Boron fixation by illites. Clays Clay Miner. 16:249-
256.
Elrashidi, M.A., and G.A. O’Connor. 1982. Boron sorption and desorption in soils. Soil
Sci. Soc. Am. J. 46:27-31.
Fleet, M.E.L. 1965. Preliminary investigations into the sorption of B by clay minerals.
Clay Miner. 6:3-15.
14
Ganie, M.A., F. Akhter, M.A. Bhat, A.R. Malik, J.M. Junaid, M.A. Shah, A.H. Bhat, and
T.A. Bhat. 2013. Boron – a critical nutrient element for plant growth and
productivity with reference to temperate fruits. Current Sci. 104:76-85.
Goldberg, S. 1993. Chemistry and mineralogy of boron in soils. In: Gupta, U.C., editor,
Boron and its role in crop production. CRC Press, Boca Raton, Florida. pp.3-44.
Goldberg, S., H.S. Forster, and E.L. Heick. 1993. Boron adsorption mechanisms on
oxides, clay minerals and soils inferred from ionic strength effects. Soil Sci. Soc.
Am. J. 57:704–708.
Goldberg, S., and H.S. Forster. 1991. Boron sorption on calcareous soils and reference
calcites. Soil Sci. 152:304-310.
Goldberg, S. 1997. Reactions of boron with soils. Plant Soil 193:35-48.
Goldberg, S., and R.A. Glaubig. 1985. Boron adsorption on aluminum and iron oxide
minerals. Soil Sci. Soc. Am. J. 49:1374-1379.
Goldberg, S., P.J. Shouse, S.M. Lesch, C.M. Grieve, J.A. Poss, H.S. Forster, and D.L.
Suarez. 2005. Soil boron extractions as indicators of boron toxicity. In:
Proceedings of the international salinity forum, managing saline soils and water:
science, technology and soil issues. Riverside, CA. pp:55-58.
Goldberg, S. 2014. Chemical modeling of boron adsorption by humic materials using the
constant capacitance model. Soil Sci. 179:561-567.
Gupta, U.C. 1993. Boron and its role in crop production. CRC Press, Boca Raton, FL.
Harada, T., and M. Tamai. 1968. Some factors affecting behavior of B in soil. I. Some
soil properties affecting B adsorption of soil. Soil Plant Food. 14:215-244.

15
Harder, H. 1970. Boron content of sediments as a tool in facies analysis. Sediment. Geol.
4:153-175.
IUSS Working Group WRB. 2015. World Reference Base for Soil Resources 2014,
update 2015 International soil classification system for naming soils and creating
legends for soil maps. World Soil Resources Reports No. 106. FAO, Rome.
Jackson, J.F. 1989. Borate control of protein secretion for Petunia pollen exhibits critical
temperature discontinuities. Sex. Plant Reprod. 2:11-14.
Keren, R., and G.A. O´Connor. 1982. Effect of exchangeable ions and ionic strength on
B adsorption by montmorillonite and illite. Clays Clay Miner. 30:341-346.
Keren, R., F.T. Bingham, and J.D. Rhoades. 1985. Plant uptake of B as affected by B
distribution between liquid and solid phases in soil. Soil Sci. Soc. Am. J. 49:297-
302.
Lemarchand, E., J. Schott, and J. Gaillardet. 2005. Boron isotopic fractionation related to
boron sorption on humic acid and the structure of surface complexes formed.
Geochim. Cosmochim. Acta 69:3519-3533.
Mezuman, U., and R. Keren. 1981. Boron adsorption by soils using a phenomenological
adsorption equation. Soil Sci. Soc. Am. J. 45:722-726.
Mortvedt, J.J., and J.R. Woodruff. 1993. Technology and application of boron fertilizers
for crops. In: Gupta, U.E., editor, Boron and its role in crop production. CRC
Press, Boca Raton, FL. pp.157-176.
Parfitt, R.L. 2009. Allophane and Imogolite: role in soil biogeochemical processes. Clay
Min. 44:135-155.

16
Reinert, L., F. Ohashi, M. Kehal, J. Bantignies, C. Goze-Bac, and L. Duclaux. 2011.
Characterization and boron adsorption of hydrothermally synthesized allophones.
Appl. Clay Sci. 54:274–280.
Reisenauer, H.M., L.M. Walsh, and R.G. Hoeft. 1993. Testing soils for sulphur, boron,
molybdenum, and chlorine. In: Walsh, L.M. and Beaton, J.D., editor, Soil Testing
and Plant Analysis. SSSA, Madison, WI. pp.173-200.
Ryan, J., S. Miyamoto, and J. Stroehlein. 1977. Relation of solute and sorbed boron to the
boron hazard in irrigation water. Plant Soil 47:253-256.
Schalscha, E.B., F.T. Bingham, G.G. Galindo, and H.P. Galvan. 1973. Boron adsorption
by volcanic ash soils in southern Chile. Soil Sci. 116:70-76.
Shorrocks, V.M. 1997. In Boron in soils and plants. Eds: Dell, B., P.H. Brown, and R.W.
Bell. Kluwer Academic Publishers, Dordrecht, The Netherlands.
Sims, J.R., and F.T. Bingham. 1968. Retention of B by layer silicates, sesquioxides, and
soil materials: II. Sesquioxides. Soil Sci. Soc. Am. Proc. 32:364-369.
Soil Survey Staff. 2014. Keys to soil Taxonomy 12th
ed. USDA-NRCS, Washington, DC.
Sposito, G. 2008. The surface chemistry of soils. Oxford Univ. Press, New York, NY.
Stougaard, J. 2000. Regulators and regulation of legume root nodule development. Plant
Physiol. 124:531-540.
Su, C., and D.L. Suarez. 1995. Coordination of adsorbed boron: A FTIR spectroscopic
study. Environ. Sci. Technol. 29:302–311.
Su, C., and D.L. Suárez. 1997. Boron sorption and release by allophane. Soil Sci. Soc.
Am. J. 61:69-77.
17
Takahashi, T., and S. Shoji. 2002. Distribution and classification of volcanic ash soils.
Global Environ. Res. 6:83–97.
Tossel, J.A. 2006. Boric acid adsorption on humic acids: Ab initio calculation of
structures, stabilities, 11
B NMR and 11
B, 10
B isotopic fractionations of surface
complexes. Geochim. Cosmochim. Acta 70:5089-5103.
Whetstone, R.R., W.O. Robinson, and H.G. Byers. 1942. Boron distribution in soils and
related data USDA Tech. Bul.797. Washington , D.C.
Xu, D.N., and D. Peak. 2007. Adsorption of boric acid on pure and humic acidcoated am-
Al(OH)3: A boron K-edge XANES study. Environ. Sci.Technol. 41:903-908.

18
CHAPTER 2
BORON ADSORPTION AND DESORPTION ON VOLCANIC ASH-DERIVED
SOILS1
1 Terraza Pira, M.F., M.E. Sumner, M.L. Cabrera, and A. Thompson. Submitted to the Soil Science Society
of America Journal.

19
2.1 Abstract
Many crops in volcanic regions exhibit symptoms of B deficiency but do not
respond to B fertilizer rates that solve deficiency problems in non-volcanic-influenced
soils. US recommended rates are routinely adopted in these regions without accounting
for differences in soil B dynamics. Because of the paucity of investigations into and the
resulting lack of understanding of B adsorption/desorption dynamics in volcanic ash-
derived soils over the past 40 years, it would be incorrect to extrapolate the few data
available to all volcanic ash-derived soils when they have not been analyzed as a function
of andic character. This paper aims to create an understanding of what soil properties
govern B availability in volcanic-influenced soils, and to establish if there are low-cost
testing methods that can help estimate appropriate field B application rates in these soils.
B adsorption/desorption isotherms were constructed for a group of volcanic ash- and non-
volcanic ash-derived soils, and the derived parameters were compared with various
standard soil tests. Our results show that soil B availability in volcanic-influenced soils is
governed mainly by strong and stable B complexation with short-range-order (SRO)
minerals. B adsorption maxima exhibit a wide variability not directly correlated with clay
content, but rather with reactivity quantified by SRO mineral and organic matter contents.
Organic matter is not a significant variable explaining specific surface area for the overall
group of soils, but it becomes significant for soils containing less than 200 g clay kg-1
,
suggesting that a new approach to analyzing whole-soil reactivity based on mineral
surface abundance is needed. The maximum adsorption capacities of volcanic-influenced
soils can be as much as 18-fold higher than for non-volcanic soils with the reversibility of
adsorption reactions decreasing as andic character increases. These findings explain why

20
standard B fertilizer rates fail to solve deficiency problems in volcanic-influenced soils.
Because pH in NaF is strongly related with acid-oxalate Al (SRO minerals) and B
desorption index, this low-cost test can potentially be used as a measure of soil andic
character to better reflect B availability and corresponding field application rates.
2.2 Introduction
Boron (B) is a trace element essential for plant growth, and its availability is
influenced by adsorption and desorption reactions on soil surfaces (Keren et al., 1985).
Plants respond only to B concentrations in the soil solution with the range between
deficient and toxic levels being very narrow (Keren et al., 1985; Goldberg, 1997). Boron
availability can be low in volcanic ash-influenced soils (Shorrocks, 1997), such as those
along the Guatemalan south coast. Many crops in volcanic regions exhibit symptoms of B
deficiency, but do not respond to the standard B fertilizer applications (ranging from 0.25
to 3.0 kg B ha-1
(Gupta, 2007)) that solve deficiency problems in non-volcanic-influenced
soils (Sherrell and Toxopeus, 1978; Gupta, 1993; Shorrocks, 1997).
The recommended rates of B fertilization and methods of application have not
changed significantly during the past several decades in the United States (Mortvedt and
Woodruff, 1993). This is primarily because for most US soils, B loss (and decrease in
crop availability) occurs by leaching below the root zone or, to a lesser extent, by crop
removal. However, US recommended B application rates are routinely adopted in other
regions of the world for soils that have very different B dynamics. For instance, in soils
with high surface area minerals―such as allophane and ferrihydrite―, the main problem
limiting B availability is likely to be B surface complexation and fixation. As a result,

21
farmers in volcanic regions are getting incorrect B application rate recommendations.
Resolving this issue requires regional specific research studies and a simple, low-cost
testing method.
Boron adsorption on many soil types in various geographic regions has been
positively correlated with pH, sesquioxides, organic matter, inorganic carbon and clay
contents, specific surface area, soil salinity, and Al extracted with different solutions.
Despite the well-known B reactions with these soil components, limited information on B
dynamics in volcanic ash-derived soils is available in the literature, and even fewer
efforts have been made to manage B deficiency in volcanic regions.
The studies of agricultural volcanic ash-derived soils are limited to twelve
Japanese soils (Hara and Tamai, 1968), twelve Hawaiian soils (Hue et al., 1968; Bingham
et al., 1971), four Mexican soils (Bingham et al., 1971), and six Chilean soils (Schalscha
et al., 1973); with contradictory conclusions concerning the effect of clay and organic
matter contents on the capacity to adsorb B. Hara and Tamai (1968) did not model B
adsorption equilibrium as a function of B concentration in solution, but reported a single
data point for each soil with no quantification of the soils andic character. Similarly, Hue
et al. (1968) did not present adsorption isotherm models to describe B adsorption, but
only qualitative distinctions between mineralogy of soils affecting sorption behavior.
Bingham et al. (1971) and Schlscha et al. (1973) reported 20- to 40-fold greater
adsorption capacities than for non-volcanic soils. Despite adsorption capacities being
positively correlated with Al extracted with NaOH―used as a measure of short-range-
order (SRO) minerals―, this Al might not arise only from allophane and imogolite but
could come from other sources such as gibbsite. Because there has not been any attempt

22
to understand B adsorption in volcanic ash-derived soils over the past 40 years, it would
be incorrect to extrapolate the few data available to all volcanic ash-derived soils when
they have not been analyzed as a function of andic character.
In pure laboratory synthesized allophane systems, B adsorption data (Su and
Suarez, 1997; Son et al., 1998; Reinert et al., 2011) suggest that allophane forms strong
and specific surface B complexes through ligand exchange reactions. However, these
hypotheses have not been tested on whole soils with a continuum of allophane and other
components. Previous studies on B adsorption in volcanic ash-derived soils have not
taken this into account as a quantitative variable in describing B dynamics.
Understanding desorption hysteresis is crucial in managing B in agricultural
systems especially in deficient soils that receive B fertilizers, because the concentration
of B in the soil solution is determined by adsorption-desorption reactions. In volcanic
ash-derived soils the degree of reversibility of these adsorption reactions has not been
evaluated as a function of their andic character, and B supply for crops suffering
deficiency symptoms depends to an important extent on the nature of these processes.
In some non-volcanic soils, B adsorption is readily reversible with the adsorption
and desorption isotherms corresponding closely showing little or no hysteresis (Hatcher
and Bower, 1958; Elrashidi and O’Connor, 1982). Other soils (Oxisols, Ultisols, and
calcareous soils) exhibit hysteresis which means that the isotherm for desorption does not
correspond with that for adsorption (Okazaki and Chao, 1968; Rhoades et al., 1970;
Elrashidi and O’Connor, 1982; Chen et al., 2009; Majidi et al., 2010). The apparent
irreversibility of B sorption has been attributed to conversion of readily desorbable into

23
less readily desorbable B surface complexes, incorporation of B into tetrahedral sites of
clay minerals, and B diffusion into particle interiors.
Because soil organic matter does not appear to affect desorption characteristics
(Goldberg and Suarez, 2012), B desorption hysteresis is likely to be governed by other
soil properties. The degree of hysteresis decreases with increasing pH induced by adding
NaOH (Chen et al., 2009; Goldberg and Suarez, 2012) facilitating the desorption of
adsorbed B probably due to a greater electrostatic repulsion of borate anions [B(OH)4¯]
by the increased negative surface charge at higher pH values. This is entirely different to
the effect of alkalinity in calcareous soils where the B adsorption and hysteresis is caused
by the presence of lime.
Andisols correspond to about 1% of the world’s land surface, although they
represent a crucial land resource due to the high populations living in these regions, and
their inherent fertility stemming from an enhanced ability to accumulate organic carbon.
Many additional soils in volcanic regions narrowly miss classification criteria for an
Andisol, but nevertheless their behavior is similar because they have sufficient andic
character to make them behave essentially the same as Andisols.
Given that the B adsorption/desorption in volcanic ash-derived soils and soils
with andic character is largely unstudied, several key questions must be answered to
improve agricultural management of B in volcanic-influenced regions: (1) what soil
properties govern B availability in volcanic-influenced soils? and (2) are there low cost
testing methods that can help stakeholders estimate field B application rates for volcanic-
influenced soils? To answer these questions, a group of volcanic ash-derived soils that
suffer from B deficiency and a set of non-volcanic soils were (i) subjected to B

24
adsorption/desorption isotherm experiments; (ii) the sorption/desorption behavior was
compared with various standard soil tests including clay content, soil organic matter, and
pH in NaF, among others; and (iii) correlations between the soil tests and
sorption/desorption behavior were evaluated for applicability as a potential low-cost soil
testing parameter that could be used to optimize B fertilization rates in the hopes of
obtaining crop responses.
2.3 Materials and methods
For the study, 25 agricultural soils from the south coast region of Guatemala were
selected for the evaluation of B adsorption at constant temperature and natural soil pH
(Table 2.1). The soils were chosen from sugarcane and banana production areas in the
departments of Retalhuleu, Suchitepéquez, Escuintla, and Santa Rosa. Boron adsorption
was investigated using surface soil samples (0-15 cm) from different soil families
belonging to six soil orders identified by Sánchez et al. (1996).
In the majority of cases, the soils that were not classified as Andisols still had
sufficient volcanic ash influence to confer andic characteristics. An additional set of five
non-volcanic soils were included to make comparisons between soil categories. The five
reference soils were collected in the departments of Jinotega and Matagalpa in Nicaragua,
and one from the Georgia Piedmont.
To construct the B adsorption isotherms 25 mL of seven solutions of different B
concentrations (0, 2, 4, 8, 16, 32, and 64 mg L-1
) were added independently to 5 g soil
and shaken for 20 h in a reciprocal shaker (~ 120 oscillations per minute) to reach
equilibrium. After separation by centrifugation, final B concentrations were measured by

25
the Azomethin-H method (Wolf, 1971). Because extracts were clear, the potential
interference problem of dissolved organic matter with this method was not considered. B
concentrations were chosen based on the fact that polymeric B species occur at
concentrations in solution higher than 270 mg B L-1
(Cotton and Wilkinson, 1980), and
this has been reported to produce a deviation from the Langmuir modeling equation
(Elrashidi and O’Connor, 1982); since then, concentrations above 100 mg B L-1
have not
been used in B adsorption studies. It is well documented that B reaches equilibrium with
soils and soil constituents in batch experiments after 12 h (Griffin and Burau, 1974;
Elrashidi and O’Connor, 1982; Arora and Chahal, 2007; Ranjbar and and Jalali, 2013).
The Langmuir empirical model was used as a mathematical description of a
typical L-curve isotherm to expresses the amount of B adsorbed kg-1
dry soil as a function
of the concentration of the free B in an equilibrium solution, as shown in the following
equation:
𝑛𝑖 =𝑏𝐾𝑐𝑖
1 + 𝐾𝑐𝑖
where i represents the adsorptive species, b represents the maximum adsorption capacity,
which is the value of adsorbed species approached asymptotically when the concentration
in solution becomes arbitrarily large, and K is an affinity parameter that determines the
magnitude of the initial slope of the isotherm.
To fit the equation, an equivalent version of the Langmuir equation with
rearranged terms was used plotting 𝑐𝑖
𝑛𝑖⁄ as a function of 𝑐𝑖 and a linear equation was
fitted where the slope corresponds to 1 𝑏⁄ and the intercept to 1 𝐾𝑏⁄ as follows:
𝑐𝑖
𝑛𝑖=
1
𝑏𝑐𝑖 +
1
𝐾𝑏

26
Desorption cycles were evaluated on six of the volcanic ash-derived and three of
the non-volcanic soils. After separating the supernatant by centrifugation and pipetting,
25 mL of a B-free solution (0.01 mol L-1
CaCl2) was added to each tube to re-equilibrate
for desorption. Care was taken to ensure that no clumping took place during the re-
equilibration. Experimental protocols to avoid clumping and loss of soil particles from
the supernatant during the phase separation during the desorption steps were followed to
avoid errors that could lead to mistakenly observing hysteretic behavior (Goldberg and
Suarez, 2012). A total of two desorption steps were performed for each initial
concentration. Final B concentrations in the supernatants from desorption cycles were
measured by the Azomethin-H method (Wolf, 1971); all extracts were clear.
A desorption index (DI) was estimated as the ratio of adsorption and desorption
linearized isotherms slopes as proposed by van Genuchten (1974) and Elrashidi and
O’Connor (1982). When desorption is completely reversible DI equals to one, and it can
be estimated by:
𝐷𝐼 = 𝑛𝑑𝑒𝑠
𝑛𝑎𝑑𝑠
where ndes and nads are the slopes of the respective isotherms. The value of DI was
calculated for all the initial B concentration points using the slope of the corresponding
desorption isotherm. Also, an average DI was calculated for all B concentrations by using
the average of the slopes for the two desorption isotherms.
A variety of soil properties were also determined to correlate with the adsorption
capacities of the soils. Values for soil organic matter (SOM), clay content, effective
cation exchange capacity (ECEC), specific surface area (SSA), acid-oxalate extractable
Al and Si (Alo and Sio), and pH measured in NaF (pHF) are presented in Table 2.1. Soil

27
particle size distribution was measured by the Buoyoucos hydrometer method
(Buoyoucos, 1962) and SOM was calculated from total C and N measured by combustion
using a Leco C-N analyzer (Wang, 1998). ECEC was calculated as the sum of NH4OAc
(pH 7) extractable cations (Sumner and Miller, 1996). SSA was determined by the water
vapor sorption method of Orchison (1953) which involves equilibration in desiccators
over different concentrations of sulfuric acid to produce a range of vapor pressures and
calculation based water vapor isotherms.
To quantify the andic character, amorphous Al and Si were extracted in 0.2 mol L-
1 of ammonium oxalate in 0.2 mol L
-1 oxalic acid (pH = 3 ± 0.05) (0.25 g soil to 25 mL)
in a 50-mL centrifuge tube. The tubes were shaken for 4 h in the dark at room
temperature (23oC), and then analyzed by ICP-MS for Al and Si. A simple measure of the
andic character that has been used for soil classification purposes (Soil Survey Staff,
2014) was also performed on all samples. It consists of a pH measurement in NaF (1 g
soil to 50 mL of a 1 mol L-1
solution) after stirring for 2 min. A pH value higher than
natural soil pH is obtained because fluoride (F-) anions exchange for hydroxyl (OH
-)
surface functional groups, causing an increase in the alkalinity of the aqueous phase. This
pH value directly reflects the content of amorphous aluminosilicates (allophane and
imogolite) and andic character because these minerals have a high proportion of surface
hydroxyl groups due to their configuration and composition.

28
2.4 Results and discussion
Boron Adsorption
Boron adsorption isotherms show a typical L-curve shape to which the Langmuir
isotherm equation was fitted with adsorption tending toward a maximum in the higher
range of solution B concentrations evaluated (32 – 64 mg B L-1
) (Table 2.2). Boron
maximum adsorption capacities, which correspond to the b parameter of the Langmuir
equation (hereafter bB), were estimated for all samples except the Cecil soil, for which no
significant decrease in B solution concentration was observed in the last four points of the
isotherm. A fit of the low concentration points (0 – 4 mg B L-1
) resulted in a bB of 0.4 mg
B kg-1
, which supports the claim that the main process limiting B availability in non-
volcanic soils is leaching from the root zone. The Cecil soil has a negligible adsorption
capacity probably due to its texture (64% sand) and low content of organic matter (Table
2.1).
B adsorption isotherms for volcanic ash-derived soils exhibited a wide range of
maximum adsorption capacities (Figure 2.1) from 3 mg B kg-1
for the Santa Monica
loamy sand to 130 mg B kg-1
soil for Puyumate sandy loam. Considering that the silt and
sand fractions of the soil have negligible surface area, the adsorption capacities can be
attributed almost entirely to the clay fraction; thus the adsorption capacities for the 25
volcanic ash-derived soils range from 20 to 922 mg B kg-1
clay versus a range of 0 to 53
mg B kg-1
clay for the non-volcanic control soils (Table 2.1).
Values of bB for the clay fractions of the highly reactive soils in this study are
comparable to those reported by Su and Suárez (1997) for synthetic freshly precipitated
allophane ranging from 400 – 8000 mg B kg-1
clay; on the other hand, the less reactive

29
soils have adsorption capacities that are comparable with those of the non-volcanic soils
studied by Elrashidi and O´Connor (1982) ranging from 2.3 to 33.9 mg B kg-1
soil,
corresponding to 22 to 112 mg B kg-1
clay.
Volcanic ash-derived soils have greater affinity for B adsorption than the non-
volcanic soils. Boron adsorption is not directly related to clay content as was the case for
the soils studied by Elrashidi and O´Connor (1982), but rather to clay fraction reactivity
derived from the andic character of the minerals. This is illustrated well by comparing
two samples (El Mirador and El Rama) with exactly the same clay content (401 g kg-1
)
with bB of 155, and 12 mg B kg-1
clay, respectively (Figure 2.2). The difference between
clay content and clay reactivity as affected by andic properties can be explained based on
the morphology and composition of the amorphous aluminosilicates that confer andic
properties to the soils. The quantitative measurements of andic character for these two
soils explain the difference in clay reactivity. Soil El Mirador has 11.2 and 6.5 mg kg-1
of
acid-oxalate extractable Al and Si, respectively; and a fluoride pH of 9.79 (Table 2.1).
Soil El Rama has 1.7 and 0 mg kg-1
of acid-oxalate extractable Al and Si, respectively;
and a fluoride pH of 8.37.
Acid-oxalate extractable Al and Si, and pHNaF are quantitative indicators of short-
range-order minerals such as allophane and imogolite. These minerals have large SSA
derived from their hollow nano-scale structures that expose surface hydroxyl groups with
potential to adsorb B through ligand exchange reactions. Clay reactivity would refer then,
to the allophane and imogolite content of the clay fraction, which seems to better describe
the results found for these soils, for which the variability in observed bB cannot be
described merely by differences in clay content. Highly significant (p = 0.01) simple

30
linear regression models were obtained between bB and soil specific surface area (SSA),
and the degree of significance was greatly increased (p = 0.001) when expressed on a unit
clay basis (Table 2.3). This illustrates how clay fraction reactivity is a better explanatory
variable for bB than clay content.
Specific surface area for the entire set of soils was well explained by clay content,
oxalate extractable Al, and ECEC using a multiple regression model where the only
variable that was not significantly correlated was soil organic matter. Despite this
negligible contribution of organic matter to the overall data, for the sub-set of soils
containing less than 200 g of clay kg-1
, organic matter became important by significantly
explaining the variability in SSA (Table 2.4). The differences between the multiple
regression parameters for the overall set of samples and the sub-sets based on clay
content suggest that B affinity for organic surfaces becomes significantly important only
when mineral surfaces become less available, and that the contradictory results in the
literature regarding the role of organic matter in adsorption reactions could be attributed
to differences in the abundance of mineral surfaces.
This supports the findings of Bartolli et al. (2007) who demonstrated the
antagonistic effects of organic matter and allophane on SSA for a set of Andisols. In their
study, they concluded that the more the allophane is coated with organic matter, the more
hydrophobic the soil surfaces become and the smaller the measured SSA is. Using this
concept of allophane being coated by organic matter, the negative coefficients for organic
matter in the regression model for SSA (Table 2.4) can be explained by a potential
blocking mechanism of mineral hydroxyl functional groups and reduction in SSA,
although the coefficients were not statistically significant. On the other hand, for soils
31
with less than 200 g kg-1
clay, allophane is probably not the main component defining
SSA and a positive contribution from organic matter is observed. It is worth noticing that
the effects of organic matter on whole-soil B adsorption capacity for other soil types has
been contradictory, with some authors showing positive (Olson and Berger, 1947;
Elrashidi and O’Connor, 1982; Yermiyaho et al., 1995; Sharma et al., 2006) and others
negative effects (Marzadori et al., 1991; Diana et al., 2010; Sarkar et al., 2014). Our
findings showing different effects of organic matter depending on total clay size particles
offer a new approach to analyzing whole-soil reactivity, but are not definitive for
volcanic ash-derived soil behavior.
The large range in bB values within the data set is probably due to heterogeneity
stemming from wide variations in texture, clay mineralogy and organic matter.
Regression analyses of the relationship between these three variables and bB verified that
adsorption capacities are not directly correlated with clay content, but rather with its
reactivity quantified as allophane and organic matter contents (Table 2.5). For instance,
the three Vertisols (Capullo, Colombita, and Buenos Aires) have low bB (16, 21, and 47
mg B kg-1
, respectively) with large clay contents (300, 500, and 540 g kg-1
, respectively)
whereas the three Andisols (La Cuchilla, Socorro, and Cadiz) have greater bB (23, 49, and
90 mg B kg-1
, respectively) with smaller clay contents (101, 341, and 240 g kg-1
,
respectively).
An independent investigation of the mineralogical and thermal properties of the
soils used in this study revealed allophane contents in the clay fraction ranging from 20 to
740 mg g-1
clay in the Guatemalan soils, whereas the set of non-volcanic reference soils
have less than 20 mg g-1
(Chapter 3). Other minerals identified by XRD and thermal

32
analysis are phyllosilicates of the 1:1 layer type (most likely kaolinite) and 2:1 layer type
(most likely montmorillonite and beidellite), and feldspar (most likely orthoclase). Soils
with greater contents of allophane are more reactive due to the significantly greater
surface area available for sorption reactions. The less reactive soils containing less than
100 mg allophane g-1
clay have an average bB of 72 mg B kg-1
clay; whereas those with
more than 100 mg allophane g-1
clay, had bB averaging 316 mg B kg-1
clay. The
variability in the contents of SRO minerals and other minerals with less affinity for B
adsorption are responsible for the heterogeneity of the results in the study. For instance,
the Buenos Aires soil with 540 g clay kg-1
soil, of which 23% is allophane, has a bB of 87
mg B kg-1
clay; in contrast, the Puyumate soil with only 141 g clay kg-1
soil, of which
60% is allophane, has a bB of 922 mg B kg-1
clay, almost 11-fold greater.
A multiple linear regression analysis between bB and acid oxalate extractable Al,
clay, OM and ECEC was performed on the 25 volcanic ash-derived soils in which only
acid-oxalate Al content was statistically significant in explaining 60% of the variation in
observed bB. Furthermore, acid oxalate Al was highly exponentially correlated (R2 =
0.85) with pHNaF (p = 0.01) which is used as a measure of the andic character of the soils
(Figure 2.3).
B desorption
The nine soils selected for desorption cycles exhibited widely different degrees of
hysteresis―defined as irreversibility of adsorption reactions with lack of correspondence
between the adsorption and the desorption isotherms— based on their volcanic influence.
The volcanic-ash derived soils exhibit strong hysteresis, whereas the non-volcanic soils

33
had near reversible sorption/desorption isotherms (Figure 2.4). Desorption indexes (DI)
ranged from 0.6 for the Cecil soil (non-volcanic), to 6.1 for the Velasquez soil (volcanic)
and it is strongly related with the andic character of the soils (Figure 2.5) represented as
pHNaF.
Experimental errors in adsorption-desorption studies can sometimes cause
confusion as to whether hysteresis occurs or not (Goldberg and Suarez, 2012). In batch
experiments, it is likely that clumping due to cohesion between particles occurs when re-
shaking centrifuged soil suspensions, resulting in inaccessibility of some of the adsorbed
B to the exchanging solution; as a result poor equilibrium between soil and solution
occurs leading to apparent hysteresis. An additional experimental difficulty that might
result in apparent B hysteresis is the loss of some soil particles from the supernatant
during the phase separation in the desorption steps. Therefore, careful attention was paid
to the adsorption-desorption protocols to avoid clumping and soil loss during our
experiments, and the hysteretic behavior observed is assumed to arise only from
differences in soil properties.
A multiple linear regression of the DI using the andic character (pHNaF) and the
SOM as explanatory variables demonstrated that the degree of hysteresis is dependent
only on the SRO minerals present (p = 0.01), and not on organic matter content (ns).
These results are in concordance with those found by Goldberg and Suarez (2012) who
concluded that organic matter content does not have an effect on B desorption hysteresis.
The migration of B into particle interiors and possible substitution into soil
minerals could explain the phenomena observed. Acid-oxalate dissolutions correspond to
the content of amorphous aluminosilicates (allophane and imogolite), whose specific

34
configuration of nano-balls and nano-tubules can lead to inaccessibility preventing B
from being desorbed. As Su and Suarez (1997) suggested, B can presumably substitute
for Si in the inner tetrahedral layer of the nano-spherules as well as being surface
adsorbed on aluminol groups of the outer sheet.
pHNaF as a predictor of B availability
For each soil, the amount of B adsorbed at equilibrium with 1.0 mg B L-1
in
solution, which is considered to be adequate for most crops (Keren and Bingham, 1985),
was related to the pHNaF to provide a single easily-measured parameter to predict B
availability. Two simple regression models were fitted to the data for this wide range of
soils (Figure 2.6), one for soils with more volcanic ash influence in the central part of
Escuintla (0 to 300 masl) with an R2 = 0.7681 (p = 0.001), and another one for the less
ash-influenced soils developed from basaltic lava flows in eastern and western Escuintla
(0 to 300 masl), Santa Rosa (0 to 100 masl), Suchitepéquez and Retalhuleu (40 to 300
masl) with R2 = 0.9278 (p = 0.001). In the absence of any other easily-measured
parameter to assess the amount of B available to the crop, pHNaF can be used for soil test
purposes to predict likely response.
To actually evaluate the ability of this single test to predict B adsorption, an
independent set of soil samples (seven from the central volcanic ash area and five from
the western basaltic area) was collected to establish whether the prediction corresponded
with the measured B adsorption data. The experimental adsorption for the central soils
fell within the 95% prediction interval of the regression model, but only two of the five
samples from the western area did (Figure 2.7a and 2.7b, respectively). Failure to predict

35
B adsorption within a range of confidence may be due to previous B fertilizer
applications by farmers managing crops in the area. Thus the equations presented here are
not intended to predict accurately the amount of B that would be adsorbed in equilibrium
with an adequate concentration in solution, but rather to provide an estimate of mineral
surfaces that could potentially limit B availability for plant growth in the region. Further
modeling investigations are needed to provide better analytical tools that could make
more precise predictions so that this trace element, which can reach both deficient and
toxic levels in the soil solution very rapidly within a growing cycle, can be adequately
managed.
2.5 Conclusions
Soil B availability in volcanic-influenced soils is governed mainly by formation
of strong and stable surface B complexes with SRO minerals. B adsorption maxima
exhibits a wide variability not directly correlated with clay fraction, but rather with clay
reactivity quantified by the SRO mineral and organic matter contents. Organic matter is
not a significant variable in explaining total SSA for the overall group of soils, but it
becomes significant for soils containing less than 200 g of clay kg-1
, suggesting that a
new approach to analyzing whole-soil reactivity based on mineral surface abundance is
required that responds to previous contradictions about the role of organic matter in
whole-soil surface reactions. The maximum adsorption capacities of volcanic-influenced
soils can be as much as 18-fold higher than for non-volcanic soils, and the reversibility of
adsorption reactions decreases as andic character increases. These findings explain why
standard B fertilizer rates fail to solve deficiency problems in volcanic-influenced soils.

36
pHNaF has a strong exponential relation with acid oxalate Al and a strong linear
relationship with the desorption index. This low cost test can potentially be used as a
measure of the andic character of the soils to help stakeholders estimate the content of
mineral surfaces that could limit B availability for plant growth and better estimate field
B application rates.
References
Arora, S. and D. S. Chahal. 2007. Comparison of kinetic models for boron adsorption in
alluvium‐derived soils of punjab, India. Comm. Soil Sci. and Plant Anal. 38:523-
532.
Bartoli, F., A.J. Poulenard, and B.E. Schouller. 2007. Influence of allophane and organic
matter contents on surface properties of Andosols. Eur. J. Soil Sci. 58:450-464.
Bingham, F., A. Page., N. Coleman, and K. Flach, 1971. Boron adsorption characteristics
of selected soils from Mexico and Hawaii. Soil Sci. Soc. Am. J. 35:546-550.
Buoyoucos, G.J., 1962. Hydrometer method improved for making particle size analysis
of soils. Agron. J. 54: 464-465.
Cotton, F.A., and G. Wilkinson. 1980. Advanced Inorganic Chemistry, 4th
ed. John Wiley
& Sons. New York, NY.
Chen, W.T., S.B.Ho, and D.Y. Lee. 2009. Effect of pH on boron adsorption desorption
hysteresis of soils. Soil Sci. 174:330-338.
Diana, G., C. Beni, and S. Marconi. 2010. Comparison of adsorption isotherm equations
to describe boron behavior in soils affected by organic and mineral fertilization.
Commun. Soil Sci. Plant Anal. 41:1112:1128.

37
Elrashidi, M., and G.A. O´Connor. 1982. Boron sorption and desorption in soils. Soil Sci.
Soc. Am. J. 46:27-31.
Goldberg, S. 1997. Reactions of boron with soils. Plant Soil. 193:35-48.
Goldberg, S., and R. Glaubig. 1986. Boron adsorption on California soils. Soil Sci. Soc.
Am. J. 50:1173-1176.
Goldberg, S. and D.L. Suarez. 2012. Role of organic matter on boron adsorption-
desorption hysteresis of soils. Soil Sci. 177:417-423.
Griffin, R.A. and R.G. Burau. 1974. Kinetic and equilibrium studies of boron desorption
from Soil. Soil Sci. Soc. Amer. Proc. 38:892-897.
Gupta, U. 1993. Boron and its role in crop production. CRC Press, Inc., Boca Raton, FL.
Gupta, U. 2007. Boron. In: Barker, Al.V., and D.J. Pilbeam (eds) Handbook of plant
nutrition. CRC Press, Inc., Boca Raton, Florida
Hatcher, J. T., and C. A. Bower. 1958. Equilibria and dynamics of boron adsorption by
soils. Soil Sci. 85:319-323.
Hue, N., N. Hirunburana, and R. Fox. 1988. Boron status of Hawaiian soils as measured
by B sorption and plant uptake. Commun. Soil Sci. Plant Anal. 19:517-529.
Keren, R. and R.G. Gast. 1981. Effects of wetting and drying, and of exchangeable
cations, on boron adsorption and release by montmorillonite. Soil Sci. Soc. Am. J.
45:45-48.
Keren, R., F.T. Bingham, and J.D. Rhoades. 1985. Plant uptake of boron as affected by
boron distribution between liquid and solid phases in soil. Soil Sci. Soc. Am. J.
49:297-302.

38
Majidi, A., R. Rahnemaie, A. Hassani, and M. J. Malakouti. 2010. Adsorption and
desorption processes of boron in calcareous soils. Chemosphere 80:733-739.
Marzadori, C., L.V. Antisari, C. Ciavatta, and P. Sequi. 1991. Soil organic matter
influence on adsorption and desorption of boron. Soil Sci. Soc. Am. J.
55:1582:1587.
Meyer, M. L., and P. R. Bloom. 1997. Boric and silicic acid adsorption and desorption by
a humic acid. J. Environ. Qual. 26:63-69.
Okazaki, E., and T.T. Chao. 1968. Boron adsorption and desorption by some Hawaiian
soils. Soil Sci. 105:255-259.
Olson, R.V., and K.C. Berger. 1947. Boron fixation as influenced by pH, organic matter
content and other factors. Soil Sci. Soc. Am. Proc. 11:216-220.
Orchiston, H. 1952. Adsorption of water vapor: I. Soils at 25°C. Soil Sci. 76:453-465.
Ranjbar, F., and M. Jalali. 2013. Release kinetics and distribution of boron in different
fractions in some calcareous soils. Environ. Earth Sci. 70:1169-1177.
Reinert, L., F. Ohashi, M. Kehal, J. Bantignies, C. Goze-Back, and L. Duclaux. 2011.
Characterization and boron adsorption of hydrothermally synthesised allophanes.
App. Clay Sci. 54:274-280.
Rhoades, J.D., R.D. Ingvalson, and J.T. Hatcher. 1970. Laboratory determination of
leachable soil boron. Soil Sci. Soc. Am. Proc. 34:938-941.
Ryan, J., S. Miyamoto, and J. Stroehlein. 1977. Relation of solute and sorbed boron to the
boron hazard in irrigation water. Plant Soil. 47:253-256.

39
Sánchez, A.G., F.A.M. Astudillo, E.R. Beltran, I.R. Seuzcún, and J.V. Mena. 1996.
Estudio Semidetallado de Suelos de la Zona Cañera del Sur de Guatemala.
Cengicaña, Guatemala City, Guatemala.
Sarkar, D., D.K. De, R. Das, and B. Mandal. 2014. Removal of organic matter and oxides
of iron and manganese from soil influences boron adsorption in soil. Geoderma,
214:213-216.
Schalscha, E.B., F.T. Bingham, G.G. Galindo, and H.P. Galvan. 1973. Boron adsorption
by volcanic ash soils in southern Chile. Soil Sci. 116:70-76.
Sharma, K. N., H. Singh, and A. C. Vig. 1995. Influence of continuous cropping and
fertilization on adsorption and desorption of soil phosphorus. Fertilizer Research
40: 121–28.
Sharma, K.R., P.C. Srivastava, P. Srivastava, V.P. Singh. 2006. Effect of farmyard
manure application on boron adsorption-desorption characteristics of some soils.
Chemosphere 65:769-777.
Shorrocks, V.M. 1997. The occurrence and correction of boron deficiency. Plant Soil.
193:121-148.
Sims, J., and F. Bingham. 1967. Retention of B by layer silicates, sesquioxides, and soil
materials: I. Layer silicates. Soil Sci. Soc. Am. Proc. 31:728-732.
Soil Survey Staff. 2014. Kellogg Soil Survey Laboratory Methods Manual. Soil Survey
Investigations Report No. 42, Version 5.0. R. Burt and Soil Survey Staff (ed.).
U.S. Department of Agriculture, Natural Resources Conservation Service.
Son, L.T., N. Matsue, and T. Henmi. 1998. Boron adsorption on allophane with nano-ball
morphology. Clay Sci. 10:315-325.

40
Su, C., and D.L. Suárez. 1997. Boron sorption and release by Allophane. Soil Sci. Soc.
Am. J. 61:69-77.
Sumner, M.E., and W.P. Miller. 1996. Cation exchange capacity and exchange
coefficients. pp. In D.L. Sparks (ed) Methods of soil analysis. Part. 3. Chemical
methods. Soil Sci. Am. Book Series No. 5. ASA and SSSA, Madison, WI.
Terraza Pira, M.F., M.E. Sumner, A. Plante, and A. Thompson. 2017. Mineral
characteristics of volcanic ash-derived soils affecting boron adsorption. In review.
Wada, K. 1989. Allophane and imogolite. pp. 1051–1087. In J.B. Dixon and S.B. Weed
(eds.) Minerals in soil environment. 2nd ed. Soil Sci. Am. Book Series No. 1.
ASA and SSSA, Madison, WI.
Wang, D., and D.W. Anderson. 1998. Direct measurement of organic carbon content in
soils by the Leco CR-12 carbon analyzer. Commun. Soil Sci. Plant Anal. 29:15–
21.
Wolf, B. 1971. The determination of boron in soil extracts, plant materials, composts,
manures, water, and nutrient solutions. Soil Sci. Plant Anal. 2:363-374.
Yermiyaho, U., R. Keren, and Y. Chen. 1995. Boron sorption by soil in the presence of
composted organic matter. Soil Sci. Soc. Am. J. 59:405-409.
Zhu, H., and H.M. Selim. 2000. Hysteretic behavior of metolachlor adsorption-desorption
in soils. Soil Sci. 165:632-645.

41
Tables and figures
Table 2.1: Selected properties of the 25 volcanic ash soils and 5 non-volcanic soils used for comparison
(Continues in next page)
Soil name Family Clay SOM Al† Si† ECEC ECEC SSA SSA pH bB bB
g kg-1 cmolc kg-1soil cmolc kg-1
clay m2 g-1soil m2 g-1
clay NaF mg B kg-1soil mg B kg-1
clay
----------------------- volcanic soils -----------------------
Blanca Victoria Coarse-loamy,Isohyperthermic,Typic Tropofluvents 300 28 4.2 2.1 13.71 45.71 49 162 9.25 6 20
Las Rosas Clayey,Isohyperthermic,Vertic Natrustalfs 480 39 4.6 2.5 20.26 42.22 73 152 9.08 13 27
Maria Linda Fine-loamy,Isohyperthermic,Fluventic Haplustolls 160 20 3.6 2.6 12.33 77.08 47 294 9.24 5 31
Colombita Coarse-loamy,Isohyperthermic, Typic Pelluderts 500 31 6.5 3.4 14.58 29.16 78 156 9.34 16 32
San Francisco Sandy,Isohyperthermic,Typic Ustifluvents 381 59 6.4 2.8 28.58 75.01 98 257 9.33 14 37
Chaparral Sandy,Isohyperthermic,Pachic Haplustolls 340 36 4.2 1.9 29.72 87.40 109 321 9.17 13 38
La Felicidad Coarse-loamy,Isohyperthermic,Typic Tropofluvents 301 32 4.8 2.6 25.50 84.78 62 206 9.42 14 47
Santa Monica Sandy,Isohyperthermic,Typic Ustipsamments 61 15 5.4 3.7 5.00 82.18 16 262 9.32 3 49
San Jose A Not classified 60 17 1.4 7.0 4.08 67.47 7 117 8.25 4 67
Capullo Coarse-loamy,Isohyperthermic, Typic Pelluderts 300 23 2.0 1.0 9.11 30.36 26 87 8.93 21 70
San Antonio Coarse-loamy,Isohyperthermic,Fluventic Hapludolls 321 61 5.7 2.8 33.86 105.48 73 227 9.67 27 84
Buenos Aires Clayey,Isohyperthermic,Typic Pelluderts 540 30 6.4 2.4 10.35 19.17 59 109 9.42 47 87
Maria del Carmen Clayey,Isohyperthermic,Typic Dystropepts 520 30 5.6 2.5 14.65 28.16 83 160 9.42 45 87
La Trinidad Coarse-loamy,Isohyperthermic,Fluventic Haplustolls 181 16 1.6 1.5 14.97 82.73 49 271 8.80 19 105
Socorro Medial-skeletal,Isohyperthermic,Typic Happludands 341 42 20.5 9.8 8.89 26.06 86 252 10.28 49 144
El Mirador Clayey,Isohyperthermic,Typic Ustipsamments 401 42 11.2 6.5 29.84 74.44 101 252 9.79 62 155
San Patricio Medial,Isohyperthermic,Typic Fulvudands 81 29 3.9 2.8 11.93 147.30 8 99 9.44 13 160
La Cuchilla Medial,Isohyperthermic,Typic Hapludands 101 70 25.5 14.4 6.48 64.20 65 644 10.36 23 228
Malta Sandy,Isohyperthermic,Fluventic Haplustolls 121 35 3.3 2.4 14.96 123.66 36 298 9.32 34 281

42
(Continued from previous page)
†Extracted with acid oxalate solution
San Jose B Not classified 101 27 4.5 1.8 7.73 128.87 30 297 8.64 31 307
Buganvilia Medial,Isohyperthermic,Typic Fulvudands 161 53 24.0 12.6 10.66 66.24 58 360 10.02 53 329
Cadiz Medial,Isohyperthermic,Eutric Hapludands 240 57 25.2 13.2 17.52 73.02 98 408 9.94 90 375
Velasquez Coarse-loamy,Isohyperthermic, Typic Fulvudands 181 79 32.0 17.4 10.02 55.41 104 575 10.25 83 459
Boton Blanco Sandy,Isohyperthermic,Typic Ustifluvents 60 26 3.6 2.8 10.02 166.95 11 183 9.63 36 600
Puyumate Fine-loamy,Isohyperthermic, Typic Fulvudands 141 68 25.6 13.5 10.53 74.66 73 518 10.29 130 922
-------------- non-volcanic soils -----------------------
Cecil Clayey, Kaolinitic,Thermic,Typic Kanhapludults 160 16 2.0 1.0 9.11 56.94 2 13 8.20 0 0
El Rama Not classified (Probably an Oxisol) 401 57 1.7 0.0 5.77 14.39 24 60 8.37 5 12
La Valla Not classified (Probably a Vertisol) 600 27 1.8 1.0 62.96 104.86 62 103 8.42 32 53
Tempake Not classified (Probably a Vertisol) 341 69 4.2 2.0 24.22 71.00 29 85 8.15 11 32
Fertimar Not classified (Probably a Vertisol) 682 24 1.5 0.0 41.79 61.28 55 81 8.16 18 26

43
Table 2.2: Langmuir isotherm parameters for the soils studied
Order Soil name K bB † R2 ‡
Alfisols Las Rosas 0.249 13 0.9868
Andisols La Cuchilla 0.128 23 0.9879
Socorro 0.119 49 0.9932
Cadiz 0.050 90 0.9373
Buganvilia 0.072 53 0.8888
Puyumate 0.014 130 0.6941
Velasquez 0.054 83 0.8920
Entisols Santa Monica 0.217 3 0.9715
San Jose A 1.483 4 0.6729
La Felicidad 0.126 14 0.8378
La Trinidad 0.101 19 0.9505
San Jose FA 0.025 31 0.7988
Boton Blanco 0.030 36 0.9120
Maria del Carmen 0.086 45 0.9176
Mirador 0.058 62 0.9899
Mollisols Maria Linda 0.714 5 0.8777
Blanca Victoria 0.104 6 0.9761
San Patricio 0.103 13 0.9178
Chaparral 0.099 13 0.8354
San Francisco 0.070 14 0.7205
San Antonio 0.131 27 0.9651
Malta 0.062 34 0.7619
Vertisols Colombita 0.456 16 0.7806
Capullo 0.076 21 0.9319
Buenos Aires 0.037 47 0.8977
Ultisol Cecil 3.602 <1 0.9985
Oxisol § El Rama 0.587 7 0.9261
Vertisol § La Valla 0.074 32 0.8866
Tempake 0.867 13 0.9968
Fertimar 0.249 18 0.9583
† bB: maximum adsorption capacity [mg B kg-1 soil]
‡: Goodness of fit for the Langmuir isotherm equation
§: Probable order
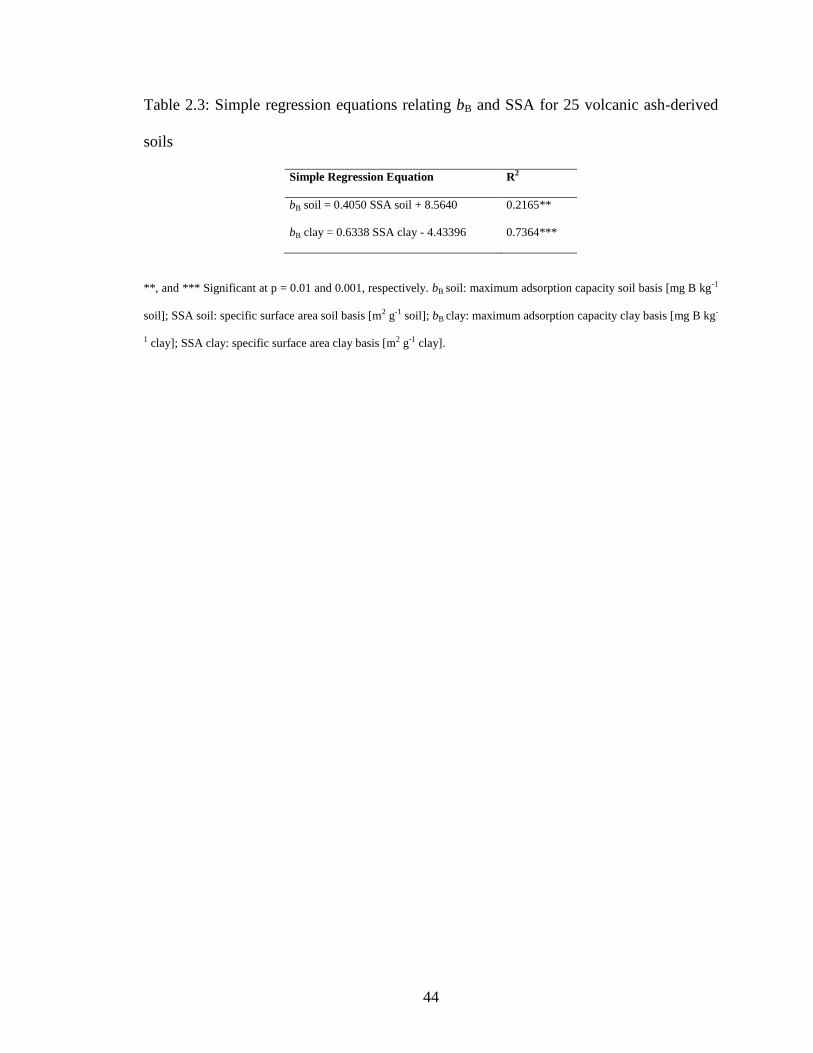
44
Table 2.3: Simple regression equations relating bB and SSA for 25 volcanic ash-derived
soils
Simple Regression Equation R2
bB soil = 0.4050 SSA soil + 8.5640 0.2165**
bB clay = 0.6338 SSA clay - 4.43396 0.7364***
**, and *** Significant at p = 0.01 and 0.001, respectively. bB soil: maximum adsorption capacity soil basis [mg B kg-1
soil]; SSA soil: specific surface area soil basis [m2 g-1 soil]; bB clay: maximum adsorption capacity clay basis [mg B kg-
1 clay]; SSA clay: specific surface area clay basis [m2 g-1 clay].

45
Table 2.4: Multiple linear regression models relating SSA with soil properties
Overall
R2 = 0.8837
< 200 g clay kg-1
R2 = 0.9658
> 200 g clay kg-1
R2 = 0.7008
Variable Coefficients
(Intercept) -9.4211 -21.7760* -20.5769
Clay 0.8942***
4.8555**
1.0791*
SOM -2.8268 9.4203* -4.6487
Al 26.5814***
-5.8398 30.3201**
ECEC 2.1117***
-2.2525* 2.4847
*
*,**, and *** Significant at p = 0.1, 0.01 and 0.001, respectively.

46
Table 2.5: Regression analysis between selected variables and bB for 25 volcanic ash-
derived soils
Simple Regression Equation R2
bB soil = 0.077 allo + 19.838 0.2905**
bB soil = 1.074 OM – 7.353 0.3938***
bB soil = -0.001 clay + 34.376 4E-5 n.s.
**, and *** Significant at p = 0.01 and 0.001, respectively. bB soil: maximum adsorption capacity soil basis [mg B kg-1
soil]; allo: allophane content [mg g-1 clay]; OM: organic matter [g kg-1 soil]; clay: clay content [g kg-1 soil].

47
Figure 2.1: Boron adsorbed as a function of solution B concentration for surface soils:
(A) Socorro and (B) San Patricio. Adsorption data are indicated by squares with the solid
line representing the Langmuir adsorption isotherm.
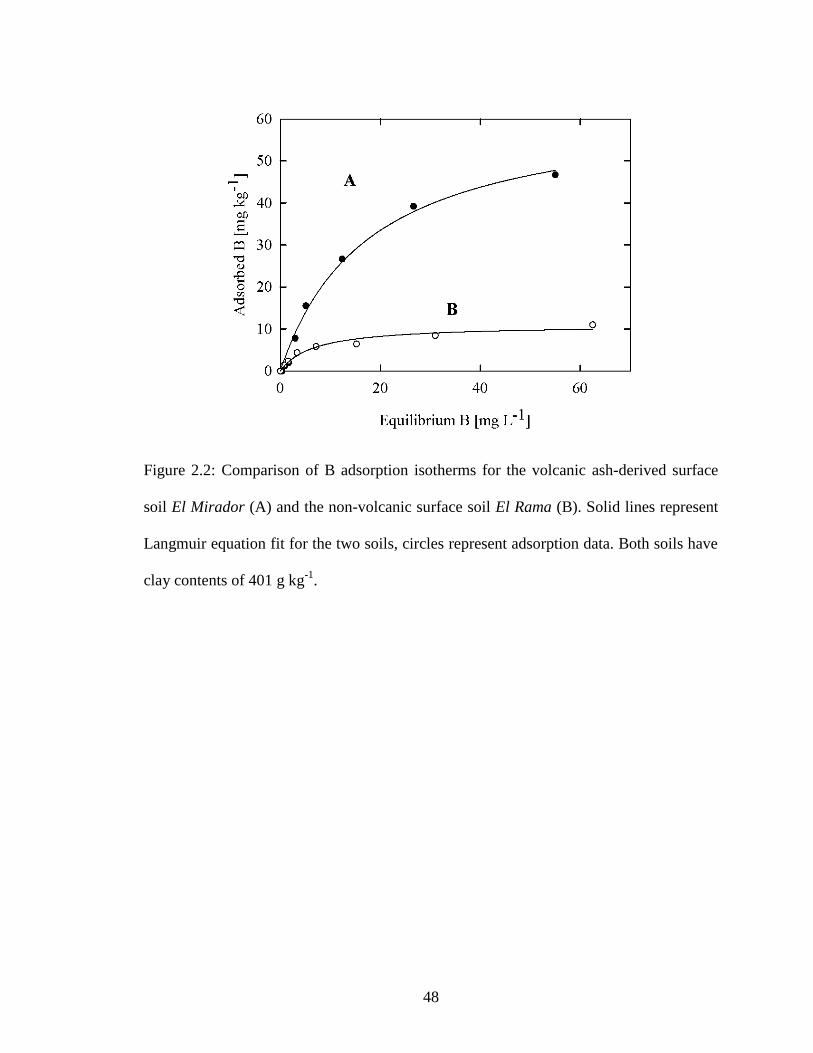
48
Figure 2.2: Comparison of B adsorption isotherms for the volcanic ash-derived surface
soil El Mirador (A) and the non-volcanic surface soil El Rama (B). Solid lines represent
Langmuir equation fit for the two soils, circles represent adsorption data. Both soils have
clay contents of 401 g kg-1
.
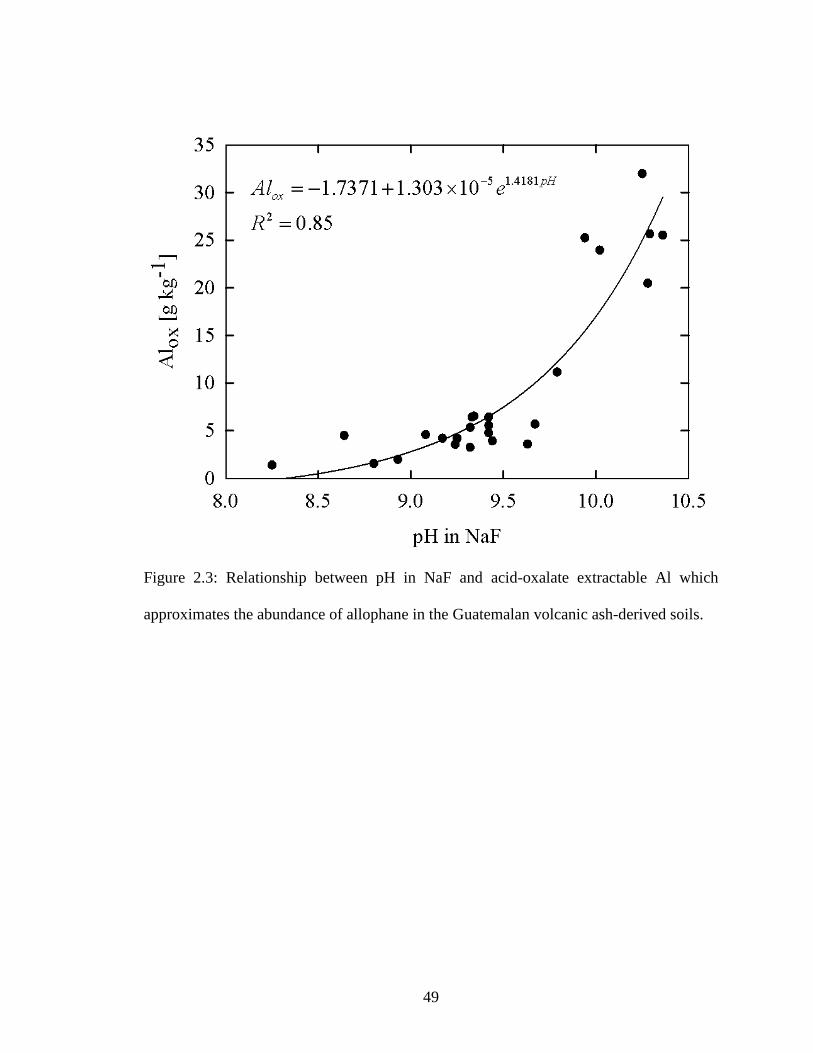
49
Figure 2.3: Relationship between pH in NaF and acid-oxalate extractable Al which
approximates the abundance of allophane in the Guatemalan volcanic ash-derived soils.

50
Figure 2.4: Adsorption-desorption isotherm for the volcanic ash-derived surface soil El
Mirador showing strong hysteresis.

51
Figure 2.5: Relationship between pH in NaF and B desorption index (DI). DI = ndes/nads,
where ndes and nads are the slopes of the linearized desorption and adsorption isotherms,
respectively.

52
Figure 2.6: Relationship between pH in NaF and amount of B adsorbed at equilibrium
with 1.0 mg B L-1
in solution. Black circles represent soils from central Escuintla; white
circles represent soils from eastern and western Escuintla, Suchitepéquez, Retalhuleu and
Santa Rosa. Dotted lines correspond to 95% confidence band (CB), dashed lines
correspond to 95% prediction bands (PB). CB refers to the probability that the true best-
fit line for the population lies within the interval. PB refers to the probability that the
value of the dependent variable for a given value of the independent variable will be
found within the interval range around the linear regression line.

53
Figure 2.7: Ability of linear models to predict B adsorbed at equilibrium with 1.0 mg B L-
1 in solution using pH in NaF as a single variable. Black circles represent initial set of
soils; white circles represent independent samples to test prediction. Dotted lines
correspond to 95% confidence band (CB), dashed lines correspond to 95% prediction
bands (PB). CB refers to the probability that the true best-fit line for the population lies
within the interval. PB refers to the probability that the value of the dependent variable

54
for a given value of the independent variable will be found within the interval range
around the linear regression line. Top figure (2.7a) corresponds to soils from central
Escuintla; bottom figure (2.7b) corresponds to soils from eastern and western Escuintla,
Suchitepéquez, Retalhuleu and Santa Rosa.

55
CHAPTER 3
MINERAL CHARACTERISTICS OF VOLCANIC ASH-DERIVED SOILS
AFFECTING BORON ADSORPTION1
1 Terraza Pira, M.F., M.E. Sumner, A.F. Plante, and A. Thompson. To be submitted to the Soil Science
Society of America Journal.

56
3.1 Abstract
Boron (B) is an essential micronutrient whose availability in soils is governed by
adsorption reactions. Volcanic ash-derived soils are naturally deficient in B, and
maximum adsorption capacities (bB) for this element can be as much as 40 times greater
than for non-volcanic soils. Because the short-range-order (SRO) aluminosilicates
(allophane and imogolite) and Fe (oxy)hydroxides are the mineral surfaces that dominate
the surface reactivity of volcanic ash-derived soils, we hypothesized that these mineral
surfaces are responsible for the wide variation in bB observed, and that other minerals
have negligible participation in B adsorption reactions at a whole-soil level. A set of 23
volcanic ash-derived soils from the Pacific coastal plain of Guatemala was subjected to
mineral characterization to identify mineral surfaces that could explain the wide
variability of bB and soil specific surface area (SSA). Characterization using X-ray
diffraction, selective dissolutions, Mössbauer spectroscopy, and thermal analysis
demonstrated that soil’s mineral reactivity is governed by short-range-order (SRO)
aluminosilicates (allophane and imogolite), Fe (oxy)hydroxydes, and kaolinite with
different degrees of crystallinity. The degree of crystallinity in kaolinite phases —
measured as the temperature of the de-hydroxylation reaction— has an influence on both
SSA and bB. Ferrihydrite is probably the phase dominating SSA and providing affinity to
B adsorption in volcanic ash-influenced soils that do not have allophane levels
sufficiently high to be classified as Andisols. Smectites are present in some soils and,
despite their contribution to SSA, they do not contribute in explaining the variability in
bB, probably because B does not react with planar sites. Cristobalite and orthoclase were
also identified but considered inert in terms of B reactivity.

57
3.2 Introduction
The mechanisms by which boron (B) adsorbs to soil minerals have been well
studied in pure mineral systems. The potential interactions between individual minerals
and organic matter however, make it difficult to predict reactions in whole soils from
pure mineral systems (Gustafsson, 2001). Boron adsorbing surfaces in soils are:
aluminum and iron oxides, magnesium hydroxide, clay minerals, calcium carbonate, and
organic matter (Goldberg, 1997). Isolated soil organic matter adsorbs more B than
mineral soil constituents on a mass basis (Yermiyaho et al., 1988; Gu and Lowe, 1990),
but it can also occlude B reactive adsorption sites on minerals (Harada and Tamai, 1968;
Gu and Lowe, 1992; Marzadori et al., 1991).
The study of B adsorption on volcanic ash-derived soils is a specific concern
because B is an essential trace element that limits the yields of economically important
crops in volcanic regions (Chapter 2). To solve this nutritional problem, soil-B
interactions must be fully understood, not only on isolated soil constituents, but most
importantly within the native soil matrix. Considering that volcanic soils have an
enhanced ability to accumulate organic carbon that exceeds the capacity other clay-rich
soils (Zunino et al., 1982; Shoji et al., 1993), their inherent fertility make them
disproportionately important in terms of food production relative to other soils, despite
their small global abundance on the Earth’s land surface (Parfitt, 2009; Filimonova et al.,
2016).
B forms inner-sphere surface complexes with trigonal and tetrahedral
coordination (Su and Suarez, 1995) on minerals such as short-range-order (SRO) Fe and
Al hydroxides, SRO aluminosilicates (allophane), 2:1 clay minerals, and kaolinite
58
(Beyrouty et al., 1984; Blesa et al., 1984; Goldberg et al., 1993; Su and Suarez, 1995);
and outer-sphere complexes with Fe hydroxides (Peak et al., 2003). The mineral
composition of volcanic ash-derived soils may include all of the above-mentioned
minerals, but mineral surface area is often dominated by SRO aluminosilicates such as
allophane and imogolite. Allophane and imogolite are X-ray amorphous clay-sized
aluminosilicates comprised of hollow nano-spherules or nano-tubules, respectively. Both
consist of an outer gibbsite-like sheet and an inner Si surface (Parfitt, 2009). Boron can
substitute for Si in the inner tetrahedral layer of these nano-scale minerals (Su and
Suarez, 1997) and it can be adsorbed at surface aluminol groups of the gibbsite-like outer
sheet.
The B maximum adsorption capacities (bB) for volcanic ash-derived soils are between
18 and 40 times greater than those of non-volcanic soils (Bingham et al., 1971; Schlscha
et al., 1973; Chapter 2). We hypothesize that SRO aluminosilicates and Fe
(oxy)hydroxides will be related to bB, and that other clay minerals present will have
negligible contribution to B sorption in volcanic ash-derived soils, despite their individual
adsorption capacities in pure systems. To test this hypothesis, soils with a range of bB
were subjected to mineral composition analysis. The clay fractions of the soils were
subject to X-ray diffraction (XRD), selective dissolutions, 57
Fe Mösbauer spectroscopy,
and thermal analysis to identify mineral phases and relate them with specific surface area
(SSA) and bB.

59
3.3 Materials and methods
Soil description
Surface soils (0-15 cm) from 23 agricultural sites on the south coast of Guatemala
were selected as representative of five soil orders that are present in that area (one
Alfisol, six Andisols, five Entisols, seven Mollisols, and four Vertisols; identified by
Sánchez et al. (1996)). The soils in this region are developed from igneous parent
materials with intermittent and varying inputs of volcanic ash. Boron deficiency occurs
widely on economically important crops growing in these soils. The empirical modeling
of soil B adsorption on these soils is reported elsewhere (Chapter 2), but some selected
characteristics including bB are provided (Table 3.1).
Powder-XRD analysis
Clay fractions (< 2 μm) of the 23 soils were treated with 30% H2O2 to remove
organic matter (Kunze and Dixon, 1986) prior to XRD. Analysis of oriented clay
aggregates on glass slides was performed using a Bruker D8 Advanced Diffractometer
(CoKα radiation) at a potential of 45 kV and a current of 45 mA, with a scanning rate of
0.01° 2θ s-1
over a range of 2–70º 2θ. Identification of XRD crystalline phases was
performed using the EVA software package (Bruker).
Selective dissolutions
Selective dissolutions with ammonium oxalate and sodium pyrophosphate
reagents were used to estimate the percentages of allophane/imogolite and organically-
associated Al, Fe, and Si in the clay fraction of the soils (Wada, 1989). For the acid-

60
oxalate dissolution, a soil sample (0.25 g, fine-grind, air dried) was mixed with 25 mL of
0.2 mol L-1
acid oxalate reagent (0.2 mol L-1
of ammonium oxalate [(NH4)₂C₂O₄] and 0.2
mol L-1
of oxalic acid [H₂C₂O₄], with pH adjusted to 3±0.05) in a 50 mL centrifuge tube.
The tubes were placed in a shaker and shaken for 4 hours in the dark at room
temperature. For the sodium pyrophosphate dissolution a soil sample (0.5 g, fine-grind,
air dried) was mixed with 30 mL of 0.1 mol L-1
sodium pyrophosphate (Na4P2O7)
(adjusted to pH 10±0.05) in a 50-mL centrifuge tube. The tubes were placed in a shaker
and shaken for 16 hours at room temperature (23°C). After both extraction procedures
samples were centrifuged and filtered, and the supernatant was analyzed to quantify Fe,
Al, and Si using ICP-MS on a 1:1000 diluted extract. Five replicates of a single sample
were made to assess the variability of the extraction protocol.
Allophane/imogolite abundance was calculated based on the Al:Si ratio for each
sample from the oxalate-Al (Alo), pyrophosphate-Al (Alp), and oxalate-Si (Sio) contents.
The (Alo– Alp)/Sio ratio multiplied by the molar ratio (28/27 for Al:Si) gives an estimate
of the Al:Si ratio of allophane/imogolite content in the soil (Soil Survey Staff, 2014). The
soil content of allophane/imogolite was calculated using its structural weight formula
based on the estimated Al:Si ratio for each sample as follows: allophane has the general
chemical formula SiyAl4O6+2y ∙ n H2O, where 1.6 ≤ y ≤ 4, n ≥ 5; and imogolite has the
chemical formula Si2Al4O10 ∙ 5 H2O (Sposito, 2008), thus the Al:Si ratio can vary from
about 0.9 to 2.0, and the structural formula for each sample was estimated based on its
measured Al:Si ratio.
Dithionite-citrate reagent was used to selectively dissolve all Fe (oxy)hydroxides
(i.e., free Fe oxides) (Wada, 1989). For this extraction a soil sample (0.75 g, fine-grind,

61
air dried) was mixed with 0.4 g of sodium dithionite (Na2S2O4) and 25 mL of 0.5 M
sodium citrate (Na3C6H5O7.2H2O) solution in a 50 mL centrifuge tube. The tubes were
placed in a shaker and shaken overnight (12 – 16 hours) at room temperature. After the
extraction, samples were centrifuged and filtered, and the supernatant was analyzed to
quantify Fe, Al, and Si using ICP-MS on a 1:1000 diluted extract. Five replicates of a
single sample were made to assess the variability of the extraction protocol.
Thermal analysis of the mineral clay fraction
Thermal analysis was carried out on clay fractions (< 2 μm) of the 23 soils after
the removal of organic matter with 30% H2O2 using a Netzsch simultaneous heat flux
thermal analyzer (STA 409PC Luxx) equipped with a type-S (Pt/PtRh) TG–DSC sample
carrier supporting a PtRh10-Pt thermocouple (Netzsch-Gerätebau GmbH, Selb,
Germany). Samples were heated from ambient (25 °C) to 1000°C in a furnace
atmosphere consisting of synthetic air (80% N2 and 20% O2) flowing at 30 mL/min. The
evolved gas was analyzed (EGA) by infra-red gas analyzer (IRGA) coupled with the
thermal analyzer to measure CO2 and H2O evolution from the heating reactions. Mineral
phases were identified using thermogravimetry data (mass loss associated with thermal
reactions) and water evolution from EGA, coupled with differential scanning calormetry
(DSC) data. Peaks of H2O were fitted using PeakFit software (SYSTAT) to estimate the
fractions of water that were evolved from different dehydroxylation reactions depending
on mineral thermal stability.
Although the samples were treated with H2O2 before the thermal analysis was
performed, there is still a fraction of C that cannot be removed by oxidation with this

62
chemical method (Plante et al., 2004). Therefore, carbon dioxide evolution was recorded
showing that the total C remaining was negligible in terms of percent mass loss during
the thermal analysis run, so the mass loss could be completely attributed to H2O
evolution.
57Fe Mössbauer Spectroscopy
The Fe mineral composition of four representative sites (Velasquez, La Felicidad,
Las Rosas, and Cadiz) was evaluated using transmission 57
Fe Mössbauer (MB)
spectroscopy with a variable temperature He-cooled system with a 1024 channel detector
at three collection temperatures (295K, 77K, and 4K) using a 57
Co source (~50 mCi)
embedded in a Rh matrix kept at room temperature. Spectral fitting was performed using
the Voigt-based fitting method of Rancourt and Ping (1991) with Recoil software, and the
relative abundance of each Fe mineral phase was determined as a fraction of the total Fe
spectral area.
3.4 Results and discussion
The main mineral phases identified in decreasing order of reactivity are: (i) SRO
aluminosilicates (allophane and imogolite), (ii) Fe oxy(hydroxydes) with different
degrees of crystallinity, (iii) 1:1 clay minerals (kaolinite and halloysite), (iv) 2:1 clay
minerals (from the smectite group, most likely montmorillonite), and (v) primary
minerals from the K-feldspar group (orthoclase) and silica polymorphs (cristobalite). For
all these phases, the levels of reactivity that they confer to the soils in terms of SSA and
bB are discussed below.

63
SRO aluminosilicates
Selective dissolutions with acid oxalate and Na-pyrophosphate were used to
quantify SRO aluminosilicates (e.g. allophane and imogolite) (Table 3.2). The SRO
aluminosilicates content ranged from low values of 2.6 g kg-1
for the Capullo soil, to
102.6 g kg-1
for the Velasquez soil, which are comparable to the allophane content in
surface horizons of Andisols from various climatic zones (Bartoli et al., 2007). The
allophane and imogolite content has an exponential decay relationship with the ratio of
Al pool extracted by Na-pyrophosphate and oxalate reagents (Alp/Alo) (Figure 3.1). Na-
pyrophosphate selectively extracts Al associated with organic compounds. The higher
points in the graph correspond to the soils classified as Andisols, whereas the right tail
comprises the remaining soils with less andic character.
Because it is not possible to distinguish between allophane and imogolite using
selective dissolutions, thermal analysis techniques can be used to differentiate between
these SRO aluminosilicates (Dahlgren, 1994). Imogolite (nano-tubules) have a more rigid
structure than allophane (nano-spheres). This makes imogolite’s structural water (surface
hydroxyl groups) more thermally stable (Russel et al., 1969). Both minerals show an
endothermic peak between 50°C and 200°C as they lose physically adsorbed water, but
imogolite undergoes a de-hydroxylation reaction that yields a characteristic endothermic
peak between 390°C and 440°C (Yoshinaga and Aomine, 1962; Parfitt, 1990). DSC
curves and H2O evolution peaks from six soils (Buganvilia, Velasquez, Socorro, La
Cuchilla, Puyumate, and Cadiz) showed an endotherm shoulder at 405 °C indicating
presence of imogolite nano-tubules. For the other 17 soils imogolite was not identified,
suggesting that only allophane was present.

64
The deconvoluted H2O peaks were matched with the de-hydroxylation
temperatures for each mineral, and the fraction of the total area for each peak was used to
estimate how much water was evolved from each mineral phase (e.g. Figure 3.2). Water
evolution was successfully modeled (R2 = 0.999) as the sum of several hidden peaks with
different temperature maxima, and phases’ individual abundance was assigned by
matching these temperatures with DSC reaction temperatures. For instance, for the
Puyumate soil two water peaks (168 and 282 °C) correspond to 81.5% of evolved water
from total SRO aluminosilicates, one peak (400 °C) corresponded to 5.1% of evolved
water from imogolite, and one peak (474 °C) corresponded to 13.4% of evolved water
from kaolinite (Figure 3.2). In general, water from imogolite de-hydroxylation was
observed only in 5 samples ranging from 2.2 to 10.1% of the total water evolved (Table
3.3). The physically adsorbed water loss from total SRO aluminosilicates and the de-
hydroxylation of 1:1 clays was observed in all soils. The percentage of water loss from
SRO aluminosilicates ranged from 46.2 to 87.9%; and the 1:1 clay minerals de-
hydroxylation ranged from 2.0 to 60.4% of the total water evolved.
Both halloysite and smectites can lose physically adsorbed water at the same
temperature range as allophane and imogolite, but there is no experimental or analytical
procedure available to differentiate between them. Despite this limitation, the correlation
between extractable SRO aluminosilicates and mass loss (H2O) improved substantially
when water peaks were used to correct the thermogravimetric data. The amount of water
evolved as a percentage of original clay mass is exponentially correlated (R2 = 0.82) with
the amount of extractable SRO aluminosilicates (Figure 3.3), indicating the validity of
these two analytical techniques to quantify andic character in volcanic ash-derived soils.

65
Effect of SRO aluminosilicates on surface properties
Correlation coefficients between the amount of SRO aluminosilicates and clay
properties were positive and highly significant. For clay B adsorption capacity the
coefficient is 0.65 (P < 0.001) and for clay SSA it is 0.88 (P < 0.001). These strong
statistical relations suggest that SRO aluminosilicates govern the B surface reactivity
properties of these soils even when present in small amounts.
The gibbsite-like outer surface of SRO aluminosilicates have hydroxyl functional
groups that readily react with B to form complexes. Both imogolite and allophane
develop surface charge from unsatisfied oxygen ion bond valences, similar to the surfaces
of kaolinite and halloysite, but the point of zero charge for this functional groups is
higher for imogolite (at pH 8.4) and allophane (between 5.4 to 8.0) (Sposito, 2008). This
suggests that allophane and imogolite have two characteristics that make them
substantially more important in terms of B adsorption compared to other
aluminosilicates: (i) they have a large surface area, and (ii) at circumneutral pH values
they have higher abundance of hydroxyl surface functional groups to react with B via
ligand exchange reactions.
Fe species
Contrary to what was expected, dithionite-citrate extractable Fe (Fed) was lower
than oxalate extractable Fe (Feo) in our soils (Table 3.2). The oxalate solution usually
solubilizes only the SRO Fe fraction (Birkeland et al., 1989), whereas dithionite-citrate
solution dissolves the total free iron oxides. Our results agree with those reported by
Vodyanitskii et al. (2007) and Meijer et al. (2007) who found Feo/Fed ratios higher than
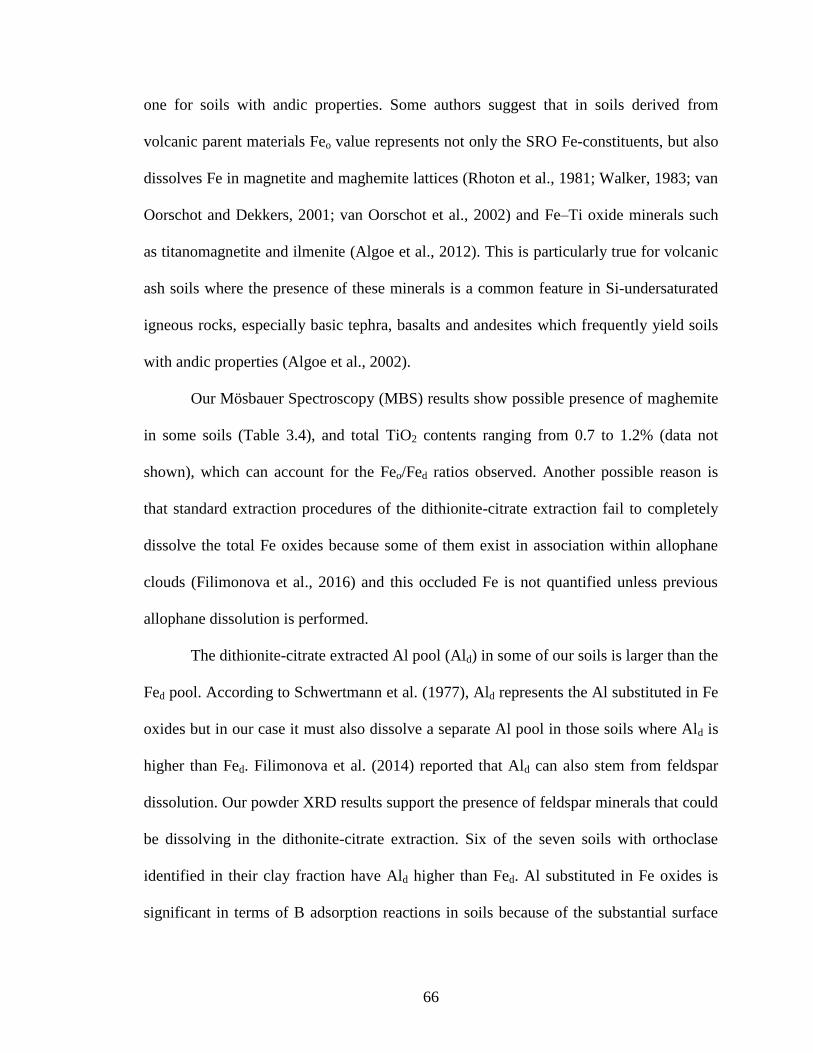
66
one for soils with andic properties. Some authors suggest that in soils derived from
volcanic parent materials Feo value represents not only the SRO Fe-constituents, but also
dissolves Fe in magnetite and maghemite lattices (Rhoton et al., 1981; Walker, 1983; van
Oorschot and Dekkers, 2001; van Oorschot et al., 2002) and Fe–Ti oxide minerals such
as titanomagnetite and ilmenite (Algoe et al., 2012). This is particularly true for volcanic
ash soils where the presence of these minerals is a common feature in Si-undersaturated
igneous rocks, especially basic tephra, basalts and andesites which frequently yield soils
with andic properties (Algoe et al., 2002).
Our Mösbauer Spectroscopy (MBS) results show possible presence of maghemite
in some soils (Table 3.4), and total TiO2 contents ranging from 0.7 to 1.2% (data not
shown), which can account for the Feo/Fed ratios observed. Another possible reason is
that standard extraction procedures of the dithionite-citrate extraction fail to completely
dissolve the total Fe oxides because some of them exist in association within allophane
clouds (Filimonova et al., 2016) and this occluded Fe is not quantified unless previous
allophane dissolution is performed.
The dithionite-citrate extracted Al pool (Ald) in some of our soils is larger than the
Fed pool. According to Schwertmann et al. (1977), Ald represents the Al substituted in Fe
oxides but in our case it must also dissolve a separate Al pool in those soils where Ald is
higher than Fed. Filimonova et al. (2014) reported that Ald can also stem from feldspar
dissolution. Our powder XRD results support the presence of feldspar minerals that could
be dissolving in the dithonite-citrate extraction. Six of the seven soils with orthoclase
identified in their clay fraction have Ald higher than Fed. Al substituted in Fe oxides is
significant in terms of B adsorption reactions in soils because of the substantial surface

67
area and hydroxyl functional groups on its surface, but feldspars are not considered here
to contribute in whole soil B reactions.
Using the specificity of 57
Fe MBS, four samples were selected to expand the
understanding of Fe phases that are relevant in terms of B adsorption and that were
difficult to detect by powder XRD and selective dissolutions. The crystal size and
bonding environment (or solid-phase speciation) of Fe govern its influence on soil
reactivity to a much larger extent than its total abundance. SRO and small particle sizes
distinguish the most reactive, high surface area Fe components from larger bulk Fe-
oxides (Bonneville et al., 2004; Roden, 2006).
The MBS spectra suggest that the Fe(III)-(oxy)hydroxide solid phases in these
soils exhibit a continuum of crystallinities and they account for the majority of total Fe in
the samples evaluated (Table 3.4). The Fe from silicates structures and organic matter
associations was observed to have a lower contribution of the total Fe, accounting only
for 4.6, 32.3, 17.2, and 4.3% of total Fe for soils Cadiz, La Felicidad, Velasquez, and Las
Rosas, respectively.
Hematite was clearly identified in soils, La Felicidad and Velasquez, accounting
for 12.6 and 22.1% of total Fe, respectively. On the other hand, the phase identified for
soils, Cadiz and Las Rosas, could be either hematite or maghemite (Table 3.4).
Ferrihydrite was clearly identified in the four samples, accounting for the majority of
total Fe in the soil. The SRO Fe(oxy)hydroxides (ferrihydrite/nano-goethite) were
divided depending on their degree of crystallinity (Table 3.5). Those at the more
crystalline end were recognized as microcrystalline structures that order at room
temperature (295 K). In the middle of the crystallinity continuum, were the sextets that

68
order at 77 K and at liquid helium temperature (LHT = 4.2 K). At the most disordered
end of the crystallinity continuum, were the collapsed sextets at 4.2 K which are assigned
to nano-FeIII-oxyhydroxides that need even lower temperatures to order.
Effect of SRO Fe (oxy)hydroxides on surface properties
Ferrihydrite represents the most highly reactive Fe phase in this set of soils. It is
characterized by a high surface-to-volume ratio in nanoparticles and an enhanced surface
charge density, which expectedly facilitate the ligand exchange reactions (Filimonova et
al., 2016) of B adsorption. Assuming a density of 4.0 g cm-3
for ferrihydrite (Childs,
1985), and 2.75 g cm-3
for allophane (Wada and Wada, 1977), we calculated the
volumetric ratio ‘‘ferrihydrite:allophane” (Filimonova et al., 2016) which is lower than
one for Andisols (0.3 for both Cadiz and Velasquez), and higher than one for non-
Andisols volcanic-influenced soils (1.5 and 4.5 for La Felicidad and Las Rosas,
respectively). These observed values can serve as an explanation of how ferrihydrite is an
important mineral surface for B adsorption reactions in volcanic-influenced soils that do
not have allophane levels sufficiently high to be classified as Andisols.
Another parameter evaluated was the “crystallinity index” (CI), which was
calculated as the ratio between Fe(III)(oxy)hydroxides ordered at 77 K and 4 K (Table
3.4). Although the two Andisols evaluated have similar SSA and allophane contents, the
one with lower CI has a higher bB. The other two soils (non-Andisols) have similar bB
and allophane contents, and the one with lower CI has a higher SSA. This illustrates how
SRO Fe phases may be actively contributing to both B adsorption reactions and total SSA
for volcanic ash-derived soils.
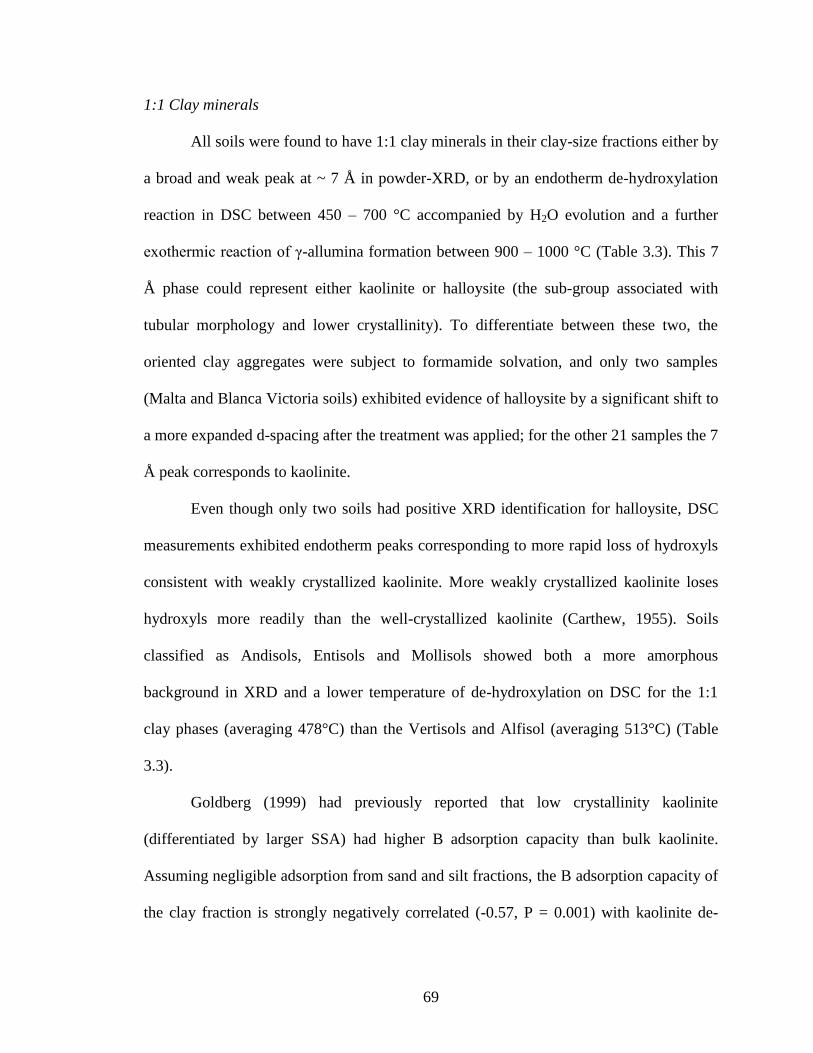
69
1:1 Clay minerals
All soils were found to have 1:1 clay minerals in their clay-size fractions either by
a broad and weak peak at ~ 7 Å in powder-XRD, or by an endotherm de-hydroxylation
reaction in DSC between 450 – 700 °C accompanied by H2O evolution and a further
exothermic reaction of γ-allumina formation between 900 – 1000 °C (Table 3.3). This 7
Å phase could represent either kaolinite or halloysite (the sub-group associated with
tubular morphology and lower crystallinity). To differentiate between these two, the
oriented clay aggregates were subject to formamide solvation, and only two samples
(Malta and Blanca Victoria soils) exhibited evidence of halloysite by a significant shift to
a more expanded d-spacing after the treatment was applied; for the other 21 samples the 7
Å peak corresponds to kaolinite.
Even though only two soils had positive XRD identification for halloysite, DSC
measurements exhibited endotherm peaks corresponding to more rapid loss of hydroxyls
consistent with weakly crystallized kaolinite. More weakly crystallized kaolinite loses
hydroxyls more readily than the well-crystallized kaolinite (Carthew, 1955). Soils
classified as Andisols, Entisols and Mollisols showed both a more amorphous
background in XRD and a lower temperature of de-hydroxylation on DSC for the 1:1
clay phases (averaging 478°C) than the Vertisols and Alfisol (averaging 513°C) (Table
3.3).
Goldberg (1999) had previously reported that low crystallinity kaolinite
(differentiated by larger SSA) had higher B adsorption capacity than bulk kaolinite.
Assuming negligible adsorption from sand and silt fractions, the B adsorption capacity of
the clay fraction is strongly negatively correlated (-0.57, P = 0.001) with kaolinite de-

70
hydroxylation peak temperature. A correlation coefficient of -0.56 was observed for this
temperature and the clay SSA (Table 3.2). Our results agree with those of Goldberg
(1999). The negative correlation explains that a lower crystallinity represented here as a
lower de-hydroxylation temperature, is associated with larger SSA and higher B
adsorption capacity. Because B forms inner-sphere complexes via ligand exchange
reactions with the edges hydroxyl groups (Goldberg, 1993) therefore less crystalline
kaolinites have more exposed surface functional groups with higher potential for
complexation reactions with B.
Despite the absence of halloysite in the majority of our soils, different degrees of
crystallinity of kaolinite are responsible for differences in observed soil bB. Despite the
low SSA of kaolinites (5 to 40 m2 g
-1; Sposito, 2008), these results suggest that these
mineral phases have an important contribution in explaining bB variability at a whole soil
level.
2:1 Clay minerals
The clay fractions of 10 soils exhibit a broad ~ 10 Å reflection which expands
upon ethylene glycol solvation to ~ 17 Å in powder XRD, confirming the presence of
smectite (most probably montmorillonite) (Table 3.2). Only La Trinidad soil was
confirmed to have a smectite phase by thermal analysis, showing a broad and weak
endotherm de-hydroxylation peak at 660 °C (independent of the peak attributed to 1:1
clay minerals) that was attributed to a 2:1 clay phase. In addition, two more soils (Cadiz
and Boton Blanco) also presented an endotherm at 660 and 630°C, respectively, that can
be attributed to the presence of smectite.

71
Smectite phases are present in small amounts in the clay fractions of the soils in
which they were identified based on the evidence provided by the broadness and
weakness of the XRD peaks and the small proportion of water evolved in the thermal
analysis. Only 10.4, 5.6, and 4.5% of the water loss was attributed to de-hydroxylation of
smectites in soils from La Trinidad, Cadiz, and Boton Blanco, respectively (Table 3.6).
The presence of smectites in soils confers substantial surface area (SSA for pure
smectites ranges from about 40 to 800 m2 g
-1) but this surface is not directly available for
B complex formation because B will not react with the basal permanent charge.
To test the hypothesis that smectite SSA does not participate in B adsorption
reactions, the soils were divided into two groups based on smectite phase identification
(either by XRD or by thermal analysis), and correlation analysis between the clay SSA
and the clay bB was performed partitioning between smectitic and non-smectitic soils. For
the group of smectitic soils the correlation was not statistically significant (P = 0.47), but
it was significant (P = 0.07) for the group of non-smectitic soils. These statistical
correlations suggest that volcanic ash-derived soils with smectite phases in their clay
fraction have large SSA that is not directly available for complexation reactions with B.
Furthermore, the mechanisms of B adsorption by montmorillonite and
montmorillonitic soils correspond to a non-specific, weaker, and less stable adsorption
based on outer-sphere surface complexation reactions (Goldberg, 1993). Even when
montmorillonite has B adsorption capacities of a magnitude comparable to those reported
for other minerals, the complexes formed are less stable because of the nature of the
chemical bonds involved in the reactions. Therefore, smectitic soils have large SSA, but
maximum B adsorption is not as large as for the soils dominated by SRO aluminosilicates

72
with comparable SSA. For instance, La Felicidad soil (smectitic) has a SSA of 62 mg2 g
-1
and a bB of 14 mg B kg-1
, whereas La Cuchilla soil (non-smectitic) has a SSA of 65 mg2
g-1
and a bB of 23 mg B kg-1
. This illustrates the contribution of mineral phases
(allophane, imogolite, and ferrihydrite) to SSA comparable to that of smectites, but with
greater B affinity must explain the difference on B adsorption capacity of soils with
almost identical SSA.
Primary minerals
Primary minerals identified in the soils are not considered to contribute to any
significant extent to B adsorption reactions in volcanic ash-derived soils. From powder-
XRD analysis, a broad and asymmetrical peak at 4.1 Å was the only identifying peak
attributed to disordered cristobalite in three soils (San Patricio, Colombita, and Cadiz;
Table 3.2). Powder-XRD was the only analytical technique that evidenced the presence
of this silica polymorph as has a fairly flat DSC pattern (Jones and Segnit, 1971).
Cristobalite has been reported to naturally occur in various size fractions (predominantly
clay) of several soils derived from volcanic ash in South America and Costa Rica
(Wright, 1964; Mejia et al., 1968; Besoain, 1969; Calhoun et al., 1972; Cortes and
Franzmeier, 1972). It is probably a component of the parent erupted magma from which
these soils developed. Despite its presence in the clay fraction of these three soils it has
low relevance in terms of physicochemical reactivity. Cristobalite lacks significant
isomorphic substitution for Si, and has very few broken Si-O bonds and Si-OH (silanol)
groups around particle edges, resulting in almost no surface charge.
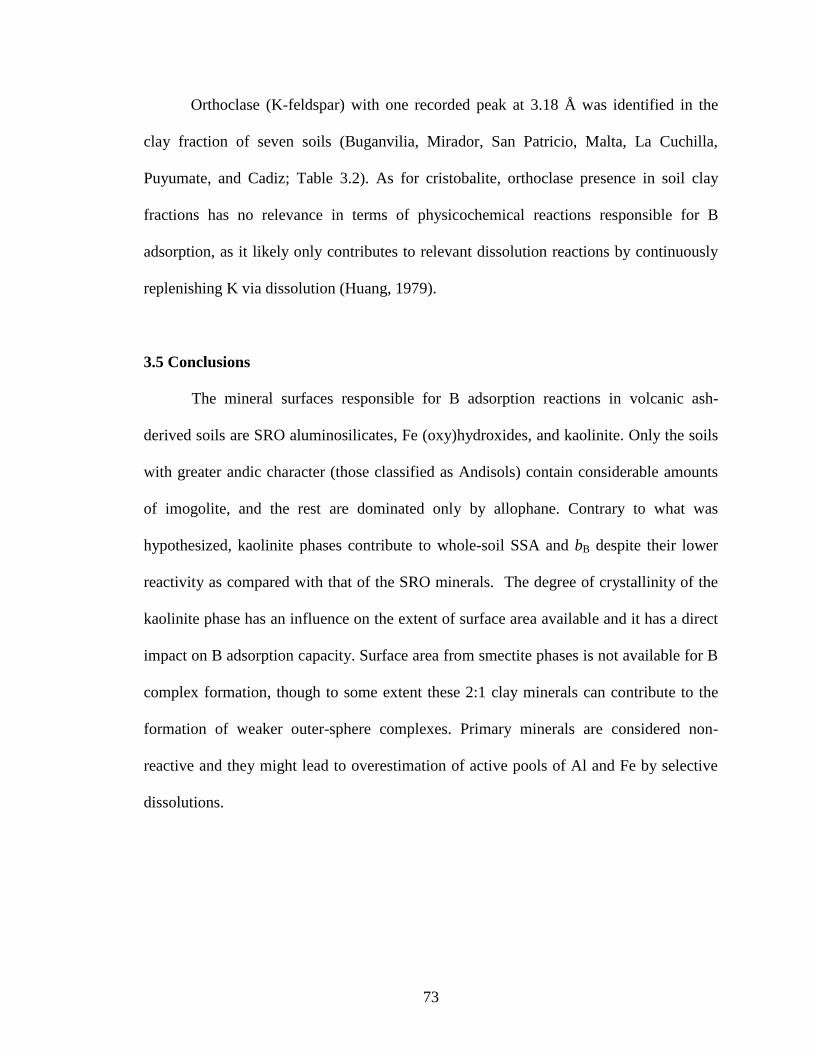
73
Orthoclase (K-feldspar) with one recorded peak at 3.18 Å was identified in the
clay fraction of seven soils (Buganvilia, Mirador, San Patricio, Malta, La Cuchilla,
Puyumate, and Cadiz; Table 3.2). As for cristobalite, orthoclase presence in soil clay
fractions has no relevance in terms of physicochemical reactions responsible for B
adsorption, as it likely only contributes to relevant dissolution reactions by continuously
replenishing K via dissolution (Huang, 1979).
3.5 Conclusions
The mineral surfaces responsible for B adsorption reactions in volcanic ash-
derived soils are SRO aluminosilicates, Fe (oxy)hydroxides, and kaolinite. Only the soils
with greater andic character (those classified as Andisols) contain considerable amounts
of imogolite, and the rest are dominated only by allophane. Contrary to what was
hypothesized, kaolinite phases contribute to whole-soil SSA and bB despite their lower
reactivity as compared with that of the SRO minerals. The degree of crystallinity of the
kaolinite phase has an influence on the extent of surface area available and it has a direct
impact on B adsorption capacity. Surface area from smectite phases is not available for B
complex formation, though to some extent these 2:1 clay minerals can contribute to the
formation of weaker outer-sphere complexes. Primary minerals are considered non-
reactive and they might lead to overestimation of active pools of Al and Fe by selective
dissolutions.

74
References
Algoe, C., G. Stoops, R.E. Vandenberghe, and E. Van Ranst. 2012. Selective dissolution
of Fe–Ti oxides — Extractable iron as a criterion for andic properties revisited.
Catena 92:49–54.
Bartoli, F., A.J. Poulenard, and B.E. Schouller. 2007. Influence of allophane and organic
matter contents on surface properties of Andosols. Eur. J. Soil Sci. 58:450-464.
Besoain, E.M. 1969. Clay minerals of volcanic ash soils. Para. Bl. 1-16. In H.W.
Fassbender (Coordinator). Panel on volcanic ash soils in Latin America. Inter-
American Inst. Agric. Sci. of OAS, Turrialba, Costa Rica.
Beyrouty, C.A., G.E. van Scoyoc, and J.R. Feldkamp. 1984. Evidence supporting specific
adsorption of boron on synthetic aluminum hydroxides. Soil Sci. Soc. Am. J.
48:284-287.
Birkeland, P.W., R.M. Burke, and J.B. Benedict. 1989. Pedogenic gradients of iron and
aluminum accumulation and phosphorus depletion in arctic and alpine soils as a
function of time and climate. Quat. Res. 32:193–204.
Blesa, M.A., A.J.G. Maroto, and A.E. Regazzoni. 1984. Boric acid adsorption on
magnetite and zirconium dioxide. J. Colloid Interface Sci. 99:32-40.
Bonneville, S., P. Van Cappellen, and T. Behrends. 2004. Microbial reduction of iron(III)
oxyhydroxides: effects of mineral solubility and availability. Chem. Geol.
212:255–268.
Calhoun, F.G., V.W. Carlisle, and C. Luna Z. 1972. Properties and genesis of selected
Colombian andosols. Soil Sci. Soc. Am. Proc. 36:480-485.

75
Carthew, A.R. 1955. The quantitative estimation of kaolinite by DTA. Am. Miner.
40:107-117.
Childs C. W. 1985. Towards Understanding Soil Mineralogy. II. Notes on Ferrihydrite.
NZ Soil Bureau Laboratory Report CM7, NZ Soil Bureau, Lower Hutt, New
Zealand.
Cortes, A., and D.P. Franzmeier. 1972. Weathering of primary minerals in volcanic ash-
derived soils of the central cordillera of Colombia. Geoderma 9:165-176.
Dahlgren, R.A. 1994. Quantification of allophane and imogolite. In Amonette, J.E., and
L.W. Zelazny, eds., Quantitative Methods in Soil Mineralogy. Soil Sci. Soc. Am.
Miscellaneous Publication. Madison, WI.
Filimonova, S., A. Hilscher, and I. Kögel-Knabner. 2014. Nano-structural and chemical
characterization of charred organic matter in a fire-affected Arenosol. Geoderma
232:538-546.
Filimonova, S., S. Kaufhold, F.E. Wagner, W. Häusler, and I. Kögel-Knabner. 2016. The
role of allophane nano-structure and Fe oxide speciation for hosting soil organic
matter in an allophanic Andosol. Geoch. Cosmoch. Acta 180:284-302.
Goldberg, S., H.S. Forster, and E.L. Heick. 1993. Boron adsorption mechanisms on
oxides, clay minerals and soils inferred from ionic strength effects. Soil Sci. Soc.
Am. J. 57:704–708.
Goldberg, S. 1999. Reanalysis of boron adsorption on soils and soil minerals using the
constant capacitance model. Soil Sci. Soc. Am. J. 63:823-829.
Gu, B. and L.E. Lowe. 1990. Studies on the adsorption of boron on humic acids. Can. J.
Soil Sci. 70:305–311.

76
Gustafsson, J.P. 2001. Modelling competitive anion adsorption on oxide minerals and an
allophane-containing soil. Eurp. J. Soil Sci. 52:639-653.
Harada, T. and M. Tamai. 1968. Some factors affecting behavior of boron in soil. I. Some
soil properties affecting boron adsorption of soil. Soil Sci. Plant Nutr. 14:215–
224.
Huang, P.M. 1989. Soil potassium reserves in relation to crop response to potash. Proc.
Workshops Potash and Phosphate Institute of Canada, Saskatoon, Sask. Potash &
Phosphate Inst. of Canada, Saskatoon, Sask.
Jones, J.B., and Segnit, E.R. 1971. The nature of opal I. Nomenclature and constituent
phases. J. Geol. Soc. Aust. 18:57-68.
Kunze, G, and Dixon, J. 1986. Pretreatment for mineralogical analysis. In A. Klute (ed.)
Methods of soil analysis. Part 1. Physical and mineralogical methods. 2nd ed.
Agron. 9:91-100.
Marzadori, C., L. Vittori Antisari, C. Ciavatta, and P. Sequi. 1991. Soil organic matter
influence on adsorption and desorption of boron. Soil Sci. Soc. Am. J. 55:1582–
1585.
Meijer, E.L., Buurman, P., Fraser, A., and Garcia-Rodeja, E., 2007. Extractability and
FTIR characteristics of poorly-ordered minerals in a collection of volcanic ash
soils. In: Arnalds, O., Bartoli, F., Buurman, P., Garcia-Rodeja, E., Oskarsson, H.,
and Stoops, G. (Eds.), Soils of Volcanic Regions of Europe. Springer-Verlag,
Berlin, pp. 155–180.
Mejia, G., H. Kohnke, and J.L. White. 1968. Clay mineralogy of certain soils of
Colombia. Soil Sci. Soc. Am. Proc. 32:665-670.

77
Parfitt, R.L. 2009. Allophane and Imogolite: role in soil biogeochemical processes. Clay
Minerals. 44: 135-155.
Peak, D., G.W. Luther, and D.L. Sparks. 2003. ATR-FTIR spectroscopic studies of boric
acid adsorption on hydrous ferric oxide. Geochimica et Cosmochimica Acta 67:
2551-2560.
Plante, A. F., C. Chenu, M. Balabane, A. Mariotti, and D. Righi. 2004. Peroxide
oxidation of clay-associated organic matter in a cultivation chronosequence.
Europ. J. Soil Sci. 55:471-478.
Rancourt D. G. and Ping J. Y. 1991. Voigt-based methods for arbitrary-shape static
hyperfine parameter distributions in Mössbauer-spectroscopy. Nucl. Instrum.
Methods Phys. Res. Sect. B, 58:85–97.
Roden, E. E. 2006. Geochemical and microbiological controls on dissimilatory iron
reduction. C.R. Geosci. 338:456–467.
Rhoton, F.E., J.M. Bigham, L.D. Norton, and N.E. Smeck. 1981. Contribution of
magnetite to oxalate-soluble iron in soils and sediments from the Maumee River
basin of Ohio. Soil Sci. Soc. Am. J. 45:645-649.
Russel, J.D., W.J. McHardy, and A.R. Fraser. 1969. Imogolite: A unique aluminosilicate.
Clay Miner. 8:87-99.
Sánchez, A.G., F.A.M. Astudillo, E.R. Beltran, I.R. Seuzcún, and J.V. Mena. 1996.
Estudio Semidetallado de Suelos de la Zona Cañera del Sur de Guatemala.
Cengicaña, Guatemala City, Guatemala.
Schwertmann, U., R.W. Fitzpatrick, and J. LeRoux. 1977. Al substitution and differential
disorder in soil hematites. Clays Clay Miner. 25:373–374.

78
Shoji, S., M. Nanzyo, and R. Dahlgren. 1993. Volcanic ash soils: Genesis, properties and
utilization. Elsevier, Amsterdam, Netherlands.
Soil Survey Staff. 2014. Kellogg Soil Survey Laboratory Methods Manual. Soil Survey
Investigations Report No. 42, Version 5.0. R. Burt and Soil Survey Staff (ed.).
U.S. Department of Agriculture, Natural Resources Conservation Service.
Washington D.C.
Sposito, G. 2008. The surface chemistry of soils. Oxford Univ. Press, New York.
Su, C., and D.L. Suarez. 1995. Coordination of adsorbed boron: A FTIR spectroscopic
study. Environ. Sci. Technol. 29:302–311.
Su, C., and D.L. Suárez. 1997. Boron sorption and release by allophane. Soil Sci. Soc.
Am. J. 61:69-77.
Terraza Pira, M.F., M. Sumner, M. Cabrera, and A. Thompson. 2017. Boron adsorption
and desorption on volcanic ash-derived soils. Soil Sci. Soc. Am. J. In review.
van Oorschot, I.H.M., and M.J. Dekkers. 2001. Selective dissolution of magnetic iron
oxides in the acid-ammonium oxalate/ferrous iron extraction method—I.
Synthetic samples. Geophys. J. Int. 145:740-748.
van Oorschot, M.J. Dekkers, and P. Havlicek. 2002. Selective dissolution of magnetic
iron oxides with the acid-ammonium-oxalate/ferrous-iron extraction technique—
II. Natural loess and palaeosol samples. Geophys. J. Int. 149:106-117.
Vodyanitskii, Yu.N., Vasil'ev, A.A., Morgun, E.G., and Rumyantseva, K.A., 2007.
Selectivity of reagents used to extract iron from soil. Eurasian Soil Sci. 40:1076–
1086.

79
Wada, K. 1989. Allophane and imogolite. pp. 1051–1087. In J.B. Dixon and S.B. Weed
(eds.) Minerals in soil environment. 2nd ed. Soil Sci. Soc. Am. Book Series No. 1.
ASA and SSSA, Madison, WI.
Wada, S.I. and K. Wada. 1977. Density and structure of allophane. Clay Minerals
12:289–298.
Walker, A.L. 1983. The effects of magnetite on oxalate and dithionite extractable iron.
Soil Sci. Soc. Am. J. 47:1022-1026.
Wright, A. C. S. 1964. The “andosols” or “humic allophane” soils of South America.
World Soil Resour. Rep. no. 14. Meeting on the Classificationand Correlation of
Soils from Volcanic Ash, Tokyo, Japan (11-27 une 19664). Food and Agric. Org.,
U.N., World Soil Resources Rept. 14:9-21. Rome.
Yermiyaho, U., R. Keren, and Y. Chen. 1988. Boron sorption on composted organic
matter. Soil Sci. Soc. Am. J. 52:1309–1313.
Yoshinaga, N. and S. Aomine. 1962. Imogolite in some Ando soils. Soil Sci. Plant Nutr.
8:22-29.
Zunino H., F. Borie, S. Aguilera, J.P. Martin, and K. Haider. 1982. Decomposition of
14C-labelled glucose, plant and microbial products and phenols in volcanic ash-
derived soils of Chile. Soil Biol. Biochem. 14:37–43.

80
Tables and figures
Table 3.1: Selected soil characteristics of the agricultural sites sampled (from Chapter 2)
Site†
Clay-size
particles,
Specific
surface area,
B Maximum
adsorption,
g kg-1
m2 g
-1 mg B kg
-1
1 Buganvilia (A) 161 58 53
2 Santa Monica (E) 61 16 3
3 Mirador (E) 401 101 62
4 Velasquez (A) 181 104 83
5 Socorro (A) 341 86 49
6 San Patricio (M) 81 8 13
7 La Felicidad (E) 301 62 14
8 San Francisco (M) 381 98 14
9 San Antonio (M) 321 73 27
10 Malta (M) 121 36 34
11 La Cuchilla (A) 101 65 23
12 Puyumate (A) 141 73 130
13 Blanca Victoria (M) 300 49 6
14 Las Rosas (Af) 480 73 13
15 Buenos Aires (V) 540 59 47
16 Colombita (V) 500 78 16
17 Maria del Carmen (V) 520 83 45
18 Chaparral (M) 340 109 13
19 Maria Linda (M) 160 47 5
20 La Trinidad (E) 180 49 19
21 Capullo (V) 300 26 21
22 Cadiz (A) 240 98 90
23 Boton Blanco (E) 60 11 36
†Site name followed by soil order identification in parenthesis: Andisols (A), Alfisols (Af), Entisols (E),
Mollisols (M), Vertisols (V)

81
Table 3.2: Soil mineral characteristics
Site
Acid-oxalate extraction,
g kg-1
Allophane†,
g kg-1
Dithionite-citrate extraction,
g kg-1
Pyrophosphate extraction,
g kg-1
Other minerals ‡
Al Fe Si Al Fe Si Al Fe Si
1 Buganvilia (A) 24.0 15.0 12.6 78.7 3.3 1.2 1.6
5.7 1.8 2.4 ORT
2 Santa Monica (E) 5.4 5.0 3.7 17.6 0.7 0.0 1.0
1.8 0.4 1.8 -
3 Mirador (E) 11.2 9.7 6.5 43.2 2.1 1.2 3.1
3.8 0.0 1.6 ORT
4 Velasquez (A) 32.0 18.1 17.4 102.6 7.1 2.5 2.4
9.0 3.3 2.7 -
5 Socorro (A) 20.5 25.1 9.8 51.4 4.8 2.0 1.5
9.6 4.1 4.0 KAO
6 San Patricio (M) 3.9 5.1 2.8 13.5 0.6 1.1 1.3
1.0 1.2 1.3 CRI, ORT
7 La Felicidad (E) 4.8 3.1 2.6 9.4 0.7 0.0 1.8
3.5 1.4 5.6 SMC, PYR
8 San Francisco (M) 6.4 6.7 2.8 18.9 0.9 0.7 1.9
1.8 0.8 3.0 SMC
9 San Antonio (M) 5.7 3.9 2.8 20.1 1.2 0.0 2.5
4.0 0.0 1.4 SMC
10 Malta (M) 3.3 6.2 2.4 10.4 0.5 0.5 1.2
1.4 0.8 2.2 HAL, ORT
11 La Cuchilla (A) 25.5 12.4 14.4 80.1 4.9 1.2 1.6
6.8 1.8 1.7 ORT
12 Puyumate (A) 25.6 12.3 13.5 84.4 4.6 0.9 1.8
6.4 1.5 1.7 ORT
13 Blanca Victoria (M) 4.2 5.7 2.1 14.2 0.4 0.5 1.4
7.1 0.4 1.6 SMC, HAL
14 Las Rosas (Af) 4.6 10.8 2.5 6.2 0.5 0.6 1.3
18.2 7.7 20.2 KAO
15 Buenos Aires (V) 6.4 12.9 2.4 12.6 1.0 2.0 1.6
3.7 1.4 3.1 SMC, KAO
16 Colombita (V) 6.5 14.9 3.4 9.9 0.6 0.6 1.4
5.5 1.8 4.7 SMC, CRI, KAO
17 Maria del Carmen (V) 5.6 11.2 2.5 9.1 0.6 1.0 1.5
4.3 1.4 4.1 SMC, KAO
18 Chaparral (M) 4.2 2.1 1.9 13.3 0.4 0.0 1.7
3.6 0.0 1.7 -
19 Maria Linda (M) 3.6 7.7 2.6 13.8 0.2 0.6 1.1
6.0 0.7 1.7 SMC, KAO
20 La Trinidad (E) 1.6 4.4 1.5 3.7 0.0 0.5 1.0
4.3 2.3 6.9 SMC, KAO
21 Capullo (V) 2.0 4.9 1.0 2.6 0.2 0.6 1.1
10.7 3.6 11.1 SMC, KAO
22 Cadiz (A) 25.2 16.9 13.2 82.7 3.0 2.2 2.1
5.7 2.5 2.9 CRI, ORT
23 Boton Blanco (E) 3.6 4.7 2.8 12.0 0.8 0.2 1.3 1.4 0.5 1.2 -
†Estimated from oxalate and pyrophosphate extractable Al and oxalate extractable Si; ‡other minerals identified by X-ray diffraction: SMC = Smectite, CRI =
Cristobalite, HAL = Halloysite, KAO = Kaolinite, ORT = Orthoclase, PYR = Pyrollusite.

82
Table 3.3: Thermal analysis interpretation for mineral clay fractions
Soil
Endothermic
peak, °C
Assignment H2O
peaks, °C
Area H2O
†
Exothermic
peak, °C
Assignment
Reaction Component % Reaction Component
1 Buganvilia 133 1 AL/IM/HAL 188 - 338 87.9 18.5 926 3 AL/IM
406 2 IM 457 10.1 2.1 1010 3 KAO/HAL
612 2 KAO/HAL 536 2.0 0.4
2 Santa Monica 115 1 AL/HAL 188 - 305 82 14.8 940 3 AL
450 2 KAO/HAL 482 - 491 18 3.2 1004
3 Mirador 110 1 AL/HAL 174 - 285 79.3 13.9 944 3 AL
460 2 KAO/HAL 438 - 551 20.6 3.6 1010 3 KAO/HAL
4 Velasquez 137 1 AL/IM/HAL 161 - 275 78.6 19.3 921 3 AL/IM
405 2 IM 379 2.2 0.5 1005 3 KAO/HAL
456 2 KAO/HAL 465 19.2 4.7
5 Socorro 125 1 AL/IM/HAL 141 - 230 50.6 10.2 826 3 AL/IM
300 2 GOE 345 11.8 2.4 938 3 KAO/HAL
491 2 KAO/HAL 444 - 568 37.4 7.6
6 San Patricio 120 1 AL/HAL 140 - 226 70.2 14.2 935 3 AL/IM/HAL
447 2 KAO/HAL 354 - 564 29.8 6.0
7 La Felicidad 122 1 AL/HAL 158 - 256 62.8 10.2 895 3 AL
488 2 KAO/HAL 366 - 627 37.3 6.0 1015 3 KAO/HAL
8 San Francisco 127 1 AL/HAL 167 - 272 74.6 12.8 904 3 AL
468 2 KAO/HAL 409 - 618 25.4 4.4 1010 3 KAO/HAL
9 San Antonio 132 1 AL/HAL 161 - 295 75.1 14.3 904 3 AL
482 2 KAO/HAL 431 - 632 24.8 4.7 999 3 KAO/HAL
10 Malta 125 1 AL/HAL 149 - 252 63.3 11.3 900 3 AL
468 2 KAO/HAL 391 - 579 33.7 6.0 1000 3 KAO/HAL
11 La Cuchilla 140 1 AL/IM/HAL 175 - 305 77.9 17.5 904 3 AL/IM
405 2 IM 407 6.7 1.5 1011 3 KAO/HAL
455 2 KAO/HAL 486 15.4 3.5
(Continues in next page)

83
(Continued from previous page)
12 Puyumate 132 1 AL/IM/HAL 168 - 282 81.5 20.5 904 3 AL/IM
405 2 IM 400 5.1 1.3 1009 3 KAO/HAL
446 2 KAO/HAL 474 13.4 3.4
14 Las Rosas 120 1 AL/HAL 136 - 225 50.6 9.5 918 3 AL/KAO/HAL
510 2 KAO/HAL 359 - 629 49.4 9.2
15 Buenos Aires 143 1 AL/HAL 151 - 232 39.4 7.6 936 3 AL/KAO/HAL
529 2 KAO/HAL 342 - 587 60.4 11.7
16 Colombita 114 1 AL/HAL 183 - 312 48.4 9.3 934 3 AL/KAO/HAL
501 2 KAO/HAL 520 - 552 51.7 10.0
17 Maria del Carmen 116 1 AL/HAL 135 - 212 49.0 8.6 935 3 AL/KAO/HAL
514 2 KAO/HAL 535 - 550 51.0 9.0
18 Chaparral 155 1 AL/HAL 169 - 275 60.7 8.3 900 3 AL
490 2 KAO/HAL 402 - 568 39.4 5.4 1013 3 KAO/HAL
19 Maria Linda 125 1 AL/HAL 124 - 196 66.8 12.6 917 3 AL/KAO/HAL
505 2 KAO/HAL 338 - 482 33.2 6.3
20 La Trinidad 127 1 AL/HAL 165 - 306 62.4 11.4 915 3 AL
504 2 KAO/HAL 446 - 513 27.2 5.0 1005 3/4 KAO/HAL/SMC
660 2 SMC 559 10.4 1.9
21 Capullo 120 1 AL/HAL 231 - 363 46.2 7.1 936 3 AL/KAO/HAL
512 2 KAO/HAL 435 - 633 53.8 8.3
22 Cadiz 132 1 AL/IM/HAL 156 - 282 76.8 18.4 820 4 SMC
405 2 IM 420 4.7 1.1 920 3 AL/IMG
455 2 KAO/HAL 505 12.7 3.0 1001 3 KAO/HAL
660 2 SMC 589 5.6 1.3
23 Boton Blanco 117 1 AL/HAL 132 - 221 79.5 14.5 944 3 AL
462 2 KAO/HAL 496 16.0 2.9 998 3/4 KAO/HAL/SMC
630 2 SMC 582 4.5 0.8
Reactions:
1 Loss of adsorbed H2O
2 De-hydroxilation
3 γ-alumina formation
4 Recrystalization
† Mineral phase assigned: SMC = Smectite, HAL = Halloysite, KAO = Kaolinite, AL = Allophane, IM = imogolite. ‡H2O evolved expressed as per cent of initial mass.

84
Table 3.4: Mösbauer spectroscopy Iron (Fe) phase identification and crystallinity index
(CI)
Soil Total Fe
(%) Phase
Abundance
(%) CI
Cadiz 5.71 Silicates/Organic matter 4.6 0.47
Hematite/Maghemite 17.9
Ferrihydrite 65.1
La Felicidad 5.20 Silicates/Organic matter 32.3 0.84
Hematite 12.6
Ferrihydrite 39.4
Velasquez 6.95 Silicates/Organic matter 17.2 0.79
Hematite/Maghemite 22.1
Goethite/Ferrihydrite 64.0
Las Rosas 5.67 Silicates/Organic matter 4.3 0.40
Hematite 12.3
Ferrihydrite 71.0

85
Table 3.5: Mösbauer spectroscopy temperature of ordination of short-range-order (SRO)
Fe phases
SRO Fe(III)(oxy)hydroxides
Soil 295 K 77 - 295 K 4 - 77 K < 4 K Total
Cadiz 9.1 3.2 33.4 19.4 65.1
La Felicidad 13.0 0.0 3.3 23.1 39.4
Velasquez 9.1 34.0 3.1 17.8 64.0
Las Rosas 10.2 0.7 39.7 20.4 71.0

86
Table 3.6: Correlation coefficients between clay surface properties and kaolinite de-
hydroxylation temperature
Clay B adsorption Clay SSA T (°C)
Clay B adsorption 1.00
Clay SSA 0.53** 1.00
T (°C) -0.57** -0.56** 1.00
** significant at P = 0.01

87
Figure 3.1: Allophane/imogolite content as a function of the pyrophosphate/oxalate
extractable-Al ratio, Alp/Alo.
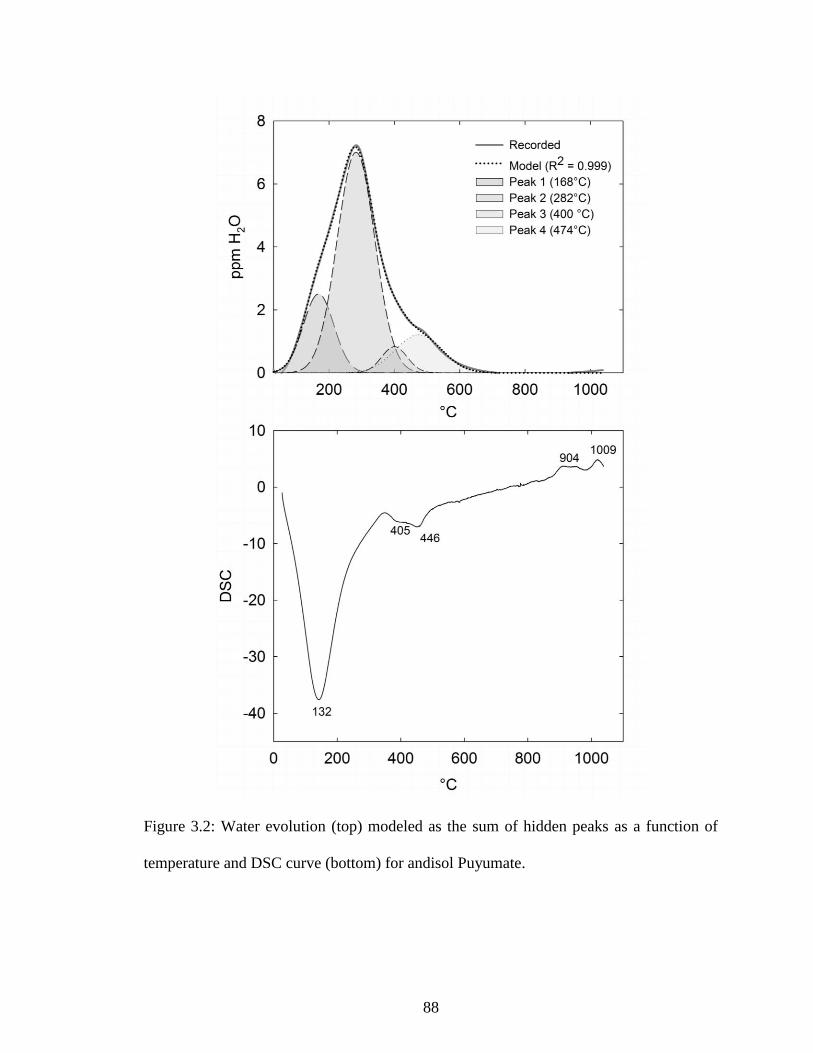
88
Figure 3.2: Water evolution (top) modeled as the sum of hidden peaks as a function of
temperature and DSC curve (bottom) for andisol Puyumate.

89
Figure 3.3: Exponential correlation between percent water loss as evolved water
estimated from peak modeling and DSC and percent of SRO aluminosilicates in clay
fraction calculated from selective dissolutions.

90
CHAPTER 4
EFFECTS OF ORGANO-MINERAL PROPERTIES OF VOLCANIC ASH-DERIVED
SOILS ON BORON ADSORPTION1
1 Terraza Pira, M.F., M.E. Sumner, A.F. Plante, and A. Thompson. To be submitted to the Soil Science
Society of America Journal.

91
4.1 Abstract
Boron (B) forms surface complexes with carboxylic and phenolic functional
groups on natural and synthetic organic matter, with adsorption capacities even higher
than for some minerals on a unit mass basis. However, the effects of organic matter on
whole-soil B adsorption are contradictory, with some authors suggesting that it is
positively correlated with adsorption capacities whereas others suggest that it decreases
the mineral reactivity of B within the soil matrix. We hypothesize that the contradictory
effects of organic matter on whole-soil B adsorption are due to different degrees of
organic matter decomposability and association with mineral components, which are the
two main factors affecting thermal stability. By using thermal analysis techniques,
different pools of organic matter were identified for 23 soils derived from volcanic ash.
The organic matter fractionation was used with other organo-mineral parameters such as
allophane and imogolite content, total Fe oxides, and organically complexed Fe and Al to
elucidate whether particular fractions of organic matter have different effects on surface
properties, such as specific surface area (SSA) and B maximum adsorption capacity (bB).
To test our hypothesis, partial least squares regression (PLS-R) models of the data were
fitted showing that different pools of SOM have different effects on surface properties.
Labile organic matter (oxidized between 200–350 °C) is not a significant variable in
explaining surface properties, recalcitrant organic matter (oxidized between 350–475 °C)
is closely related to bB, whereas refractory organic matter (oxidized between 475–650 °C)
contributes significantly to SSA. We propose that using thermal analysis techniques to
understanding the organic matter fractionation of soils can be a useful approach to
elucidate surface properties at the whole-soil level.

92
4.2 Introduction
The mechanisms by which B adsorbs to isolated natural and synthetic humic
materials have been well studied, though the conclusions concerning the effect of organic
matter on whole-soil B reactions are not yet clear (Sarkar et al., 2014). Boron forms
tetrahedrally coordinated surface complexes on di-carboxylic acid sites, alpha-hydroxy
carboxylic acid sites, and di-phenols on both synthetic and natural humic substances
(Lemarchand et al., 2005; Tossel, 2006; Goldberg, 2014). Within an organo-mineral
assemblage, organic materials have been reported to reduce the pure mineral’s capacity to
adsorb B. For instance, a decrease in adsorption capacity occurred when Al hydroxide
was coated with organic matter (Xu and Peak, 2007), and allophane showed a reduced
capacity to sorb B when it was coated with an organic compound known to a have high B
affinity (Reinert et al., 2011).
In whole soils, there are two contrasting behaviors concerning the role that
organic matter plays in B retention. Some studies suggest that soil B adsorption increases
with increasing organic matter content (Olson and Berger, 1947; Elrashidi and O’Connor,
1982; Yermiyaho et al., 1995; Sharma et al., 2006) whereas other authors report that
organic matter causes a reduction in B sorption in soils (Marzadori et al., 1991; Diana et
al., 2010; Sarkar et al., 2014). The use of pure minerals and isolated organic matter as
models is not translatable to whole soil–B interactions.
Humic substances in soils have been traditionally classified based on solubility
characteristics: humin, the insoluble fraction of humic substances; humic acid, the
fraction soluble only under alkaline conditions; and fulvic acid, the fraction soluble under
all pH conditions (Sposito, 2008). Regardless of differences in physicochemical

93
properties such as solubility, these fractions are operationally defined and they do not
directly imply the existence of three different molecular structures in soil humus (Sutton
and Sposito, 2005). As of today, no single analytical method can fully characterize the
structure and composition of SOM. However, thermal stability can serve as an indicator
of the distribution of SOM between biogeochemically labile and stable fractions, with the
advantage that the method is rapid and requires little sample preparation (Plante et al.,
2009) so that relevant information regarding the reactivity of SOM in soils can be
obtained; this is because thermal analysis does not provide information at the atomic or
molecular level, but rather registers irreversible thermal reactions that occur at the whole-
matrix level.
Because volcanic ash-derived soils have an enhanced ability to accumulate
organic carbon (C) as compared with other clay-rich soils (Zunino et al., 1982; Shoji et
al., 1993) the mechanisms by which organic matter is hosted and its effects on surface
reactivity in these soil environments are questions of special concern. Because the
literature reports significant B adsorption from independent mineral and organic soil
constituents such as Fe and Al oxides, edges of aluminosilicates, organic matter, and
allophane —all of which may be present in volcanic ash-derived soils— and because
contradictory conclusions have been drawn concerning the role of organic matter
interactions in whole soil B sorption, the question that drives this study is how can
organo-mineral associations explain the widely variable soil bB that had been observed
for a set of volcanic ash-derived soils.
Chapter 3 presented a detailed characterization of the mineral surfaces for a set of
volcanic ash-derived soils from the Pacific coastal plain of Guatemala in relation to their

94
surface properties affecting B adsorption. The objective of this study is to use the same
set of 23 agricultural top soils to evaluate the relationship between mineral properties and
organic matter fractions based on their thermal stability, specific surface area (SSA), and
B maximum adsorption capacity (bB). To test the hypothesis that different fractions of
organic matter have distinct effects on surface reactivity of volcanic ash-derived soils, a
multivariate statistical analysis was used to assess these relationships so that a conceptual
model of organomineral associations and their contribution to SSA and whole-soil bB
could be proposed.
4.3 Materials and methods
Soils description
Surface soils (0-15 cm) from 23 agricultural sites on the south coast of Guatemala
where crop B deficiency is common were selected. The soils as represent five soil orders
(one Alfisol, six Andisols, five Entisols, seven Mollisols, and four Vertisols, identified by
Sánchez et al. (1996)) and are developed from igneous parent materials with intermittent
and varying inputs of volcanic ash. The results of soil B adsorption on these soils and a
detailed discussion on their mineralogy are reported elsewhere (Chapters 2 and 3).
Briefly, clay fractions are composed of primary minerals (K-feldspar and crystobalite),
1:1 clay minerals (kaolinite and halloysite), 2:1 clay minerals (smectite, most probably
montmorillonite), short-range-order (SRO) aluminosilicates (allophane and imogolite)
and Fe (oxy)hydroxides. Imogolite was only identified in Andisols, whereas allophane
and 1:1 clays (with different degrees of crystallinity) were identified in all samples.
Smectites were identified only in 11 out of 23 samples.

95
Specific surface area (SSA) was measured by the water vapor adsorption method
(Orchison, 1952), and bB were determined in batch equilibrium experiments (Chapter 2).
Active Al and Fe pools were extracted with selective dissolutions; briefly, acid-oxalate
extractions were used to quantify SRO mineral pools, Na-pyrophosphite to quantify the
organically associated Al and Fe, and dithionite-citrate for free Fe oxides (Chapter 3).
Organic matter fractionation
Total soil organic matter (SOM) was calculated from total C and N measured by
combustion using a Leco C-N analyzer (Wang, 1998). To differentiate fractions of
organic matter, thermal analysis coupled with CO2/H2O evolved gas analysis was carried
out on bulk soils with experimental conditions according to Fernandez et al., 2012. Peaks
of CO2 were deconvoluted using PeakFit software (SYSTAT) and fractionation of
organic matter was estimated according to thermal stability ranges available in the
literature (Plante et al., 2005; De La Rosa et al., 2008).
Soil organic matter was divided in three groups according to resistance to thermal
oxidation (Plante et al., 2005; De La Rosa et al., 2008): labile organic matter (200–350
°C), recalcitrant organic matter (350– 475 °C), and refractory organic matter (475–650
°C), the last group including black carbon and other thermally condensed organic
compounds. Peak fitting analyses of the exothermic region of the thermal reactions (CO2
evolution from organic matter oxidation) on bulk soils showed that local maxima
consisted of several hidden peaks representing these three fractions of organic matter that
decomposed in different temperature ranges.
96
The thermal fractionation of organic matter belonging to the different pools
identified by distinctive peaks was estimated as the relative area of the curves within each
temperature range. The total content of each pool was calculated as the fraction
multiplied by total organic matter content (Table 4.1).
Statistical analysis
Cluster analysis was performed to assemble the soils into classes (clusters) in such
a way that soils belonging to the same class are more similar to one another than to soils
belonging to other classes. Proximity between soils was based on a set of organomineral
variables measured on all samples. The variables used in the clustering process were:
fractions of SOM based on thermal stability (labile, recalcitrant, and refractory), total free
Fe oxides (dithionite-citrate extractable), organically complexed Al and Fe (Na-
pyrophosphate extractable), SRO aluminosilicates (allophane and imogolite), and
C:allophane ratio. The method used was Agglomerative Hierarchical Clustering (AHC).
After clustering soils based on their organomineral properties, a multivariate regression
technique was used to model soil bB (based on the same variables) using partial least
squares regression (PLS-R).
4.4 Results and discussion
Effect of total soil organic matter on surface properties
While simple linear regression of total soil organic matter (SOMT) with SSA and
bB was statistically significant (p < 0.05), it explained only 35 and 37% of their
variability, respectively (Figure 4.1). In a multiple linear regression using SOMT and

97
SRO aluminosilicates (the main mineral surface explaining bB for this set of soils
(Chapter 3)) as independent variables for SSA and bB, SOMT is significant only for SSA
(p = 0.01) but not for bB (Figure 4.2).
An improvement in the goodness of fit for SSA was obtained when this variable
was exponentially related with SOM normalized by the allophane content expressed as
the C:allophane ratio (R2
= 0.486) (Figure 4.3). This negative exponential relationship is
consistent with that of Bartoli et al. (2007) for another set of volcanic soils. According to
the mechanisms by which allophanic soils accumulate organic matter (Filimonova et al.,
2016), the C:allophane ratio could be used as a good indicator of organic coatings on
allophane surfaces. Our data shows that this mineral’s association with organic matter has
a negative exponential impact on specific surface area.
Soil organic matter thermal fractionation
Local maxima consisted of several hidden peaks representing these three fractions
of organic matter that decomposed in different temperature ranges (Figure 4.4).
Coefficients of correlation between the actual curve and the sum of the fitted curves were
greater than 0.99 for all the samples. In general, recalcitrant organic matter was the most
abundant pool in this set of soils. A possible explanation for these results is that the
majority of soils have been under sugarcane cultivation for a long time (more than 20
years) with burning harvest methods that makes these soils devoid of labile organic
matter. Allophane and nano-particulated Fe (oxy)hydroxides tend to accumulate more
preferably labile organic matter and low-molecular-weight components such as amino-

98
acids (Filimonova et al., 2016), so higher proportions of labile organic matter were
expected for this set of allophane-rich soils.
Agglomerative Hierarchical Clustering (AHC)
Cluster analysis divided soils into three clusters based in their organomineral
properties (Figure 4.5, Table 4.2). Cluster one grouped soils classified as Andisols (A);
cluster two grouped Mollisols (M), Entisols (E), and some Vertisols (V); cluster three
grouped one Vertisol and the only Alfisol (F). Briefly, the variables with the greatest
distance between clusters centroids were allophane and imogolite content, organically
complexed Al and Fe, recalcitrant SOM, and C:allophane ratio. Cluster one (Andisols)
had the greatest allophane and imogolite content, and recalcitrant SOM fraction. Cluster
three (Vertisol and Alfisol) has the greatest organically complexed Al and Fe, and
C:allophane ratio. These values show that the andic character of the soils in each group
decreases from cluster one to three.
Partial least squares regression (PLSR)
After clustering soils based on their organomineral properties, a regression
technique was used to model the two surface properties of interest (SSA and bB) to
elucidate if different fractions of organic matter are related differently to mineral and
surface properties. The first two components explained more than 50% of the variability
in both the explanatory and the dependent variables. The correlation loading plot explains
the relationship between the explanatory variables with the dependent variables based on
the latent factors—t1 and t2— (Figure 4.6). bB was positively correlated with the

99
allophane and imogolite content, total Fe oxides concentration, and the recalcitrant
fraction of organic matter, and negatively correlated with C:allophane ratio; whereas SSA
was correlated with organically complexed Fe and Al, refractory fraction of organic
matter, and (to a lesser extent) with the labile organic matter fraction.
Previously identified clusters were distinctively recognized in the loading plot
(Figure 4.7). Cluster one, where the soils with the largest andic influence were grouped,
was more related to allophane and imogolite content, total Fe oxides, and recalcitrant
fraction of organic matter. Clusters two and three were distant from cluster one, with
labile and recalcitrant fractions of organic matter, and organically complexed Al and Fe
becoming more important variables to these clusters. From the loading plots, it is clear
that B adsorption and SSA are closely related, but the way in which of the variables
interact is different.
The standardized coefficients of the regression models were evaluated at the 95%
confidence interval to test the significance of each variable in the regression equation
explaining variability in bB and SSA (Figure 4.8). The standardized coefficients for the
significant variables explaining bB are 0.293, 0.233, 0.213, and -0.166 for allophane and
imogolite content, total Fe oxides, recalcitrant organic matter, and C:allophane ratio,
respectively. The standardized coefficients for the significant variables explaining SSA
are 0.130, and 0.472 for allophane and imogolite content, and refractory organic matter,
respectively.
These two regression models confirm that fractions of organic matter with
different thermal stabilities have different relationships with surface properties such as
SSA and bB. Recalcitrant organic matter is associated with higher reactivity towards B

100
through ligand exchange reactions, whereas refractory organic matter contributes most to
SSA despite its lower degree of reactivity. According to the modeling of our data, labile
organic matter is not a significant variable in explaining either bB or SSA for this set of
volcanic ash-derived soils.
4.5 Conclusions
Total soil organic matter is poorly correlated with B adsorption capacity for this
set of volcanic ash-derived soils. In a multiple linear regression only the most abundant
mineral surface (allophane and imogolite) explains variations in B adsorption. After
differentiating organic matter pools in each soil based on their thermal stability, a
multivariate analysis demonstrated that different pools of organic matter influence
surface properties of volcanic ash-derived soils differently. The partial least squares
regression models for specific surface area (SSA) and B maximum adsorption capacity
(bB) revealed that the recalcitrant fraction of organic matter directly affects B adsorption
capacities, and it has almost the same coefficient as the allophane and imogolite content,
and total Fe oxides. On the other hand, the only thermal fraction explaining SSA is the
refractory organic matter, even to a greater extent than the allophane and imogolite
content. Labile organic matter was not a significant variable in any of the two surface
properties evaluated for this set of soils. Based on our results, we propose that the
contradictory effects of organic matter on B adsorption in soils are due to different
degrees of organic matter decomposability and mineral association, which are the two
main factors affecting thermal stability.

101
References
Bartoli, F., A.J. Poulenard, and B.E. Schouller. 2007. Influence of allophane and organic
matter contents on surface properties of Andosols. Eur. J. Soil Sci. 58:450-464.
De la Rosa, J.M., J.A. González-Pérez, R. González-Vázquez, H. Knicker, E. López-
Capel, D.A.C. Manning, and F.J. González-Vila. 2008. Use of pyrolysis/GC–MS
combined with thermal analysis to monitor C and N changes in soil organic matter
from a Mediterranean fire affected forest. Catena 74:296-303.
Diana, G., C. Beni, and S. Marconi. 2010. Comparison of adsorption isotherm equations
to describe boron behavior in soils affected by organic and mineral fertilization.
Commun. Soil Sci. Plant Anal. 41:1112:1128.
Elrashidi, A., and G.A. O’Connor. 1982. Boron sorption and desorption in soils. Soil Sci.
Soc. Am. J. 46:27-31.
Fernandez, J.M., C. Peltre, J.M. Craine, and A.F. Plante. 2012. Improved characterization
of soil organic matter by thermal analysis using CO2/H2O evolved gas analysis.
Environ. Sci. Technol. 46:8921−8927.
Filimonova, S., S. Kaufhold, F.E. Wagner, W. Häusler, and I. Kögel-Knabner. 2016. The
role of allophane nano-structure and Fe oxide speciation for hosting soil organic
matter in an allophanic Andosol. Geoch. Cosmoch. Acta 180:284-302.
Goldberg, S. 2014. Chemical modeling of boron adsorption by humic materials using the
constant capacitance model. Soil Sci. 179:561-567.
Leinweber, P., H.R. Schulten. 1992. Differential thermal analysis, thermogravimetry and
in-source pyrolysis-mass spectrometry studies on the formation of soil organic
matter. Thermochimica Acta 200:151–167.

102
Lemarchand, E., J. Schott, and J. Gaillardet. 2005. Boron isotopic fractionation related to
boron sorption on humic acid and the structure of surface complexes formed.
Geochim. Cosmochim. Acta 69:3519-3533.
Marzadori, C., L.V. Antisari, C. Ciavatta, and P. Sequi. 1991. Soil organic matter
influence on adsorption and desorption of boron. Soil Sci. Soc. Am. J.
55:1582:1587.
Olson, R.V., and K.C. Berger. 1947. Boron fixation as influenced by pH, organic matter
content and other factors. Soil Sci. Soc. Am. Proc. 11:216-220.
Orchiston, H. 1952. Adsorption of water vapor: I. Soils at 25°C. Soil Sci. 76:453-465.
Plante, A. F., M. Pernes, and C. Chenu. 2005. Changes in clay associated organic matter
quality in a C depletion sequence as measured by differential thermal analyses.
Geoderma 129:186–199.
Plante, A.F., J.M. Fernandez, and J. Leifeld. 2009. Application of thermal analysis
techniques in soil science. Geoderma 153:1–10.
Reinert, L., F. Ohashi, M. Kehal, J. Bantignies, C. Goze-Bac, and L. Duclaux. 2011.
Characterization and boron adsorption of hydrothermally synthesised allophones.
Appl. Clay Sci. 54: 274–280.
Sánchez, A.G., F.A.M. Astudillo, E.R. Beltran, I.R. Seuzcún, and J.V. Mena. 1996.
Estudio Semidetallado de Suelos de la Zona Cañera del Sur de Guatemala.
Cengicaña, Guatemala City, Guatemala.
Sarkar, D., D.K. De, R. Das, and B. Mandal. 2014. Removal of organic matter and oxides
of iron and manganese from soil influences boron adsorption in soil. Geoderma,
214:213-216.

103
Sharma, K.R., P.C. Srivastava, P. Srivastava, V.P. Singh. 2006. Effect of farmyard
manure application on boron adsorption-desorption characteristics of some soils.
Chemosphere 65:769-777.
Shoji, S., M. Nanzyo, and R. Dahlgren. 1993. Volcanic ash soils: Genesis, properties and
utilization. Elsevier, Amsterdam, Netherlands.
Sposito, G. 2008. The surface chemistry of soils. Oxford Univ. Press, New York.
Sutton, R. and G. Sposito. 2005. Molecular structure in soil humic substances: the new
view. Environ. Sci. Technol. 39:9009-9015.
Terraza Pira, M.F., M. Sumner, M. Cabrera, and A. Thompson. 2016. Boron Adsorption
and desorption on volcanic ash-derived soils. Soil Sci. Soc. Am. J. In review.
Terraza Pira, M.F., M. Sumner, A. Plante, and A. Thompson. 2017. Mineral properties of
volcani ash-derived soils affecting B adsorption. In review.
Tossel, J.A. 2006. Boric acid adsorption on humic acids: Ab initio calculation of
structures, stabilities, 11
B NMR and 11
B, 10
B isotopic fractionations of surface
complexes. Geochim. Cosmochim. Acta. 70:5089-5103.
Wang, D., and Anderson, D.W. 1998. Direct measurement of organic carbon content in
soils by the Leco CR-12 carbon analyzer. Commun. Soil Sci. Plant Anal. 29:15–
21.
Xu, D. N. and D. Peak. 2007. Adsorption of boric acid on pure and humic acid coated
am-Al(OH)3: A boron K-edge XANES study. Environ. Sci. Technol. 41:903-908.
Yermiyaho, U., R. Keren, and Y. Chen. 1995. Boron sorption by soil in the presence of
composted organic matter. Soil Sci. Soc. Am. J. 59:405-409.

104
Zunino H., Borie F., Aguilera S., Martin J. P. and Haider K. 1982. Decomposition of 14
C-
labelled glucose, plant and microbial products and phenols in volcanic ash-
derived soils of Chile. Soil Biol. Biochem. 14:37–43.

105
Tables and figures
Table 4.1: Soil organic matter fractionation based on thermal resistance
Site
Organic
Matter,
g kg-1
% Fractions
Total pool content, g kg-1
Labile Recalcitrant Refractory Labile Recalcitrant Refractory
1 Buganvilia 53.4
37.7 62.3 0.0
20.2 33.3 0.0
2 Santa Monica 14.7
0.0 90.4 9.6
0.0 13.3 1.4
3 Mirador 42.4
0.0 78.9 21.1
0.0 33.4 8.9
4 Velasquez 78.8
25.1 64.7 10.2
19.7 51.0 8.0
5 Socorro 42.4
56.0 39.6 4.4
23.7 16.8 1.9
6 San Patricio 28.6
0.0 89.4 10.6
0.0 25.6 3.0
7 La Felicidad 31.9
0.0 84.5 15.5
0.0 26.9 4.9
8 San Francisco 58.6
0.0 80.9 19.1
0.0 47.4 11.2
9 San Antonio 60.6
0.0 79.0 21.0
0.0 47.9 12.7
10 Malta 35.1
0.0 85.7 14.3
0.0 30.0 5.0
11 La Cuchilla 70.4
0.0 91.9 8.1
0.0 64.7 5.7
12 Puyumate 67.6
0.0 93.2 6.8
0.0 63.0 4.6
13 Blanca Victoria 27.7
0.0 78.3 21.7
0.0 21.7 6.0
14 Las Rosas 39.2
58.7 18.2 23.1
23.0 7.1 9.0
15 Buenos Aires 29.6
59.7 28.3 12.0
17.6 8.4 3.6
16 Colombita 31.2
57.9 24.0 18.1
18.1 7.5 5.6
17 Maria del Carmen 29.9
49.3 38.5 12.3
14.7 11.5 3.7
18 Chaparral 35.9
0.0 78.7 21.3
0.0 28.3 7.6
19 Maria Linda 20.1
61.0 30.5 8.5
12.3 6.1 1.7
20 La Trinidad 16.4
43.1 40.1 16.8
7.1 6.6 2.8
21 Capullo 23.1
44.9 36.4 18.7
10.4 8.4 4.3
22 Cadiz 56.9
0.0 85.8 14.2
0.0 48.8 8.1
23 Boton Blanco 26.0
0.0 88.6 11.4
0.0 23.0 3.0

106
Table 4.2: Centroid parameter values for cluster analysis
Cluster
1 2 3
Allophane+Imogolite 80.0 14.8 4.4
Total free Fe oxides 1.7 0.6 0.6
Organically complexed Al 7.2 3.5 14.5
Organically complexed Fe 2.5 0.9 5.7
Labile SOM 1.1 0.5 1.7
Recalcitrant SOM 4.6 2.3 0.8
Refractory SOM 0.5 0.5 0.7
C:Allophane ratio 0.8 2.6 7.6

107
Figure 4.1: Linear correlation between soil organic matter (SOM) and (a) specific surface
area (SSA), and (b) B maximum adsorption capacity (bB). Both are statistically
significant at p = 0.05.
R² = 0.3526
0
20
40
60
80
100
120
1 3 5 7
SS
A
SOM
R² = 0.3727
0
20
40
60
80
100
120
140
1 3 5 7
bB
SOM

108
Figure 4.2: Standardized coefficients of multiple linear regressions for specific surface
area (SSA) and B maximum adsorption capacity (bB) as dependent variables, and soil
organic matter (SOM) and allophane and imogolite content as explanatory variables. Bars
represent 95% confidence intervals.
Allophane+Imogolite;
-0.186
SOM; 0.746
-1
-0.5
0
0.5
1
1.5
2
Sta
nd
ari
zed
co
eff
icie
nts
Variable
SSA
Allophane+Imogolite;
0.758
SOM; -0.009
-1
-0.5
0
0.5
1
1.5
Sta
nd
ari
zed
co
eff
icie
nts
Variable
bB

109
Figure 4.3: Exponential decay of clay specific surface area (SSA) as a function of soil
organic matter corrected by the allophane content expressed as the C:allophane ratio.
0
100
200
300
400
500
600
700
0 2 4 6 8 10
Cla
y S
SA
C:Allophane ratio
Exponential decay (R2 = 0.486)

110
Figure 4.4: CO2 evolution during organic matter thermal oxidation and peak modeling for
soils from site, Socorro (R2 = 0.9992).

111
Figure 4.5: Agglomerative Hierarchical Clustering (AHC) dendrogram illustrating three
clusters based on organomineral characteristics. Numbers on y axis correspond to the soil
number in the tables, followed by a letter indicating soil order. Cluster one groups soils
classified as Andisols (A); cluster two groups Mollisols (M), Entisols (E), and some
Vertisols (V); cluster three groups one Vertisol and the only Alfisol (F).
14_F
21_V
03_E
08_M
09_M
13_M
18_M
07_E
10_M
06_M
02_E
23_E
15_V
19_M
20_E
16_V
17_V
01_A
05_A
04_A
22_A
11_A
12_A
0 1 2 3 4 5 6 7
Dissimilitude

112
Figure 4.6: Correlation loading plot for factors one and two. Red lines correspond to
explanatory variables (X) and blue empty circles correspond to dependent variables (Y).
Allophane + Imogolite
Fe_d
Org-Al
Org-Fe
Labile SOM
Recalcitrant SOM
Refractory SOM
C:Allophane ratio
bB
SSA
-1
-0.75
-0.5
-0.25
0
0.25
0.5
0.75
1
-1 -0.75 -0.5 -0.25 0 0.25 0.5 0.75 1
t2
t1
X
Y

113
Figure 4.7: Correlation loading plot for factors one and two. Red dots correspond with
explanatory variables (X), blue empty circles correspond to dependent variables (Y), and
green squares correspond to soil samples belonging to clusters 1, 2, and 3.
Allophane + Imogolite
Fe_d
Al_p
Fe_p
Labile SOM
Recalcitrant SOM
Refractory SOM
C:Allophane ratio
bB
SSA
1 2
2 1
1
2
2
2
2
2 1 1
2
3
2
2
2
2
2 2
3
1
2
-1
-0.75
-0.5
-0.25
0
0.25
0.5
0.75
1
-1 -0.75 -0.5 -0.25 0 0.25 0.5 0.75 1
t2
t1

114
Figure 4.8: PLS standardized coefficients for specific surface area (SSA) and B
maximum adsorption capacity (bB). Bars correspond to 95% confidence intervals.
Allophane +Imogolite; 0.130
Org Fe; 0.147
Org Al; 0.161
Fe ox; 0.063
Labile SOM; 0.146
Recalcitrant SOM; 0.145
Refractory SOM; 0.472
C:Allophane; -0.046
-0.6
-0.4
-0.2
0
0.2
0.4
0.6
0.8
1
Sta
nd
ard
ized
co
eff
icie
nts
Variable
SSA
Allophane +Imogolite; 0.293
Fe ox; 0.233
Org Al; 0.028
Org Fe; 0.037
Labile SOM; 0.018
Recalcitrant SOM; 0.213
Refractory SOM; -0.008
C:Allophane; -0.166
-0.4
-0.3
-0.2
-0.1
0
0.1
0.2
0.3
0.4
0.5
Sta
nd
ard
ized
co
eff
icie
nts
Variable
bB

115
CHAPTER 5
ESTIMATION OF BORON RATES BASED ON ADSORPTION EQUILIBRIUM FOR
HIGHLY FIXING SOILS1
1 Terraza Pira, M.F., and M.E. Sumner. To be submitted to Agricultural and Environmental Letters.

116
5.1 Abstract
Crops do not respond consistently to Boron (B) application rates when grown in
soils with high potential for B adsorption, particularly on volcanic ash-derived soils and
soils dominated by Al and Fe oxides. Because the concentration window between B
deficiency and toxicity is very narrow, farmers seldom apply more than 4.0 kg B ha-1
.
These rates have increased B availability for many crops in temperate regions where soils
are dominated by crystalline clays with low potential to adsorb B, but they have failed to
solve deficiency problems in volcanic ash-derived soils that have high surface area and
strongly adsorb B. However, if B application rates are calculated based on the extent of B
adsorbed by the soil, much more effective crop responses are likely to result. To test this
hypothesis, two field experiments were conducted on the Guatemalan Pacific coastal
plain using sugarcane as a crop response model. Boron was applied at rates up to 20.0 kg
ha-1
, based on adsorption equilibrium experiments performed before the field trials. B
application rates of 7.6 and 10.0 kg ha-1
increased soil B availability by 1.2 mg kg-1
soil,
for the two sites evaluated which have maximum adsorption capacities of 53 and 70 mg
B kg-1
soil. Sugarcane B absorption increased as soil available B increased, and no
toxicity effect was found even after applications of 15.2 and 20.0 kg B ha-1
. One of the
experimental sites had a positive increase of 5.7% in cane yield in response to increasing
available B. These results suggest that deficiency problems in soils with large adsorption
capacities can be effectively managed by choosing B application rates based on
adsorption equilibria, since the formation of strong surface complexes is the main
mechanism that limits B availability for plant uptake.

117
5.2 Introduction
There is an emerging interest in understanding the yield response to Boron (B) in
various deficient crops growing in soils with high potential to fix B. B is the
micronutrient most frequently found to be deficient in a variety of crops (Gupta, 1993),
but current fertilizer recommendations are based on application rates for soils dominated
by crystalline aluminosilicate clays that have significantly lower B sorption capacities (on
a unit weight basis) than most oxide minerals and amorphous aluminosilicates like
allophane (Goldberg, 1997; Su and Suarez, 1997). Soil application rates have ranged
from about 0.5 to 4.0 kg B ha-1
depending on available soil B content and the crop of
interest. For instance, B recommendations compiled from a survey of 50 state agricultural
soil testing laboratories in the U.S. cited by Gupta (1993) show maximum rates of 3.0 to
4.5 kg B ha-1
for high B requirement crops such as alfalfa (Medicago sativa L.) and
cabbage (Brassica oleracea), with the average B application rates ranging from 0.2 to 1.1
kg ha-1
.
Many authors have reported that B deficiencies are mainly found in humid
regions on coarse-textured soils due to B leaching from the root zone (Goldberg and Su,
2007). Although leaching is the most important factor causing B deficiencies in
permanently charged soils with low B adsorption capacities, adsorption reactions can
severely limit B availability for plant uptake in soils with high surface areas containing
aluminum and iron oxides, and allophane (Bingham et al., 1971; Elrashidi and O’Connor,
1982; Su and Suarez, 1995; Schalscha et al., 1973; Chapter 2). Because crops respond
only to aqueous B and the window between deficiency and toxicity is very narrow (Keren
et al., 1985), recommendations for B applications should be based on the B adsorption

118
capacities of the soils so that the rates applied are sufficient to increase the soil solution
concentration without reaching toxic levels. This is particularly important when dealing
with highly weathered and volcanic ash-derived soils that fix B strongly.
Some authors have suggested that B toxicity can occur even when soil B levels
are below sufficiency. Soil B applications as side-placed drenches of 200 L ha-produced a
reduction in sugarcane sucrose yield after application of 2 and 4 kg B ha-1
, even though
the soil B levels after treatment remained below the 0.5 mg B dm-3
, considered to be
deficient (Franco et al., 2011). There is little evidence in the literature of B toxicity
occurring in crops grown on highly-weathered soils at rates higher than those used in
temperate region soils. Widely different soil properties such as pH, clay and organic
matter are responsible for the differences in the toxicity levels observed for corn (Lima et
al., 2007). In Brazilian soils, the critical soil B concentration to ensure adequate corn
production ranged from 0.9 to 2.3 mg B kg-1
soil (extracted by the hot water method) and
for some soils the rates of application to reach those levels of available B were
significantly greater than the usual soil rates applied (Lima et al., 2007).
Boron application rates calculated based on the extent of B adsorbed should result
in yield increases and B availability within the deficiency/toxicity window. To test this
hypothesis, two field experiments were conducted using sugarcane grown on volcanic
ash-derived soils on the Guatemalan Pacific coastal plain as a responding crop model.
Boron was applied at rates up to 20 kg ha-1
, based on adsorption equilibria for the two
sites (Buganvilia and Valesquez) reported previously (Chapter 2). Soil availability,
sugarcane yield, and B uptake were recorded.

119
5.3 Materials and methods
The experiments were located on two commercial farms on the Pacific coastal
plain of Guatemala that are currently under sugarcane cultivation. Soils on these farms
are classified as Andisols and have developed from igneous parent materials with
intermittent inputs of volcanic ash. Maximum B adsorption capacities are 53 and 83 mg
B kg-1
soil, respectively (Chapter 2). Selected properties of soils are presented in Table
5.1.
The soil B application rates were calculated based on the adsorption equilibrium
(partitioning of B between solid and aqueous phases) estimating the amount of B
adsorbed at equilibrium with 1.0 mg B L-1
in solution from the adsorption isotherm
(Chapter 2). For the final estimated B rate (EBR) the amount of B adsorbed on the solid
phase at equilibrium with 1 mg B L-1
in the soil solution and the B required to raise the
soil solution concentration to 1.0 mg B L-1
(at field capacity) in the first 0.2 m of the
profile were used.
For instance, Buganvilia soil has a B adsorption equilibrium isotherm that can be
modeled with the Langmuir equation
𝑛𝑖 =𝑏𝐾𝑐𝑖
1 + 𝐾𝑐𝑖
with the following parameters: 𝑏 = 53, and 𝐾 = 0.072 (Table 5.2), which describes the
partitioning between B adsorbed in the solid phase (𝑛𝑖) —not available for plant
uptake— and the B in soil solution (𝑐𝑖) —available for plant uptake. Using this modeling
function, one can estimate 𝑛𝑖 at equilibrium with an adequate 𝑐𝑖 that is within the
sufficiency range. Using the soil’s specific Langmuir parameters 𝑛𝑖 = 2.8 mg B kg-1
soil
when 𝑐𝑖 = 1.0 mg B L-1
, this corresponds to 5.6 kg B ha-1
(using 2x10⁶ kg of soil ha
-1 at

120
0.2 m deep). This value was added to the dose of 2.0 kg B ha-1
that would be
recommended in non-fixing soils to increase B availability in 1.0 mg kg-1
. The final
estimated B rate (EBT) was calculated as the sum of these two parameters, for final
application rates of 7.6 and 10 kg B ha-1
for Buganvilia and Velasquez soil, respectively.
The treatments evaluated (Table 5.2) were half rate (0.5 EBR), full rate (1.0 EBR), and
double rate (2.0 EBR), plus a control without applied B (0.0 EBR).
All treatments were evaluated in plots consisting of six 10 m long rows with a
row spacing of 1.5 m, giving a total area of 90 m2
per plot, with eight replications in a
completely randomized design. Sugarcane variety CP-722086 was planted using current
commercial planting protocols using 8.4 ton cane ha-1
as planting seed cane placed in a
double chain at the bottom of the furrow (Melgar et al., 2014). The experiments were
planted in July 2015 and harvested in January 2016. For harvesting, the total area of each
plot was manually cut and packed stalks were weighted with a digital hanging scale.
Nitrogen (N) and phosphorus (P2O5) were applied to all treatments at 70 and 60
kg ha-1
respectively, as ammonium nitrate and triple super phosphate. Boron was applied
at planting at the bottom of the furrow as solid sodium octaborate (powder) and
incorporated with the soil before placing the planting canes. Soil samples were taken in
the furrow (top 0.2 m) to measure available B by hot water extraction at 3 and 6 months
after planting, and plant B absorption was measured by foliar analysis at 6 months (third
visible dewlap [TVD] leaf blade).
Hot water extractable B was determined using the technique of Berger and Truog
(1940) as simplified by Gupta (1967). Samples of 25.0 g of soil were boiled with 50.0
mL of deionized water for 5 min on a hot plate. After cooling, the slurries were stirred

121
and filtered using two Whatman No. 42 filter papers, and B was determined by
Inductively Coupled Plasma - Optical Emission Spectrometry (ICP-OES).
Plant tissue samples in paper bags were placed in an oven to dry for 24 h at 80°C.
Dried samples were then ground in a Wiley mill and passed through a 20 mesh screen.
The samples were digested following EPA Method 3052 (USEPA, 1995) as follows.
Around 0.500g samples were weighed out and placed in fluorocarbon polymer
microwave vessels. Then10 mL concentrated HNO3 was added to each vessel and sealed.
The sealed vessels were placed in a microwave digester (CEM Mars 6 Microwave,
Matthews, NC, USA) and heated at 200°C for 30 minutes. The digests (solutions) were
transferred quantitatively into volumetric flasks and brought to 100 mL volume with
deionized water. Finally, the solutions were analyzed for various elements following EPA
Method 200.8 (Creed et al., 1994) by Inductively Coupled Plasma - Optical Emission
Spectroscopy (ICP-OES) (Spectro Arcos FHS16, Germany). All results were reported as
parts per million (mg kg-1
). Calibration standards were from a certified source.
Independent laboratory performance checks were also run with acceptable deviations for
recoveries set at 100 ± 5%.
Because these experiments were in commercial fields, sugarcane was harvested as
planting material at 6 months after planting. Results are presented as actual weight
recorded per plot, and as tons of cane per hectare per month. Statistical analysis of yields,
hot water extractable B at 3 and 6 months, foliar B, and biometry (height and stalk
diameter) measurements were carried out using a one-way analysis of variance with the
least significant different (LSD) at p = 0.05 probability level. The differences among the
means were compared using Fisher’s LSD test for multiple comparisons.

122
5.4 Results and discussion
Increased availability of soil B
Hot water extractable B concentrations were below toxicity levels of 5 mg kg-1
(Nable et al., 1997) for all treatments at 3 and 6 months after planting (Table 5.3). The
highest application rates evaluated (15.2 and 20.0 kg B ha-1
for sites 1 and 2,
respectively) were as much as ten-fold greater than the ones used to alleviate deficiency
in non-fixing soils. This supports the assertion that B rates should be estimated based on
adsorption characteristics for soils that fix B strongly and that using the rates that are
commonly used in non-fixing soils (0.5 – 2 kg B ha-1
) do not significantly increase B
availability, which might explain the absence of responses in some crops showing
deficiency symptoms (Franco et al., 2011).
The average increases in available B calculated as the difference between hot
water extractable B in each treatment and the corresponding control plots for both sites
were 0.62, 1.20, and 2.40 mg B kg-1
for the 0.5EBR, 1.0EBR, and 2.0EBR treatments,
respectively all of which were statistically significant at p = 0.05 (Figure 5.1). Since the
rates were based on the amount of B required to reach 1.0 mg B L-1
in the soil solution,
these results show that the EBR responds in concordance with the expected increments of
available B. This is the first time that B rates have been estimated based on soil
physicochemical reactivity reflecting the importance that adsorption reactions play in the
availability of this micronutrient in soils containing amorphous minerals. These results
emphasize the importance of customizing B rates for different soils depending on their
adsorptive capacities, so that the rates applied are adequate to meet B requirements
without causing toxic effects.

123
Some authors have suggested that B toxicity can occur even when soil B levels
are below sufficiency. Franco et al. (2011) cited various studies that reported both
absence of crop response and toxicity effects to B applications in Brazilian soils. In their
study on sugarcane responses to soil B applications as side-placed drenches of 200 L ha-1
90 days after planting, they reported a reduction in sucrose yield after application of 2
and 4 kg B ha-1
, even though the soil B levels after treatment remained below the 0.5 mg
B dm-3
, considered to be deficient. The toxicity observed was probably due to local high
B concentrations that fostered increased uptake. Commercial experiments in Guatemala
(data not published) also suggest that one application of sodium octaborate
(Na2B8O13.4H2O) as a side-dressing reduced sugarcane yield in fields that had deficient
levels of soil B also probably due to the toxicity of the locally-placed high concentration.
There is little evidence in the literature of B toxicity occurring in crops grown on
highly-weathered soils at rates higher than those used in temperate region soils. Lima et
al. (2007) evaluated critical and toxic B levels for 10 different soils treated with rates
ranging from 0 to 12 mg B dm-3
soil in the state of Pernambuco, Brazil. Only five of the
ten soils responded to the B rates applied, and from their correlations toxic rates ranged
from 6.7 for an acidic yellow Oxisol, to 19.6 mg B dm-3
for a red Ultisol. Widely
different soil properties such as pH, clay and organic matter were responsible for the
differences in the toxicity levels observed. All these properties affect B adsorption
reactions in soils, which emphasize the need for performing B adsorption studies to
estimate the B rates to be applied for soils that have high B adsorption potential. Lima et
al. (2007) suggest that the critical soil B concentration to ensure adequate corn production
ranged from 0.9 to 2.3 mg B kg-1
soil (extracted by the hot water method) and for some

124
soils the rates of application to reach those levels of available B were significantly greater
than would be required for other soils.
Oliveira Neto et al. (2009) evaluated extractable (hot water) B in an acid red
Oxisol with an initial soil B content of 0.23 mg dm-3
at all depths from surface to 0.4 m
after application of increasing B rates. The highest rate (8 kg B ha-1
) increased hot water
extractable B to 0.8 mg dm-3
in the first 0.1 m of the profile, to 0.6 mg dm-3
at a depth of
0.1 to 0.2 m, with a negligible increase below that. According to the hot water soil B
values of Lima et al. (2007) even the 8 kg B ha-1
rate is insufficient to raise available B to
an adequate level. These data emphasize the relative lack of B movement in soils with
high B fixing capacities.
Impact on sugarcane B absorption
Foliar analyses taken at the Buganvilia site clearly show the responsiveness of
sugarcane to soil B applications (Table 6.4), with the control and 0.5 EBR treatments
recording deficient values and the 1.0EBR and 2.0EBR treatments recording sufficiency
levels. According to Meyer et al. (1971), adequate foliar B levels for sugarcane range
from 1.6 to 10 µg B g-1
. These values were derived from a survey of the South African
sugar industry and merely represent the extant situation at the time of sampling. They
cannot therefore be considered to be critical values in the true sense of the word. The
Florida Sugarcane Handbook (McCray et al., 2010) reports an optimum foliar range of 15
to 20 mg B kg-1
in the top visible dewlap leaf blade sampled during the grand growth
period which starts at about 120 days after planting lasting up to 270 days in a 12-month
crop. This period is the most important phase of the crop when the actual cane forms and

125
elongates. A critical value (concentration of B at which production losses due to nutrient
deficiency reach 5-10%) of 4 mg B kg-1
is reported by McCray et al., (2010). Using the
South African range, our control treatment is considered deficient, and the three
treatments receiving B (0.5EBR, 1.0EBR, and 2.0EBR) are within the adequate range. On
the other hand, according to Florida values, only the full and double rates (1.0EBR and
2.0EBR treatments) have B foliar levels above the critical value, and are yet far from the
optimum range (McCray et al., 2010).
Impact on sugarcane yield
Sugarcane yield was statistically significantly different between treatments only at
one site (Buganvilia) whereas at site 2 (Velasquez) the yield differences were not
statistically significant. The two experiments behaved differently probably because of
different initial available B contents in the soils which may reflect potentially different
capacities to supply B through mineralization of organic matter. At Buganvilia where the
initial soil B and organic matter content were lower, yield responses to increased B rates
were recorded, where the 1.0 EBR and 2.0 EBR treatments were about 5.7% higher than
the control and 0.5 EBR treatments. This yield increase was statistically significant at the
p = 0.05 level (Table 5.5).
It was not possible to measure sucrose content in the sugarcane juice because the
experiment did not run to maturity. The product of sucrose content and cane yield gives
sucrose per unit area, which is the ultimate variable farmers are interested in maximizing.
However, even without this information, results at Buganvilia support the hypothesis that
has been proposed to assess B availability. Yields for Valesquez are not statistically

126
significantly different (Table 5.6). The reasons for this are not clear but may be due to the
differences in initial soil B content, higher content of organic matter that could supply
more B by mineralization during the experiment, plant population variability within the
plots, or some other uncontrolled factor in the experimental units.
Height and stalk diameter showed no significant differences at both sites 4 months
after planting despite increases in B availability and absorption (data not shown).
According to the literature (Fageria, 2009; Moore and Botha, 2014), B improves
carbohydrate metabolism in sugarcane, which is probably not measurable in growth
parameters such as height and diameter. B absorption recorded as a higher foliar B
content increased with increasing B application rates, reflecting the responsiveness of this
crop to increased soil B availability.
5.5 Conclusions
Soil B availability increased and was maintained for up to 6 months without
causing toxicity after the application of B rates estimated based on B adsorption
equilibria with highly fixing soils. Two soils from the Pacific coastal plain of Guatemala
showed increases in available soil B content that follow the pattern predicted from the B
adsorption capacity of each soil even after application of potentially toxic rates of up to
15.2 and 20.0 kg B ha-1
. Sugarcane B absorption increased as soil B availability
increased, and did not reach levels consistent with potential B toxicity in the foliage.
Sugarcane yield responded positively to increased levels of B availability at one of the
two sites, and the increase in crop B absorption is an indication of potential
responsiveness in sucrose concentration, though more work is needed to confirm the
127
tentative conclusions specially when dealing with other crops that could be more
sensitive to toxic B levels. Soil B rates to alleviate deficiency problems in soils with large
adsorption capacities should be chosen based on adsorption equilibria, since the
formation of surface complexes is the main mechanism that limits B availability for plant
uptake.
References
Berger, K.C., and E. Truog. 1940. Boron deficiencies as revealed by plant and soil tests.
J. Am. Soc. Agron. 32:297–301.
Bingham F.T., A.L. Page, N.T. Coleman, and K. Flach. 1971. Boron adsorption
characteristics of selected amorphous soils from Mexico and Hawaii. Soil Sci.
Soc. Am. Proc. 35: 546-550.
Elrashidi, M. A., and G.A. O’Connor. 1982. Boron sorption and desorption in soils. Soil
Sci. Soc. Am. J. 46:27-31.
Fageria, N. K. 2009. The use of nutrients in crops plants. CRC Press, Inc., Boca Raton,
Fl.
Franco, H. C. J., E. Mariano, A.C. Vitti, C.E. Faroni, R. Otto, and P.C.O. Trivelin. 2011.
Sugarcane response to boron and zinc in southeastern Brazil. Sugar Tech 13:86-
95.
Goldberg, S. 1997. Reactions of boron with soils. Plant Soil. 193: 35-48.
Goldberg, S., and Su, C. 2007. New advances in boron soil chemistry. In: Advances in
plant and animal boron nutrition. F. Xu, H.E. Goldbach, P.H. Brown, R.W. Bell,

128
T. Fujiwara, C.D. Hunt, S. Goldberg, and L. Shi (eds.), Springer, Dordrecht, The
Netherlands, pp. 313-330.
Gupta, U.C. 1967. A simplified method for determining hot water-soluble boron in
Podzol soils. Soil Sci. 103:424–428.
Gupta, U. 1993. Boron and its role in crop production. CRC Press, Inc., Boca Raton, FL.
J. T. Creed, C. A. Brockhoff, and T. D. Martin, “US-EPA Method 200.8: determination
of trace elements in waters and wastes by inductively coupled plasma-mass
spectrometry,” in Environmental Monitoring Systems Laboratory Office of
Research and Development, Revision 5.4 EMMC Version, U.S. Environmental
Protection Agency, Cincinnati, Ohio, USA, 1994.
Keren, R., F.T. Bingham, and J.D. Rhoades. 1985. Plant uptake of boron as affected by
boron distribution between liquid and solid phases in soil. Soil Sci. Soc. Am. J.
49:297-302.
Lima, J. C. P. d. S., C. Nascimento, J. Lima, and M. Lira. 2007. Níveis críticos e tóxicos
de boro em solos de Pernambuco determinados em casa de vegetação. Rev. Bras.
Ciên. Solo 31:73-79.
McCray, J.M., R.W. Rice, I.V. Ezenwa, T.A. Lang, and L. Baucum. 2010. Sugarcane
Plant Nutrient Diagnosis. University of Florida Institute of Food and Agricultural
Sciences. SS-AGR-128. http://edis.ifas.ufl.edu/sc075.
Melgar, M., A. Meneses, H. Orozco, O. Pérez, and E. Espinoza. 2014. El cultivo de la
caña de azúcar en Guatemala. Cengicaña, Guatemala City, Guatemala.

129
Meyer, J.H., R.A. Wood, and P. du Preez. 1971. A nutrient survey of sugarcane in the
South African industry with special reference to trace elements. Proc. S. Afr.
Sugar Technol. Assoc. 45:1-8.
Moore, P.H., and F.C. Botha. 2014. Sugarcane: Physiology, Biochemistry and Functional
Biology. Wiley-Blackwell, Ames, Iowa, USA.
Nable, R. O., G.S. Bañuelos, and J.G. Paull. 1997. Boron toxicity. Plant Soil. 193: 181-
198.
Oliveira Neto, W., A. Muniz, M. Silva, C. Castro, and C. Borkert. 2009. Boron extraction
and vertical mobility in Paraná State oxisol, Brazil. Rev. Bras. Ciên. Solo
33:1259-1267.
Reuter, D.J., and J.B. Robinson. 1997. Plant analysis: An Interpretation manual. CSIRO
Publishing, Collingwood, Victoria, Australia.
Schalscha E.B., F.T. Bingham, G.G. Galindo, and H.P. Galvan. 1973. Boron adsorption
by volcanic ash soils in Southern Chile. Soil Sci. 116:70-76.
Su, C., and D.L. Suárez. 1995. Coordination of adsorbed boron: A FTIR spectroscopic
study. Environ. Sci. Technol. 29:302-311.
Su, C., and D.L. Suárez. 1997. Boron sorption and release by Allophane. Soil Sci. Soc.
Am. J. 61:69-77.
Terraza Pira, M. F., M. E. Sumner, M. Cabrera, and A. Thompson. 2017. Boron
adsorption and desorption on volcanic ash-derived soils. Soil Sci. Soc. Am. J. In
review.

130
USEPA Method 3052, “Microwave assisted acid digestion of siliceous and organically
based matrices,” in Test Methods For Evaluating Solid Waste, US Environmental
Protection Agency, Washington, DC, USA, 3rd edition, 1995.
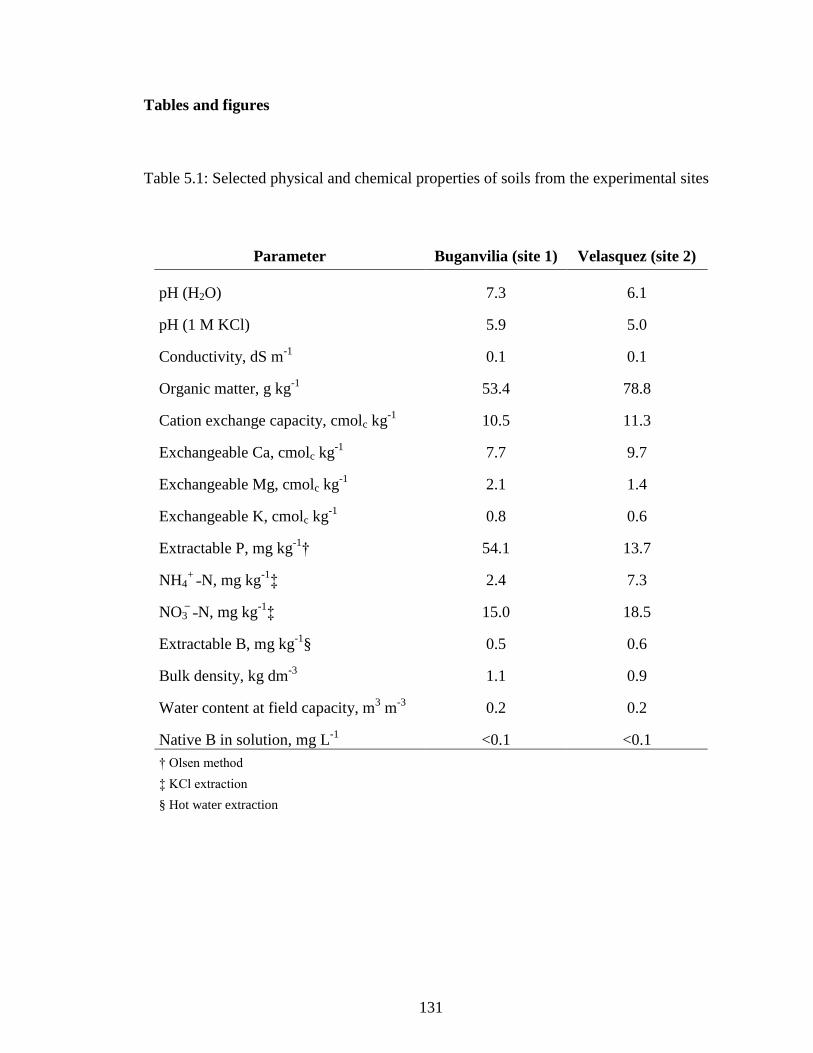
131
Tables and figures
Table 5.1: Selected physical and chemical properties of soils from the experimental sites
Parameter Buganvilia (site 1) Velasquez (site 2)
pH (H2O) 7.3 6.1
pH (1 M KCl) 5.9 5.0
Conductivity, dS m-1
0.1 0.1
Organic matter, g kg-1
53.4 78.8
Cation exchange capacity, cmolc kg-1
10.5 11.3
Exchangeable Ca, cmolc kg-1
7.7 9.7
Exchangeable Mg, cmolc kg-1
2.1 1.4
Exchangeable K, cmolc kg-1
0.8 0.6
Extractable P, mg kg-1
† 54.1 13.7
NH4+
˗N, mg kg-1
‡ 2.4 7.3
NO3̶ ˗N, mg kg
-1‡ 15.0 18.5
Extractable B, mg kg-1
§ 0.5 0.6
Bulk density, kg dm-3
1.1 0.9
Water content at field capacity, m3 m
-3 0.2 0.2
Native B in solution, mg L-1
<0.1 <0.1
† Olsen method
‡ KCl extraction
§ Hot water extraction

132
Table 5.2: Estimated boron rates (EBR) based on adsorption equilibrium
Buganvilia
(site 1)
Velasquez
(site 2)
Maximum adsorption capacity, mg B kg-1
soil† 53 83
Affinity parameter (Langmuir equation)† 0.072 0.054
B adsorbed, mg kg-1
‡ 2.8 4.0
B adsorbed, kg B ha-1
§ 5.6 8.0
B solution, kg B ha-1
¶ 2.0 2.0
Estimated Boron Rate (EBR), kg B ha-1
# 7.6 10.0
† From Chapter 2
‡ Amount of B adsorbed at equilibrium with 1.0 mg B L-1
in solution according to the Langmuir equation
§ Amount of B adsorbed in the volume of soil contained in 1 ha to 0.2 m deep
¶ Amount of B to maintain the soil solution at 1.0 mg B L-1
# B adsorbed plus B solution

133
Table 5.3: Soil B availability 3 and 6 months after application
B, mg kg-1
†
Site Treatment B rate, kg ha-1
3 months 6 months
Buganvilia 0.0 EBR 0.0 0.57 0.70
0.5 EBR 3.8 0.81 1.48
1.0 EBR 7.6 1.07 2.13
2.0 EBR 15.2 2.80 3.66
Velasquez 0.0 EBR 0.0 0.61 0.55
0.5 EBR 5.0 1.56 1.05
1.0 EBR 10.0 2.12 1.90
2.0 EBR 20.0 2.85 2.70
† Hot water extraction

134
Table 5.4: Foliar B contents for sugarcane 6 months after planting
Site Treatment B rate, kg ha-1
Foliar B, µg g-1
†
Buganvilia 0.0 EBR 0.0 1.46 c
0.5 EBR 3.8 2.68 bc
1.0 EBR 7.6 4.59 ab
2.0 EBR 15.2 5.39 a
† Means in a column followed by the same letter are not significantly different at P =
0.05

135
Table 5.5: Sugarcane yields for different boron rates at site 1 (Buganvilia)
Treatment Yield†, kg plot-1
Equivalent yield, Mg ha-1
mo-1
2.0 EBR 329.6 a 6.11a
1.0 EBR 327.7 a 6.07a
0.5 EBR 312.1 b 5.78b
0.0 EBR 309.4 b 5.73b
† Adjusted treatment means controlled by number of cane packs per plot, means in a column
followed by the same letter are not significantly different at p = 0.05

136
Table 5.6: Sugarcane yields for different boron rates in site 2 (Velasquez)
Treatment Yield†, kg plot-1
Equivalent yield, Mg ha-1
2.0 EBR 954.9 a 8.04a
1.0 EBR 951.6 a 8.01a
0.5 EBR 1055.0 a 8.88a
0.0 EBR 969.9 a 8.16a
† Adjusted treatment means controlled by number of cane packs per plot, means in a column
followed by the same letter are not significantly different t p = 0.05

137
Figure 5.1: Increase in soil B availability (Delta B) after application of boron rates (EBR)
estimated from B adsorption equilibria. Delta B calculated as the difference between each
treatment and the control plot.
138
CONCLUSIONS
Boron (B) availability in soils is determined by adsorption and desorption
reactions, and the study of the chemistry of mineral and organic surfaces that participate
in these reactions allows developing management strategies to solve deficiency and
toxicity problems for farmers in regions where this essential micronutrient compromises
yields and quality of crops. Such is the case of the very fertile volcanic ash-derived soils
in the Pacific coastal plain of Central America where the economically important crops
suffer sever B deficiency, and current management practices have failed to correct this
problem.
The organomineral characterization reveals the surface potential reactivity that
governs B dynamics in soils. Mineralogy of volcanic ash-derived soils is dominated by
SRO aluminosilicates and kaolinite. Only the soils with greater andic character (those
classified as Andisols) contain considerable amounts of imogolite, and the rest is
dominated by allophane. Small amounts of primary minerals (orthoclase and cristobalite)
and 2:1 clay minerals (smectites, most probably montmorillonite) are also present but
have less relevance in B adsorption reactions. The degree of crystallinity of the kaolinite
phase has an influence on the extent of surface area available and it has a direct impact on
B adsorption capacity. Surface area of smectite phases does not present sites available for
B complex formation, though to some extent these 2:1 clay minerals can contribute to the
formation of weaker outer-sphere complexes. Primary minerals are considered non-
reactive and they might lead to overestimation of active pools of Al and Fe by selective

139
dissolutions. The main mineral surface responsible for the observed differences of SSA
and B adsorption capacities between volcanic ash-derived soils is the amount of SRO
aluminosilicates, which govern the B surface reactivity even when they are present in
smaller amounts than the threshold to classify a soil as an Andisol.
Total soil organic matter has a poor correlation with B adsorption capacity for this
set of volcanic ash-derived soils. In a multiple linear regression only the most abundant
mineral surface (allophane and imogolite) explains variations in B adsorption. After
differentiating organic matter pools in each soil based on their thermal stability, a
multivariate analysis approach demonstrated that discrete pools of organic matter
influence surface properties of volcanic ash-derived soils differently. The partial least
squares regression models for specific surface area (SSA) and B maximum adsorption
capacity (bB) revealed that the recalcitrant fraction of organic matter directly affects B
adsorption capacities, and it has almost the same coefficient as the allophane and
imogolite content, and total Fe oxides. On the other hand, the only thermal fraction
explaining SSA is the refractory organic matter, even to a greater extent than the
allophane and imogolite contents. Labile organic matter was not a significant variable in
either of the two surface properties evaluated for this set of soils. Based in our results, we
propose that the contradictory effects of organic matter on B adsorption in soils is due to
different degrees of organic matter decomposability and mineral association, which are
the two main factors affecting thermal stability.
Guatemalan south coast soils influenced by volcanic ash have very variable
capacities to adsorb B, depending on the availability of mineral and organic surfaces, and
the affinity of those surfaces for B. Soil texture does not predict the behavior of the

140
adsorption maxima, since the andic character of the soils will determine the extent to
which B will be adsorbed. The main surface responsible for adsorption is allophane, and
organic matter becomes important only for those soils with clay contents smaller than
200 g kg-1
. The degree of hysteresis of desorption is a function of the andic character of
the soils, with higher contents of extractable amorphous aluminosilicates causing
irreversibility probably due to an interior migration and/or structural substitution. One
single easily-measured parameter to predict potential B availability as a function of the
andic character of the soils is the measurement of pH in NaF suspension, which has an
exponential relationship with amorphous Al responsible for B adsorption, and a linear
relationship with the amount of B adsorbed at equilibrium with 1.0 mg B L-1
in solution.
The pH in 1 mol L-1
NaF can be used as an initial guide for soil test purposes to predict
amorphous aluminum content, but should not be used directly as a predictor of likely
responses.
Soil B rate recommendations to solve deficiency problems in highly fixing soils
are based on historical recommendations formulated for soils with low potential to adsorb
B. For volcanic ash-derived soils, the extent to which B adsorbs is a key concept in
designing fertilization programs that are able of solving deficiencies, even when the rates
of application proposed break the paradigm of toxicity effects above 4.0 kg B per hectare.
Soil B availability increased and was maintained for up to 6 months without causing
toxicity after the application of B rates estimated based on B adsorption equilibrium with
highly fixing soils. Two soils from the Pacific coastal plain of Guatemala showed
increases in available soil B content that follow the pattern predicted from the B
adsorption capacity of each soil even after application of potentially toxic rates up to 15.2

141
and 20.0 kg B ha-1
. Sugarcane B absorption increased as soil B availability increased, and
did not reach levels consistent with potential B toxicity in the foliage. Sugarcane yield
responded positively to increased levels of B availability at one of the two sites, and the
increase in crop B absorption is an indication of potential responsiveness in sucrose
concentration, though more work is needed to confirm the tentative conclusions specially
when dealing with other crops that could be more sensitive to toxic B levels. Soil B rates
to alleviate deficiency problems in soils with large adsorption capacities should be chosen
based on adsorption equilibrium, since the formation of surface complexes is the main
mechanism that limits B availability for plant uptake.