Embed Size (px)
Citation preview

Supplementary Information
The transcription factor MAFB antagonizes anti-viral responses by
blockade of coactivator recruitment to IRF3
Hwijin Kim & Brian Seed *
Center for Computational and Integrative Biology, Massachusetts General Hospital,
Boston MA 02114, USA
Department of Genetics
Harvard Medical School, Boston MA 02115, USA
Phone: 617-726-5975. Fax: 617-643-3328. Email: [email protected]
*Corresponding Author – Mailing Address: CPZN 7-7228, Massachusetts General Hospital, 185 Cambridge Street, Boston, MA 02114. Phone: 617-726-5975. Fax: 617-643-3328. Email: [email protected]
Nat
ure
Imm
unol
ogy:
doi
:10.
1038
/ni.1
897

a b
d
Supplementary Fig. 1
c
None
RIG-I(
N)
MDA5(
N)0
2
4
6
8
10
12 Mock
MAFB
IFN
- β lu
cife
rase
activ
ity (
fold
)
None
Poly(I:
C)
None
RIG-I(
N)0
10000
20000
30000
40000
50000 Mock
Mafb
Ifn- β
luci
fera
seac
tivity
(R
LU)
ISRE
ISRE +
poly
(I:C)
RANTES
RANTES + p
oly(I:
C)AP1
AP1 + p
oly(I:
C)
MARE
MARE +
poly
(I:C)
0
20
40
60
80
100Mock
MAFB
Luci
fera
se a
ctiv
ity (
fold
)
None
Poly(I:
C)
RIG-I(
N)
MDA5(
N)
MyD
880
10
20
30
40
50Mock
MAFBN
F- κ
B lu
cife
rase
activ
ity (
fold
)
Nat
ure
Imm
unol
ogy:
doi
:10.
1038
/ni.1
897

Supplementary Figure 1. MAFB negatively regulates Type I Interferon induction. (a) HEC1B cells were transfected with IFN-β-Luc (10 ng) and RIG-I(N) or MDA5(N) (100 ng each) together with vector control or MAFB expression plasmid (50 ng each), and luciferase activity was measured 32 h later. (b) RAW 264.7 cells were transfected with mIFN-β-Luc (10 ng) together with empty control or mouse Mafb (100 ng each). Poly(I:C) (25 μg/ml) was added at 24 h post-transfection, and RIG-I(N) (100 ng) was cotransfected at 0 h. Luciferase activity was measured at 18 h after stimulation. Equivalent results were obtained using J774A.1 cells (not shown). (c, d), Effect of MAFB on activation of (c) ISRE-Luc, RANTES-Luc, AP1-Luc or MARE-Luc, and (d) NF-κB-Luc by poly(I:C), RIG-I(N), MDA5(N) or MyD88. 293ETN cells were transfected with vector control or MAFB expression plasmid (100 ng (c) or 50 ng (d) each) together with the indicated luciferase reporter (10 ng each). Poly(I:C) was added at 24 h post-transfection, and RIG-I(N), MDA5(N) or MyD88 (100 ng each) was cotransfected at 0 h. Luciferase activity was measured at 48 h (c) or 32 h (d) post-transfection. (a, c, d), Luciferase activity was measured as fold increase relative to the basal level luciferase activity in mock-transfected control without stimulation for each reporter. (a-d), Data indicate the mean and the standard deviation of at least four within-plate replicates, and results representative of at least two independent experiments are shown.
Nat
ure
Imm
unol
ogy:
doi
:10.
1038
/ni.1
897

a
c
d e
Supplementary Fig. 2
b
HA-MAFB − + + + + + + + +
α-MAFB sh/siRNA − − sh − si-1 si-2 si-3 − si-4
IB: α-HA
Moc
k
-MAFB
αM
ock
-MAFB1
α -MAFB2
α -MAFB3
α
0.0
0.5
1.0
1.5
2.0
2.5
shRNA siRNA
IFN
- β lu
cife
rase
activ
ity (
fold
)
Moc
k
-MAFB3
αM
ock
-MAFB4
α
0.0
0.5
1.0
1.5
2.0
HeLa HT-1080
IFN
- β lu
cife
rase
activ
ity (
fold
)
Irf7 Rig-I0
1
2
3
4
5
6
7
8Mafb+/−
Mafb−/−
p < 0.004 p < 0.001
mR
NA
(fo
ld)
None Poly(I:C)0.0
0.5
1.0
1.5
2.0
2.5
3.0Mafb+/−
Mafb−/−
p < 0.001
Cas
pase
3 lu
cife
rase
activ
ity (
fold
)
Nat
ure
Imm
unol
ogy:
doi
:10.
1038
/ni.1
897

Supplementary Figure 2. Knockout or knockdown of MAFB facilitates Type I interferon induction. (a) Comparison of endogenous gene expression levels between Mafb−/− and Mafb+/− MEFs by RT-PCR. All samples were assayed in triplicate. All values were normalized to β-actin, and the values of each gene were further normalized to the corresponding gene value from Mafb+/− MEFs. Data are expressed as mean ± SD, and results representative of at least three independent experiments are shown. (b) Susceptibility of Mafb−/− MEFs to dsRNA-induced apoptosis. Mafb−/− MEFs were stimulated with poly(I:C) (25 μg/ml), and luciferase activity mediated by active caspase 3 was measured at 8 h post-stimulation. Luciferase activity was measured as fold increase relative to the basal level luciferase activity in Mafb+/− MEFs without stimulation. Data indicate mean ± SD of at least five within-plate replicates, and results representative of at least three independent experiments are shown. (c) MAFB knockdown efficiency by α-MAFB shRNA or siRNAs. 293ETN cells were transfected with HA-MAFB in the absence and presence of α-MAFB shRNA or siRNAs, and cell lysates were prepared at 72 h post-transfection, followed by immunoblotting with anti-HA antibody. (d, e), Effect of MAFB knockdown using α-MAFB shRNA or siRNAs on activation of IFN-β-Luc in (d) 293ETN and (e) HeLa or HT-1080 cells. Cells were transfected with control, α-MAFB shRNA (100 ng) or α-MAFB siRNA (5 pmol) together with the luciferase reporter ((d) 10 ng and (e) 25 ng). The cells were stimulated by poly(I:C) (25 μg/ml) at 50 h (shRNA) and 60 h (siRNA) post-transfection, and luciferase activity was measured 13.5 h later. Luciferase activity was measured as fold increase relative to the basal level luciferase activity in mock-transfected control for each cell line. Data indicate mean ± SD of at least four within-plate replicates, and results representative of three independent experiments are shown.
Nat
ure
Imm
unol
ogy:
doi
:10.
1038
/ni.1
897

c
a
b
Supplementary Fig. 3
Poly(I:C) − − + +
Location cytoplasm nucleus cytoplasm nucleus
IB: α-MAFB
IRF3
IRF3
+ poly
(I:C)
IRF7
IRF7
+ poly
(I:C)
IRF3(
5D)
IRF3(
5D) +
poly
(I:C)
0
5
10
15
20
25Mock
MAFB
IFN
- β lu
cife
rase
activ
ity (
fold
)
Before poly(I:C) stimulation After poly(I:C) stimulation (6 h)
Nat
ure
Imm
unol
ogy:
doi
:10.
1038
/ni.1
897

Supplementary Figure 3. MAFB interferes with IRF3 and IRF7 activities. (a) Effect of MAFB on activation of IFN-β-Luc mediated by IRF3, IRF7 or IRF3(5D). 293ETN cells were transfected with 10 ng of IFN-β-Luc and the expression vectors shown (100 ng each). Poly(I:C) (25 μg/ml) was added 24 h later as indicated, and luciferase activity was measured at 48 h post-transfection (30 h for IRF3(5D)). Luciferase activity was measured as fold increase relative to the basal level luciferase activity in mock-transfected control without poly(I:C) stimulation for each indicated expression vector (x-axis). Data indicate mean ± SD of at least four within-plate replicates, and results representative of at least two independent experiments are shown. (b, c), Cellular localization of IRF3 and MAFB. (b) 293ETN cells were transfected with pEGFP-IRF3 and pRFP-MAFB expression vectors, and analyzed using fluorescence microscopy (63x resolution, Zeiss Axioplan 2) 36 h later. (c) 293ETN cells were transfected with MAFB expression vector, and nuclear and cytoplasmic extracts were prepared using NE-PER Nuclear and Cytoplasmic Extraction Reagents (PIERCE) 36 h later, followed by immunoblotting with anti-MAFB antibody. Poly(I:C) was added for 6 h as indicated.
Nat
ure
Imm
unol
ogy:
doi
:10.
1038
/ni.1
897

b
c
a
Extended HomologyRegion
HistidineRepeat
111 3231 209
Activation Domain
237 265
Basic DBD LeucineZipper
(M-N1)(M-N2)
(MAFB)
(M-C1)(M-C2)
Supplementary Fig. 4
IP MAFB MAFB
Poly(I:C) − + 4h
IP: α-MAFBIB: α-IRF3
IB: α-MAFB
IB: α-IRF3
HA-MAFB + + + + + + + + +
Flag-tagged Empty IRF3 IRF3 IRF7 TBK1 IKKε IRF7 TBK1 IKKε
IP: α-HAIB: α-Flag
IB: α-HA
IB: α-Flag
Flag-IRF3 + + + + + +
HA-tagged Empty M-N1 M-N2 M-C1 M-C2 MAFB
Poly(I:C) − − + − − − + + +
IB: α-Flag
IB: α-HA
IP: α-FlagIB: α-HA
∗
N-HA − − C
P/S/T-Rich
Nat
ure
Imm
unol
ogy:
doi
:10.
1038
/ni.1
897

Supplementary Figure 4. MAFB interacts with IRF3. (a) Interaction of endogenous MAFB with endogenous IRF3 in HepG2 cells at the indicated times after poly(I:C) stimulation. Immunoblots using 6% of input lysate are also shown. (b) Effect of poly(I:C) stimulation on interaction of HA-MAFB with Flag-IRF3, -IRF7, -TBK1 or -IKKε. Immunoblots using 3% of input lysate are also shown (middle and lower panels). (c) Interaction of Flag-IRF3 with HA-tagged MAFB deletion mutants in 293ETN cells. A schematic diagram of MAFB and its deletion mutants is shown at the top. The bands
indicated by * denote nonspecific bands.
Nat
ure
Imm
unol
ogy:
doi
:10.
1038
/ni.1
897
a
b
Virus-ActivatedDomain (VAD)
Constitutive ActivationDomain (CAD)
Signal ResponseDomain (SRD)
InhibitoryDomain (ID)
151 467 5031 246
DNA BindingDomain (DBD)
(C1)(C2)
(N1)(N2)
(N3)IRF7
305
Supplementary Fig. 5
HA-MAFB + + + + + + +
Flag-tagged Empty N1 N2 N3 C1 C2 IRF7
IP: α-HAIB: α-Flag
IB: α-HA
IB: α-Flag
∗
N-Flag − − C
Moc
k
MAFB
IRF3
IRF7
IRF7
+ MAFB
0
50
100
150
200 No Poly(I:C)
Poly(I:C)
IFN
- α4
luci
fera
seac
tivity
(fo
ld)
Nat
ure
Imm
unol
ogy:
doi
:10.
1038
/ni.1
897

Supplementary Figure 5. MAFB interacts with IRF7. (a) Effect of MAFB on activation of IFN-α4-Luc mediated by IRF3 or IRF7. 293ETN cells were transfected with 10 ng of IFN-α4-Luc and the expression vectors shown (100 ng each). Poly(I:C) (25 μg/ml) was added 24 h later as indicated, and luciferase activity was measured at 48 h post-transfection. Luciferase activity was measured as fold increase relative to the basal level luciferase activity in mock-transfected control without poly(I:C) stimulation. Data indicate mean ± SD of at least four within-plate replicates, and results representative of two independent experiments are shown. (b) Interaction of HA-MAFB with Flag-tagged IRF7 deletion mutants in 293 ETN cells. A schematic diagram of full-length IRF7 and its deletion mutants is shown at the top. Immunoblot analysis showed that all the IRF7 deletion mutants were efficiently expressed. The bands indicated by * denote nonspecific bands.
Nat
ure
Imm
unol
ogy:
doi
:10.
1038
/ni.1
897

c d
b
e
*
a
Supplementary Fig. 6
Flag-IRF3 + + +
HA-IRF3 + + +
Poly(I:C) − + +
MAFB − − +
IP: α-HAIB: α-Flag
IB: α-Flag
IB: α-HA
IRF3(5D) + +
MAFB − +
IB: α-IRF3
IRF3-Flag − + + + − −
Flag-MAFB − − − + + +
α-Flag Ab − − + − − +
Probe P31 MARE
IRF3(5D)-Flag + + + + + +
α-Flag Ab − + − − − +
MAFB − − + − + −
Probe P31 ISG15
His-MAFB + + + + + +
α-His Ab − + − + − +
Probe P31 PRDIV-P31 MARE
Nat
ure
Imm
unol
ogy:
doi
:10.
1038
/ni.1
897

Supplementary Figure 6. Effect of MAFB on dimerization and DNA binding of IRF3. (a, b), Effect of MAFB on IRF3 dimerization. (a) 293ETN cells were transfected with Flag- and HA-IRF3 in the absence and presence of MAFB coexpression. Poly(I:C) was added 24 h later as indicated, and cell lysates were prepared at 36 h post-transfection. (b) Native PAGE to detect IRF3 Dimerization. 293ETN cells were transfected with IRF3(5D) in the absence and presence of MAFB coexpression. Cell lysates were prepared at 36 h post-transfection, and native PAGE in the presence of 1% deoxycholate was performed. Monomeric or dimeric form of IRF3(5D) was immunoprecipitated with anti-IRF3 antibody. (c-e) EMSA analysis using (c) 293ETN-expressed and immunopurified C-terminal Flag-IRF3 and N-terminal Flag-MAFB proteins (0.4 μg each), (d) HEC1B nuclear extracts transfected with C-terminal Flag-IRF3(5D) in the absence and presence of MAFB coexpression, and (e) in vitro translated N-terminal His-MAFB (4 μl). Purified proteins or nuclear extracts were incubated with the indicated 32P-labeled probe. All the nuclear extracts were prepared in the presence of 1% deoxycholate in order to uncouple the effect of CBP (or p300) on IRF3 DNA binding. Binding specificity was determined by a supershift assay using anti-Flag M2 antibody (c, d) or anti-His antibody (e).
Nat
ure
Imm
unol
ogy:
doi
:10.
1038
/ni.1
897

d
c
f
e
g
Supplementary Fig. 7
a b
IP: α-CBPIB: α-Flag
IB: α-CBP
IB: α-Flag
Flag-IRF3(394) + + +
Poly(I:C) − + +
MAFB − − +
Contro
lW
T
N248S
Contro
lW
T
N248S
0
10
20
30
40
50 No Poly(I:C)
Poly(I:C)
IFN
- β lu
cife
rase
activ
ity (
fold
)
Contro
lW
T
N248S
Contro
lW
T
N248S
0
2
4
6
8
10
12 No Poly(I:C)
Poly(I:C)
MA
RE
luci
fera
seac
tivity
(fo
ld)
Moc
k 0 25 75 150
300
Moc
k 0 25 75 150
300
0.0
0.2
0.4
0.6
0.8
1.0
1.2 No Poly(I:C)
Poly(I:C)
CBP (ng)+ MAFB (25 ng)
CBP (ng)+ MAFB (100 ng)
IRF3 (100 ng)
IFN
- β lu
cife
rase
activ
ity (
fold
)
Moc
k 0 25 75 150
Moc
k 0 25 75 150
010
100
150
200
250
300
350
400
CBP (ng)+ IRF3 (100 ng)
CBP (ng)+ MAFB (100 ng)
IFN
- β lu
cife
rase
activ
ity (
fold
)
Moc
k
MAFB γ
PPAR
+ M
AFB
γ
PPAR
α
PGC1
+ M
AFB
α
PGC1
0
10
20
30
40
50
60
70
PP
RE
luci
fera
seac
tivity
(fo
ld)
Contro
lW
TK32
R
K297R
K32,2
97R
Contro
lW
TK32
R
K297R
K32,2
97R
010
50
100
150
200
250
300
350 No Poly(I:C)
Poly(I:C)
IFN
- β lu
cife
rase
activ
ity (
fold
)
Nat
ure
Imm
unol
ogy:
doi
:10.
1038
/ni.1
897

Supplementary Figure 7. Mechanisms underlying MAFB-mediated suppression of Type I IFN induction. (a, b) Effect of a DNA binding-defective mutant of MAFB (N248S) on activation of (a) IFN-β-Luc and (b) MARE-Luc. 293ETN cells were transfected with the indicated luciferase reporter (10 ng each) and MAFB variant vector (100 ng each), and poly(I:C) was added 24 h later. Luciferase activity was measured at 48 h post-transfection as fold increase relative to the basal level luciferase activity in mock-transfected control without poly(I:C) stimulation. (c) Effect of MAFB on the interaction between Flag-IRF3(394) and endogenous CBP. 293ETN cells were transfected with Flag-IRF3(394) in the absence and presence of untagged MAFB, and poly(I:C) was added 24 h later as indicated. Cell lysates were prepared at 36 h post-transfection, and endogenous CBP was immunoprecipitated using anti-CBP antibody A22, followed by immunoblotting with anti-Flag M2. (d) Effect of CBP overexpression on MAFB-mediated repression of the IRF3-triggered IFN-β activation. 293ETN cells were transfected with IFN-β-Luc (10 ng) and IRF3 vector (100 ng) together with indicated amounts of MAFB and CBP expression vectors, and poly(I:C) was added 24 h later. Luciferase activity was measured at 48 h post-transfection as fold change relative to the luciferase activity in mock-transfected control. The cases in the absence and presence of poly(I:C) stimulation were independently normalized relative to the respective mock-transfected controls. (e) Effect of CBP coexpression on IRF3- or MAFB-mediated activation of IFN-β-Luc. 293ETN cells were transfected with IFN-β-Luc (10 ng) and IRF3 or MAFB vector (100 ng each) together with indicated amounts of CBP expression vectors. (f) Effect of MAFB on PPARγ or PGC1α-mediated activation of PPRE-Luc. 293ETN cells were transfected with PPRE-Luc (5 ng) together with PPARγ or PGC1α vector (100 ng each) in the absence and presence of MAFB coexpression (100 ng). (e, f), Luciferase activity was measured at 48 h post-transfection as fold change relative to the luciferase activity in mock-transfected control. (g) Effect of sumoylation-deficient mutants of MAFB on activation of IFN-β-Luc. 293ETN cells were transfected with IFN-β-Luc (10 ng) and MAFB variant vector (100 ng each), and poly(I:C) was added 24 h later. Luciferase activity was measured at 48 h post-transfection as fold increase relative to the basal level luciferase activity in mock-transfected control without poly(I:C) stimulation. (a, b, d-g), Data indicate mean ± SD of at least four within-plate replicates, and results representative of at least two independent experiments are shown.
Nat
ure
Imm
unol
ogy:
doi
:10.
1038
/ni.1
897

b
fe
d
g
a
c
Supplementary Fig. 8
Contro
l
Poly(I:
C)
RIG-I(
N)
MDA5(
N)0
10
50
100
150
200
250
300 Mock
MAFB
c-MAF(s)
c-MAF(L)
NRL
MAFA
IFN
- β lu
cife
rase
activ
ity (
fold
)
0 2 4 10 0 2 4 100
2
4
6
8
10
IFN-β MAFB
Time after poly(I:C) induction (h)
mR
NA
indu
ctio
n (f
old)
Huh7
Huh7
+ CsA
Clone
A
Clone
A + C
sA0.0
0.5
1.0
1.5
2.0
2.5
3.0Probe 1
Probe 2
Probe 3
c-M
AF
exp
ress
ion
(fol
d)
−2.0
−1.5
−1.0
−0.5
0.0
0.5
1.0
1.5
2.0 Untreated
Poly(I:C)
Ifn-α/β Mafb c-Maf NrlIrf7
Sta
ndar
dize
d va
lue
(z)
−2.0
−1.5
−1.0
−0.5
0.0
0.5
1.0
1.5
2.0 Untreated
LPS
Mafb c-Maf NrlIrf7
Sta
ndar
dize
d va
lue
(z)
−2.0
−1.5
−1.0
−0.5
0.0
0.5
1.0
1.5
2.0 Inactive SeV
Active SeV
Ifn-α/β Mafb c-Maf NrlIrf7
Sta
ndar
dize
d va
lue
(z)
−2.0
−1.5
−1.0
−0.5
0.0
0.5
1.0
1.5
2.0 Untreated
LPS
Mafb c-Maf NrlIrf7
Sta
ndar
dize
d va
lue
(z)
Nat
ure
Imm
unol
ogy:
doi
:10.
1038
/ni.1
897

Supplementary Figure 8. Regulation of MAFB expression in response to pathogen-mimetic stimuli. (a) Effect of large MAF transcription factors on activation of IFN-β-Luc by poly(I:C), RIG-I(N), or MDA5(N). 293ETN cells were transfected with IFN-β-Luc (10 ng) and indicated large MAF expression vectors (100 ng each). c-MAF(s) and c-MAF(L) denote shorter and longer isoforms of c-MAF, respectively. The transfected cells were either stimulated with poly(I:C) (25 μg/ml) 24 h later, or cotransfected with RIG-I(N) or MDA5(N) (100 ng each) at 0 h, and luciferase activity was measured at 36 h post-transfection as fold increase relative to the basal level luciferase activity in mock-transfected control before stimulation. Data indicate mean ± SD of at least six within-plate replicates, and results representative of at least two independent experiments are shown. (b-e), Regulatory patterns of expression of MAFB and other large MAF transcription factors in response to pathogen-mimetic stimulation in a variety of cell types. (b) murine peritoneal macrophages in response to poly(I:C)1, an agonist for TLR3 and MDA5, (c) murine RAW 264.7 macrophages in response to LPS2, (d) murine tissue macrophages in response to Sendai virus (SeV)3, and (e) murine spleen tissue in response to lipopolysaccharide (LPS)4, an TLR4 agonist. Microarray expression values were standardized (to Z-values) for each probe set separately, and data are expressed as mean ± SD of each treatment for each indicated probe (x-axis). (f) In HeLa cells, the levels of IFN-β and MAFB mRNAs were measured by RT-PCR at the indicated times after poly(I:C) induction. All samples were assayed in triplicate. Expression levels were normalized to β-actin, and further normalized to the corresponding gene value before poly(I:C) stimulation. Data are expressed as mean ± SD. (g) Expression patterns of c-MAF in naïve and HCV-replicon-containing (Clone A) Huh7 cells. Microarray expression values (measured in triplicate)5 were normalized to the values of naïve Huh7.
Nat
ure
Imm
unol
ogy:
doi
:10.
1038
/ni.1
897

b c
0 25 50 75 100 125 150 175 2000
0.5
1
1.5
2
2.5x 10
4
MAFB (ng)
RLU
a
IFN-β
MAFB
RNAPIIkaI3 kd
I3 RNAPII
RNAPII
fI3kpeI3 kelo
MAFBfihkpe
ih
CBP
(1-ε ih)kini
RNAPII RNAPII
RNAPII
ε ihkini
kaM kd
M
kini
kpeM
fMkpeM
RNAPII RNAPII
RNAPIIGTF
IRF3
IRF3
CBP
MAFBMAFB
IRF3
IFN-β
IFN-β
kelo
kelo
IRF3
IRF3
MAFB kpeih
kpeI3
kaH
kdH
kdH
Supplementary Fig. 9
0 10 25 50 75 100
150
200 0 10 25 50 75 10
015
020
00
2.5
5.0
7.5
10.0
12.5
15.0
17.5
20.0No Poly(I:C)
Poly(I:C)
MAFB (ng)
IFN
- β lu
cife
rase
activ
ity (
RLU
x 1
04 )
Nat
ure
Imm
unol
ogy:
doi
:10.
1038
/ni.1
897

h i
0 5 10 15 20 25 30 35 40 450
0.25
0.5
0.75
1
1.25
1.5
1.75
2x 10
5
Time (hr)
RLU
No ChangeDownregulation 0
25
75
f g
0 25 50 75 100 125 150 175 2000.2
0.4
0.6
0.8
1
1.2
1.4
1.6
1.8
2x 10
5
MAFB (ng)
RLU
r = 1r = 1.5r = 2
0 25 50 75 100 125 150 175 2000.2
0.4
0.6
0.8
1
1.2
1.4
1.6
1.8
2x 10
5
MAFB (ng)
RLU
q = 1q = 1.1227q
0 = 1.3238 (gradual)
ed
0 25 50 75 100 125 150 175 2000
0.25
0.5
0.75
1
1.25
1.5
1.75
2x 10
5
MAFB (ng)
RLU
0 25 50 75 100 125 150 175 2000.5
0.6
0.7
0.8
0.9
1
MAFB (ng)
Exte
nt
of M
AFB
-med
iate
d In
hib
itio
n (ε
ih)
r = 1r = 1.5r = 2
0 25 50 75 100 125 150 175 2000.2
0.4
0.6
0.8
1
1.2
1.4
1.6
1.8
2x 10
5
MAFB (ng)
RLU
k ratio = 1, q = 1k ratio = 12.9, q = 1.1491k ratio = 16.0, q = 1.3393 (gradual)0
Supplementary Fig. 9Nat
ure
Imm
unol
ogy:
doi
:10.
1038
/ni.1
897

n o
01000
20003000
020406080100−20
−10
0
10
20
30
% IRF3 ActivationkaH (M-1s-1)
% C
hang
e in
RLU
0500
10001500
20002500
3000
020
4060
80100−40
−30
−20
−10
0
% C
hang
e in
RLU
% IRF3 Activation kaH (M-1s-1)
l m
0500
10001500
20002500
3000
020
4060
80100
0
10
20
30
40
50
60
% R
educ
tion
in ε
ih
kaH (M-1s-1)
% IRF3 Activation 0500
10001500
20002500
3000
020
4060
80100
0
0.5
1
1.5
2
2.5
x 105
kaH (M-1s-1)
% IRF3 Activation
RLU
j k
0 5 10 15 20 25 30 35 40 450
0.5
1
1.5
2
2.5x 10
5
Time (hr)
RLU
kaH = 0
kaH = 3 * 10 2 M −1s −1
kaH = 3 * 10 3 M −1s −1
0 5 10 15 20 25 30 35 40 450.15
0.2
0.25
0.3
0.35
0.4
0.45
0.5
0.55
Time (hr)
kaH = 0
kaH = 3 * 10 2 M −1s −1
kaH = 3 * 10 3 M −1s −1
ε ih
Supplementary Fig. 9Nat
ure
Imm
unol
ogy:
doi
:10.
1038
/ni.1
897

Supplementary Figure 9. Mathematical modeling of Type I IFN induction and its regulation by MAFB. (a) Schematic illustration of the MAFB-mediated regulation of Type I IFN induction. (b) Effect of MAFB on activation of IFN-β-Luc. 293ETN cells were transfected with IFN-β-Luc (10 ng) together with empty pCMV control or the indicated amounts of MAFB expression vector, and poly(I:C) (25 μg/ml) was added to cell media 24 h later as shown. Luciferase activity was measured at 44 h post-transfection. Data indicate mean ± SD of at least five within-plate replicates. (c, d), Nonlinear least-square fitting of the mathematical model to the luciferase activity data (from (b)) in the absence (c) and presence (d) of poly(I:C) stimulation. The data (open circles) and the best-fit curve generated from the model are shown. (e) Dependency of MAFB-mediated inhibition of IRF3-CBP preinitiation complex formation (εih = Mr/( +Mr)) on MAFB concentration (M) and the kinetic order of MAFB interacting with IRF3 (r) when Kih = Ms. (f) Effect of different assumptions for r on model fitting when Kih = Ms. (g) Effect of the MAFB binding order to the IFN-β promoter (q) on model
fitting. ‘gradual’ indicates
rihK
)100
100)((0
−
=ngMAFB
qq . (h) Effect of the processivity of an IRF3-mediated preinitiation complex ( ) on model fitting. ‘k ratio’ denotes / . (i) Effect of a viral elicitor-induced MAFB downregulation on the IFN-β activation. The data (open circles) and time profiles of model-predicted luciferase activities are shown. Number on each curve denotes a MAFB concentration (0, 25 and 75 ng). (j, k), Effect of IRF3-MAFB hetero-complex formation ( ) on model-predicted (j) luciferase activities and (k) εih. (l, m), Effect of and IRF3 activation rate on (l) a percent reduction in the capacity of MAFB to inhibit the IRF3-CBP preinitiation complex formation, defined as RE = 100*(εih,min( =0) − εih,min( )) / εih,min( =0), and (m) the corresponding IFN-β luciferase activity. Results were obtained under the assumption that the IRF3-MAFB hetero-complex can bind to the IFN-β promoter with the same rate constant as that of free IRF3. y-axis label is the percentage of the baseline value of IRF3 activation rate (I3,in = 48.8785 molecule/min). (n, o) Effect of and IRF3 activation rate on the IFN-β luciferase activity when the amounts of MAFB overexpression were (n) 0 ng and (o) 75 ng. Results were obtained in the limit of zero binding of the IRF3-MAFB hetero-complex to the IFN-β promoter. Percent changes in the IFN-β luciferase activity, defined as 100*(LA( ) − LA( =0)) / LA( =0), were plotted on z-axis. LA = luciferase activity. Hence, a positive (or negative) number denotes that the IFN-β luciferase activity for a given value is higher (or lower) than the activity for = 0.
3Ipek
Hak
Hak
3Ipek M
pek
Hak
ak
Hak
Hak
ak
Hak
H
Hak H
Hak H
ak
Nat
ure
Imm
unol
ogy:
doi
:10.
1038
/ni.1
897

Reporter Transcription factor response element ReferenceIFN-β-Luc Human IFN-β promoter (–112 to –1) 6,7
IFN-β-Luc(m) IRF3 and 7 binding-deficient human IFN-β promoter
(substitution of PRDIII-PRDI of IFN-β-Luc with GGCCAACTCCAAGGCCAAAGTCCCCGTG)
8
PRDII-Luc PRDII motif of human IFN-β promoter (deletion of PRDIII-PRDI and PRDIV from IFN-β-Luc)
mIFN-β-Luc Murine Ifn-β promoter (-125 to +55) 9 RANTES-Luc Human RANTES promoter (-397 to 15) 10 IFN-α4-Luc Human IFN-α4 promoter (-620 to 65) 10
P31CS-Luc 6x of consensus IRF3 binding domain, plus a synthetic TATA element (sTATA) 10
ISRE-Luc 12x of ISRE of ISG54, plus sTATA 11 MARE-Luc 3x of consensus MAF response element, plus sTATA 12,13
p53-Luc 12x of p53-responsive element, plus sTATA 14 PPRE-Luc 3x of DR1 element, plus sTATA 15 AP1-Luc* 4x of AP1 motif, plus sTATA 16
NF-κB-Luc* 4x of NF-κB motif, plus sTATA 17 (Gal4)5-Luc 5x of a Gal4 binding site (pFR-Luc, Stratagene)
Supplementary Table 1. Transcriptional luciferase reporters. An indicated response
element was inserted into the pGL4 vector (Promega). * AP1 and NF-κB motifs were
inserted into the pEAK vector.
Nat
ure
Imm
unol
ogy:
doi
:10.
1038
/ni.1
897

Gene Forward (f) or Backward (b) Sequence (5’ → 3’)
mouse Ifn-α18 f CCTTCCACAGGATCACTGTGTACCTb TTCTGCTCTGACCACCTCCC
mouse Ifn-β18 f CACAGCCCTCTCCATCAACT b TCCCACGTCAATCTTTCCTC
mouse β-actin18 f GGACTCCTATGTGGGTGACGAGG b GGGAGAGCATAGCCCTCGTAGAT
mouse Gapdh f AACGACCCCTTCATTGAC b TCCACGACATACTCAGCAC
mouse Emr1 f TTTCCTCGCCTGCTTCTTC b CCCCGTCTCTGTATTCAACC
mouse Irf7 f GAGACTGGCTATTGGGGGAG b GACCGAAATGCTTCCAGGG
mouse Rig-I f ATTGTCGGCGTCCACAAAG b GTGCATCGTTGTATTTCCGCA
mouse c-Maf f AGCAGTTGGTGACCATGTCG b TGGAGATCTCCTGCTTGAGG
human β-actin f CTGGAACGGTGAAGGTGACA b AAGGGACTTCCTGTAACAATGCA
human GAPDH f GGAGCCAAACGGGTCATCATCTC b GAGGGGCCATCCACAGTCTTCT
human IFN-β f ACGCCGCATTGACCATCTATG b CGGAGGTAACCTGTAAGTCTGT
human IFN-α1 f GCCTCGCCCTTTGCTTTACT b CTGTGGGTCTCAGGGAGATCA
human c-MAF f GCAATGAGCAACTCCGACCTG b GCCGGTCATCCAGTAGTAGTCT
human & mouse MAFB
f GACGCAGCTCATTCAGCAG b CCGGAGTTGGCGAGTTTCT
Supplementary Table 2. Real-time PCR Primers. Primer sequences were selected using
the MGH PrimerBank (pga.mgh.harvard.edu/primerbank/) unless otherwise specified.
Nat
ure
Imm
unol
ogy:
doi
:10.
1038
/ni.1
897

Probe Direction Sequence (5’ → 3’)
P31 sense GAAAACTGAAAGGGAGAAGTGAAAGTG antisense CACTTTCACTTCTCCCTTTCAGTTTTC
PRDIV-P31
sense AAATGACATAGGAAAACTGAAAGGGAGAAGTGAAAGTGantisense CACTTTCACTTCTCCCTTTCAGTTTTCCTATGTCATTT
ISG1519 sense GATCGGGAAAGGGAAACCGAAACTGAAGCC antisense GGCTTCAGTTTCGGTTTCCCTTTCCCGATC
MARE20 sense CATTTCTGCTGACTCAGCAACTTTA antisense TAAAGTTGCTGAGTCAGCAGAAATG
Supplementary Table 3. Electrophoresis Mobility Shift Assay (EMSA) probes
Nat
ure
Imm
unol
ogy:
doi
:10.
1038
/ni.1
897

Mathematical Modeling of MAFB-mediated Regulation of
Type I IFN Activation
Mass-action Kinetic Model
To develop insights into how MAFB regulates the IFN-β activation triggered by
IRF3, we developed a mechanistic kinetic model as follows, which is schematically
summarized in Supplementary Fig. 9a: The model includes essential features of the
RNA polymerase II transcription in vivo21, such as recruitment of MAFB and IRF3 to the
IFN-β promoter, formation of Pol II pre-initiation complexes, transcription initiation and
escape of Pol II from the promoter and potential proximal pause sites, productive Pol II
elongation and nuclear export of mature transcripts and their translation. Further, the
model includes mechanisms for interaction of MAFB and IRF3 both on the promoter and
in the nucleoplasm. Appendix A1 provides a complete list of variables and parameters
used in the model.
Nat
ure
Imm
unol
ogy:
doi
:10.
1038
/ni.1
897

(A2)
(A1)
(12) /
(11) /
(10) /
(9) /
(8) /
(7) )1(/
(6) /
(5) /
(4) /
(3) /
(2) )()(/
(1) /
,
deg
degexp
expdeg
33
333deg,33
3
3deg
3
3333
3333
33333
3333333
33333333
3
333
333333
rrih
r
ih
LAL
LCtl
CRNRC
NRNREloelo
N
Eloelo
MIini
ihpe
ihCBPIini
Ipe
IMini
Mpe
MElo
MIini
ihpe
IIiniih
MIini
CBPIini
Ipe
IIiniih
CBPIini
MIih
IIini
IId
Ia
I
MIini
ihpe
MIih
CBPIini
Ipe
IId
Ia
Iin
Mini
Mpe
MMini
Mini
MIih
MMini
MMd
qMa
M
MIini
ihpe
Iiniih
MIih
Mini
Mpe
MMd
qMa
Min
MIini
ihpe
CBPIini
Ipe
IId
Ia
Mini
Mpe
MMd
qMa
MKM
LpLA
LkRkdtdL
RkRkdtdR
RkRkDkdtdR
DkDkfDkfDkfdtdD
DkDkdtdD
DkDkdtdD
DIkDkDkDIkdtdD
DkDIkDkDkDIkIkIdtdI
DkDkdtdD
DIkDkDkDMkdtdD
DkDkrDIkDkDkDMkqMkMdtdM
DkDkDkDIkDkDkDMkdtdD
+=
=
−=
−=
−−=
−++=
−=
−−=
+−−=
+−++−−=
−=
−−−=
+−++++−+−=
+++−++−=
−−
−−
−−
−−
−
−−
ε
ε
ε
ε
The model includes D representing the IFN-β promoter containing DNA
templates, M MAFB proteins in the nucleoplasm, MAFB-bound DNA, MAFB-
mediated preinitiation complex, I3 activated IRF3 proteins in the nucleoplasm, IRF3-
bound DNA, IRF3-mediated and CBP-recruited preinitiation complex,
IRF3-mediated but MAFB-bound preinitiation complex, RN and RC (luciferase or IFN-β)
mRNAs in the nucleus and cytoplasm, respectively, and L luciferase (or IFN-β) proteins.
To describe fully productive RNA polymerase II elongation complexes, we defined a
new variable DElo as DNA-bound Pol II complexes right after escapes from the IFN-β
promoter and any potential proximal pause site and at the beginning of productive
elongation cycle of Pol II. This method then allows us to uncouple events occurring at or
MD MiniD
ID 3
CBPIiniD −3 MI
iniD −3
Nat
ure
Imm
unol
ogy:
doi
:10.
1038
/ni.1
897

near a promoter from productively elongating Pol II complexes, and thereby makes it
theoretically possible to describe multiple productively elongating polymerase complexes
on a single gene, as observed in RNA polymerase I transcription, i.e., Miller spreads22.
In uninfected cells, endogenous MAFB protein (M) is expressed at rate Min, and
decays at rate . MAFB binds to and dissociates from the IFN-β promoter (D) with
rate constants and , respectively. MAFB-bound promoter (DM) then recruits
general transcription factors and co-factors to form a preinitiation complex ( ). We
assumed that cells provide an excess of all the required factors, and thus terms denoting
these cellular factors were not explicitly include in the model. The preinitiation complex
then undergoes transcription initiation and escapes from the promoter and potential
proximal pause sites, at rate . We assumed that only a fraction, , of Pol II
enters into the productive elongation phase DElo (0 ≤ ≤ 1, with = 0 being
completely abortive). In addition, during this process MAFB and cellular factors were
assumed to be released from DNA such that they can participate in a subsequent round of
promoter recognition and transcription initiation. Full-length transcript (RN) is produced
at rate , and then exported to the cytoplasm (RC) at rate , and translated to
yield luciferase (or IFN-β) proteins (L). First-order kinetics was assumed for the export
process.
Mk Mdeg
Mak M
dk
MiniD
Mini
Mpe Dk Mf
MfMf
EloeloDk NR Rkexp
Upon virus infection, latent IRF3 is activated and accumulated in the nucleus (I3)
at rate I3,in. IRF3 then activates the IFN-β promoter following the same procedure as
Nat
ure
Imm
unol
ogy:
doi
:10.
1038
/ni.1
897

described for MAFB. Unlike MAFB, however, IRF3 first recruits the CBP (or p300)
coactivator to form an IRF3-CBP preinitiation complex ( ). CBP was assumed to
be present in excess, and thus was not explicitly include in the model as an independent
variable. We showed in the present work that MAFB negatively regulates the IFN-β
activation primarily by interfering with the IRF3-CBP interaction (Fig. 4f). We
implemented this mechanism by assuming that MAFB in the nucleoplasm blocks the
IRF3-mediated CBP recruitment on the IFN-β promoter with an extent εih (0 ≤ εih ≤ 1,
with εih = 1 being a complete inhibition), presumably in a MAFB concentration-
dependent manner: the formation of a functional preinitiation complex ( ) is
reduced by (1-εih), and instead a MAFB-bound IRF3 preinitiation complex ( ) is
produced at rate . We used Michaelis-Menten expressions to describe the
dependence of εih on MAFB concentration (Eqn. A12), where r denotes the binding order
of MAFB for its interaction with IRF3 on the IFN-β promoter. It has been shown that
IRF3 cooperates with NF-κB, ATF2 and c-JUN, and HMG I(Y) to form an stable
enhanceosome on the IFN-β promoter23. We suspect that this enhanceosome formation
can be credited, at least in part, for the displacement of weakly bound MAFB from the
IFN-β promoter upon virus infection, as observed in Fig. 4b and d. In the model, we
implemented this mechanism by allowing activated IRF3 to bind to a MAFB-bound
promoter ( ) at rate (presumably with ), during which MAFB is
dissociated from the promoter.
CBPIiniD −3
3Iak≤
CBPIiniD −3
MIiniD −3
33 IIiniih Dkε
Iih Ik 3MD MD3
3Iihk
Nat
ure
Imm
unol
ogy:
doi
:10.
1038
/ni.1
897

Pre-Infection Steady State
By assuming that system variables are at a quasi-steady state prior to virus
infection, relations existing among model parameters can be identified, which can be
used to limit the ranges of values parameters can take. For example, before any
perturbation of cells such as MAFB overexpression and virus infection, the endogenous
MAFB production rate (Min,s) and the amounts of free DNA (Ds) and MAFB-DNA
complexes ( and ) in dynamic equilibrium with endogenous MAFB protein (Ms)
can be calculated by the following equations:
MsD M
siniD ,
(16) )()(
(15) )()(
(14) )()(
)(
(13)
deg,
deg
deg
deg
deg,
sMpe
Mini
Ma
Mpe
Mini
Ms
Mini
MaTotM
sini
sMpe
Mini
Ma
Mpe
Mini
Ms
Mpe
MaTotM
s
sMpe
Mini
Ma
Mpe
Mini
M
Mpe
Mini
MTot
s
sM
sin
MkkkkkkMkkDD
MkkkkkkMkkD
D
MkkkkkkkkkD
D
MkM
+++=
+++=
+++
+=
=
where the subscript s is used to denote a quasi-steady state value before cellular
perturbation. Unless otherwise specified, we assumed that the total amount of DNA
templates ( ) remained constant over the period of time considered in this study, i.e.,
DTot = constant = .
TotD
Msini
Mss DDD ,++
Nat
ure
Imm
unol
ogy:
doi
:10.
1038
/ni.1
897

Model Parameters
Direct measurements of the half-life (t1/2) of MAFB protein are not available.
However, based on an estimate for MAFA (t1/2 = 2.95 h)24 and unstable nature of MAFB
compared to MAFA25, we chose t1/2(MAFB) = 1.5 h (or equivalently = 0.0077 min-1).
Because MAFB interaction kinetics with the IFN-β promoter is not known, observations
made on MAFG interactions with MARE-related sequences have been adopted26. While
MAFG exhibited considerably different affinities for different MARE sequences (with
highest affinity to MARE25, = 1.36* 105 M-1s-1), the dissociation rate constants were
very similar independent of the sequences ( = 3.13 – 3.72 * 10-4 s-1). Based on a weaker
binding of MAFB to the PRDIV motif than to MARE, as observed in Supplementary
Fig. 6e, we chose = 0.01 * 1.36* 105 M-1s-1 as a baseline value. The model sensitivity
to this parameter will be discussed later. We adopted the value for MARE25, i.e.,
= 3.13 * 10-4 s-1. We took that the diameter of a 293 cell nucleus to be 5 μm when
performing unit conversion from molar concentration to the number of molecules in the
nucleus. For MAFB preinitiation complex formation ( ), observations made on the
interaction of yeast TFIID with the consensus TATA box sequence have been adopted27:
the half-time of a stable TFIID-TATA box complex formation was 1 min at saturating
concentrations of TFIID. We assumed a half-time of 1 min (or equivalently = 0.6931
min-1). This value may serve as an upper bound for , since the TFIID-TATA complex
formation became slower as TFIID concentration decreased27 and the time required for
recruitment of multiple cellular factors should be considered for a better estimate.
Mkdeg
ak
dk
Mak
dk
Mdk
Minik
Minik
Minik
Nat
ure
Imm
unol
ogy:
doi
:10.
1038
/ni.1
897
The half-life of activated IRF3 was set to 5 h, an estimate in 293 cells28. For
activated IRF3 binding to the IFN-β promoter, we adopted an estimate for IRF3(5D), Kd
= 5.8 nM29. Due to the lack of direct measurements of ka and kd, we chose = = 3.13
* 10-4 s-1 such that the binding affinities of MAFB and IRF3 can be compared directly in
terms of their association constants. The corresponding was calculated as
= / ≈ 5.40 * 104 M-1s-1 (implying ≈ 40 (baseline)). For preinitiation
complex formation, we assumed the same rate constant for both IRF3 and MAFB
( = ).
3Idk M
dk
3Iak
3Iak
3Iinik
3Idk
Minik
3IdK 3I
ak Mak
The rate constant for synthesis of a full-length transcript from ( ) was
approximated by dividing a typical eukaryotic RNA polymerase elongation rate, 20-40
bases/s (30 bases/s was applied here), by the length of a gene (1653 bp for luciferase)30-32.
For the nuclear export rate constant ( ), we adopted an in vivo estimate for the rabbit
β-globin gene, with a half-life of 2.5 - 4.4 min33. In our analysis we chose t1/2 = 10 min
(or equivalently = 0.0693 min-1) in order to compensate for a time delay associated
with translation initiation and the time required to reach steady state translation that were
not explicitly include in the model. The steady state translation rate ( )34 was obtained
by dividing a typical eukaryotic ribosome elongation rate, 100 ~ 200 AA/min (2 AA/sec
was applied here)35, by the space between eukaryotic ribosomes, ~ 1 ribosome / 80 bases
(or 1 protein product / 80 bases)36, in poly-ribosomal states. The half-lives of firefly
luciferase mRNA and protein were adopted from estimates in HepG2 cells (6 h for
mRNA and 3 h for protein)37.
EloD elok
Rkexp
Rkexp
tlk
Nat
ure
Imm
unol
ogy:
doi
:10.
1038
/ni.1
897

Estimation of Model Parameters
Other model parameters of the proposed model were chosen to match
observations in the present study, as will be explained below. We first considered data in
Supplementary Fig. 9b, which show how the IFN-β promoter activity depends on
MAFB concentration either in the absence or presence of poly(I:C) induction, and were
measured at 44 h post-transfection. 10 ng of the IFN-β luciferase reporter used in the
experiment corresponds to 1.7726*109 plasmids. To make progress with our analysis, we
assumed that only 1% of the total DNA added to cell media becomes available for
transcription initiation, yielding 1.7726*107 plasmids/4 x 104 cells ≈ 443.15
plasmids/cell. Direct measurements of MAFB expression rate per its expression vector are
not available. However, we found that the dependence of the IFN-β promoter activity on
MAFB concentration was close to linear before poly(I:C) stimulation (Supplementary
Fig. 9b). Therefore, we assumed that MAFB expression rate (Min) increases linearly from
its endogenous value (Min,s) as the amount of MAFB expression vector increases, whose
slope (s) needs to be specified.
For dynamic simulations of the model, we chose Ms = 1000 molecules/cell as a
baseline value, which, together with the corresponding values for , and (Eqn.
14-16), were used as the initial conditions. Min,s was calculated using Eqn. 13, and MAFB
binding to the IFN-β promoter was assumed to be first order with respect to MAFB (q =
1). I3,in was assumed to be zero prior to poly(I:C) stimulation, and we estimated unknown
parameters , and s by nonlinear least-square fitting of the proposed model to the
luciferase activity data without poly(I:C) stimulation (Supplementary Fig. 9b). To
sD MsD M
siniD ,
Mf Mpek
Nat
ure
Imm
unol
ogy:
doi
:10.
1038
/ni.1
897

convert the model prediction, the amount of luciferase protein (L) per cell, to the
measured quantity, luciferase activity (LA) per well, we simultaneously estimated a
proportional constant between these two quantities. The data (open circles) and the
best-fit curve generated from the model are shown in Supplementary Fig. 9c; the
corresponding parameter estimates are = 4.4877*10-4, = 0.0346 min-1 (t1/2 ≈
20.03 min), s = 0.6619*Min,s per 10 ng of MAFB expression vector, and = 12.7572,
with a goodness-of-fit (R2) = 0.9978.
LALp ,
Mf Mpek
LALp ,
To fit the model to the luciferase activity data with poly(I:C) stimulation
(Supplementary Fig. 9b), we made the following approximations: first, IRF3 activation
upon poly(I:C) stimulation and its transient nature were modeled by using a pulse input
signal for I3,in, of which duration and magnitude need to be specified. In addition, we
assumed that a non-zero value of I3,in began at one hour post-stimulation to consider the
time required for phosphorylation and nuclear localization of latent IRF3. We chose one
hour of pulse duration such that model predictions of the level of cytoplasmic mRNA
(RC) peak around 11-12 h post-stimulation, as observed in Fig. 1d. The pulse magnitude
remains to be specified. Second, we assumed = such that the efficiencies of
MAFB- and IRF3-initiated transcriptions can be compared directly in terms of and
. Under this assumption, is expected to be greater than since the IRF3
enhanceosome-dependent recruitment of CBP has been known to mediate the recruitment
of SWI and SNF and basal transcription factors, which in turn facilitate nucleosome
repositioning and transcription initiation38. Third, for the extent of MAFB-mediated
3Ipek M
pek
Mf
3If 3If Mf
Nat
ure
Imm
unol
ogy:
doi
:10.
1038
/ni.1
897

inhibition of CBP recruitment by IRF3 on the IFN-β promoter (εih = Mr/( +Mr)), two
parameters Kih and r should be specified. We assumed Kih = Ms, which indicates that 50%
of the IRF3-mediated CBP recruitment is blocked with the endogenous level of MAFB
before poly(I:C) stimulation, i.e., εih = 0.5 when M = Ms. For the order of MAFB
interacting with IRF3 on the IFN-β promoter (r), it has been suggested that MAFB can
form a homodimer or heterodimers with other bZIP proteins13,39, implying that 1 ≤ r ≤ 2.
Unless otherwise specified, we assumed second-order kinetics with respect to MAFB (r =
2). Fourth, the MAFB-bound IRF3 preinitiation complex ( ) was assumed to behave
similar to the MAFB-initiated preinitiation complex, i.e., = and = . Fifth,
we assumed that activated IRF3 binds to a MAFB-bound promoter ( ) with the same
rate constant as to a MAFB-Free promoter (D), i.e., . Sixth, we assumed that the
endogenous MAFB production rate (Min,s) remains constant irrespective of poly(I:C)
stimulation. Validity of these assumptions and the model sensitivity to variations in these
and other parameter values will be discussed later. Under these assumptions, we
estimated parameters and I3,in by nonlinear least-square fitting of the model to the
post-stimulation data, as shown in Supplementary Fig. 9d; the corresponding parameter
estimates are = 0.0054 and I3,in = 48.8785 molecule/min with R2 = 0.9425.
rihK
ihpek
MIiniD −3
ihf
3Iak
Mf Mpek
MD
3Iihk =
3If
3If
Numerical integration of the system of ordinary differential equations and
nonlinear least-square fitting of the model to the data were performed using MATLAB.
Appendix A2 provides a complete list of parameters used in the simulation.
Nat
ure
Imm
unol
ogy:
doi
:10.
1038
/ni.1
897

Parameter Sensitivity Analysis
We investigated how different assumptions or variations in some parameter
values can impact estimation of other parameters and resulting model predictions. First,
to assess the sensitivity of our model to variations in εih-related parameters r and Kih, we
varied r over the ranges of 1-2, and estimated Kih, together with and I3,in, by
nonlinear least-square fitting of the model to the post-stimulation data. The best-fit
parameter estimates are as follows: for r = 1, Kih = 0.053*Ms (and = 0.2492, I3,in =
4.3808 molecule/min with R2 = 0.9251). For r = 1.5, Kih = 0.13*Ms ( = 0.0517, I3,in =
51.3804 molecule/min with R2 = 0.9693). For r = 2, Kih = 0.22*Ms ( = 0.0366, I3,in =
133.9383 molecule/min with R2 = 0.9869). These results indicate that for the
physiological range of r values, an optimal Kih is typically located in a range less than Ms
(Kih < Ms), implying that even the endogenous level of MAFB (Ms) is exerting a
considerable inhibitory effect on the IRF3-mediated CBP recruitment: εih > 0.94 for r =
1-2 and MAFB overexpression ≥ 0 ng. However, we reasoned that it is not physiological
that a nearly complete inhibition of the IRF3 activity can be achieved even with
endogenous MAFB. Therefore, to make progress with our analysis, we assumed Kih = Ms
such that endogenous MAFB can achieve only 50% inhibition of the IRF3 activity (εih =
0.5 when M = Ms). Supplementary Fig. 9e shows the dependence of the extent of
MAFB-mediated inhibition of IRF3-CBP preinitiation complex formation on the IFN-β
promoter (εih) on MAFB concentration for different values of r. Under this assumption,
the best-fit curve was obtained with r = 2.7632 (and = 0.0047 and I3,in = 80.4945
molecule/min, with R2 = 0.9682), and for r ≤ 2.7632, a higher r value yielded a better
3If
3I
3I
3I
f
f
f
3If
Nat
ure
Imm
unol
ogy:
doi
:10.
1038
/ni.1
897
model-fit (R2) (Supplementary Fig. 9f): for r = 1, R2 = 0.8115 (with = 0.0430 and
I3,in = 2.1158 molecule/min). For r = 1.5, R2 = 0.9002 (with = 0.0123 and I3,in =
10.4458 molecule/min). For r = 2, R2 = 0.9425 (with = 0.0054 and I3,in = 48.8785
molecule/min). For this reason, combined with the potential of MAFB to form a homo- or
hetero-dimer13,39, we chose r = 2 and the corresponding estimates of and I3,in as
baseline values of our analyses unless otherwise specified.
3If
If
Mpek
3If
3If
3
We next examined how the proposed model is affected by variations in the MAFB
binding constant to the IFN-β promoter ( ). For example, when we assumed = 0.05
* 1.36* 105 M-1s-1 (implying ≈ 7.94 ), the best model fit to the pre-stimulation data
was obtained with = 2.6950*10-4, = 0.2159 min-1 (t1/2 ≈ 3.21 min), s =
0.6619*Min,s per 10 ng of MAFB vector and = 4.2468, with R2 = 0.9978. This result
suggests that the primary effect of increasing an initial assumption of the MAFB binding
constant was a decrease in the time required to produce a fully productive Pol II
elongation complex (DElo) from (or equivalently an increase in ) such that the
dependence of the IFN-β promoter activity on MAFB concentration in the absence of
poly(I:C) stimulation remains qualitatively the same, although a lower value for the
proportional constant was required because of an overall increased yield of
luciferase protein (L). The corresponding best estimates of IRF3-related parameters were
= 0.0036 and I3,in = 185.1531 molecule/min with R2 = 0.9411. In spite of these
quantitative changes, one of the key properties of the system, the relative efficiency
Mak
Ma
Mpek
Mak
3Iak k
Mf
Lp
LA,Lp
Minik
LA,
3If
Nat
ure
Imm
unol
ogy:
doi
:10.
1038
/ni.1
897

between IRF3- and MAFB-mediated transcriptions ( / ), remained very similar:
/ ≈ 13.4 for = 0.05 * 1.36* 105 M-1s-1, as compared to / ≈ 12.0 for
= 0.01 * 1.36* 105 M-1s-1.
3If
f
Mf
k
3I
3If
Mak
Mf Mak 3If
3If
Mf
Mf
Mf
We also investigated how the proposed model is affected by a different
assumption in the DNA transfection efficiency. For example, when we assumed 10%
transfection efficiency (or equivalently 4431.5 plasmids/cell per 10 ng of the IFN-β
reporter), the best estimates for MAFB-related parameters (for = 0.01 * 1.36* 105 M-
1s-1) were = 5.6936*10-5, = 0.0346 min-1 (t1/2 ≈ 20.03 min), s = 0.6619*Min,s per
10 ng of MAFB vector and = 10.0583, with R2 = 0.9978. For IRF3 parameters,
= 7.4585*10-4 and I3,in = 53.8183 molecule/min with R2 = 0.9156 were obtained.
Although individual transcription efficiencies ( and ) per DNA template were
reduced to preserve the overall dependence of the IFN-β promoter activity on MAFB
concentration in this increased DNA environment, their ratio ( / ) remained
essentially the same independent of transfection efficiency: / ≈ 13.1 for 10%
transfection, as compared to / ≈ 12.0 for 1% transfection.
Ma
3If
Mf Mpek
LAL,
3If
p 3If
Mf
Mf
Taken together, essential system features remained invariant under different
assumptions in unknown parameter values, indicating the robustness of the proposed
model and analysis methods. We also examined how different assumptions in affect
the model. We found that the primary consequence of assuming that a MAFB-bound
ihf
Nat
ure
Imm
unol
ogy:
doi
:10.
1038
/ni.1
897

IRF3 preinitiation complex has a similar transcription efficiency to a MAFB preinitiation
complex ( = ) was to prevent the IFN-β promoter activity from being
hypersensitive to MAFB concentration, resulting in an improved model fit to the data, as
compared to the assumption of completely abortive transcription ( = 0). For this
reason, we assumed = unless otherwise specified.
ihf Mf
f
ihf
ih Mf
Identification of Key System Parameters
We observed that after a certain threshold of MAFB concentration (50-100 ng),
the MAFB-mediated inhibition of the IFN-β activation became less efficient as MAFB
concentration increased (Supplementary Fig. 9b and d). Although this apparent increase
in the IFN-β promoter activity with increasing MAFB did not reach a statistically
significant level, for example, p ≈ 0.12 (one-way ANOVA) for MAFB ≥ 100 ng, we
consistently observed this phenotype. We reasoned that it might be caused by the binding
of MAFB to the IFN-β promoter with a kinetic order greater than one with respect to
MAFB (q > 1). To examine this, we re-estimated the MAFB binding order to DNA (q)
while other parameters were kept at their baseline values (Kih = Ms, r = 2, = 0.0054
and I3,in = 48.8785 molecule/min), yielding a slightly improved model-fit, R2 = 0.9512 for
q = 1.1227, as compared to R2 = 0.9425 when q = 1 (Supplementary Fig. 9g). However,
it is more likely that a higher order binding of MAFB to DNA occurs only after a certain
threshold level of MAFB is reached, presumably in a MAFB concentration-dependent
manner. Here we implemented this mechanism by assuming that the MAFB binding order
(q) gradually increases from q = 1 at MAFB = 100 ng to
3If
)100−100
)((0=
ngMAFBqq as MAFB
Nat
ure
Imm
unol
ogy:
doi
:10.
1038
/ni.1
897

concentration increases. The formula for q was chosen such that the q value at MAFB =
150 ng has the geometric mean of those at MAFB = 100 ng and 200 ng. The q0 value was
then re-estimated while other parameters fixed, yielding q0 = 1.3238 with a slight
improvement in the model-fit (R2 = 0.9560). It also captured qualitative features of the
data better than the fixed q values. Similar results were obtained with different
assumptions of the MAFB binding constant ( ) and transfection efficiency. For
example, when = 0.05 * 1.36* 105 M-1s-1, the best estimates of q were q = 1.1216
with R2 = 0.9529, and q0 = 1.3293 for
Mak
Mak
)100
)( −ng 100(0=
MAFBqq with R2 = 0.9580, as compared
to R2 = 0.9411 for q = 1. When we assumed 10% transfection efficiency (with = 0.01
* 1.36* 105 M-1s-1), q = 1.1412 with R2 = 0.9369, and q0 = 1.3448 for
Mak
)100
100)(MAFB(0
−
=ng
with R2 = 0.9356, as compared to R2 = 0.9156 for q = 1. These results support the view
that the threshold-dependent higher order binding of MAFB to the IFN-β promoter is
responsible, at least in part, for the observed increase in the post-stimulation activity of
the IFN-β promoter with increasing MAFB.
Next, we loosened the assumption of = to explore the possibility that the
IRF3-mediated recruitment of CBP and the resulting chromatin remodeling may improve
the processivity of Pol II to enter productive elongation ( > ) as well as its
efficiency ( > 12* ). We found that re-estimation of and q, while other
parameters were fixed ( = 0.0054 and I3,in = 48.8785 molecule/min), improved the
model fit only slightly: R2 = 0.9545 when q = 1.1510 and ≈ 1.17* , as compared to
3Ipek M
pek
3Ipek
k
Mpek
Mpek
3If Mf
3If
3Ipe
3Ipek
Nat
ure
Imm
unol
ogy:
doi
:10.
1038
/ni.1
897

R2 = 0.9425 for q = 1 and R2 = 0.9512 for q = 1.1227 when = . However, when
was allowed to change together with and q for fixed I3,in (= 48.8785
molecule/min), the model fit was substantially improved, yielding R2 = 0.9811 when q =
1.1491, ≈ 12.9* and = 0.0038, and it was further improved by assuming
3Ipek M
pek
3If 3Ipek
3Ipek M
pek 3If
)100(ngMAFB 100)(
0
−
q=q , yielding R2 = 0.9825 when q0 = 1.3393 (for )100
100)((0
MAFBq
−
=ng
q ), ≈
16.0* and = 0.0037 (Supplementary Fig. 9h). Under these conditions, the ratio
of overall productivity of IRF3- and MAFB-mediated transcriptions (PR =
) are PR ≈ 109.1 with / ≈ 8.5 for q = 1.1491, and PR ≈ 131.5 with
/ ≈ 8.2 for
3Ipek
Mpek
Ipe /3
Mf
3If
Mpe
M kfI kf 3
3If
3If Mf
)100
100)( −ng( MAFBq 0= q with q0 = 1.3393. These results suggest that rapid
cellular induction of IFN-β upon virus infection can be credited, at least in part, to a
highly productive IRF3-mediated transcription that results from both the enhanced
processivity and higher efficiency of an IRF3-mediated preinitiation complex on the IFN-
β promoter compared to its background levels.
We next investigated the effect of cellular regulation of MAFB expression in
response to virus infection on the IFN-β activation. To examine this, we assumed that Min
can take a new value beginning at one hour post-stimulation and is kept at this value until
the measurement time. We found that the contribution of MAFB down-regulation (a
reduced Min), as observed in Fig. 5, to the IRF3-mediated IFN-β activation was more
significant for a lower MAFB concentration. For example, when MAFB expression was
assumed to be down-regulated by 25% upon poly(I:C) stimulation (Min = 0.75*Min,s),
Nat
ure
Imm
unol
ogy:
doi
:10.
1038
/ni.1
897

with other parameters fixed at the baseline values (q = 1, = 0.0054 and I3,in = 48.8785
molecule/min), we could obtain about 20.5% increase in the IFN-β activation for the
endogenous level of MAFB, and this stimulating effect gradually diminished as the
MAFB concentration increased (Supplementary Fig. 9i). This phenotype is a reflection
of the dependence of εih on MAFB concentration, supporting our findings that MAFB-
IRF3 interaction and the resulting inhibition of IRF3-mediated CBP recruitment is one of
the principle mechanisms by which MAFB antagonizes the interferon response.
3If
In summary, the potency of MAFB as an inhibitor of the IFN-β induction is
determined by the relative contributions of the effects of a high order MAFB-IRF3
interaction on the promoter and a low order MAFB-promoter interaction. These factors
affect the IFN-β promoter activity in opposing directions, leading to an atypical dose
response curve of MAFB that suggests the existence of a range of MAFB concentration
that minimizes virus-induced IFN-β activation (Supplementary Fig. 9b and d). At a low
level of MAFB, such as the endogenous level in 293 cells, MAFB binds weakly to the
IFN-β promoter, probably following near first-order kinetics with respect to MAFB (q ≈
1), and therefore its contribution to the IFN-β promoter activity as an activator may be
minimal. However, MAFB may still interact with IRF3 as a homodimer (r = 2) on the
promoter, exerting a substantial inhibitory effect on IRF3-mediated recruitment of CBP
upon virus infection. MAFB downregulation, depending on cell type, may serve as a
mechanism to relieve this inhibitory effect of MAFB. For an intermediate level of MAFB,
increasing MAFB generally leads to a more potent inhibition of the IFN-β activation by
enhancing interaction of MAFB with IRF3 on the promoter and thereby increasing the
Nat
ure
Imm
unol
ogy:
doi
:10.
1038
/ni.1
897

extent of inhibition of the IRF3-CBP preinitiation complex formation (εih). However, this
improvement in MAFB-mediated inhibition diminishs as MAFB concentration increases.
In addition, the IFN-β stimulating effect of virus-induced MAFB downregulation
gradually diminishes with increasing MAFB. Once a certain threshold level of MAFB is
reached, the binding of MAFB to the IFN-β promoter may begin to follow a higher order
kinetics (q > 1), presumably caused by replacement of a heterodimer of MAFB and a
bZIP protein lacking transactivation potential, such as a small MAF protein, with a
MAFB homodimer or simply by potential nonlinearity in MAFB-DNA interaction itself.
As a result, the formation of a MAFB-DNA complex becomes accelerated with increasing
MAFB. By contrast, MAFB-mediated inhibition of IRF3-CBP interaction becomes nearly
saturated (εih ≈ 1), and thus no significant improvement in this inhibition can be achieved
with increasing MAFB concentration. Therefore, once the effect of the enhanced MAFB-
DNA complex formation dominates, the apparent activity of an extra amount of MAFB
becomes weak but IFN-β stimulatory, rather than IFN-β inhibitory, caused by its weak
transactivation potential. We also reasoned that this apparent IFN-β stimulating activity
of MAFB might be achieved by a reduced half-life of activated IRF3. However, under the
current approximation that transient IRF3 activation was modeled by using a pulse input
for I3,in with a duration of one hour, no detectable improvement in model fit was observed
for increased decay rates of activated IRF3 (data not shown).
Effects of IRF3-MAFB Hetero-Complex Formation in the Nucleoplasm
We extended the model to study how interaction between IRF3 and MAFB in the
nucleoplasm may affect the IFN-β activation. We defined a new variable H as a protein
Nat
ure
Imm
unol
ogy:
doi
:10.
1038
/ni.1
897

complex of activated IRF3 and MAFB in the nucleoplasm, which is distinct from ,
IRF3-mediated but MAFB-bound preinitiation complex on the IFN-β promoter. In
addition, the proposed model was modified as follows:
MIiniD −3
)(6' (6) of /
)(5' )((5) of /
)(3' (3) of /
)(2' )()( (2) of /
)(1' (1) of /
(17) )(/
333
3
33
3
333
deg33
3
degdeg3
MIih
Ia
I
MHd
rHa
MIih
M
MIih
Ia
Hd
rHa
Ia
MIih
Ia
MIHd
rHa
HDkHDkRHSdtdD
HkHkMIkRHSdtdI
HDkRHSdtdD
HDkrqHDrkHkMIkrRHSdtdM
HDkRHSdtdD
HDkHDkHkkHkMIkdtdH
++=
+−−=
−=
+++−−=
−=
−−+−−=
An activated IRF3 (an IRF3 homodimer) binds to and dissociates from r*MAFB
(r = 2 in the simulation) in the nucleoplasm with rate constants and , respectively.
For , we adopted an estimate for the formation of a heterodimeric leucine zipper at
intermediate ionic strength, = 0.2 s-140. We assumed that IRF3 and MAFB in H decay
with the same rate constants as those of the corresponding unbound forms, and ,
respectively, and that IRF3 is recovered from H once MAFB is decayed because of >
3* . As a first approximation we assumed that H can bind to both free (D) and MAFB-
bound ( ) promoters with the same rate constants as those of free IRF3, and ,
respectively, during which MAFB is released from both H and . Later, we will
examine the case in which H has reduced binding affinities to the promoters.
Hak H
dk
Hdk
3degI
dk
3degIk
3Iak
Mkdeg
Mkdeg
3 Iihk
k
MD
MD
Nat
ure
Imm
unol
ogy:
doi
:10.
1038
/ni.1
897

Under these conditions, we examined how the poly(I:C)-induced IFN-β activation
could be affected by the extent of IRF3-MAFB hetero-complex formation, as specified by
, with other parameters fixed at the baseline values (q = 1, r = 3If = 0.0054 and
I3,in = 48.8785 molecule/min). Supplementary Fig. 9j shows the time profiles of model-
predicted IFN-β luciferase activities for the case without MAFB overexpression. The
hetero-complex formation enhances the IFN-β activation, which is caused by a decrease
in the level of free MAFB available for the inhibition of IRF3-mediated CBP recruitment
on the IFN-β promoter and the resulting reduction in εih (= Mr/( +Mr))
(Supplementary Fig. 9k). The observed decrease in εih is also contributed by a transient
consumption of free MAFB for the inhibition of the IRF3-CBP preinitiation complex
formation, as evidenced by the profile for no hetero-complex formation ( = 0). To
quantify how much the hetero-complex formation contributes to the total decrease in εih,
we considered the difference between the transient minimum values of εih obtained with a
certain value and = 0. We also defined a percent reduction in the capacity of
MAFB to inhibit the IRF3-CBP preinitiation complex formation (RE) as RE =
100*(εih,min( =0) − εih,min( )) / εih,min( =0), where RE = 0 denotes that the hetero-
complex formation has no effect on the inhibitory capacity of MAFB, whereas RE = 100
% denotes that there is complete loss of the MAFB inhibitory capacity (εih,min( ) = 0).
Supplementary Fig. 9l and m shows how RE and the corresponding IFN-β luciferase
activity are affected by the extent of the hetero-complex formation ( ) for a range of
the production rate of activated IRF3 (or equivalently IRF3 activation rate), I3,in, where
the percentage of the baseline value of I3,in (= 48.8785 molecule/min) is shown on y-axis.
Hak 2,
Hak
rihK
Hak
Hak
Hak H
ak
Hak H
ak Hak
Nat
ure
Imm
unol
ogy:
doi
:10.
1038
/ni.1
897

For a fixed IRF3 activation rate, as increases RE monotonously increases (or
equivalently the inhibitory capacity of MAFB decreases) (Supplementary Fig. 9l),
enhancing the IFN-β production (Supplementary Fig. 9m). This IFN-β stimulating
effect of the hetero-complex formation remains negligible at a low IRF3 activation rate
since MAFB outpopulates IRF3 and thus the inhibitory capacity of MAFB is robustly
maintained. However, as the IRF3 activation increases the IFN-β stimulating effect
becomes more significant, since an increasing amount of free MAFB is sequestered by
IRF3, increasingly compromising the inhibitory capacity of MAFB.
Hak
We next explored the possibility that the hetero-complex (H) has a lower binding
affinity to both free and MAFB-bound promoters than free IRF3, which can be caused by
interference of MAFB in H with recruitment and binding of IRF3 in H to the IFN-β
promoter. Supplementary Fig. 9n shows the dependence of IFN-β luciferase activity on
and the IRF3 activation rate obtained in the limit of zero binding of H to the
promoters. For a clearer qualitative representation of the effect of the hetero-complex
formation, we considered, for each IRF3 activation rate, the deviation of IFN-β luciferase
activity achieved by a given value from the activity obtained with = 0, and then
plotted its percent change, 100*(LA( ) − LA( =0)) / LA( =0). Here a positive (or
negative) number denotes that IFN-β luciferase activity for a give Hak value is higher
(or lower) than the activity fo Ha = 0. Irrespective of the extent of the hetero-complex
binding to the promoters the qualitative dependency of RE on and the IRF3 activation
rate remains essentially the same (data not shown). In the lower range of IRF3 activation,
Hak
Hak
r k
Hak
Hak H
ak Hak
Hak
n
Nat
ure
Imm
unol
ogy:
doi
:10.
1038
/ni.1
897
the IFN-β production decreases as increases since the hetero-complex formation
sequesters a part of activated IRF3, leading to a reduced IRF3 binding to the promoters
(IFN-β inhibiting), while the capacity of MAFB to inhibit the IRF3-CBP preinitiation
complex formation remains minimally compromised. As IRF3 activation increases, the
influence of a reduced inhibitory capacity of MAFB against the preinitiation complex
formation (IFN-β stimulating) becomes more significant. Once the IFN-β stimulatory
effect (MAFB sequestration by IRF3) dominates over the IFN-β inhibitory effect (IRF3
sequestration by MAFB), the IFN-β production increases as increases. It is notable
that the IFN-β production (and also RE) is slightly more sensitive to variations in the
parameters as the hetero-complex binding to the IFN-β promoter decreases since the
amount of free MAFB recovered upon binding of H to the promoters decreases. Taken
together, these results suggest that the hetero-complex formation may enable cells to
buffer against unwarranted low-level activation of IRF3. At the same time, combined
with MAFB downregulation, this complex formation may serve as a mechanism to boost
the IFN-β activation upon virus infection.
Hak
Hak
The influence of the IRF3-MAFB hetero-complex formation on the IFN-β
activation further depends on the level of MAFB expression. As MAFB concentration
increases, the extent of inhibition of the IRF3-CBP preinitiation complex formation (εih)
increases, and the effect of MAFB sequestration by IRF3, or MAFB downregulation, on
εih (RE) becomes less important. For example, when MAFB = 75 ng, in the case that the
hetero-complex is assumed to bind the IFN-β promoter without any interference by
Nat
ure
Imm
unol
ogy:
doi
:10.
1038
/ni.1
897

MAFB, both the IFN-β production and RE remain lower throughout the ranges of and
the IRF3 activation rate, and depend less sensitively on these parameters (data not
shown), as compared to Supplementary Fig. 9l and m. However, as shown in
Supplementary Fig. 9o for the case of zero binding of H to the promoter, as the hetero-
complex binding to the promoter decreases, the effect of IRF3 sequestration by MAFB
and resulting inhibition of IRF3 binding to the promoter becomes more significant over a
wider range of IRF3 activation, as compared to Supplementary Fig. 9n, while RE (or
εih) is robustly maintained at a low (or high) value throughout the parameter ranges (data
not shown). These results suggest that for a high MAFB expression, regulation of
recruitment and binding of IRF3 (or possibly IRF7) to the promoter may play a dominant
role in controlling the IFN-β activation.
Hak
In summary, the hetero-complex formation between IRF3 and MAFB in the
nucleoplasm may provide an additional layer of MAFB-mediated regulation of the IFN-β
induction. Combined with the inhibition of the IRF3-CBP preinitiation complex
formation by MAFB and a potential inhibitory role of MAFB in the recruitment and
binding of IRF3 (or IRF7) to the IFN-β promoter, the hetero-complex formation may
provide cells an elaborate mechanism to effectively buffer unwarranted low-level
activation of IFN-β, and at the same time to counteract this buffering role of MAFB to
facilitate the IFN-β activation upon virus infection. Further, our model prediction that the
hetero-complex formation plays differential roles depending on the level of MAFB
expression may provide a vital clue to understanding cell-type dependent expression of
MAFB and its mode of actions. For example, 293 cells are characterized by a low level of
Nat
ure
Imm
unol
ogy:
doi
:10.
1038
/ni.1
897

endogenous MAFB without constitutive IRF7 expression. Both experimental and
computational results in the present work support the view that in these cells regulation of
the IRF3-CBP preinitiation complex formation by MAFB may constitute a primary
mechanism for buffering adventitious activation of type I IFN response while facilitating
its activation upon virus infection. In contrast, in cell types with elevated expression of
MAFB, such as macrophages and plasmacytoid dendritic cells, MAFB-mediated
regulation of recruitment and binding of IRF3 and 7 to the IFN-α and β promoters may
play a fundamental role in controlling type I IFN induction. Our results suggesting that
MAFB may interfere with IRF7 DNA binding (Supplementary Fig. 5b), combined with
high constitutive expression of IRF7 in these cells and weak dependence of IRF7 on CBP
for transactivation, raises the possibility that regulation of IRF7-dependent transcriptional
activation by MAFB may provide these cells a mechanism to control unwarranted
induction of type I IFN. In addition, differential regulations of IRF3 and IRF7 activities
by MAFB may also provide cells with elevated MAFB expression an opportunity to
activate the antiviral response upon virus infection even when the IRF3-mediated
activation is severely compromised by elevated MAFB.
Nat
ure
Imm
unol
ogy:
doi
:10.
1038
/ni.1
897

Appendixes
A1. Nomenclature
M, I3 : MAFB and activated IRF3 proteins in the nucleoplasm, respectively
H : Protein complex of activated IRF3 and MAFB in the nucleoplasm
D : (unbound) IFN-β promoter containing DNA templates
MD , : MAFB- and IRF3-bound DNA templates (at the promoter), respectively 3ID
MiniD : MAFB-mediated preinitiation complex
CBPIiniD −3 : IRF3-mediated and CBP-recruited preinitiation complex
MIiniD −3 : IRF3-mediated but MAFB-bound preinitiation complex
DElo : Fully productive RNA polymerase II elongation complexes right after escapes
from a promoter and any potential proximal pause site
RN, RC : (luciferase or IFN-β) mRNAs in the nucleus and cytoplasm, respectively
L : Luciferase (or IFN-β) proteins
LA : Luciferase activity
Min, I3,in : Production rates of MAFB and activated IRF3 proteins, respectively
Mak , : Association and dissociation constants for the binding of MAFB and DNA
templates, respectively
Mdk
3Iak , : Association and dissociation constants for the binding of IRF3 and DNA
templates, respectively
3Idk
Hak , : Association and dissociation constants for interaction of MAFB and IRF3,
respectively
Hdk
Mkdeg , : Protein degradation rate constants of MAFB and IRF3, respectively 3degIk
Nat
ure
Imm
unol
ogy:
doi
:10.
1038
/ni.1
897
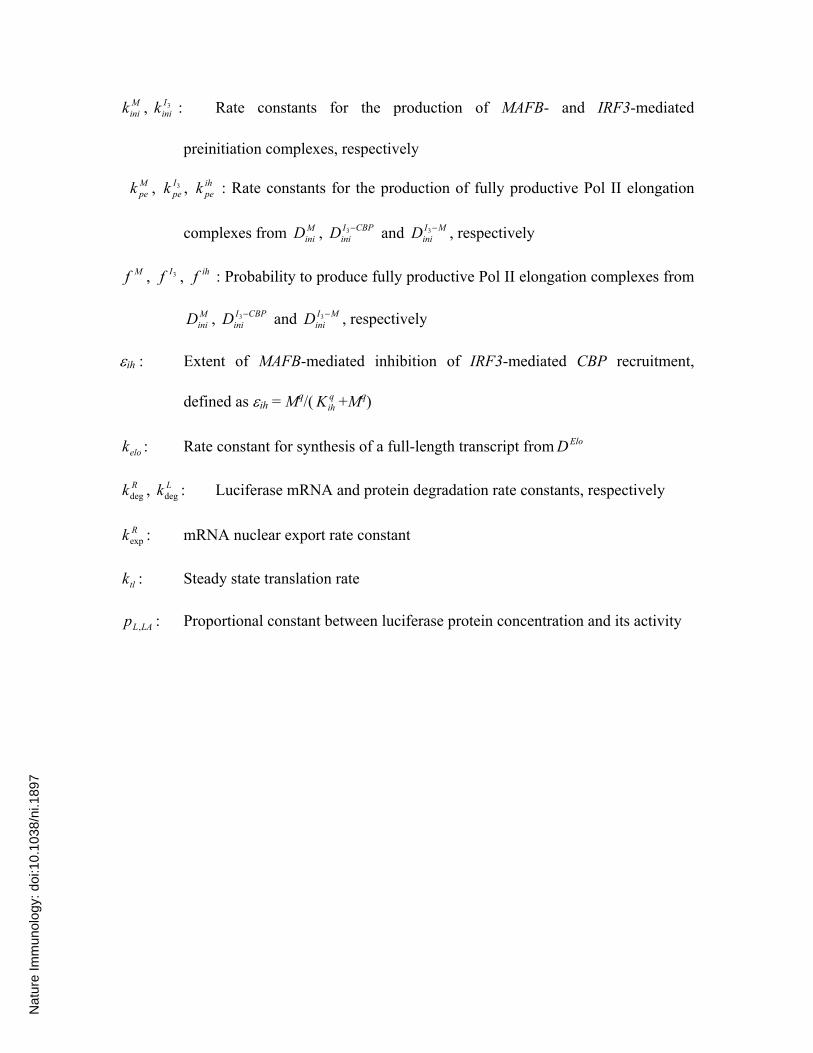
Minik , : Rate constants for the production of MAFB- and IRF3-mediated
preinitiation complexes, respectively
3Iinik
, , : Rate constants for the production of fully productive Pol II elongation
complexes from , and , respectively
Mpek 3I
pek ihpek
MiniD CBPI
iniD −3 MIiniD −3
Mf , , : Probability to produce fully productive Pol II elongation complexes from
, and , respectively
3If ihf
MiniD CBPI
iniD −3 MIiniD −3
εih : Extent of MAFB-mediated inhibition of IRF3-mediated CBP recruitment,
defined as εih = Mq/( +Mq) qihK
elok : Rate constant for synthesis of a full-length transcript from EloD
Rkdeg , : Luciferase mRNA and protein degradation rate constants, respectively Lkdeg
Rkexp : mRNA nuclear export rate constant
tlk : Steady state translation rate
LALp , : Proportional constant between luciferase protein concentration and its activity
Nat
ure
Imm
unol
ogy:
doi
:10.
1038
/ni.1
897

A2. Kinetic Constants and Parameters
1) Number of cells (293ETN): 4*104 cells / well (96 well plate)
2) Diameter of nucleus: 5 μm
3) IFN-β-Luc: 1.7726*109 plasmids/10 ng
4) Overall transfection efficiency: 1% (assumed that only 1% of the total DNA added
to cell media became available for transcription initiation)
5) MAFB Degradation Rate ( Mkdeg ):
Mkdeg = ln(2) / 1.5 hr ≈ 0.0077 min-1 in the simulation
6) Association and Dissociation Constants of MAFB with its DNA response element
a. Association: Mak = 0.01 * 1.36* 105 M-1s-1 in the simulation
b. Dissociation: Mdk = 3.13 * 10-4 s-1 in the simulation
7) IRF3 Degradation Rate ( 3degIk ):
= ln(2) / 5 hr ≈ 0.0023 min-1 in the simulation 3degIk
8) Equilibrium Constant of activated IRF3 with P31: 3IdK = 5.8 nM
a. Assume 3Idk = M
dk in the simulation
b. 3Iak = 3I
dk / 3IdK ≈ 5.40 * 104 M-1s-1 in the simulation
9) Pre-initiation complex formation rate:
Minik = = ln(2) /1 min = 0.6931 min-1 in the simulation 3I
inik
10) Synthesis rate of a full-length transcript from EloD
elok ≈ 30 nts / sec * Luciferase / 1653 nts ≈ 1.09 transcripts / min in the simulation
Nat
ure
Imm
unol
ogy:
doi
:10.
1038
/ni.1
897

11) Luciferase Degradation Rates ( Rkdeg , Lkdeg )
a. Protein: Lkdeg = ln(2) / 3 hr ≈ 0.0039 min-1 in the simulation
b. mRNA: Rkdeg = ln(2) / 6 hr ≈ 0.0019 min-1 in the simulation
12) mRNA Export Rate Constant ( Rkexp ):
Rkexp = ln(2) / 10 min ≈ 0.0693 min-1 in the simulation
13) (Eukaryotic) Steady State Translation Rate ( tlk )
tlk = (1 protein / 80 nt) * (3 nt / 1 AA) * (2 AA / sec) * (60 sec / min) ≈ 4.5 proteins
/ min
Nat
ure
Imm
unol
ogy:
doi
:10.
1038
/ni.1
897

References 1 Pruett, S. B., Schwab, C., Zheng, Q. & Fan, R. Suppression of innate immunity by
acute ethanol administration: a global perspective and a new mechanism beginning with inhibition of signaling through TLR3. J Immunol 173, 2715-2724 (2004).
2 Shell, S. A., Hesse, C., Morris, S. M., Jr. & Milcarek, C. Elevated levels of the 64-kDa cleavage stimulatory factor (CstF-64) in lipopolysaccharide-stimulated macrophages influence gene expression and induce alternative poly(A) site selection. J Biol Chem 280, 39950-39961 (2005).
3 Tyner, J. W. et al. CCL5-CCR5 interaction provides antiapoptotic signals for macrophage survival during viral infection. Nat Med 11, 1180-1187 (2005).
4 Hammer, M. et al. Dual specificity phosphatase 1 (DUSP1) regulates a subset of LPS-induced genes and protects mice from lethal endotoxin shock. J Exp Med 203, 15-20 (2006).
5 Gaither, L. A. et al. Multiple cyclophilins involved in different cellular pathways mediate HCV replication. Virology 397, 43-55 (2010).
6 Fujita, T., Ohno, S., Yasumitsu, H. & Taniguchi, T. Delimitation and properties of DNA sequences required for the regulated expression of human interferon-beta gene. Cell 41, 489-496 (1985).
7 Goodbourn, S., Zinn, K. & Maniatis, T. Human beta-interferon gene expression is regulated by an inducible enhancer element. Cell 41, 509-520 (1985).
8 Escalante, C. R., Nistal-Villan, E., Shen, L., Garcia-Sastre, A. & Aggarwal, A. K. Structure of IRF-3 bound to the PRDIII-I regulatory element of the human interferon-beta enhancer. Mol Cell 26, 703-716 (2007).
9 Sato, M. et al. Distinct and essential roles of transcription factors IRF-3 and IRF-7 in response to viruses for IFN-alpha/beta gene induction. Immunity 13, 539-548 (2000).
10 Lin, R., Genin, P., Mamane, Y. & Hiscott, J. Selective DNA binding and association with the CREB binding protein coactivator contribute to differential activation of alpha/beta interferon genes by interferon regulatory factors 3 and 7. Mol Cell Biol 20, 6342-6353 (2000).
11 Levy, D. E., Kessler, D. S., Pine, R., Reich, N. & Darnell, J. E., Jr. Interferon-induced nuclear factors that bind a shared promoter element correlate with positive and negative transcriptional control. Genes Dev 2, 383-393 (1988).
12 Kelly, L. M., Englmeier, U., Lafon, I., Sieweke, M. H. & Graf, T. MafB is an inducer of monocytic differentiation. Embo J 19, 1987-1997 (2000).
13 Kataoka, K., Fujiwara, K. T., Noda, M. & Nishizawa, M. MafB, a new Maf family transcription activator that can associate with Maf and Fos but not with Jun. Mol Cell Biol 14, 7581-7591 (1994).
14 Kern, S. E. et al. Identification of p53 as a sequence-specific DNA-binding protein. Science 252, 1708-1711 (1991).
15 Osumi, T., Wen, J. K. & Hashimoto, T. Two cis-acting regulatory sequences in the peroxisome proliferator-responsive enhancer region of rat acyl-CoA oxidase gene. Biochem Biophys Res Commun 175, 866-871 (1991).
Nat
ure
Imm
unol
ogy:
doi
:10.
1038
/ni.1
897

16 Bohmann, D. & Tjian, R. Biochemical analysis of transcriptional activation by Jun: differential activity of c- and v-Jun. Cell 59, 709-717 (1989).
17 Ting, A. T., Pimentel-Muinos, F. X. & Seed, B. RIP mediates tumor necrosis factor receptor 1 activation of NF-kappaB but not Fas/APO-1-initiated apoptosis. Embo J 15, 6189-6196 (1996).
18 Colina, R. et al. Translational control of the innate immune response through IRF-7. Nature 452, 323-328 (2008).
19 Lin, R. et al. Negative regulation of the retinoic acid-inducible gene I-induced antiviral state by the ubiquitin-editing protein A20. J Biol Chem 281, 2095-2103 (2006).
20 Yoshida, T., Ohkumo, T., Ishibashi, S. & Yasuda, K. The 5'-AT-rich half-site of Maf recognition element: a functional target for bZIP transcription factor Maf. Nucleic Acids Res 33, 3465-3478 (2005).
21 Fuda, N. J., Ardehali, M. B. & Lis, J. T. Defining mechanisms that regulate RNA polymerase II transcription in vivo. Nature 461, 186-192 (2009).
22 Miller, O. L., Jr. & Hamkalo, B. A. Visualization of RNA synthesis on chromosomes. Int Rev Cytol 33, 1-25 (1972).
23 Merika, M. & Thanos, D. Enhanceosomes. Curr Opin Genet Dev 11, 205-208 (2001).
24 Guo, S. et al. The stability and transactivation potential of the mammalian MafA transcription factor are regulated by serine 65 phosphorylation. J Biol Chem 284, 759-765 (2009).
25 Pouponnot, C. et al. Cell context reveals a dual role for Maf in oncogenesis. Oncogene 25, 1299-1310 (2006).
26 Kyo, M. et al. Evaluation of MafG interaction with Maf recognition element arrays by surface plasmon resonance imaging technique. Genes Cells 9, 153-164 (2004).
27 Hoopes, B. C., LeBlanc, J. F. & Hawley, D. K. Kinetic analysis of yeast TFIID-TATA box complex formation suggests a multi-step pathway. J Biol Chem 267, 11539-11547 (1992).
28 Saitoh, T. et al. Negative regulation of interferon-regulatory factor 3-dependent innate antiviral response by the prolyl isomerase Pin1. Nat Immunol 7, 598-605 (2006).
29 Dragan, A. I., Hargreaves, V. V., Makeyeva, E. N. & Privalov, P. L. Mechanisms of activation of interferon regulator factor 3: the role of C-terminal domain phosphorylation in IRF-3 dimerization and DNA binding. Nucleic Acids Res 35, 3525-3534 (2007).
30 O'Brien, T. & Lis, J. T. Rapid changes in Drosophila transcription after an instantaneous heat shock. Mol Cell Biol 13, 3456-3463 (1993).
31 Tennyson, C. N., Klamut, H. J. & Worton, R. G. The human dystrophin gene requires 16 hours to be transcribed and is cotranscriptionally spliced. Nat Genet 9, 184-190 (1995).
32 Femino, A. M., Fogarty, K., Lifshitz, L. M., Carrington, W. & Singer, R. H. Visualization of single molecules of mRNA in situ. Methods Enzymol 361, 245-304 (2003).
Nat
ure
Imm
unol
ogy:
doi
:10.
1038
/ni.1
897

33 Audibert, A., Weil, D. & Dautry, F. In vivo kinetics of mRNA splicing and transport in mammalian cells. Mol Cell Biol 22, 6706-6718 (2002).
34 Kim, H. & Yin, J. Effects of RNA splicing and post-transcriptional regulation on HIV-1 growth: a quantitative and integrated perspective. Syst Biol (Stevenage) 152, 138-152 (2005).
35 Lodish, H. et al. Molecular Cell Biology (fourth ed.). (W. H. Freeman and Company, 1999).
36 Alberts, B. et al. Essential Cell Biology (second ed.). (Garland Publishing Inc., 2003).
37 Thompson, J. F., Hayes, L. S. & Lloyd, D. B. Modulation of firefly luciferase stability and impact on studies of gene regulation. Gene 103, 171-177 (1991).
38 Lomvardas, S. & Thanos, D. Nucleosome sliding via TBP DNA binding in vivo. Cell 106, 685-696 (2001).
39 Newman, J. R. & Keating, A. E. Comprehensive identification of human bZIP interactions with coiled-coil arrays. Science 300, 2097-2101 (2003).
40 Wendt, H. et al. Very rapid, ionic strength-dependent association and folding of a heterodimeric leucine zipper. Biochemistry 36, 204-213 (1997).
Nat
ure
Imm
unol
ogy:
doi
:10.
1038
/ni.1
897