Embed Size (px)
Citation preview
Macroinvertebrate Index of Biotic Integrity for the Northern Glaciated Plains Ecoregion (46) of North Dakota
Final: March 2007
Prepared by: Neil J. Haugerud Environmental Scientist and Michael J. Ell Environmental Administrator North Dakota Department of Health Division of Water Quality 918 East Divide Avenue Bismarck, ND 58501-1947
North Dakota Department of Health Division of Water Quality

Macroinvertebrate Index of Biotic Integrity for the Northern Glaciated Plains Ecoregion (46)
of North Dakota
John Hoeven, Governor Terry Dwelle, M.D., State Health Officer
North Dakota Department of Health Division of Water Quality 918 East Divide Avenue
Bismarck, North Dakota 58501-1947
701.328.5210
iii
TABLE OF CONTENTS Page
List of Figures…………………………………………………………………………………….iv List of Tables……………………………………………………………………………………...v Acknowledgements……………………………………………………………………………….vi Introduction………………………………………………………………………………………..1 Methods……………………………………………………………………………………………4 Results……………………………………………………………………………………………..8 Summary…………………………………………………………………………………………22 Literature Cited…………………………………………………………………………………..23 Appendix A: Standard Operating Procedures for the Collection and Laboratory Analysis of Macroinvertebrate Samples Including Example Data Forms Appendix B: Landscape Index Development Procedure Appendix C: List of Metrics Evaluated Appendix D: Box-Whisker Plots Appendix E: Landscape Index Scores, Habitat Rankings, Habitat Scores and Raw Metric Scores
iv
LIST OF FIGURES Figure Page 1. IBI Sampling Sites for the Northern Glaciated Plains Ecoregion (46) in North Dakota ……………………………………………………………………..............2 2. Distribution of the Human Disturbance Index Ranked from Lowest to Highest Score for Northern Glaciated Plains Ecoregion (46) Glide/Pool Sites…………………....6 3. Distribution of the Human Disturbance Index Ranked from Lowest to Highest Score for Northern Glaciated Plains Ecoregion (46) Riffle/Run Sites…………………....7 4. Between-year Variation of the IBI Developed for the Glide/Pool Stream Sections of Ecoregion 46 within North Dakota………………………………………….13 5. Comparison of IBI Development Sites to Validation Sites for Glide/Pool Stream Sections of Ecoregion 46 within North Dakota………………………………….14 6. Scatterplot Showing Major Drainage Basin Membership for Glide/Pool Stream Sites in Ecoregion 46…………………………………………………………….15 7. Within-year Variation of the IBI Developed for the Riffle/Run Stream Sections of Ecoregion 46 within North Dakota………………………………………….19 8. Between-year Variation of the IBI Developed for the Riffle/Run Stream Sections of Ecoregion 46 within North Dakota………………………………………….20 9. Comparison of IBI Development Sites to Validation Sites for Riffle/Run Stream Sections of Ecoregion 46 within North Dakota…………………………………21 10. Scatterplot Showing Basin Groupings for Riffle/Run Stream Sites in Ecoregion 46……………………………………………………………………………..22

v
LIST OF TABLES Table Page 1. Northern Glaciated Plains Ecoregion (46) Glide/Pool Qualitative Human Disturbance Index (HDI) Score Rankings and Associated Scoring Ranges………..…….6 2. Northern Glaciated Plains Ecoregion (46) Riffle/Run Qualitative Human Disturbance Index (HDI) Score Rankings and Associated Scoring Ranges……………...7 3. Results of Mann-Whitney U Test and Spearman Rank Correlation to the Human Disturbance Index (HDI) for the Northern Glaciated Plains Ecoregion (46) Glide/Pool sites…………………………………………………………10 4. Northern Glaciated Plains Ecoregion (46) Glide/Pool Correlation Matrix…………...11 5. Northern Glaciated Plains Ecoregion (46) Glide/Pool Maximum and Minimum Values Used to Standardize Metrics…………………………………………12 6. Results of Mann-Whitney U Test and Spearman Rank Correlation to the Human Disturbance Index (HDI) for the Northern Glaciated Plains Ecoregion (46) Riffle/Run sites…………………………………………………………17 7. Northern Glaciated Plains Ecoregion (46) Riffle/Run Correlation Matrix…………...18 8. Northern Glaciated Plains Ecoregion (46) Riffle/Run Maximum and Minimum Values Used to Standardize Metrics…………………………………………18
vi
ACKNOWLEDGEMENTS I would like to thank the many individuals and organizations who contributed to this report. Eric Pearson and Scott Elstad, formerly with the North Dakota Department of Health, Division of Water Quality were responsible for the field sampling, data entry and preliminary data analysis. Mike Ell provided project guidance and oversight. Joe Gross performed database management and assistance. Numerous staff members and temporary employees with the North Dakota Department of Health, Division of Water Quality provided assistance with field sampling. Funding for this project was provided by U. S. Environmental Protection Agency Region 8.

1
1.0 INTRODUCTION The Northern Glaciated Plains ecoregion in North Dakota (Figure 1) is characterized by glacially formed topography and low to moderate annual precipitation. A relatively short growing (frost free) season promotes a land use emphasis on dry-farming and livestock production which in turn have the greatest large scale affect on stream water quality in the Northern Glaciated Plains. Trampling of stream banks and streambeds is particularly severe in this region because livestock tend to travel in dry water courses. Washing of manure from feedlots and stockyards into streams has a dramatic effect on stream water chemistry. Rain events tend to be intense and of short duration in this ecoregion. These rain events wash eroded cropland soil into streams, increasing turbidity and sedimentation. Fertilizers and herbicides applied to cropland are also carried to streams through runoff (Omernik and Gallant 1988). The landscape is made up of glacial lake plains and nearly level to rolling glacial till plains that are punctuated by kettle holes, kames, and moraines. Elevations range from 1,000 to 1,800 feet above sea level. Watersheds of perennial rivers including the Sheyenne River, James River, and Souris River cover more than one thousand square miles each; however, most watersheds are 100 square miles or less. Excluding the large rivers, 85 to 90 percent of the streams in this ecoregion are intermittent or ephemeral (Omernik and Gallant 1988). Aquatic life is a beneficial use that is assigned to all North Dakota streams by State Water Quality Standards (North Dakota Department of Health 2001). While an assessment of aquatic life use can be conducted indirectly with chemical data (e.g., dissolved oxygen and dissolved metals data), direct measures of the biological community are believed to be more accurate. Aquatic life use or biological integrity is defined by Karr and Dudley (1981) as the ability to support and maintain a balanced, integrated, adaptive community of organisms, having a species composition, diversity, and functional organization comparable to that of natural habitats of the region. Human disturbance of streams and landscapes alters key attributes of aquatic ecosystems (i.e., water quality, habitat structure, hydrological regime, energy flow, and biological interactions) which can result in decreased biotic integrity. In order to develop biological indicators capable of assessing the biological conditions of state’s rivers and streams, the North Dakota Department of Health (NDDoH) is developing a calibrated multi-metric index of biotic integrity (IBI) based on aquatic macroinvertebrate data for each ecoregion. Macroinvertebrates are common inhabitants of rivers and streams and vital links in the movement of energy through the food web. Advantages to using macroinvertebrates in IBI development include their high diversity, rapid colonization, and variability in tolerance to perturbation (Rosenberg and Resh 1993).

2
Figure 1. IBI Sampling Sites for the Northern Glaciated Plains Ecoregion (46) in North Dakota.
3
Once an IBI has been developed, it becomes a valuable assessment tool. A multi-metric IBI assumes that multiple measures of the biological community (i.e. metrics) (e.g., species richness, species composition, tolerance levels, trophic structure) will respond to increased pollution or habitat alterations. Metric development reduces the number of biological community attributes that need evaluation to only those that are sensitive to human disturbance or impairment. Metrics selected for the IBI are given a standardized score. Individual metric scores are then combined into an overall IBI score. These overall IBI scores can be matched with a qualitative rating such as those associated with aquatic life use support (e.g., fully supporting, fully supporting but threatened, and not supporting). Benthic macroinvertebrate metrics generally fall into five distinct categories including richness metrics, composition metrics, tolerance/intolerance metrics, feeding measure metrics and habit metrics. Richness metrics, or the number of distinct taxa, represents the diversity within an aquatic assemblage (Resh et al. 1995). Richness is a key category of metrics in a macroinvertebrate IBI. Taxa richness is usually based on species level identification but can also be evaluated as groupings of higher taxonomic levels (e.g., genus, family, order). High levels of diversity suggest that niche space, habitat and food sources are adequate to support a diverse community of macroinvertebrates (Barbour et al. 1999). Composition or relative abundance metrics provide information on the relative contribution of the various taxa to the total fauna. Although individual abundances may vary in magnitude, the proportional representations of taxa in a healthy and stable assemblage should remain consistent. A large percentage of a single dominant taxa can be equated with the dominance of a pollution tolerant organism and lowered diversity (Barbour et al. 1999). Tolerance/intolerance metrics are intended to represent the sensitivity of the macroinvertebrate assemblage to disturbance. Measurements include numbers of pollution tolerant and intolerant taxa or their percent composition. High proportions or numerous taxa of tolerant macroinvertebrates can indicate possible stressors such as organic pollution or increased sedimentation (Barbour et al. 1999). Feeding measures or trophic dynamics metrics provide information on the balance of feeding strategies by evaluating the number of taxa and percent composition of functional feeding groups. Functional feeding groups are not based on the type of food ingested, but rather on the morpho-behavioral mechanisms that a macroinvertebrate uses to acquire food (Merrit and Cummins 1996). Examples of functional feeding groups include predators, scrapers, shredders, filterers and gatherers. Stressors that cause instability in food dynamics will cause an alteration in the composition of functional feeding groups from the least disturbed or reference condition (Barbour et al. 1999). Habit or modes of existence metrics evaluate the composition of morphological adaptations that allow macroinvertebrates to attach, move, and/or conceal themselves in their environment (Merritt and Cummins 1996). Habit metric categories include

4
swimmers, skaters, clingers, climbers and burrowers. Changes in the number of taxa or percent composition of habit metrics can indicate changes in available habitat niches. The purpose of this report is to present a benthic macroinvertebrate IBI that has been developed for the Northern Glaciated Plains ecoregion in North Dakota. It is based on metrics from the above listed categories. IBI development is intended to be a dynamic process and additional refinement is likely as new sites and data are added. 2.0 METHODS The data used to develop the macroinvertebrate IBI presented in this report are based on data collected from 1995 through 2003. A total of 333 sites were sampled statewide with 431 samples collected. Sites were divided into two distinct groups, riffle/run (RR) or glide/pool (GP).
2.1 Macroinvertebrate Field Sampling
Benthic macroinvertebrate field samples were collected by NDDoH Surface Water Quality Management Program personnel in 1995-1998, 2001-2003 within the Northern Glaciated Plains ecoregion. A total of 51 GP samples were collected from 43 sites and 75 RR samples were collected from 61 sites. Sampling was conducted by apportioning 20 jabs with a D-frame net among all habitat types present (Barbour et al. 1999). For a more complete description of the field sampling procedure, see Appendix A.
2.2 Macroinvertebrate Laboratory Analyses
Laboratory analysis of macroinvertebrate samples was conducted on a 300 count sub-sample (Appendix A). These sub-samples were obtained by spreading the sample evenly on a gridded pan and picking 300 individuals from randomly selected grids. Final organism identification was done at the lowest taxonomic level practical (genus/species preferred). Laboratory analysis of macroinvertebrate samples was contracted out to Dr. Andre Delorme, Valley City State University, and Larry Brooks, Western Aquatic Technology and Environmental Resource Specialists.
2.3 Data Management and Analysis
The biological, physical and chemical data collected were entered into the Ecological Data Application System (EDAS). EDAS is an Access based program developed by Tetra Tech, Inc. under contract with the U. S. Environmental Protection Agency (EPA). EDAS is designed to facilitate data analysis, particularly the calculation of biological metrics and indices. Pre-designed queries that calculate a wide variety of biological metrics are included with EDAS (Faulkner and Lepo 2000). EDAS was used to evaluate a total of 62 candidate metrics (Appendix C) in the five categories: taxa richness, percent composition,

5
tolerance values, feeding groups, and habit measures. Microsoft Excel 2002 and Analyse-It were also used to analyze the data (Microsoft Corporation 2002, Analyse-It Software, Ltd 2003).
2.4 Human Disturbance Scoring Analysis
A human disturbance score was developed to assess the level of degradation at each site. This process consisted of a field evaluation component and a remote sensing component. The field evaluation involved sampling personnel filling out a habitat assessment field data sheet. Each site was classified as a high gradient riffle/run (RR) or a low gradient glide/pool (GP) stream and the appropriate form was used. A sample of these forms can be found in Rapid Bioassessment Protocols (RBP) for Use in Wadeable Streams and Rivers (Barbour et al. 1999).
The remote sensing component involved the development of a Landscape Index (LSI) that evaluated landuse adjacent to and influencing each stream sample reach. Landuse for each sample reach was evaluated within a 3 km circular buffer by calculating landuse metrics with the Analytical Tool Interface for Landscape Assessment (ATtILA) (Ebert et al. 2001). A final set of landscape metrics were selected by evaluating their range of response, correlation to other metrics and through professional judgment (Appendix B).
The LSI and RBP habitat assessment score for each site were combined to form the final Human Disturbance Index (HDI) (Appendix E). Sites were assigned a value of good, fair or poor according to their HDI score. The boundaries for good, fair and poor sites were set at the 90th percentile and above for good sites and the 10th percentile and below for poor sites. When a sufficient number (at least 4 good and 4 poor) of sites were not available using this method, levels were determined by graphing the range of habitat scores and then looking for the natural breakpoints in the data (glide/pool sites: Table 1, Figure 2; riffle/run sites: Table 2, Figure 3).
2.5 Metric Selection
Candidate metrics underwent a series of data reduction steps to select the final metrics used to construct the IBI. First, “box and whisker” plots for each candidate metric were plotted to evaluate the range of data (Appendix D). Box and whisker plots were also evaluated based on the amount of overlap exhibited between sites with good and poor HDI scores. All metrics with complete overlap were eliminated due to the lack of response to disturbance. In addition, metrics with insufficient ranges were eliminated. All metrics with complete separation or minimal overlap were kept for further evaluation. Second, remaining candidate metrics were evaluated using the Mann-Whitney U test. This is a nonparametric test that evaluates the difference between the medians of two independent data sets. Metrics were eliminated if the P-value was less than 0.20. Third, metrics showing a significant relationship to human disturbance were selected. This was

6
Table 1. Northern Glaciated Plains Ecoregion (46) Glide/Pool Qualitative Human Disturbance Index (HDI) Score Rankings and Associated Scoring Ranges. Habitat Rank Human Disturbance Index Score Ranges Good ≥135.0 Fair 95.6-134.9 Poor ≤95.5
80
90
100
110
120
130
140
150
160
0 5 10 15 20 25 30 35 40
Rank
Hu
man
Dis
turb
ance
Ind
ex (
HD
I)
GoodFairPoor
Figure 2. Distribution of the Human Disturbance Index Ranked from Lowest to Highest Score for Northern Glaciated Plains Ecoregion (46) Glide/Pool Sites.

7
Table 2. Northern Glaciated Plains Ecoregion (46) Riffle/Run Qualitative Human Disturbance Index (HDI) Score Rankings and Associated Scoring Ranges. Habitat Rank Human Disturbance Index Score Ranges Good ≥132.6 Fair 87.0-132.5 Poor ≤86.9
60
70
80
90
100
110
120
130
140
150
0 10 20 30 40 50 60 70
Rank
Hu
man
Dis
turb
ance
Ind
ex (
HD
I)
GoodFairPoor
Figure 3. Distribution of the Human Disturbance Index Ranked from Lowest to Highest Score for Northern Glaciated Plains Ecoregion (46) Riffle/Run Sites.

8
evaluated by performing a Spearman Rank correlation with the HDI and the evaluated metric. Metrics with P-values greater than 0.05 were eliminated (Appendix E). Finally, a correlation matrix was completed on all metrics that were not eliminated due to low responsiveness or other poor predictive characteristics. When metrics pairs were highly correlated (r>0.80) one of the pair was eliminated to reduce redundancy within the final set of metrics.
Once the final metrics were determined, raw metric values were transformed into standardized metric scores. All metric scores were computed using the following equations developed by Minns et al. (1994). The equation result in a set of standardized metrics that are on a scale of 0 to 100.
Metrics that decrease with impairment: Ms = (MR/MMAX ) x 100 Metrics that increase with impairment:
Ms = (MMAX - MR) / (MMAX - MMIN) x 100 Where:
Ms = standardized metric value MR = the raw metric value MMAX = the maximum value MMIN = the minimum value
Maximum (MMAX ) and minimum (MMIN) values were set at the 95th and 5th percentiles, respectively, of the entire data set. The overall IBI score was the mean of the standardized metric scores that comprise the final IBI.
If the data allowed, IBI scores for sites that had replicate data for consecutive years or within the same year were used to evaluate the variation in the IBI score. These comparisons allowed an evaluation of how the IBI performed between and within years. Also, at least one site with a good HDI score, one site with a poor HDI score and at least ten percent of sites with fair HDI scores were randomly selected to be left out of the IBI development process. These sites were considered validation sites and were used to evaluate performance of the final IBI.
3.0 RESULTS 3.1 Glide/Pool Sites
Glide/pool sites in the Northern Glaciated Plains ecoregion showed separation in box plots and had an adequate range of values for 23 potential metrics. Mann-Whitney tests yielded 23 metrics with P-values less than 0.20 (Table 3). Spearman rank correlations reduced the metrics to 13 candidate metrics. Evaluation of
9
correlation matrices left seven metrics (Table 4). Table 5 shows the metrics used to determine the final score and the maximum and minimum values used for scoring each metric. Results of individual IBI scores for glide/pool sites in the Northern Glaciated Plains Ecoregion are depicted in Appendix E.
The IBI scoring range for all glide/pool sites in the Northern Glaciated Plains ecoregion was 11.1 to 91.2 with a mean of 41.0 and a median of 34.5. The IBI scoring range for sites with good habitat scores was 48.6 to 78.5 with a mean of 64.3 and a median of 62.4. Sites with poor habitat scores ranged from 11.1 to 34.5 with a mean of 18.0 and a median of 13.2. Fair habitat scoring sites ranged from 14.2 to 91.2 with a mean of 40.0 and median of 33.4. A 1-way analysis of variance (AOV) showed a significant effect due to human disturbance ranks (F=7.01, P=0.003). A Tukey multiple comparison test (α=0.05) was used to compare the mean IBI score of each habitat rank. Significant differences in mean IBI scores occurred between sites with good and poor habitat scores and between sites with good and fair habitat scores. There was no difference in IBI scores between sites with fair and poor habitat scores.
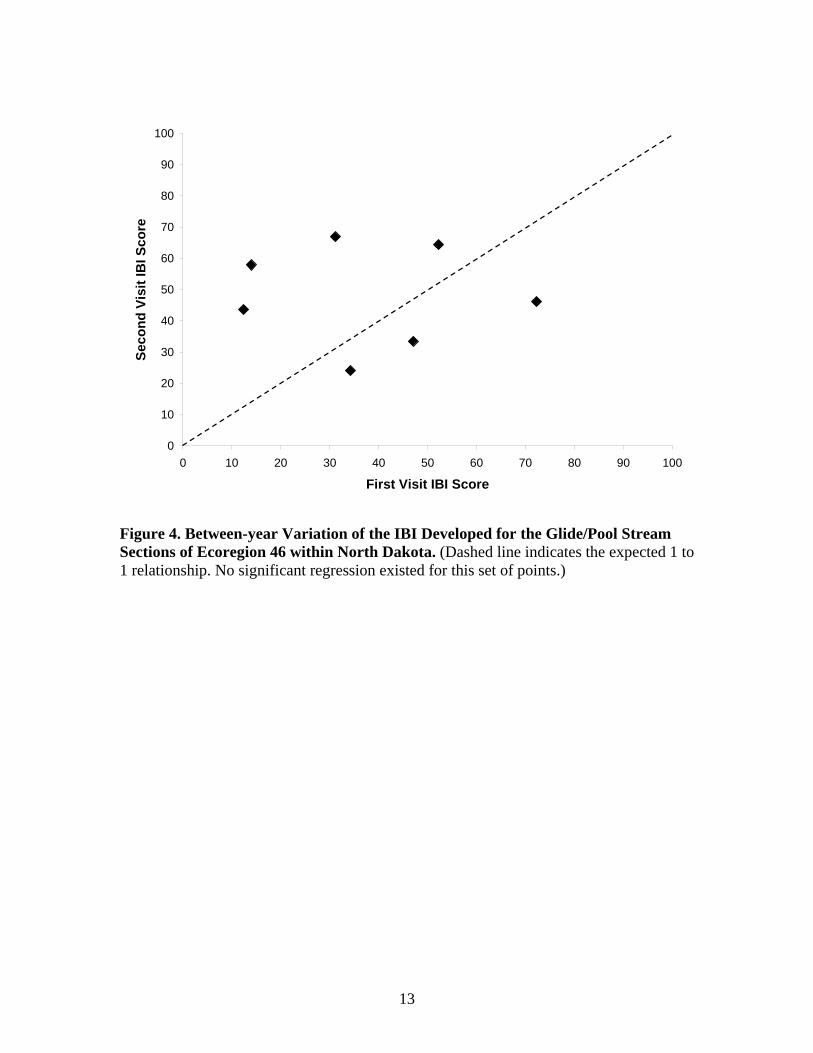
A plot of between-year variation showed little agreement between years in scoring (Figure 4). The considerable variation from the one to one relationship expected in this plot does raise concern on the performance of this IBI between years. It should be noted that this is a small sample and comparisons for each site were not available across the same years. The validation sites’ linear relationship (y = 0.4054x+ 0.4836, R2=0.0891, p=0.4727) between IBI and HDI scores that had a flatter slope than the relationship for IBI development sites(y = 0.7608x - 48.202, R2=0.2918, p=0.0008) (Figure 5). It should be noted that due to small sample size the best fit regression line is not significant and is shown only as a reference for comparison. Further study would be needed to validate the IBI for glide/pool streams.
IBI scores for glide/pool sites plotted by major drainage basin yielded a distinct pattern (Figure 6). Souris River basin sites made up the majority of the high IBI scores and Red River basin sites made up the majority of the low IBI scores. Since the IBI development hinges on differences between good and poor sites, this IBI may be responding to natural differences in these two basins rather than human disturbance. Future study designs in the Northern Glaciated Plains ecoregion may want to incorporate this information and consider development of separate macroinvertebrate IBIs for the two basins.
10
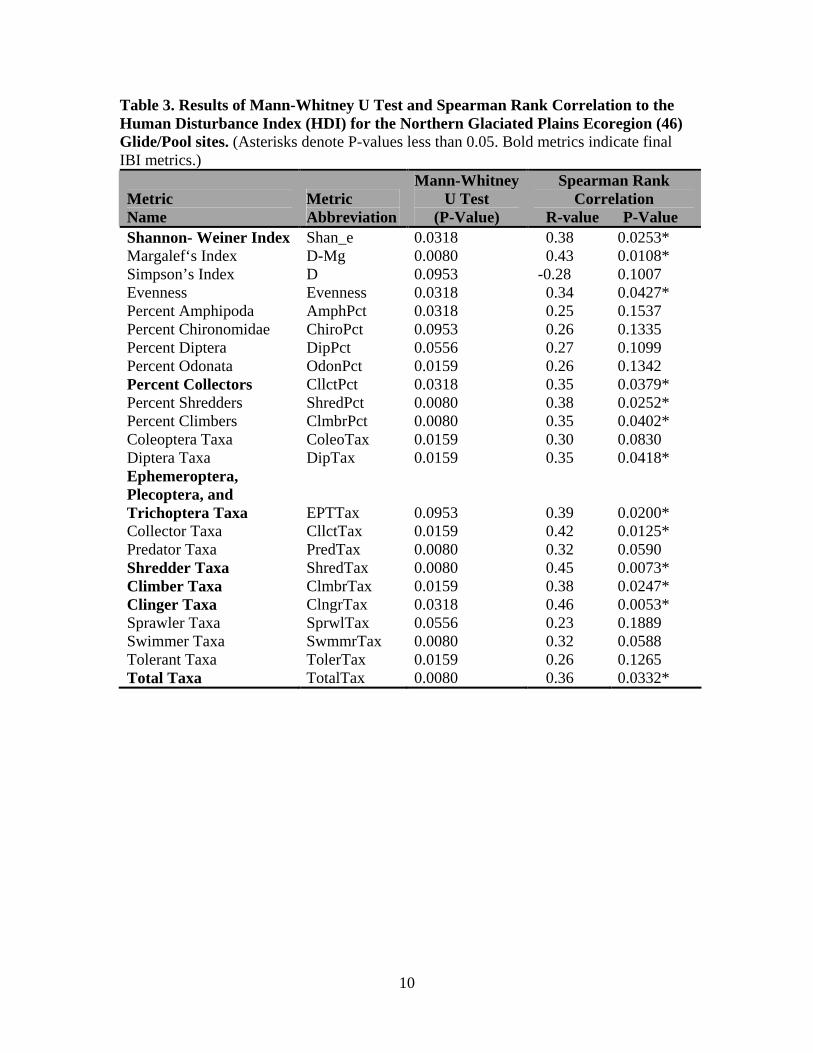
Table 3. Results of Mann-Whitney U Test and Spearman Rank Correlation to the Human Disturbance Index (HDI) for the Northern Glaciated Plains Ecoregion (46) Glide/Pool sites. (Asterisks denote P-values less than 0.05. Bold metrics indicate final IBI metrics.)
Metric Name
Metric Abbreviation
Mann-Whitney U Test
(P-Value)
Spearman Rank Correlation
R-value P-Value Shannon- Weiner Index Shan_e 0.0318 0.38 0.0253* Margalef‘s Index D-Mg 0.0080 0.43 0.0108* Simpson’s Index D 0.0953 -0.28 0.1007 Evenness Evenness 0.0318 0.34 0.0427* Percent Amphipoda AmphPct 0.0318 0.25 0.1537 Percent Chironomidae ChiroPct 0.0953 0.26 0.1335 Percent Diptera DipPct 0.0556 0.27 0.1099 Percent Odonata OdonPct 0.0159 0.26 0.1342 Percent Collectors CllctPct 0.0318 0.35 0.0379* Percent Shredders ShredPct 0.0080 0.38 0.0252* Percent Climbers ClmbrPct 0.0080 0.35 0.0402* Coleoptera Taxa ColeoTax 0.0159 0.30 0.0830 Diptera Taxa DipTax 0.0159 0.35 0.0418* Ephemeroptera, Plecoptera, and Trichoptera Taxa EPTTax 0.0953 0.39 0.0200* Collector Taxa CllctTax 0.0159 0.42 0.0125* Predator Taxa PredTax 0.0080 0.32 0.0590 Shredder Taxa ShredTax 0.0080 0.45 0.0073* Climber Taxa ClmbrTax 0.0159 0.38 0.0247* Clinger Taxa ClngrTax 0.0318 0.46 0.0053* Sprawler Taxa SprwlTax 0.0556 0.23 0.1889 Swimmer Taxa SwmmrTax 0.0080 0.32 0.0588 Tolerant Taxa TolerTax 0.0159 0.26 0.1265 Total Taxa TotalTax 0.0080 0.36 0.0332*

11
Table 4. Northern Glaciated Plains Ecoregion (46) Glide/Pool Correlation Matrix. (Numbers in bold represent correlations with r>0.80. Abbreviations are defined in Table 3)
Shan_e D-Mg Evenness CllctPct ShredPct ClmbrPct DipTax EPTTax CllctTax ShredTax ClmbrTax ClngrTax TotalTax
Shan_e 1.00
D-Mg 0.78 1.00
Evenness 0.81 0.47 1.00
CllctPct -0.10 0.28 -0.39 1.00
ShredPct 0.31 0.27 0.51 -0.12 1.00
ClmbrPct 0.32 0.20 0.29 -0.09 0.18 1.00
DipTax 0.60 0.74 0.30 0.24 0.06 0.12 1.00
EPTTax 0.42 0.57 0.26 0.18 0.03 -0.02 0.54 1.00
CllctTax 0.59 0.81 0.18 0.49 0.02 0.11 0.76 0.66 1.00
ShredTax 0.33 0.74 0.10 0.42 0.29 -0.02 0.43 0.57 0.68 1.00
ClmbrTax 0.40 0.76 0.13 0.38 0.21 0.25 0.55 0.31 0.63 0.78 1.00
ClngrTax 0.69 0.79 0.44 0.18 0.03 0.27 0.61 0.69 0.75 0.55 0.54 1.00
TotalTax 0.66 0.97 0.27 0.39 0.13 0.15 0.71 0.58 0.85 0.78 0.78 0.78 1.00

12
Table 5. Northern Glaciated Plains Ecoregion (46) Glide/Pool Maximum and Minimum Values Used to Standardize Metrics. Glide/Pool Metrics Category Reaction to Perturbation Minimum value Maximum value 1 Shannon Diversity Index Richness Decrease 0.58 2.54 2 Percent Collectors Trophic Decrease 0 88.03 3 Ephemeroptera, Plectoptera and
Trichoptera Taxa Composition Decrease 0 6 4 Shredder Taxa Trophic Decrease 0 5 5 Climber Taxa Habit Decrease 0 6 6 Clinger Taxa Habit Decrease 0 7 7 Total Taxa Richness Decrease 6 32
13
0
10
20
30
40
50
60
70
80
90
100
0 10 20 30 40 50 60 70 80 90 100
First Visit IBI Score
Sec
on
d V
isit
IBI S
core
Figure 4. Between-year Variation of the IBI Developed for the Glide/Pool Stream Sections of Ecoregion 46 within North Dakota. (Dashed line indicates the expected 1 to 1 relationship. No significant regression existed for this set of points.)

14
IBI Development Sitesy = 0.7608x - 48.202
R2 = 0.2918
Validation Sitesy = 0.4054x + 0.4836
R2 = 0.0891
0
10
20
30
40
50
60
70
80
90
100
0 50 100 150 200
Human Disturbance Index (HDI)
Ind
ex o
f B
ioti
c In
teg
rity
(IB
I)IBI Development SitesValidation SitesLinear (IBI Development Sites)Linear (Validation Sites)
Figure 5. Comparison of IBI Development Sites to Validation Sites for Glide/Pool Stream Sections of Ecoregion 46 within North Dakota. (Lines indicate linear regressions. Results of each linear regression are reported above.)

15
0
10
20
30
40
50
60
70
80
90
100
0 20 40 60 80 100 120 140 160 180 200
Human Disturbance Index (HDI)
Ind
ex o
f B
ioti
c In
teg
rity
(IB
I)
JamesRedSouris
Figure 6. Scatterplot Showing Major Drainage Basin Membership for Glide/Pool Stream Sites in Ecoregion 46.
3.2 Riffle/Run Sites Riffle/run sites in the Northern Glaciated Plains ecoregion showed separation in box plots and had an adequate range of values for 20 potential metrics. Mann-Whitney tests yielded 20 metrics with P-values less than 0.20 (Table 6). Spearman rank correlations reduced the metrics to 7 candidate metrics. Evaluation of correlation matrices left five metrics (Table 7). The intolerant taxa metric was added back to the IBI after it was determined that it caused the IBI score to have a better correlation with the HDI score after it was added back to the index. Table 8 shows the metrics used to determine the final score and the maximum and minimum values used for scoring each metric. Results of individual IBI scores for riffle/run sites in the Northern Glaciated Plains Ecoregion are depicted in Appendix E.
The IBI scoring range for all riffle/run sites in the Northern Glaciated Plains ecoregion was 1.7 to 89.0 with a mean of 36.8 and a median of 35.1. The IBI scoring range for sites with good habitat scores was 24.7 to 85.1 with a mean of 57.6 and a median of 55.8. Sites with poor habitat scores ranged from 13.6 to 26.7 with a mean of 19.7 and a median of 19.0. Fair habitat scoring sites ranged from

16
1.7 to 89.0 with a mean of 36.4 and median of 35.2. A 1-way analysis of variance (AOV) showed a significant effect due to human disturbance ranks (F=5.71, P=0.006). A Tukey multiple comparison test (α=0.05) was used to compare the mean IBI score of each habitat rank. Significant differences in mean IBI scores occurred between sites with good and poor habitat scores and between sites with good and fair habitat scores. There was no difference in IBI scores between sites with fair and poor habitat scores.
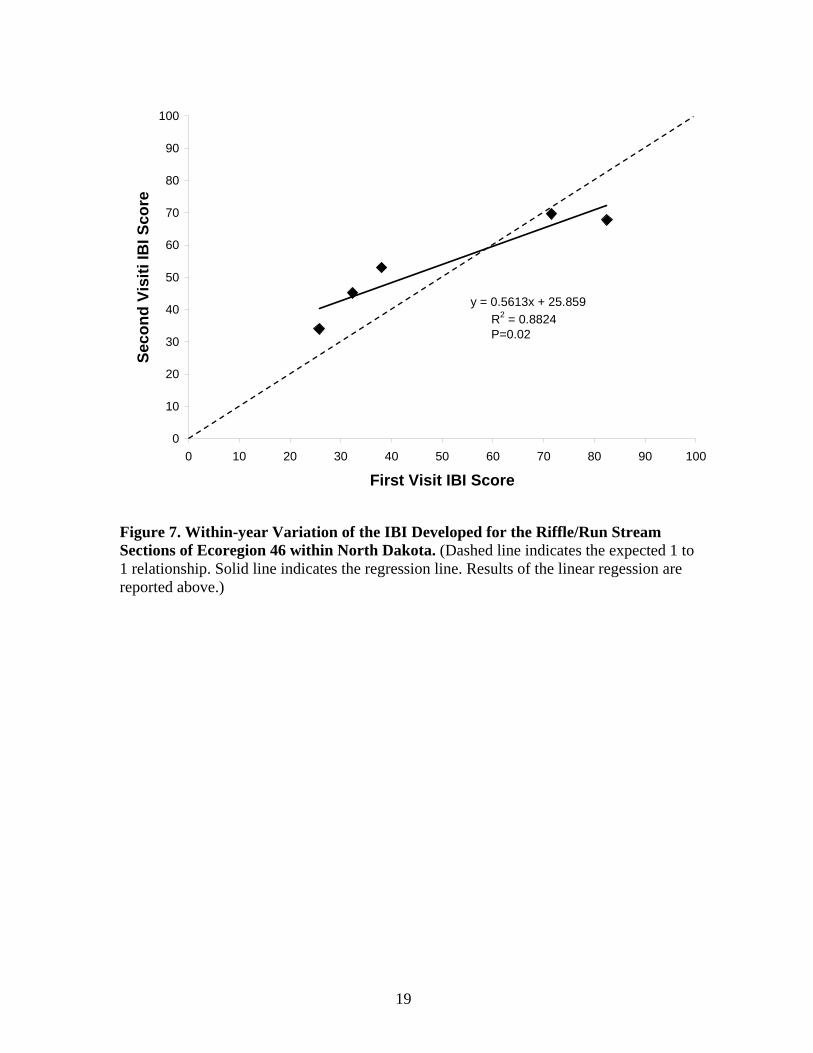
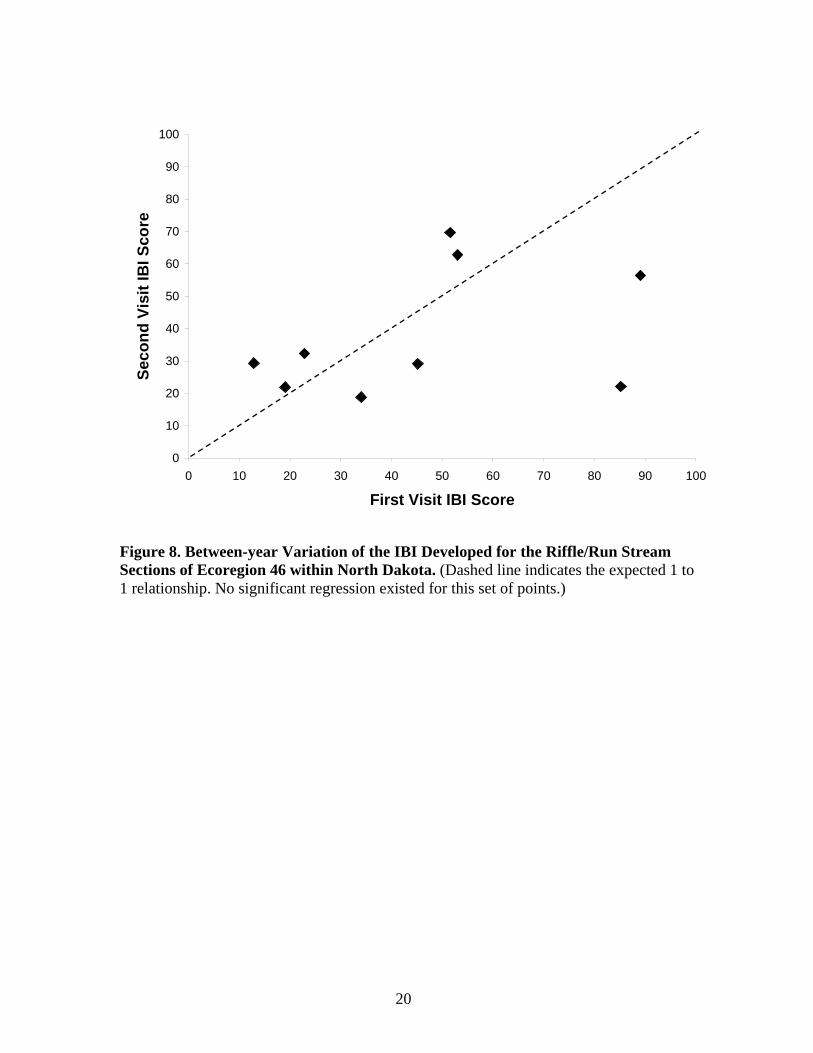
Data for both within-year and between year comparisons were available for riffle/run sites. A plot of within-year variation had a slightly flatter slope from the expected slope of 1 (Figure 7). The small sample size (n=5) makes it unclear if the variation is enough to warrant a strict sampling window for these sites. A plot of between-year variation showed little agreement between years in scoring (Figure 8). The considerable variation from the one to one relationship expected in this plot does raise concern on the performance of this IBI between years. It should be noted that comparisons for each site were not available across the same years. The validation sites’ linear relationship (y = 0.2771x+ 7.2597, R2=0.1044, p=0.4879) between IBI and HDI scores that had a flatter slope than the relationship for IBI development sites(y = 0.4737x – 16.7470, R2=0.2050, p=0.0007) (Figure 9). It should be noted that due to small sample size the best fit regression line is not significant and is shown only as a reference for comparison. Further study would be needed to investigate whether the IBI is valid.
IBI scores for riffle/run sites plotted by major drainage basin did not yield a distinct pattern (Figure 10). Scores for the Souris basin and James basin were scattered throughout the distribution and the Red basin had too few sites to evaluate (n=3). Drainage basin differences within the ecoregion do not seem to affect IBI scores for riffle/run sites as strongly as they do for glide/pool sites (Figure 6).

17
Table 6. Results of Mann-Whitney U Test and Spearman Rank Correlation to the Human Disturbance Index (HDI) for the Northern Glaciated Plains Ecoregion (46) Riffle/Run sites. (Asterisks denote P-values less than 0.05. Bold metrics indicate final IBI metrics.)
Metric Name
Metric Abbreviation
Mann-Whitney U Test
(P-Value)
Spearman Rank Correlation
R-value P-Value Shannon- Weiner Index Shan_e 0.0476 0.08 0.5693 Margalef‘s Index D-Mg 0.0754 0.08 0.5656 Hilsenhoff Biotic Index HBI 0.0754 -0.18 0.1904 Beck Biotic Index BeckBI 0.0080 0.37 0.0057* Evenness Evenness 0.0754 0.08 0.5864 Percent Amphipoda AmphPct 0.0754 -0.02 0.9108 Percent Trichoptera TrichPct 0.0278 0.36 0.0074* Percent Filterer FiltrPct 0.0476 0.19 0.1705 Percent Predator PredPct 0.0754 -0.32 0.0182* Percent Shredders ShredPct 0.0278 0.23 0.1011 Percent Intolerant Taxa IntolPct 0.0040 0.32 0.0190* Percent Tolerant Taxa TolerPct 0.0476 -0.13 0.3604 Percent Dominant Taxa Dom01Pct 0.0754 -0.01 0.9470 Ephemeroptera, Plecoptera, and Trichoptera Taxa EPTTax 0.0278 0.31 0.0260* Trichoptera Taxa TrichTax 0.0159 0.36 0.0090* Shredder Taxa ShredTax 0.0476 0.08 0.5574 Clinger Taxa ClngrTax 0.0754 0.14 0.3278 Sprawler Taxa SprwlTax 0.0278 0.16 0.2638 Intolerant Taxa IntolTax 0.0040 0.30 0.0284* Total Taxa TotalTax 0.0476 0.07 0.6359

18
Table 7. Northern Glaciated Plains Ecoregion (46) Riffle/Run Correlation Matrix. (Numbers in bold represent correlations with r>0.80. Abbreviations are defined in Table 6)
BeckBI TrichPct PredPct IntolPct EPTTax TrichTax IntolTax
BeckBI 1.00
TrichPct 0.38 1.00
PredPct -0.09 -0.23 1.00
IntolPct 0.42 0.38 0.10 1.00
EPTTax 0.66 0.36 -0.24 0.30 1.00
TrichTax 0.63 0.39 -0.26 0.17 0.87 1.00
IntolTax 0.83 0.37 0.07 0.35 0.44 0.48 1.00 Table 8. Northern Glaciated Plains Ecoregion (46) Riffle/Run Maximum and Minimum Values Used to Standardize Metrics. Glide/Pool Metrics Category Reaction to Perturbation Minimum value Maximum value 1 Beck Biotic Index Tolerance/Intolerance Decrease 0 6 2 Percent Trichoptera Composition Decrease 0 30.36 3 Percent Predators Trophic Increase 1.04 38.05 4 Percent Intolerant Taxa Tolerance/Intolerance Decrease 0 25.05 5 Ephemeroptera, Plecoptera
and Trichoptera Taxa Composition Decrease 0 10 6 Intolerant Taxa Tolerance/Intolerance Decrease 0 3
19
y = 0.5613x + 25.859 R2 = 0.8824 P=0.02
0
10
20
30
40
50
60
70
80
90
100
0 10 20 30 40 50 60 70 80 90 100
First Visit IBI Score
Sec
on
d V
isit
i IB
I Sco
re
Figure 7. Within-year Variation of the IBI Developed for the Riffle/Run Stream Sections of Ecoregion 46 within North Dakota. (Dashed line indicates the expected 1 to 1 relationship. Solid line indicates the regression line. Results of the linear regession are reported above.)
20
0
10
20
30
40
50
60
70
80
90
100
0 10 20 30 40 50 60 70 80 90 100
First Visit IBI Score
Sec
on
d V
isit
IBI S
core
Figure 8. Between-year Variation of the IBI Developed for the Riffle/Run Stream Sections of Ecoregion 46 within North Dakota. (Dashed line indicates the expected 1 to 1 relationship. No significant regression existed for this set of points.)

21
Validation Sitesy = 0.2771x + 7.2597
R2 = 0.1044
IBI Development Sitesy = 0.4737x - 16.747
R2 = 0.205
0
10
20
30
40
50
60
70
80
90
100
0 50 100 150 200
Human Disturbance Index (HDI)
Ind
ex o
f B
ioti
c In
teg
rity
(IB
I)IBI Development SitesValidation SitesLinear (Validation Sites)Linear (IBI Development Sites)
Figure 9. Comparison of IBI Development Sites to Validation Sites for Riffle/Run Stream Sections of Ecoregion 46 within North Dakota. (Lines indicate linear regressions. Results of each linear regression are reported above.)

22
0
10
20
30
40
50
60
70
80
90
100
0 20 40 60 80 100 120 140 160
Human Disturbance (HDI)
Ind
ex o
f B
ioti
c In
teg
rity
(IB
I)
JamesRedSouris
Figure 10. Scatterplot Showing Basin Groupings for Riffle/Run Stream Sites in Ecoregion 46. 4.0 SUMMARY
The purpose of this project is to develop a set of benthic macroinvertebrate multimetric IBIs that can be used to assess the biological condition of perennial rivers and streams in North Dakota. This report addresses those methods used and results found for the Northern Glaciated Plains ecoregion (46) within North Dakota. Exhaustive statistical analyses were not conducted on these data. Tests of significance are often overused by ecologists (Fore et al. 1996) and short-circuit the process of looking at and interpreting the data. Such tests address detection of impact rather than their magnitude or relevance (Stewart-Oaten 1986). This was considered when we incorporated visual assessments (box plots) in evaluating metrics and used less rigorous p-values when assessing the Mann-Whitney tests. More emphasis should be centered on understanding and evaluating the biological data and condition of the sampling sites and less on the statistical procedures used to analyze them. Development of an IBI is a widely accepted practice throughout the United States. Biocriteria are useful tools in allowing managers to assess human disturbances to our aquatic environments. Because biological systems are dynamic, an IBI should be continually revised and updated as additional data becomes available. Efforts should also

23
focus on sampling sufficient numbers of “least disturbed” or “best available” reference sites as well as impaired sites with high levels of human disturbance. Efforts to resample reference and impaired sites between and within years should also be implemented to permit the evaluation of how IBI scores vary over time. An IBI is a useful tool for evaluating and monitoring our lotic environments. It should, however, be used to complement and enhance other data (e.g., chemical data, habitat data, landscape data) to determine not only the biological condition of the aquatic resource, but to understand the cause and source of stressors on the biology of impaired rivers and streams. Other biological conformation (e.g., fish community data) can also be collected when performing stream surveys. By combining information from different biological communities, an integrated approach to examining aquatic life use can be developed. The IBIs developed for Northern Glaciated Plains ecoregion showed some variability problems that warrant refinement before they are used in management decisions. Future studies of this ecoregion will need to be aware of the basin effects seen in glide/pool reaches and designs must address this issue. Also, the use of a stricter sampling window during sample collection may yield better performing IBIs. 5.0 LITERATURE CITED
Analyse-It Software, Ltd., Analyse-It, version 1.67. 2003. Barbour, M.T., J.B. Stribling and J.R. Karr. 1995. Multimetric approach for establishing biocriteria and measuring biological condition. Pages 63-77 in W.S. Barbour, M.T., J. Gerritsen, B.D. Snyder, J.B. Stribling. 1999. Rapid Bioassessment Protocols for Use in Wadeable Streams and Rivers. EPA 841-B-99-002. A7-A10. Davis and T.P. Simon (editors). Biological assessment and criteria. Tools for water resource planning and decision making. Lewis Publishers, Boca Raton, Florida. Ebert, D. W., T. G. Wade, J. E. Harrison, and D. H. Yankee. 2001. Analytical Tools Interface for Landscape Assessment (ATtILA) Quick Start Guide Version 3.0. Draft. http://www.epa.gov/nerlesd1/land-sci/oregon/attila/user_guide.html Faulkner, C. and E. Lepo. 2000. Ecological Data Application System (EDAS) A User’s Guide. Tetra Tech, Inc. 10045 Red Run Blvd, Baltimore, MD. 21117. Fore, L. S., J. R. Karr, and L.L. Conquest. 1994. Statistical properties of an index of biotic integrity used to evaluate water resources. Canadian Journal of Fisheries and Aquatic Sciences 51:1077-1087.

24
Fore, L.S., J.R. Karr, and R.W. Wisseman. 1996. Assessing invertebrate responses to human activities: evaluating alternative approaches. Journal of North American Benthological Society 15(2):212:231. Karr, J.R. and D.R. Dudley. 1981. Ecological perspectives on water quality goals. Environmental Management 5: 44-68. North Dakota Department of Health. 2001. Standards of Water Quality for Waters of the State. North Dakota Century Code 33-16-02.1. Merritt, R.W. and K.W. Cummins (eds.) 1996. An Introduction to the Aquatic Insects of North America. 3rd edition. Kendall/Hunt Publishing Company. Dubuque, IA. USA. Microsoft Corporation, Excel 2002 SP-2, 2002. Minns, C.K., V.W. Cairns, R.G. Randall, and J.E. Moore. 1994. An index of biotic integrity (IBI) for fish assemblages in the littoral zone of Great Lakes’ areas of concern. Canadian J. Fish Aquat. Sci. 51:1804-1822. Omernik, J.M. and A.L.Gallant 1988. Ecoregions of the Upper Midwest States. USEPA Research Laboratory, Corvallis, OR. EPA/600/3-88/037. Resh, V.H., R.H. Norris, and M.T. Barbour. 1995. Design and implementation of rapid assessment approaches for water resource monitoring using benthic macroinvertebrates. Austrailian Journal of Ecology 20:108-121. Rosenberg, D.M. and V.H. Resh (eds.). 1993. Freshwater Biomonitoring and Benthic Macroinvertebrates. Chapman and Hall. New York. Stewart-Oaten, W.W. Murdoch, and K.R. Parker. 1986. Environmental impact assessment and “pseuoreplication” in time. Ecology 67:929-40.

Appendix A
Standard Operating Procedures for the Collection and Laboratory Analysis of Macroinvertebrate Samples
Including Example Data Forms

7.19 STANDARD OPERATING PROCEDURES FOR THE COLLECTION OF A MACROINVERTEBRATE
SAMPLE FROM WADABLE RIVERS AND STREAMS Summary Macroinvertebrates are excellent indicators of aquatic health. Additionally, due to the range of life spans and varying needs throughout their life span, macroinvertebrates are excellent indicators of chronic and acute pollution impacts. In rivers and streams which naturally contain cobble (riffle/run) habitat, a single sample collected from this habitat is considered representative of the stream reach. Many rivers and streams in the state, however, do not naturally contain cobble substrate. These rivers and streams are typically low gradient streams with sandy or silty sediments. In cases where cobble substrate represents less than 30% of the sampling reach in reference streams (i.e., least impaired streams which represent the ecoregion or basin) the multi-habitat method for collecting macroinvertebrate samples should be used (Section 3.19.2). It is important to recognize that the appropriate sampling method (single or multi-habitat) should be selected based on the habitat availability of the reference condition and not of potentially impaired streams. For example, the multi-habitat method should not be used for stream reaches where the extent of cobble substrate was reduced due to anthropogenic sediment deposition. Conversely, the single-habitat method should not be used where the stream reach contains artificially introduced rock or cobble material. The following methods have been developed, in part, based on the Rapid Bioassessment Protocols for Use in Streams and Wadeable Rivers: Periphyton, Benthic Macroinvertebrates, and Fish, Second Edition (Barbour et al. 1999). 7.19.1 Field Collection Procedures for Single-Habitat Macroinvertebrate
Samples Equipment list __ D-Frame net, Kick net, Surber Bottom Sampler, or Hess
Bottom Sampler (500-600 µm mesh opening) __ Waders (chest-high or hip boots) __ Sample containers (1 and 2 liter plastic jars) __ Sample container labels (waterproof Nalgene Polypaper) __ 95 % Ethanol __ Sieve bucket (500 µm mesh opening) __ Forceps __ Permanent marker (black) __ Pencils, clipboard __ Field Recording and Log Forms __ Camera __ Global Positioning System (GPS) Unit (optional) Procedures
1. Once the sampling reach has been selected (Note: The area should be at least 100 meters
upstream from any road or bridge crossing to minimize its effect on stream velocity, depth and overall habitat quality.), complete the Biological Monitoring Field Collection Data Form (Figure 7.19.1). To record the latitude and longitude, use a hand held Global Positioning System (GPS) and determine latitude and longitude at the furthest downstream point of the sampling reach. On the recording form, draw a site map of the sampling reach. The map should include in-stream attributes (e.g., riffles, fallen trees, pools, bends), important structures, attributes of the bank and near bank area, and the location of all areas sampled. The map should also include an arrow in the direction of flow and an arrow depicting north.
2. A composite sample is collected from a minimum of three “kicks” each located at various
velocities, in the riffle or series of riffles. (Note: The composite sample should consist of a minimum of 300 organisms; therefore, additional kick samples may be required.) A “kick” is a stationary sampling accomplished by disturbing area in front of the full width of the net to a distance 1 meter upstream of the net. Using the toe or heel of the boot, dislodge the upper layer of cobble or gravel and scrape the underlying bed. Larger rocks should be picked up and rubbed by hand to remove attached organisms. This method presumes a D-frame net with a 454 cm2 opening is used, however, other gear types (e.g., kick-net, Surber sample, Hess sampler, etc.) may be used depending on project specific Quality Assurance Project Plans.
3. The individual kicks collected for each area in the riffle or series of riffles is composited
into a single homogeneous sample. After every kick, place the sample in a sieve bucket, or in the sample net, wash the collected material with clean stream water 2-3 times. Remove large debris after rinsing and inspecting it for organisms, placing all organisms found into the sample container.
4. Transfer the sample from the sieve bucket or net to the sample container. Once all the
samples are composited in the sample container, decant excess water from the container and preserve in enough 95 % ethanol to cover the sample. (Note: Forceps may be needed to remove organisms from the net.)
5. Place a Nalgene Polypaper label in the sample container and label the outside of the
container with black permanent marker. Both labels should contain the station identification number and description, the field number, date and time of collection, and the collector(s) name. The outside of the container should also contain the words: “preservative: 95% ethanol.” If more than one container is used for a sample, each container should contain all the information for the sample and should be numbered 1 of 2, 2 of 2, etc.
6. Record each sample on the Macroinvertebrate Sample Log Form (Figure 7.19.2). Include
information such as field number, station identification and description, date and time, and number of containers.

North Dakota Department of Health
Division of Water Quality Biological Monitoring Field Collection Data Form
Station ID: ______________________________ Field Number: __________________________________
Waterbody Name: _______________________________________________________________________
Station Description: _____________________________________________________________________
Latitude: ___________________________________ Longitude: _________________________________
County: _______________ Township: __________ Range: _______________ Section: _______________
River Basin: _____________________________________ Ecoregion: _____________________________
Weather (air temp, wind, etc.): _____________________________________________________________
Flow (cfs): _____ Water Temp: ______ pH: ______ Specific Cond.: ______Dissolved Oxygen: _________
Reach Length (m): _________ Average Reach Width (m): ________ Average Reach Depth (m): ________
Stream Habitat Type (%): Riffle: _____ Pool: _____ Snag: _____Aquatic Vegetation: _____
Undercut Bank: _____ Overhanging Vegetation: _____ Other: _____________________
Bottom Substrate Type (%): Boulder: ____ Cobble: ____ Gravel: ____ Sand: ____ Silt: ____ Clay: ____
Collection Method: _________Time Start: __________ Time Stop:____________ Total Time:__________
Habitat Assessment: Yes or No Macroinvertebrate Sample: Yes or No Water Chemistry: Yes or No
Sampler(s): ____________________________________________________________________________
Comments: ____________________________________________________________________________
Figure 7.19.1. Macroinvertebrate Field Collection Data Recording Form
North Dakota Department of Health Division of Water Quality
Macroinvertebrate Field Sample Log
Field Number
Station ID and Description
Date/ Time
Collection Method
Comments
Figure 7.19.2. Macroinvertebrate Sample Log

7.19.2 Field Collection Procedures for Multi-Habitat Macroinvertebrate Samples Equipment list D-frame net (454 cm2 opening and 600 µm mesh) Waders (chest-high or hip boots) Sample containers (1 and 2 liter plastic jars) Sample container labels (water proof Nalgene Polypaper) 95 % Ethanol Sieve bucket (500 µm mesh opening) Forceps Permanent magic marker (black) Pencils, clipboard Field Recording and Log Forms Camera Global Positioning System (GPS) Unit (optional) Procedures 1. Once the sampling reach has been selected (Note: The area should be at least 100 meters
upstream from any road or bridge crossing to minimize its effect on stream velocity, depth and overall habitat quality.), complete the Macroinvertebrate Field Collection Data Recording Form (Figure 7.19.1). To record the latitude and longitude, use a hand held Global Positioning System (GPS) and determine latitude and longitude at the furthest downstream point of the sampling reach. On the recording form, draw a site map of the sampling reach. The map should include in-stream attributes (e.g., riffles, fallen trees, pools, bends), important structures, attributes of the bank and near bank area, and the location of all areas sampled. The map should also include an arrow in the direction of flow and an arrow depicting north.
2. A composite sample is collected from stable stream macroinvertebrate habitats in the sample
reach (e.g., riffles, shoreline, aquatic vegetation, leaf pack, root wads, and snags). Each composite sample will consist of collecting 20 individual jab/kick samples apportioned among the stable stream habitats, with a minimum of 2 samples per habitat. Each available habitat is sampled in approximate proportion to their availability in the reach. For example, if a sampling reach is composed of 10 percent riffles, 40 percent pools with vegetation, and 50 percent runs with over hanging banks, 2 samples would be collected from the riffles, 8 from the pools and 10 from the runs. A minimum of two jabs or kicks should be collected from each available habitat type. Habitat types contributing less than 5 percent of stable habitat in the reach should not be sampled. In this case, allocate the remaining jabs proportionately among the predominant substrates. Record the number of jabs and kicks taken in each habitat type in the comments on the Field Data Recording Form (Figure 7.19.1).
3. Sampling begins at the downstream end of the reach and proceeds upstream. Each “jab”
sample consists of forcefully thrusting the net into the productive habitat for a linear distance of 1 m. Kick samples should be collected from snag or riffle habitats. A “kick” is a stationary sample taken by positioning the net and disturbing the substrate for a distance of 1 m upstream of the net.
4. All 20 jabs/kicks which are collected from the multiple habitats will be composited into a
single homogeneous sample. After every three individual jab/kick samples, more often if necessary, place the sample in a sieve bucket and wash the collected material by running
clean stream water through the net two to three times. Remove large debris after rinsing and inspecting it for organisms; place any organisms found into the sample container. Do not spend time inspecting small debris in the field.
5. Transfer the sample from the sieve bucket into the sample container. Once all the individual
samples are composited in the sample container, decant excess water from the container and preserve in enough 95 % ethanol to cover the sample. (Note: Forceps may be needed to remove organisms from the net.)
6. Place a Nalgene Polypaper label in the sample container and label the outside of the container
with black permanent marker. Both labels should contain the station identification number and description, the field number, date and time of collection, and the collector(s) name. The outside of the container should also contain the words: “preservative: 95% ethanol. ”If more than one container is used for a sample, each container should contain all the information for the sample and should be numbered 1 of 2, 2 of 2, etc.
7. Record each sample on the Macroinvertebrate Field Sample Log Form (Figure 7.19.2).
Include information such as field number, station identification and description, date and time, and number of containers.
References Barbour, M.T., J. Gerritsen, B.D. Snyder, and J.B. Stribling. 1999. Rapid Bioassessment Protocols for Use in Streams and Wadeable Rivers: Periphyton, Benthic Macroinvertebrates and Fish, Second Edition. EPA 841-B-99-002. U.S. Environmental Protection Agency; Office of Water; Washington, D.C.

7.20 STANDARD OPERATING PROCEDURE FOR LABORATORY PROCESSING OF MACROINVERTEBRATE SAMPLES
Summary Macroinvertebrate samples collected in the field by either the single or multi-habitat method are best processed in the laboratory under controlled conditions. Aspects of laboratory sample processing include washing, rinsing, sub-sampling, sorting, identification, and enumeration of organisms. The following protocol describes a method to sub-sample macroinvertebrates collected from a site. In cases where the sample contains large numbers of organisms, sub-sampling reduces the effort required for sorting and identification. The following protocol is based on a 300 organism sub-sample, but it can be used for any size sub-sample (100, 200, 500, etc.). Equipment list ___ Laboratory sample log in forms (Figure 7.20.1) ___ Laboratory bench sheets for sorting and identification
(7.20.2) ___ Sorting Pans (surface area of pan should be divided into
grids of equal size for picking) ___ Forceps (both fine tipped, medium tipped and curved) ___ Dissecting Probes and Needles ___ Watch Glasses ___ Dissecting Scope (9X to 110X for final IDs) ___ Dissecting Scope (7X to 30X to aid in sorting) ___ Compound Microscope (4X, l0X, 40X, and 100X oil objectives andphase contrast optics) ___ Specimen Vials (assorted sizes of 1, 2, and 4 drams and larger with screw cap vials for voucher specimens) ___ Squeeze bottles (1 liter for 70% ethanol) ___ Eyedroppers ___ Tally counter ___ Hot plate ___ Microscopes slides ___ Microscope coverslips 1 oz. Round ___ Magnifying lens with light source for picking samples ___ Taxonomic keys ___ 70% Ethanol ___ Euparol and/or CMC 10 mounting media ___ Potassium Hydroxide (KOH) 10% by volume ___ Illuminator compatible with dissecting scope ___ Deck of numbered cards
Procedures 1. Sample Custody/Login In
In order to ensure proper sample custody, upon transfer and receipt by laboratory personnel, record all samples on the laboratory sample log in form (Figure 7.20.1). Include the date received and all information from the sample container label. If more than one container was used, record the number of containers per sample. All samples should be sorted in the same laboratory to enhance quality control.
2. Washing and Preparing the Sample for Sorting
Thoroughly rinse the sample in a 500 µm-mesh sieve to remove preservative and fine sediment. Large organic material (whole leaves, twigs, algae, or macrophyte mats, etc.) not removed in the field should be rinsed, visually inspected, and discarded. If the samples have been preserved in alcohol, it will be necessary to soak the sample contents in water for about 15 minutes to hydrate the benthic organisms. This will prevent them from floating on the water surface during sorting. If the sample was stored in more than one container, the contents of all containers for a given sample should be combined at this time. Gently mix the sample by hand while rinsing to make the entire sample homogeneous. After washing, spread the sample evenly across a pan marked with numbered grids approximately 6 cm x 6 cm. Along the sides and top of the gridded pan, line up numbered specimen vials, which will hold the sorted organisms. Start with vials 1-15 set up and have vials 16-30 available, if needed. If the sample is to be identified that day, these jars can contain water. If it is towards the end of the day and they will not be identified in the next twelve hours the jars should contain 70 percent ethanol.
3. Sample Sorting and Counting
Using a deck of cards that contains numbers corresponding to the numbered grids in the pan, draw a card to select a grid within the gridded pan. This is done to make sure a random sampling is carried out. Begin picking organisms from that square and placing them in the numbered vials. Any organism that is lying over a line separating two grids is considered to be on the grid containing its head. In those instances where it may not be possible to determine the location of the head (worms for instance), the organism is considered to be in the grid containing most of its body. Each numbered vial should contain one taxon of organisms. Use a tally counter to keep track of the total number of organisms. The tally counters can also be used to keep track of specific taxa (i.e., scuds or corixids) that may be in high abundance. When all organisms have been removed from the selected grid, draw another card and remove all the organisms from that grid in the same manner. If new taxa are found, place them in the next empty vial. Continue this process of drawing cards and picking grids. After 10 grids have been picked, determine the average number of organisms per grid and determine approximately how many total grids will be picked to reach 300 organisms. When approaching that number of grids, monitor the total count of organisms. A sample should not be stopped in the middle of picking a grid, so stop on a grid that will give a number of 300 organisms or more. This is done to eliminate any bias as to which organisms would be picked in the last grid. Rarely will the final count be exactly 300 organisms. Note on the bench data sheet how many

grids were picked to get the final count. Save the remaining unsorted sample debris residue in a separate container labeled “sample residue”; this container should include the original sample label.
On the laboratory bench data sheet (Figure 7.20.2) write down the tentative identifications and total numbers of organisms for each vial. Examine vials under a 10X dissecting scope to count organisms and ensure that all organisms in a jar are of the same taxon. Do not try and separate taxa that are hard to differentiate, this will be done under higher power during the final identification. Once all vials have been recorded on the bench sheet, place screw tops on the vials, place the vials and bench sheet in to a designated tray and bring it over to the final identification station.
After laboratory processing is complete for a given sample, all sieves, pans, trays, etc., that have come in contact with the sample will be rinsed thoroughly, examined carefully, and picked free of organisms or debris; organisms found will be added to the sample residue.
4. Sample Identification
Final organism identifications should be done to the lowest taxonomic level practicable (genus/species preferred). In order to provide accurate taxonomic identification, midge (Chironomidae) larvae and pupae will be mounted on slides in an appropriate medium (e.g., Euperal, CMC-10); slides will be labeled with the site identifier, date collected, and the first initial and last name of the collector. As with midges, worms (Oligochaeta) must also be mounted on slides and should be appropriately labeled. All slides should be archived so further levels of identification can be done at a later date. Each taxon found in a sample is recorded and enumerated on the laboratory bench sheet (Figure 7.20.2). Any difficulties encountered during identification (e.g., missing gills) are noted on these sheets.
Record the identity and number of organisms in each taxonomic group on the laboratory bench sheet. Also, record the life stage of the organisms and the taxonomist’s initials. After each taxon is identified, the organisms will be placed in a container. A label with the site number, location, date of the sample, and taxonomic identification should also be placed in the container.
5. Sample Vouchers and Storage In order to ensure accuracy and precision it is recommended that a voucher collection be
established for each set of samples which are enumerated and identified by a specific laboratory. A voucher collection is established by extracting individual specimens of each taxon from the sample collection. These individuals will be placed in specimen vials and tightly capped. A label that includes site, date, taxon, and identifying taxonomist will be place inside the vial. Slides that are to be included in the voucher collection must be initialed by the identifying taxonomist. A separate label may be added to slides to include the taxon (taxa) name(s) for use in a voucher or reference collection.
For archiving samples, specimen vials (grouped by voucher collection station and date) are placed in jars with a small amount of denatured 70 percent ethanol and tightly capped. The ethanol level in these jars must be examined periodically and replenished as needed, before ethanol loss from the specimen vials takes place. A stick-on label is placed on the

outside of the jar indicating sample identifier, date, and preservative (denatured 70 percent ethanol). Voucher collections will be cataloged and placed in the North Dakota River and Stream Macroinvertebrate Collection located at Valley City State University by Dr. Andre DeLorme, Ph.D.

Page ___ of ___
North Dakota Department of Health Division of Water Quality
Macroinvertebrate Laboratory Bench Data Sheet
Site: _________Sample #: ________ Date sampled:___________ No. of Squares picked; _____ Pickers: ______DateID:_______
Jar #
Phylum/ Order
Family Genus Species
Final Count
Life Stage
Notes
1
2
3
4
5
6
7
8
9
10
11
12
13
14
15
16
17
18
19
20
21
22
23
24
25
Figure 7.20.2. Macroinvertebrate Laboratory Bench Data Sheet.

Appendix B
Landscape Index Development Procedure

Landscape Index Development The Landscape Index (LSI) was developed to add a broader watershed landuse component to our estimate of human disturbance and refine our development of biological indicators. The habitat assessments from the Rapid Bioassessment Protocol (RBP) provided local, site specific disturbance, but did not encompass much beyond what was visible at a site. Combining these two indices allowed for a more holistic approach to determining human disturbance. Methods The LSI was developed using the Analytical Tools Interface for Landscape Assessments (ATtILA, Version 3.0) in ArcView 3.2. This ArcView extension required six specific datasets to provide data on potential landuse metrics (Ebert et al. 2001) (Table 1). Initial investigation evaluated whether delineating watershed boundaries within 3 km of a sample site or using 3 km circles centered at the site were different in determining landuse metrics. The sample area was all 12-digit hydrologic unit code (HUC) watersheds that had been delineated within the border of North Dakota as of 2004. Those 12-digit HUC watersheds that were only partially inside the border were not used in this analysis because the landuse coverage was available only for North Dakota. Each 12-digit HUC (n = 304) had a test site added at the outlet point. The results indicated both methods yielded similar information (Table 2). Since delineating watershed boundaries for site evaluation required more effort, 3 km circular buffers were used to analyze potential metrics for the LSI. A total of 46 metrics were considered for use in the LSI. Metrics were evaluated by the overall range of values, colinearity with other metrics (through a correlation matrix) and best professional judgment. Metrics were eliminated with narrow value ranges and those selected had moderate to low correlation. Results and Discussion A total of 6 metrics were selected for the final LSI (Table 3; abbreviations for metrics are listed in Table 2). They represented erosion potentials, landuse nearest to stream edge, road density (which also is a surrogate to population) and nutrient loading. Metrics had broad ranges (Table 3) and limited correlation (did not exceed r = 0.60) (Table 4). Erosion potential metrics (AGPSL3 and AGCSL3) were included for both cropland and pastureland recognizing that the eastern part of North Dakota is dominated by row crop agriculture and western North Dakota is dominated by cattle grazing. A slope of 3% is the threshold determined at which soil erosion occurs (USDA 1951). Increased soil erosion could lead to higher total suspended solids and increased sedimentation. Metrics addressing cropland and grasslands nearest the stream (RAGC30 and RNG30) were used to determine runoff problems. Cropland provides little buffer to overland flow whereas grassland provides greater retention and absorption. Roadways could impact streams through increased runoff and sediment. Increased road density (RDDENS) also indicated areas of higher population. Runoff from these areas could carry lawn fertilizer, automobile fluids/oils and other harmful household chemicals to the stream. Nutrient

loading was addressed by the phosphorus loading metric (P_LOAD). This was an estimate of nonpoint source phosphorus coming off all the surrounding land within the 3 km buffer. Estimates were based on literature export coefficients (Reckhow et al. 1980). Increased levels of phosphorus could lead to eutrification of a stream and decreased oxygen levels. All of the metrics included in the LSI provided a broader look at human impacts that could potentially affect the biological community. Literature Cited Ebert, D. W., T. G. Wade, J. E. Harrison, and D. H. Yankee. 2001. Analytical Tools Interface for Landscape Assessment (ATtILA) Quick Start Guide Version 3.0. Draft. http://www.epa.gov/nerlesd1/land-sci/oregon/attila/user_guide.html Reckhow, K.H., Beaulac, M. N., and Simpson, J. T. 1980. Modeling Phosphorus Loading and Lake Response Under Uncertainty: A Manual and Compilation of Export Coefficients. USEPA 440/5-80-011. Washington, DC: Office of Water Regulations and Standards, U.S. Environmental Protection Agency. U.S. Department of Agriculture. 1951. Soil Survey Manual. Agricultural Handbook 18. Washington, DC: U.S. Department of Agriculture. 503pp. Table 1. Data Input and Sources for the Analytical Tools Interface for Landscape Assessments (ATtILA) Used to Develop the Landscape Index (LSI). Dataset Source 1 Landuse/Land cover National Agricultural Statistic Services, 2003 data 2 Elevation/Slope United States Geological Survey (USGS), Digital
Elevation Map (DEM) 3 Streams USGS, National Hydrography Dataset (NHD) 4 Roads North Dakota Department of Transportation 5 Population U.S. Census Bureau, 2000 data 6 Precipitation North Dakota State Climatologist, North Dakota
Agricultural Weather Network (NDAWN), Average precipitation 1971-2000

Table 2. Pearson Correlation Coefficient (r) of Landscape Index (LSI) Metrics Comparing Watershed Boundaries Within 3 km to 3 km Circular Buffers of Sample Sites. (All are significant at p<0.0001.) Metrics Abbreviation r Percentage of pasture land on a slope of > 3% AGPSL3 0.95 Percentage of crop land on a slope of > 3% AGCSL3 0.88 Percentage of crop land within 30M of the stream RAGC30 0.95 Percentage of grasslands within 30M of the stream RNG30 0.88 Road density RDDENS 0.82 Phosphorus loading P_LOAD 0.93
Table 3. Range of Values for the Landscape Index (LSI) Metrics.
Metrics Human disturbance greatest at this level Range
AGPSL3 Higher 0% 89.4% AGCSL3 Higher 0% 43.0% RAGC30 Higher 0% 92.7% RNG30 Lower 0% 63.3% RDDENS Higher 0 km/buffered area 11.3 km/buffered area P_LOAD Higher 0.4 kg/ha/yr 1.5 kg/ha/yr
Table 4. Pearson Correlation Matrix of the Landscape Index (LSI) Metrics.
AGPSL3 AGCSL3 RAGC30 RNG30 RDDENS P_LOAD AGPSL3 1.00 AGCSL3 0.02 1.00 RAGC30 -0.60 0.18 1.00 RNG30 -0.34 0.07 0.16 1.00 RDDENS -0.15 -0.08 -0.01 0.02 1.00 P_LOAD -0.12 -0.12 0.42 -0.35 -0.02 1.00
Appendix C
List of Metrics Evaluated
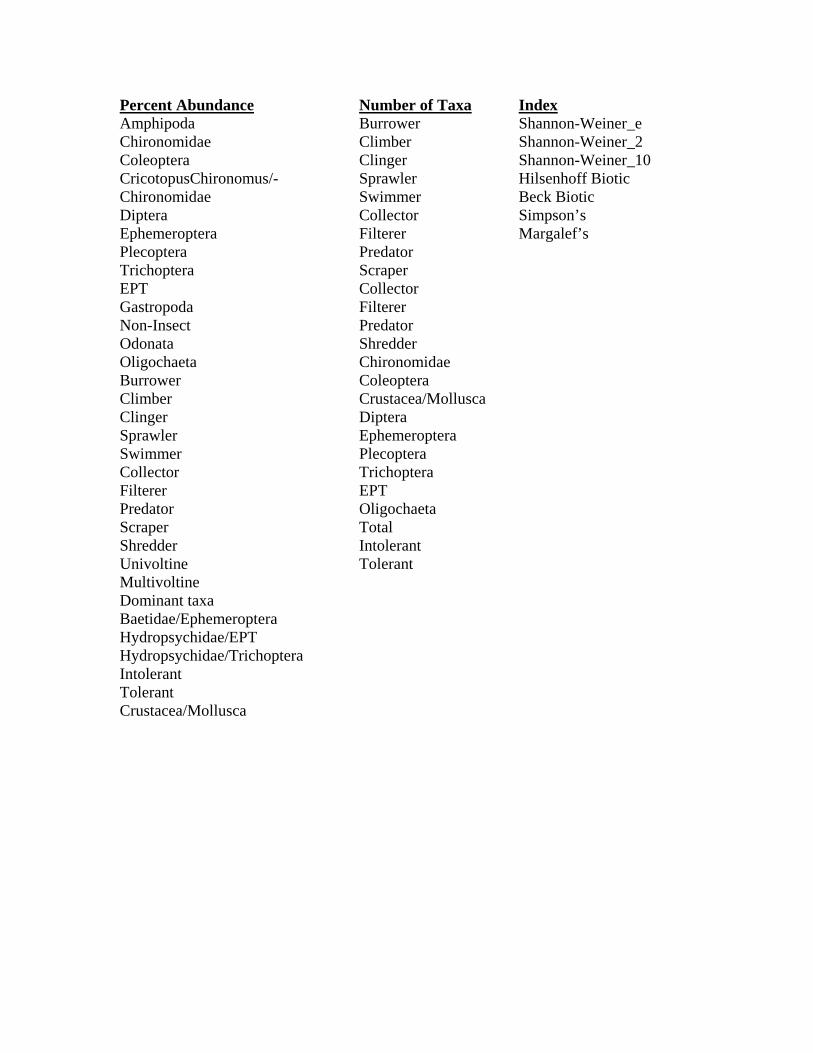
Percent Abundance Number of Taxa Index Amphipoda Burrower Shannon-Weiner_e Chironomidae Climber Shannon-Weiner_2 Coleoptera Clinger Shannon-Weiner_10 CricotopusChironomus/- Sprawler Hilsenhoff Biotic Chironomidae Swimmer Beck Biotic Diptera Collector Simpson’s Ephemeroptera Filterer Margalef’s Plecoptera Predator Trichoptera Scraper EPT Collector Gastropoda Filterer Non-Insect Predator Odonata Shredder Oligochaeta Chironomidae Burrower Coleoptera Climber Crustacea/Mollusca Clinger Diptera Sprawler Ephemeroptera Swimmer Plecoptera Collector Trichoptera Filterer EPT Predator Oligochaeta Scraper Total Shredder Intolerant Univoltine Tolerant Multivoltine Dominant taxa Baetidae/Ephemeroptera Hydropsychidae/EPT Hydropsychidae/Trichoptera Intolerant Tolerant Crustacea/Mollusca

Appendix D
Box-Whisker Plots

analysed with: Analyse-it + General 1.67
Test Comparative descriptivesGlide/Pool 46Percent Amphipoda by HDI rating
Performed by Neil Haugerud Date 9 November 2004
AmphPct by Index rating n Mean SD SE 90% CI of Mean Median IQR 90% CI of MedianGood 5 26.022 23.5682 10.5400 3.552 to 48.492 30.361 38.106 1.270 to 54.817
Fair 26 36.320 31.0868 6.0966 25.906 to 46.734 23.242 54.830 14.286 to 63.823Poor 4 3.287 6.5744 3.2872 -4.449 to 11.023 0.000 9.862 - to -
-20
0
20
40
60
80
100
Good Fair Poor

analysed with: Analyse-it + General 1.67
Test Comparative descriptivesGlide/Pool 46Percent Baetidae/Ephemeroptera by HDI rating
Performed by Neil Haugerud Date 20 October 2004
Baet2EphPct by Index rating n Mean SD SE 90% CI of Mean Median IQR 90% CI of MedianGood 5 64.127 41.7913 18.6896 24.283 to 103.970 87.179 45.650 0.000 to 100.000
Fair 44 23.161 35.2444 5.3133 14.228 to 32.093 0.000 46.154 0.000 to 11.111Poor 5 4.007 6.6715 2.9836 -2.353 to 10.368 0.000 4.651 0.000 to 15.385
-40
-20
0
20
40
60
80
100
120
140
Good Fair Poor
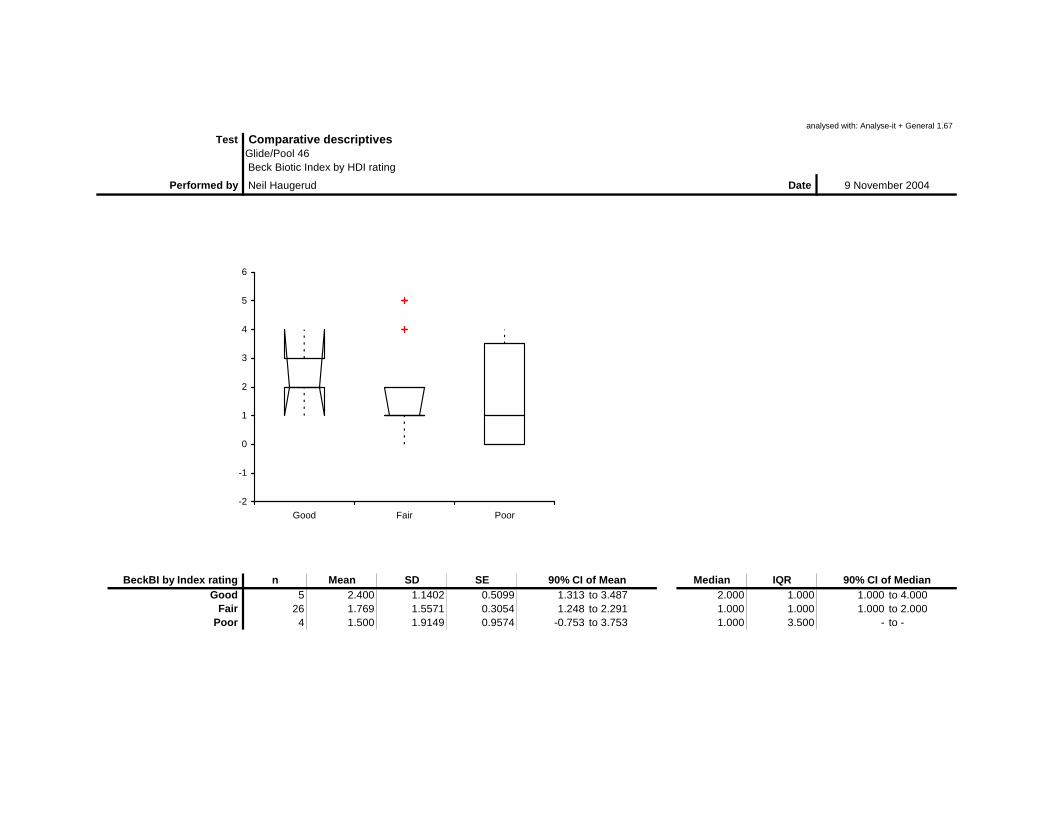
analysed with: Analyse-it + General 1.67
Test Comparative descriptivesGlide/Pool 46 Beck Biotic Index by HDI rating
Performed by Neil Haugerud Date 9 November 2004
BeckBI by Index rating n Mean SD SE 90% CI of Mean Median IQR 90% CI of MedianGood 5 2.400 1.1402 0.5099 1.313 to 3.487 2.000 1.000 1.000 to 4.000
Fair 26 1.769 1.5571 0.3054 1.248 to 2.291 1.000 1.000 1.000 to 2.000Poor 4 1.500 1.9149 0.9574 -0.753 to 3.753 1.000 3.500 - to -
-2
-1
0
1
2
3
4
5
6
Good Fair Poor

analysed with: Analyse-it + General 1.67
Test Comparative descriptivesGlide/Pool 46Percent Bivalvia by HDI rating
Performed by Neil Haugerud Date 9 November 2004
BivalPct by Index rating n Mean SD SE 90% CI of Mean Median IQR 90% CI of MedianGood 5 2.309 2.6358 1.1788 -0.204 to 4.822 1.270 4.972 0.000 to 5.301
Fair 26 0.384 1.1544 0.2264 -0.003 to 0.770 0.000 0.077 0.000 to 0Poor 4 11.263 17.3440 8.6720 -9.146 to 31.671 4.007 29.108 - to -
-20
-10
0
10
20
30
40
Good Fair Poor
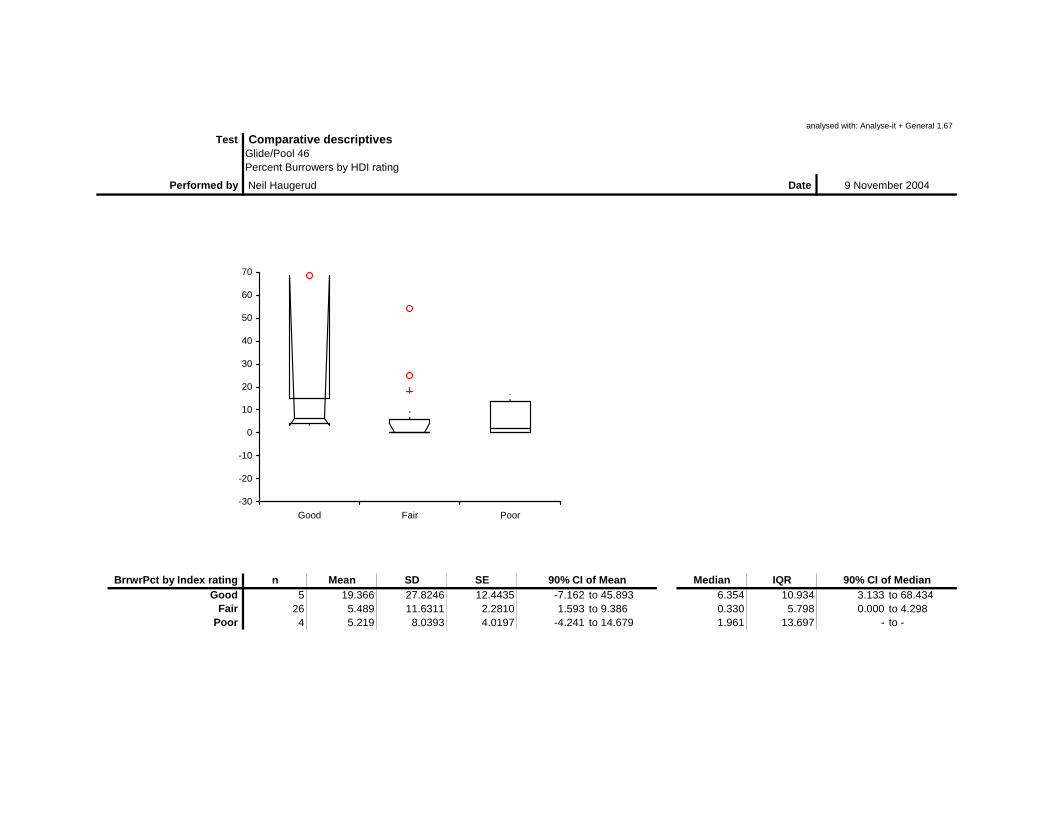
analysed with: Analyse-it + General 1.67
Test Comparative descriptivesGlide/Pool 46Percent Burrowers by HDI rating
Performed by Neil Haugerud Date 9 November 2004
BrrwrPct by Index rating n Mean SD SE 90% CI of Mean Median IQR 90% CI of MedianGood 5 19.366 27.8246 12.4435 -7.162 to 45.893 6.354 10.934 3.133 to 68.434
Fair 26 5.489 11.6311 2.2810 1.593 to 9.386 0.330 5.798 0.000 to 4.298Poor 4 5.219 8.0393 4.0197 -4.241 to 14.679 1.961 13.697 - to -
-30
-20
-10
0
10
20
30
40
50
60
70
Good Fair Poor
analysed with: Analyse-it + General 1.67
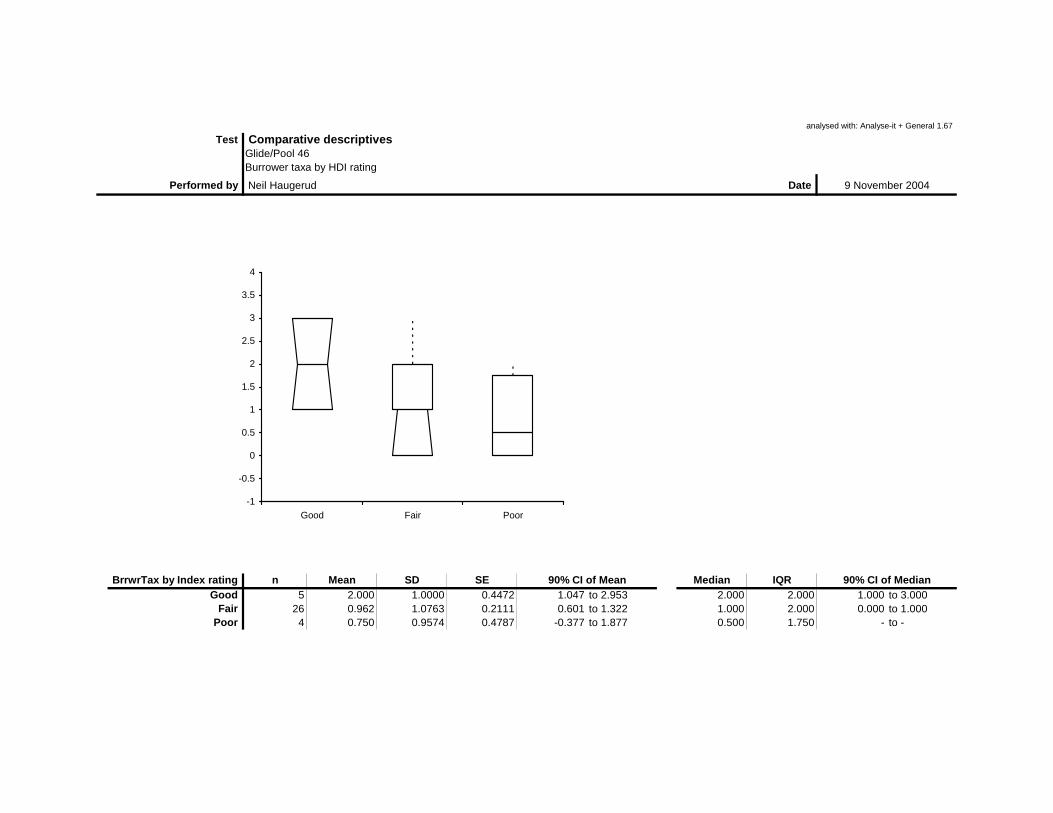
Test Comparative descriptivesGlide/Pool 46Burrower taxa by HDI rating
Performed by Neil Haugerud Date 9 November 2004
BrrwrTax by Index rating n Mean SD SE 90% CI of Mean Median IQR 90% CI of MedianGood 5 2.000 1.0000 0.4472 1.047 to 2.953 2.000 2.000 1.000 to 3.000
Fair 26 0.962 1.0763 0.2111 0.601 to 1.322 1.000 2.000 0.000 to 1.000Poor 4 0.750 0.9574 0.4787 -0.377 to 1.877 0.500 1.750 - to -
-1
-0.5
0
0.5
1
1.5
2
2.5
3
3.5
4
Good Fair Poor

analysed with: Analyse-it + General 1.67
Test Comparative descriptivesGlide/Pool 46Percent Chironomidae by HDI rating
Performed by Neil Haugerud Date 9 November 2004
ChiroPct by Index rating n Mean SD SE 90% CI of Mean Median IQR 90% CI of MedianGood 5 19.080 27.9510 12.5001 -7.568 to 45.728 5.801 10.299 2.892 to 68.434
Fair 26 3.082 5.5149 1.0816 1.235 to 4.930 0.000 3.884 0.000 to 3.540Poor 4 4.239 8.4775 4.2388 -5.737 to 14.214 0.000 12.716 - to -
-30
-20
-10
0
10
20
30
40
50
60
70
Good Fair Poor

analysed with: Analyse-it + General 1.67
Test Comparative descriptivesGlide/Pool 46Percent Climbers by HDI rating
Performed by Neil Haugerud Date 9 November 2004
ClmbrPct by Index rating n Mean SD SE 90% CI of Mean Median IQR 90% CI of MedianGood 5 3.412 1.7225 0.7703 1.770 to 5.055 3.133 2.807 1.329 to 5.249
Fair 26 5.266 7.9854 1.5661 2.591 to 7.941 2.751 3.744 1.729 to 4.302Poor 4 0.136 0.2717 0.1359 -0.184 to 0.456 0.000 0.408 - to -
-10
-5
0
5
10
15
20
25
30
35
40
Good Fair Poor
analysed with: Analyse-it + General 1.67
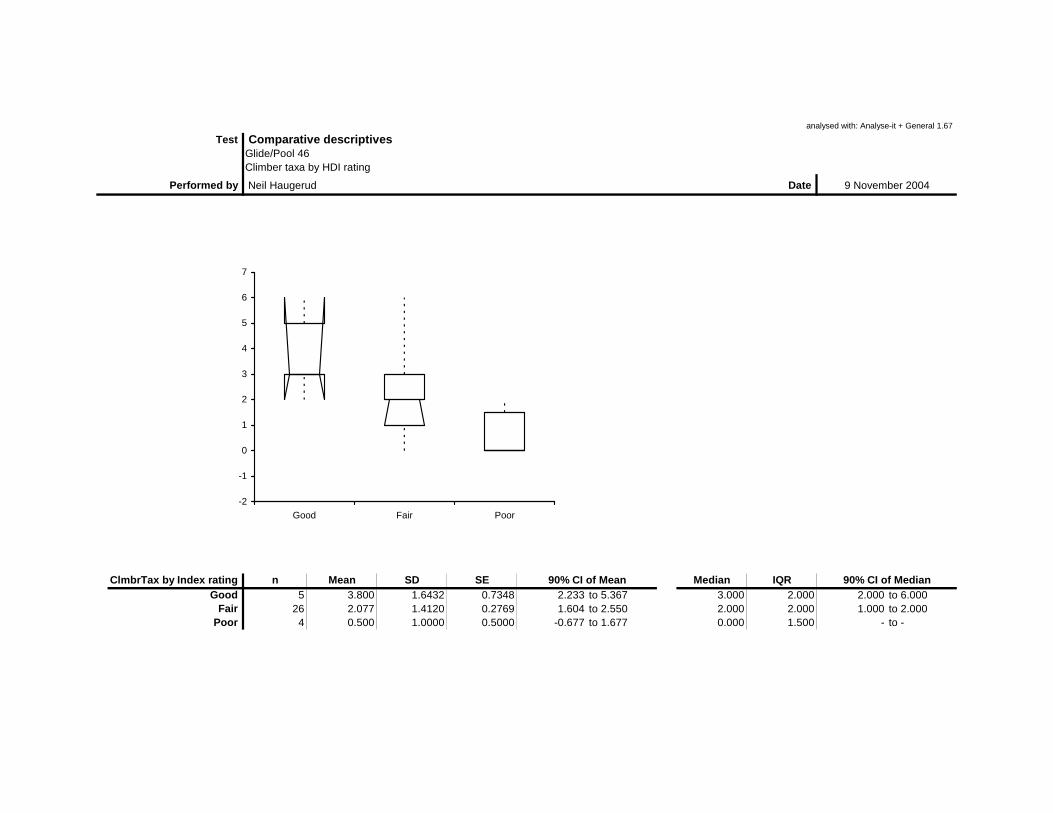
Test Comparative descriptivesGlide/Pool 46Climber taxa by HDI rating
Performed by Neil Haugerud Date 9 November 2004
ClmbrTax by Index rating n Mean SD SE 90% CI of Mean Median IQR 90% CI of MedianGood 5 3.800 1.6432 0.7348 2.233 to 5.367 3.000 2.000 2.000 to 6.000
Fair 26 2.077 1.4120 0.2769 1.604 to 2.550 2.000 2.000 1.000 to 2.000Poor 4 0.500 1.0000 0.5000 -0.677 to 1.677 0.000 1.500 - to -
-2
-1
0
1
2
3
4
5
6
7
Good Fair Poor
analysed with: Analyse-it + General 1.67
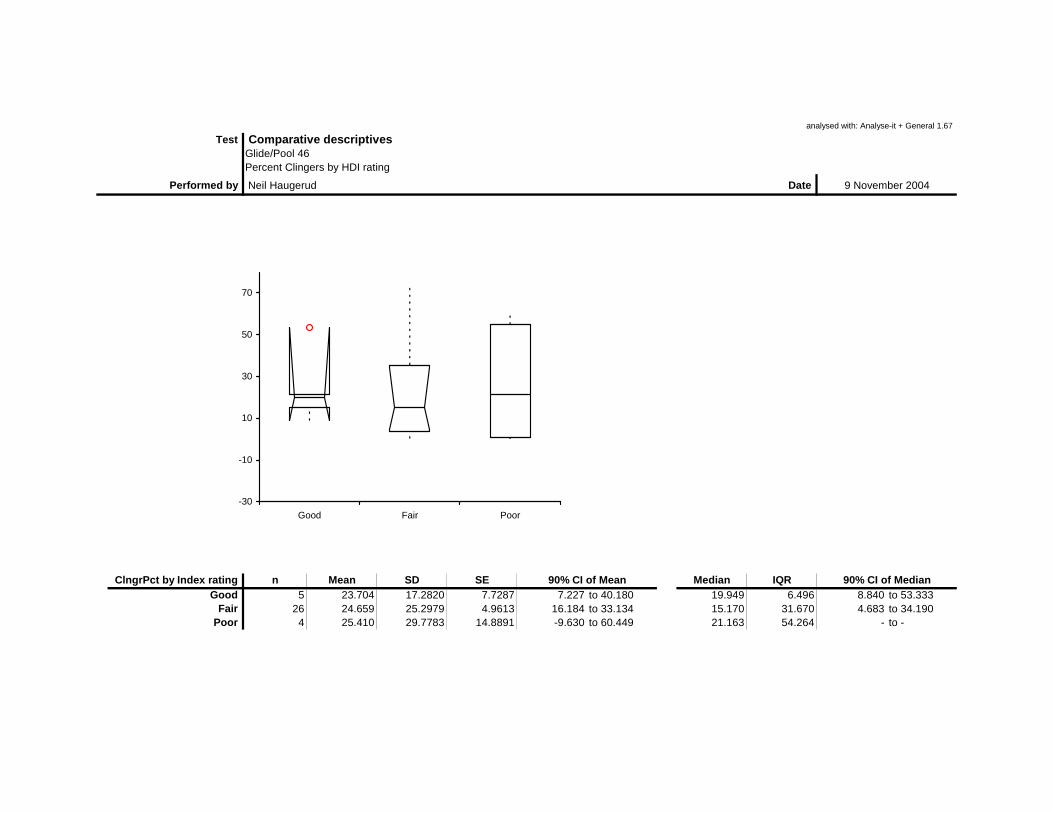
Test Comparative descriptivesGlide/Pool 46Percent Clingers by HDI rating
Performed by Neil Haugerud Date 9 November 2004
ClngrPct by Index rating n Mean SD SE 90% CI of Mean Median IQR 90% CI of MedianGood 5 23.704 17.2820 7.7287 7.227 to 40.180 19.949 6.496 8.840 to 53.333
Fair 26 24.659 25.2979 4.9613 16.184 to 33.134 15.170 31.670 4.683 to 34.190Poor 4 25.410 29.7783 14.8891 -9.630 to 60.449 21.163 54.264 - to -
-30
-10
10
30
50
70
Good Fair Poor
analysed with: Analyse-it + General 1.67
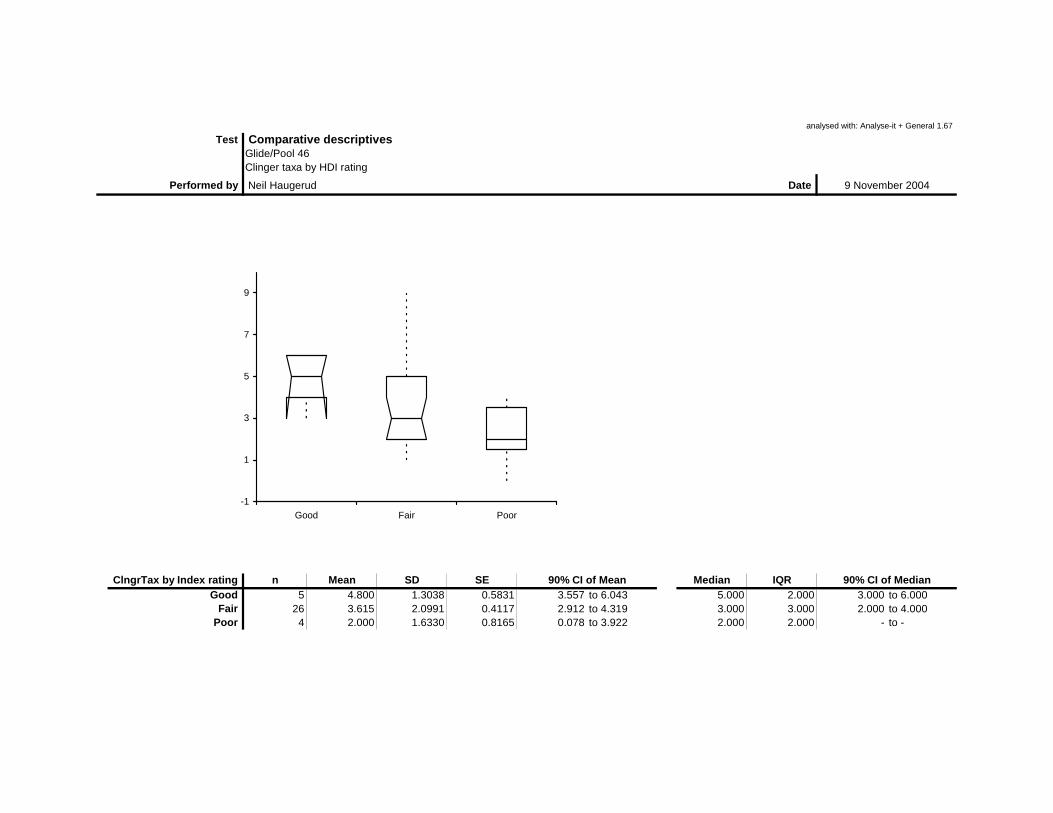
Test Comparative descriptivesGlide/Pool 46Clinger taxa by HDI rating
Performed by Neil Haugerud Date 9 November 2004
ClngrTax by Index rating n Mean SD SE 90% CI of Mean Median IQR 90% CI of MedianGood 5 4.800 1.3038 0.5831 3.557 to 6.043 5.000 2.000 3.000 to 6.000
Fair 26 3.615 2.0991 0.4117 2.912 to 4.319 3.000 3.000 2.000 to 4.000Poor 4 2.000 1.6330 0.8165 0.078 to 3.922 2.000 2.000 - to -
-1
1
3
5
7
9
Good Fair Poor

analysed with: Analyse-it + General 1.67
Test Comparative descriptivesGlide/Pool 46Percent Coleoptera by HDI rating
Performed by Neil Haugerud Date 9 November 2004
ColeoPct by Index rating n Mean SD SE 90% CI of Mean Median IQR 90% CI of MedianGood 5 7.887 5.3681 2.4007 2.769 to 13.004 6.906 9.351 2.658 to 14.458
Fair 26 5.401 8.3440 1.6364 2.605 to 8.196 2.225 6.586 0.744 to 7.075Poor 4 5.707 7.0137 3.5068 -2.546 to 13.960 3.582 11.808 - to -
-10
0
10
20
30
40
Good Fair Poor

analysed with: Analyse-it + General 1.67
Test Comparative descriptivesGlide/Pool 46Coleoptera taxa by HDI rating
Performed by Neil Haugerud Date 9 November 2004
ColeoTax by Index rating n Mean SD SE 90% CI of Mean Median IQR 90% CI of MedianGood 5 5.800 3.2711 1.4629 2.681 to 8.919 4.000 3.000 3.000 to 11.000
Fair 26 3.846 3.6845 0.7226 2.612 to 5.080 3.000 4.000 1.000 to 4.000Poor 4 1.500 1.2910 0.6455 -0.019 to 3.019 1.500 2.000 - to -
-4
-2
0
2
4
6
8
10
12
14
Good Fair Poor
analysed with: Analyse-it + General 1.67
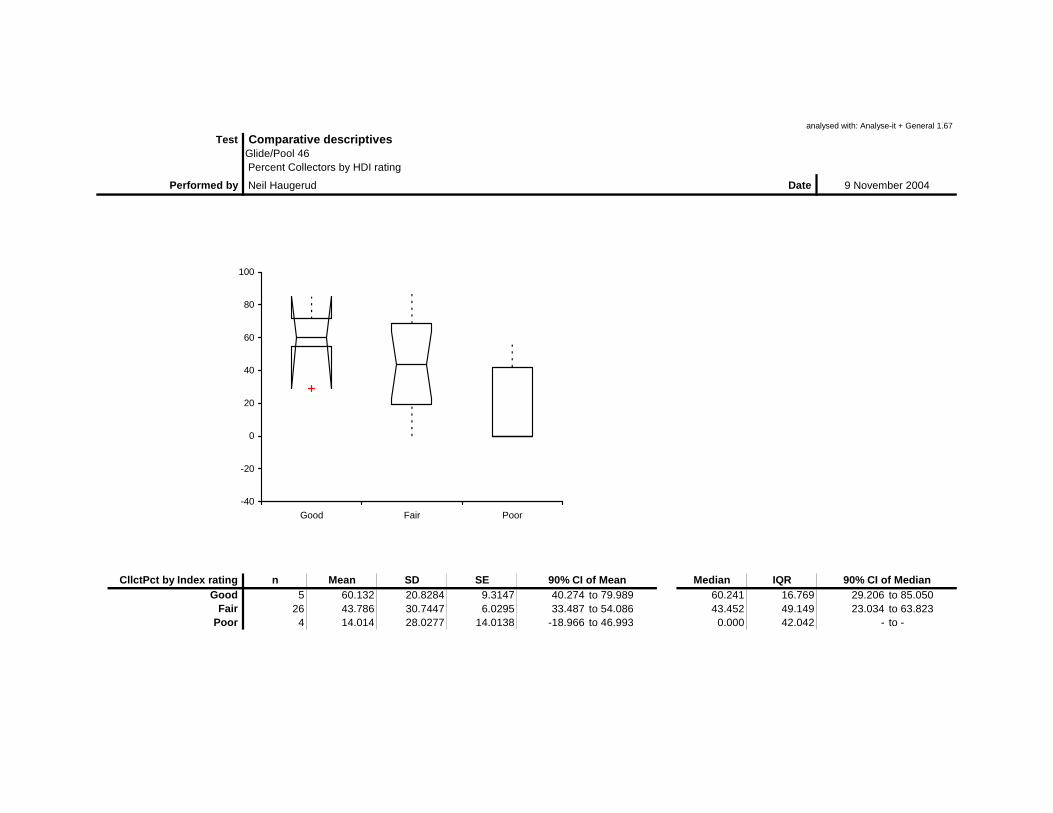
Test Comparative descriptivesGlide/Pool 46 Percent Collectors by HDI rating
Performed by Neil Haugerud Date 9 November 2004
CllctPct by Index rating n Mean SD SE 90% CI of Mean Median IQR 90% CI of MedianGood 5 60.132 20.8284 9.3147 40.274 to 79.989 60.241 16.769 29.206 to 85.050
Fair 26 43.786 30.7447 6.0295 33.487 to 54.086 43.452 49.149 23.034 to 63.823Poor 4 14.014 28.0277 14.0138 -18.966 to 46.993 0.000 42.042 - to -
-40
-20
0
20
40
60
80
100
Good Fair Poor

analysed with: Analyse-it + General 1.67
Test Comparative descriptivesGlide/Pool 46Collector taxa by HDI rating
Performed by Neil Haugerud Date 9 November 2004
CllctTax by Index rating n Mean SD SE 90% CI of Mean Median IQR 90% CI of MedianGood 5 6.400 2.0736 0.9274 4.423 to 8.377 7.000 2.000 3.000 to 8.000
Fair 26 3.615 2.6844 0.5265 2.716 to 4.515 3.000 3.250 2.000 to 5.000Poor 4 1.250 2.5000 1.2500 -1.692 to 4.192 0.000 3.750 - to -
-4
-2
0
2
4
6
8
10
12
Good Fair Poor
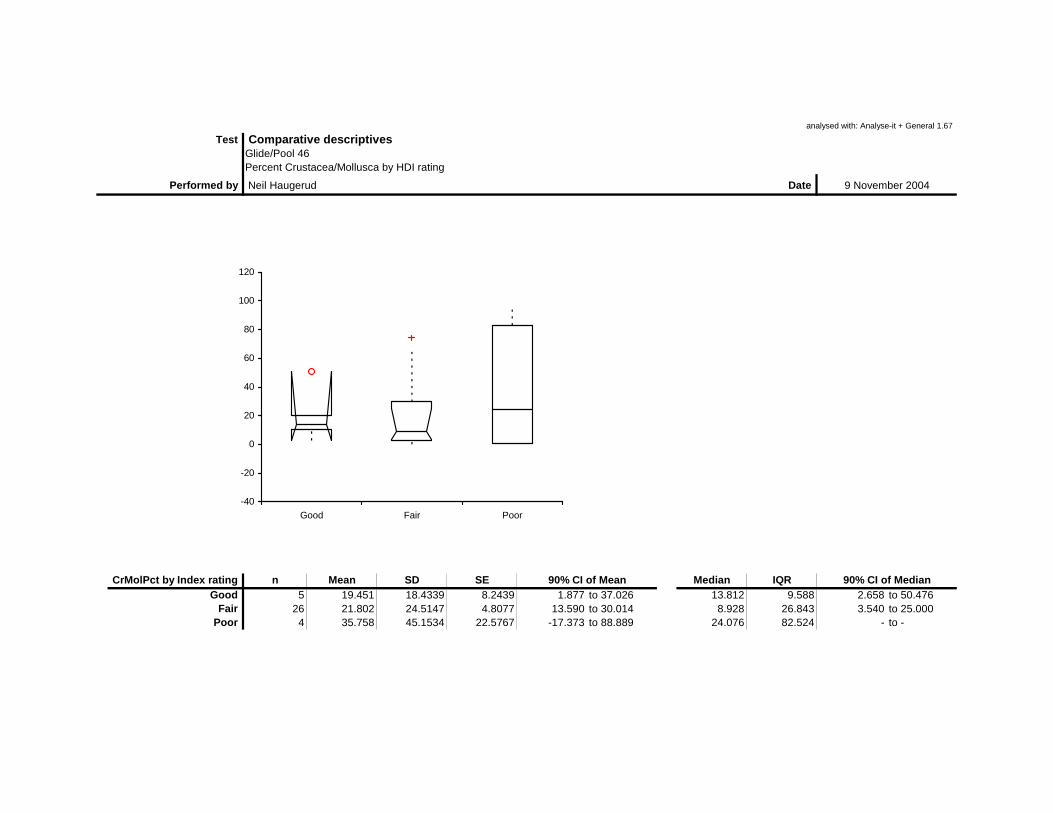
analysed with: Analyse-it + General 1.67
Test Comparative descriptivesGlide/Pool 46Percent Crustacea/Mollusca by HDI rating
Performed by Neil Haugerud Date 9 November 2004
CrMolPct by Index rating n Mean SD SE 90% CI of Mean Median IQR 90% CI of MedianGood 5 19.451 18.4339 8.2439 1.877 to 37.026 13.812 9.588 2.658 to 50.476
Fair 26 21.802 24.5147 4.8077 13.590 to 30.014 8.928 26.843 3.540 to 25.000Poor 4 35.758 45.1534 22.5767 -17.373 to 88.889 24.076 82.524 - to -
-40
-20
0
20
40
60
80
100
120
Good Fair Poor

analysed with: Analyse-it + General 1.67
Test Comparative descriptivesGlide/Pool 46Crustacea and Mollusca taxa by HDI rating
Performed by Neil Haugerud Date 9 November 2004
CrMolTax by Index rating n Mean SD SE 90% CI of Mean Median IQR 90% CI of MedianGood 5 3.400 1.5166 0.6782 1.954 to 4.846 4.000 1.000 1.000 to 5.000
Fair 26 2.923 1.7871 0.3505 2.324 to 3.522 3.000 3.250 2.000 to 3.000Poor 4 2.000 1.4142 0.7071 0.336 to 3.664 1.500 2.500 - to -
-1
0
1
2
3
4
5
6
7
Good Fair Poor

analysed with: Analyse-it + General 1.67
Test Comparative descriptivesGlide/Pool 46Percent Diptera by HDI rating
Performed by Neil Haugerud Date 9 November 2004
DipPct by Index rating n Mean SD SE 90% CI of Mean Median IQR 90% CI of MedianGood 5 20.219 27.6130 12.3489 -6.107 to 46.545 5.801 13.097 3.133 to 68.434
Fair 26 3.157 5.5914 1.0966 1.284 to 5.030 0.000 3.956 0.000 to 3.540Poor 4 4.239 8.4775 4.2388 -5.737 to 14.214 0.000 12.716 - to -
-30
-20
-10
0
10
20
30
40
50
60
70
Good Fair Poor
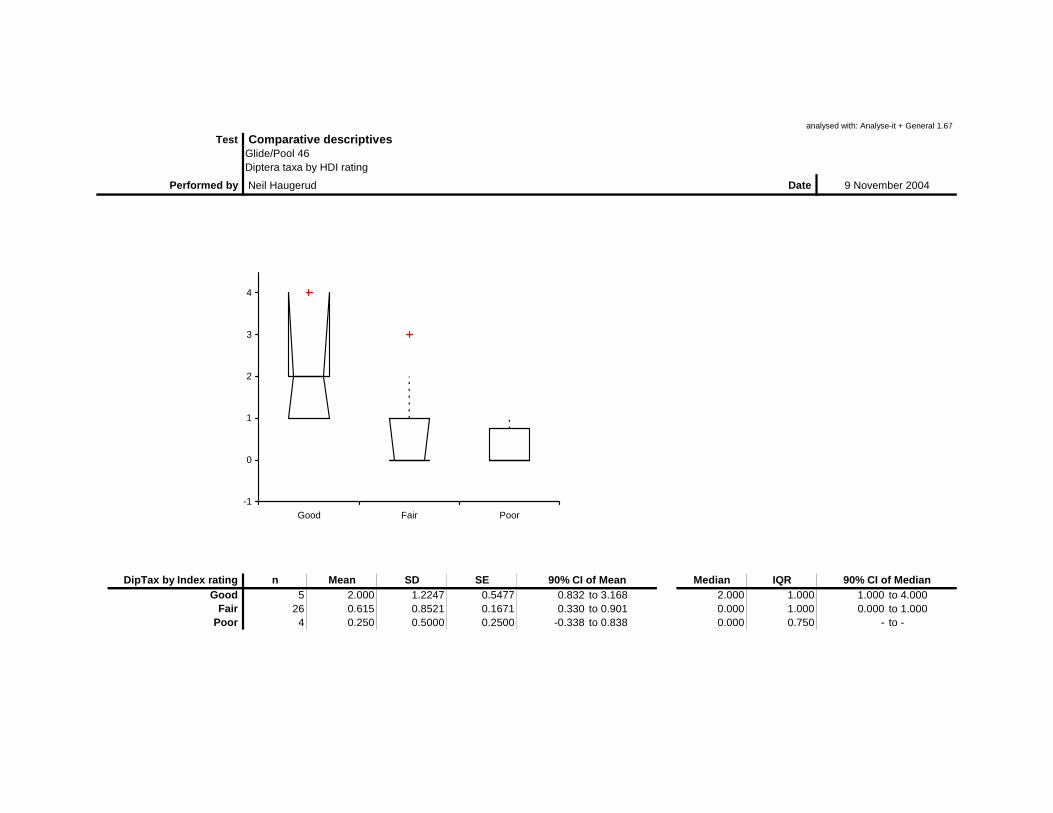
analysed with: Analyse-it + General 1.67
Test Comparative descriptivesGlide/Pool 46Diptera taxa by HDI rating
Performed by Neil Haugerud Date 9 November 2004
DipTax by Index rating n Mean SD SE 90% CI of Mean Median IQR 90% CI of MedianGood 5 2.000 1.2247 0.5477 0.832 to 3.168 2.000 1.000 1.000 to 4.000
Fair 26 0.615 0.8521 0.1671 0.330 to 0.901 0.000 1.000 0.000 to 1.000Poor 4 0.250 0.5000 0.2500 -0.338 to 0.838 0.000 0.750 - to -
-1
0
1
2
3
4
Good Fair Poor
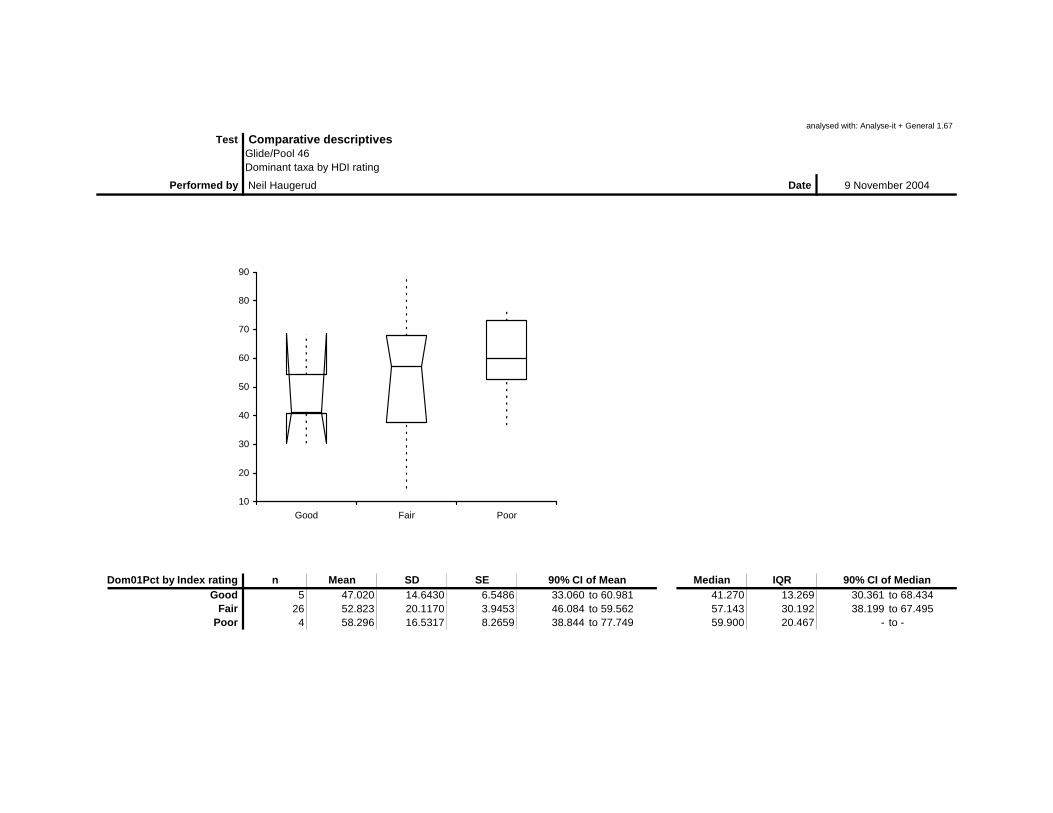
analysed with: Analyse-it + General 1.67
Test Comparative descriptivesGlide/Pool 46Dominant taxa by HDI rating
Performed by Neil Haugerud Date 9 November 2004
Dom01Pct by Index rating n Mean SD SE 90% CI of Mean Median IQR 90% CI of MedianGood 5 47.020 14.6430 6.5486 33.060 to 60.981 41.270 13.269 30.361 to 68.434
Fair 26 52.823 20.1170 3.9453 46.084 to 59.562 57.143 30.192 38.199 to 67.495Poor 4 58.296 16.5317 8.2659 38.844 to 77.749 59.900 20.467 - to -
10
20
30
40
50
60
70
80
90
Good Fair Poor

analysed with: Analyse-it + General 1.67
Test Comparative descriptivesGlide/Pool 46Percent Ephemeroptera by HDI rating
Performed by Neil Haugerud Date 9 November 2004
EphemPct by Index rating n Mean SD SE 90% CI of Mean Median IQR 90% CI of MedianGood 5 9.175 9.0375 4.0417 0.559 to 17.792 9.880 11.276 0.253 to 22.259
Fair 26 5.409 10.1445 1.9895 2.010 to 8.807 0.426 6.353 0.000 to 5.676Poor 4 5.565 7.9121 3.9560 -3.745 to 14.875 2.652 13.641 - to -
-20
-10
0
10
20
30
40
50
Good Fair Poor

analysed with: Analyse-it + General 1.67
Test Comparative descriptivesGlide/Pool 46 Percent Ephemeroptera, Plecoptera and Trichoptera by HDI rating
Performed by Neil Haugerud Date 9 November 2004
EPTPct by Index rating n Mean SD SE 90% CI of Mean Median IQR 90% CI of MedianGood 5 9.905 9.4580 4.2297 0.888 to 18.922 11.325 12.228 0.505 to 23.256
Fair 26 7.526 12.4135 2.4345 3.367 to 11.684 0.823 9.151 0.000 to 7.778Poor 4 5.665 7.8268 3.9134 -3.545 to 14.875 2.853 13.339 - to -
-20
-10
0
10
20
30
40
50
60
Good Fair Poor
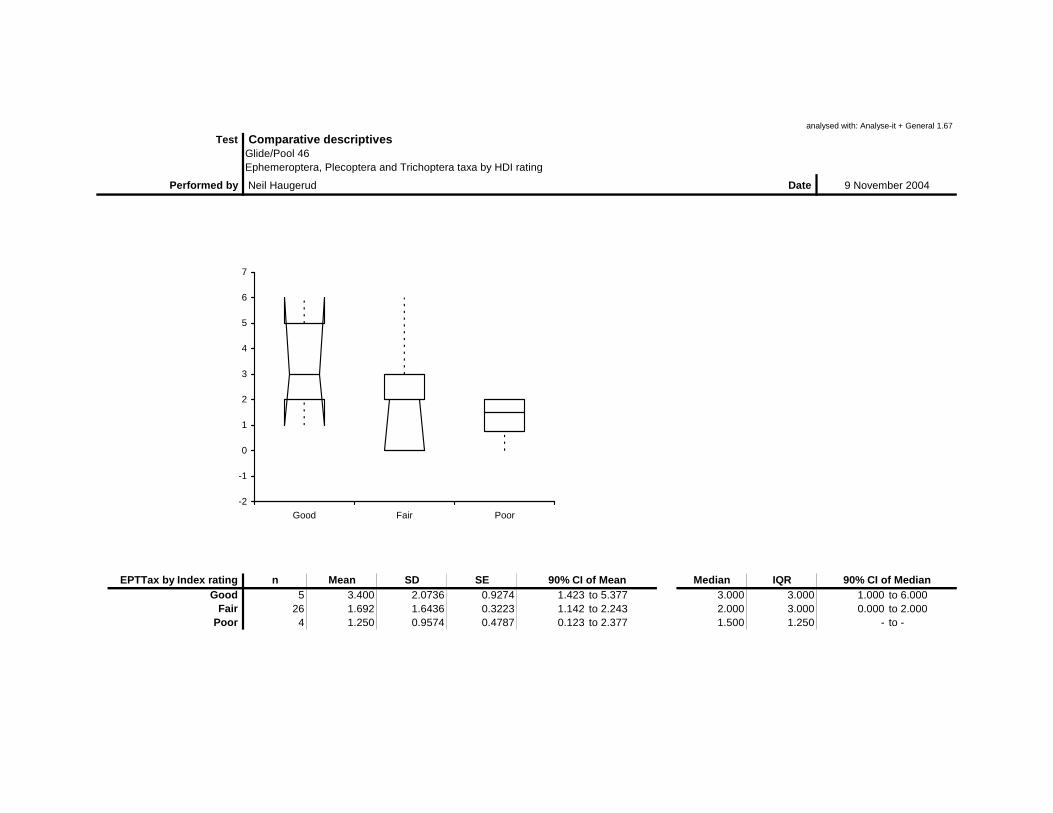
analysed with: Analyse-it + General 1.67
Test Comparative descriptivesGlide/Pool 46Ephemeroptera, Plecoptera and Trichoptera taxa by HDI rating
Performed by Neil Haugerud Date 9 November 2004
EPTTax by Index rating n Mean SD SE 90% CI of Mean Median IQR 90% CI of MedianGood 5 3.400 2.0736 0.9274 1.423 to 5.377 3.000 3.000 1.000 to 6.000
Fair 26 1.692 1.6436 0.3223 1.142 to 2.243 2.000 3.000 0.000 to 2.000Poor 4 1.250 0.9574 0.4787 0.123 to 2.377 1.500 1.250 - to -
-2
-1
0
1
2
3
4
5
6
7
Good Fair Poor
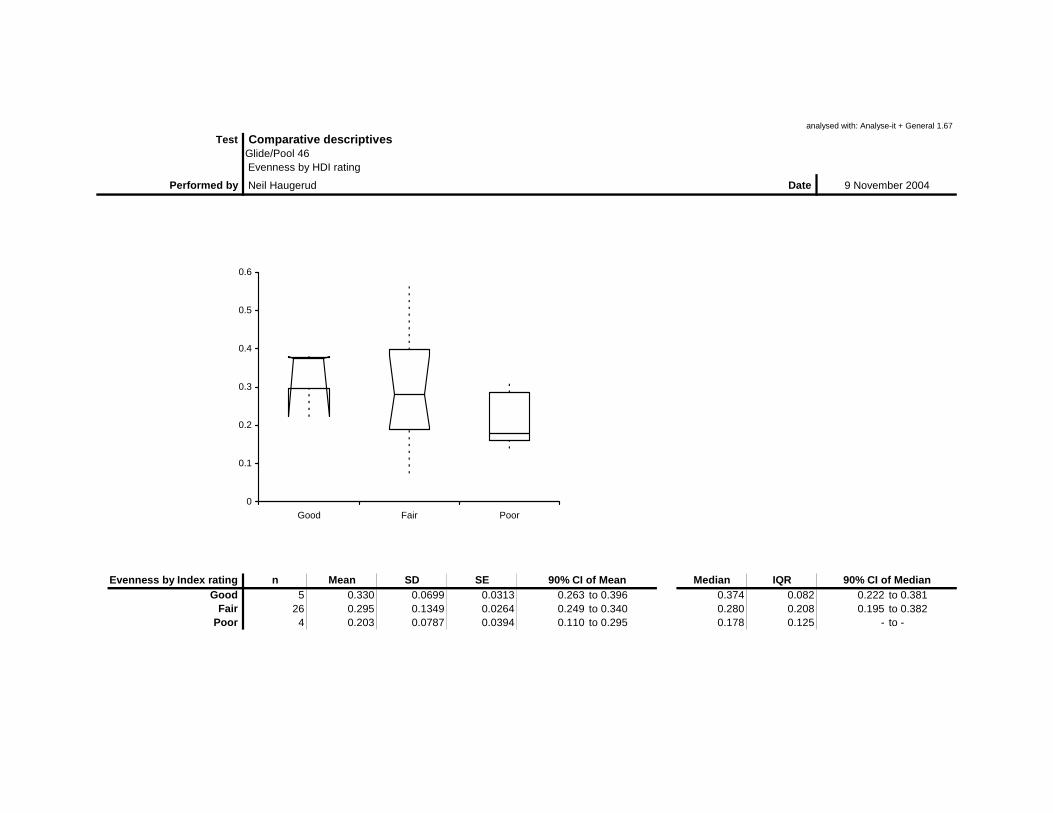
analysed with: Analyse-it + General 1.67
Test Comparative descriptivesGlide/Pool 46 Evenness by HDI rating
Performed by Neil Haugerud Date 9 November 2004
Evenness by Index rating n Mean SD SE 90% CI of Mean Median IQR 90% CI of MedianGood 5 0.330 0.0699 0.0313 0.263 to 0.396 0.374 0.082 0.222 to 0.381
Fair 26 0.295 0.1349 0.0264 0.249 to 0.340 0.280 0.208 0.195 to 0.382Poor 4 0.203 0.0787 0.0394 0.110 to 0.295 0.178 0.125 - to -
0
0.1
0.2
0.3
0.4
0.5
0.6
Good Fair Poor

analysed with: Analyse-it + General 1.67
Test Comparative descriptivesGlide/Pool 46 Percent Filterers by HDI rating
Performed by Neil Haugerud Date 9 November 2004
FiltrPct by Index rating n Mean SD SE 90% CI of Mean Median IQR 90% CI of MedianGood 5 2.213 2.4843 1.1110 -0.156 to 4.581 1.329 4.762 0.000 to 4.972
Fair 26 3.548 10.2040 2.0012 0.129 to 6.966 0.000 0.601 0.000 to 0.070Poor 4 10.318 19.9217 9.9608 -13.124 to 33.759 0.537 30.144 - to -
-30
-20
-10
0
10
20
30
40
50
Good Fair Poor
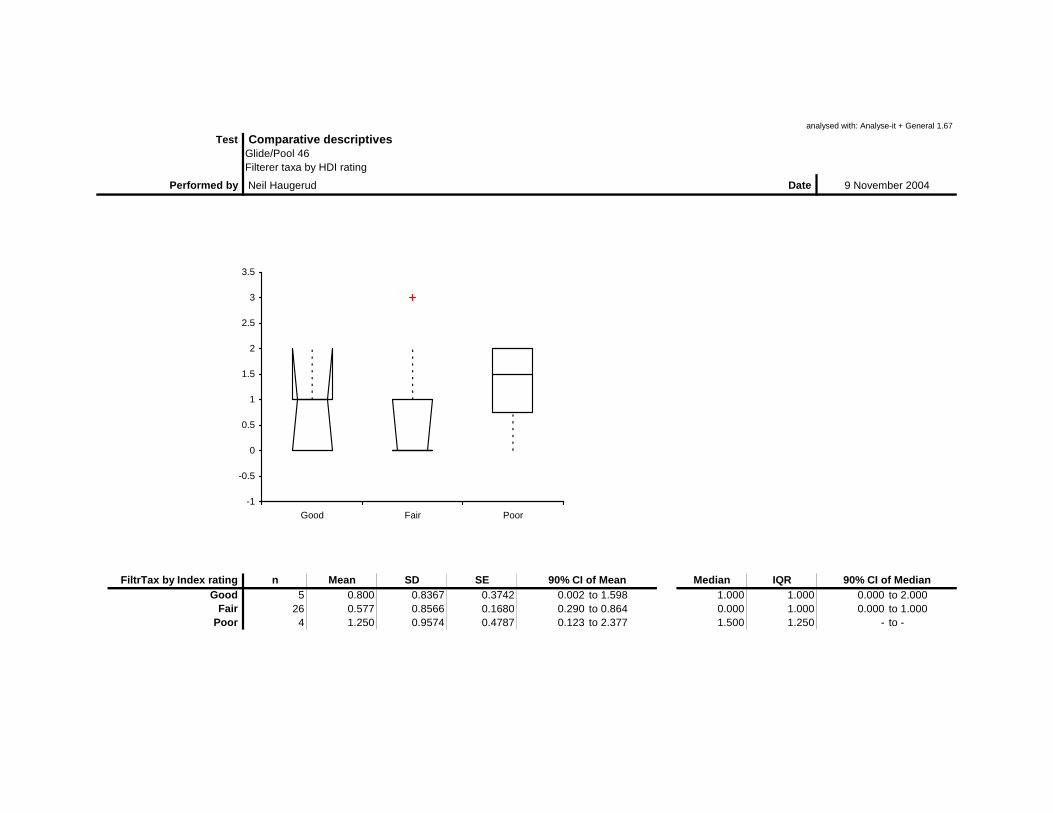
analysed with: Analyse-it + General 1.67
Test Comparative descriptivesGlide/Pool 46Filterer taxa by HDI rating
Performed by Neil Haugerud Date 9 November 2004
FiltrTax by Index rating n Mean SD SE 90% CI of Mean Median IQR 90% CI of MedianGood 5 0.800 0.8367 0.3742 0.002 to 1.598 1.000 1.000 0.000 to 2.000
Fair 26 0.577 0.8566 0.1680 0.290 to 0.864 0.000 1.000 0.000 to 1.000Poor 4 1.250 0.9574 0.4787 0.123 to 2.377 1.500 1.250 - to -
-1
-0.5
0
0.5
1
1.5
2
2.5
3
3.5
Good Fair Poor

analysed with: Analyse-it + General 1.67
Test Comparative descriptivesGlide/Pool 46Percent Gastropoda by HDI rating
Performed by Neil Haugerud Date 9 November 2004
GastrPct by Index rating n Mean SD SE 90% CI of Mean Median IQR 90% CI of MedianGood 5 17.143 19.1095 8.5460 -1.076 to 35.362 8.840 14.889 2.658 to 49.206
Fair 26 21.418 24.1820 4.7425 13.318 to 29.519 8.928 25.769 3.540 to 25.000Poor 4 24.495 29.1937 14.5969 -9.856 to 58.847 20.069 53.417 - to -
-30
-10
10
30
50
70
Good Fair Poor
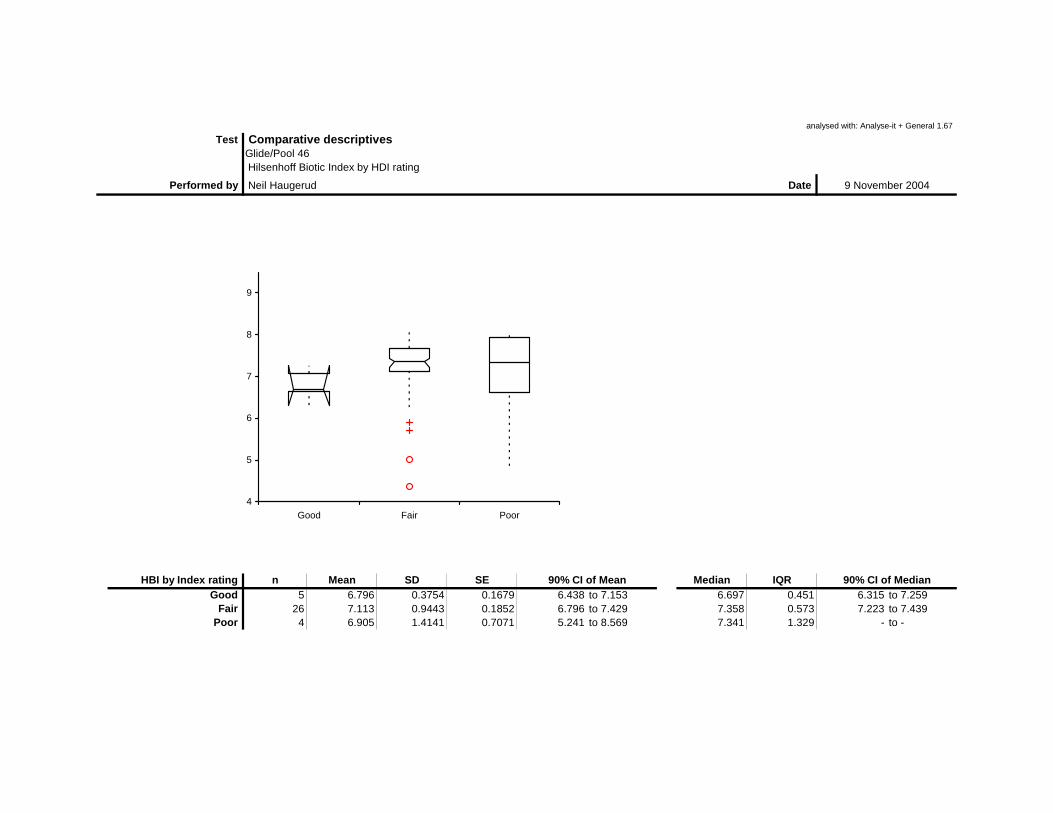
analysed with: Analyse-it + General 1.67
Test Comparative descriptivesGlide/Pool 46 Hilsenhoff Biotic Index by HDI rating
Performed by Neil Haugerud Date 9 November 2004
HBI by Index rating n Mean SD SE 90% CI of Mean Median IQR 90% CI of MedianGood 5 6.796 0.3754 0.1679 6.438 to 7.153 6.697 0.451 6.315 to 7.259
Fair 26 7.113 0.9443 0.1852 6.796 to 7.429 7.358 0.573 7.223 to 7.439Poor 4 6.905 1.4141 0.7071 5.241 to 8.569 7.341 1.329 - to -
4
5
6
7
8
9
Good Fair Poor

analysed with: Analyse-it + General 1.67
Test Comparative descriptivesGlide/Pool 46Percent Intolerant by HDI rating
Performed by Neil Haugerud Date 9 November 2004
IntolPct by Index rating n Mean SD SE 90% CI of Mean Median IQR 90% CI of MedianGood 5 2.675 3.7577 1.6805 -0.907 to 6.258 0.253 4.819 0.000 to 8.306
Fair 26 2.155 9.7735 1.9167 -1.119 to 5.429 0.000 0.067 0.000 to 0Poor 4 15.319 30.6373 15.3186 -20.732 to 51.369 0.000 45.956 - to -
-40
-20
0
20
40
60
80
Good Fair Poor

analysed with: Analyse-it + General 1.67
Test Comparative descriptivesGlide/Pool 46Intolerant taxa by HDI rating
Performed by Neil Haugerud Date 9 November 2004
IntolTax by Index rating n Mean SD SE 90% CI of Mean Median IQR 90% CI of MedianGood 5 0.800 0.8367 0.3742 0.002 to 1.598 1.000 1.000 0.000 to 2.000
Fair 26 0.423 0.8086 0.1586 0.152 to 0.694 0.000 0.250 0.000 to 0Poor 4 0.500 1.0000 0.5000 -0.677 to 1.677 0.000 1.500 - to -
-1.5
-1
-0.5
0
0.5
1
1.5
2
2.5
3
3.5
Good Fair Poor

analysed with: Analyse-it + General 1.67
Test Comparative descriptivesGlide/Pool 46 Margalef's Index by HDI rating
Performed by Neil Haugerud Date 9 November 2004
D_Mg by Index rating n Mean SD SE 90% CI of Mean Median IQR 90% CI of MedianGood 5 3.919 0.9240 0.4132 3.038 to 4.800 3.981 1.573 2.979 to 5.041
Fair 26 2.738 1.3810 0.2708 2.275 to 3.200 2.455 1.457 1.865 to 3.090Poor 4 1.331 0.5713 0.2857 0.659 to 2.003 1.227 0.829 - to -
0
1
2
3
4
5
6
Good Fair Poor

analysed with: Analyse-it + General 1.67
Test Comparative descriptivesGlide/Pool 46Percent Multivoltine taxa by HDI rating
Performed by Neil Haugerud Date 9 November 2004
MltVolPct by Index rating n Mean SD SE 90% CI of Mean Median IQR 90% CI of MedianGood 5 40.195 28.8617 12.9074 12.678 to 67.711 50.120 32.457 4.798 to 77.409
Fair 26 44.050 31.5554 6.1885 33.480 to 54.621 36.901 56.016 19.597 to 71.212Poor 4 23.804 17.8840 8.9420 2.760 to 44.847 28.029 23.686 - to -
-20
0
20
40
60
80
100
Good Fair Poor

analysed with: Analyse-it + General 1.67
Test Comparative descriptivesGlide/Pool 46Percent Non-Insect by HDI rating
Performed by Neil Haugerud Date 9 November 2004
NonInPct by Index rating n Mean SD SE 90% CI of Mean Median IQR 90% CI of MedianGood 5 48.930 14.5467 6.5055 35.062 to 62.799 53.016 10.188 24.495 to 61.050
Fair 26 62.328 27.7392 5.4401 53.035 to 71.620 72.245 37.882 47.558 to 78.571Poor 4 39.333 46.6012 23.3006 -15.502 to 94.167 31.225 85.296 - to -
-40
-20
0
20
40
60
80
100
120
Good Fair Poor

analysed with: Analyse-it + General 1.67
Test Comparative descriptivesGlide/Pool 46Percent Odonata by HDI rating
Performed by Neil Haugerud Date 9 November 2004
OdonPct by Index rating n Mean SD SE 90% CI of Mean Median IQR 90% CI of MedianGood 5 1.471 1.6889 0.7553 -0.140 to 3.081 0.758 0.605 0.241 to 4.420
Fair 26 4.343 8.3744 1.6424 1.537 to 7.148 1.614 3.686 0.295 to 3.030Poor 4 0.123 0.2451 0.1225 -0.166 to 0.411 0.000 0.368 - to -
-10
-5
0
5
10
15
20
25
30
35
40
Good Fair Poor

analysed with: Analyse-it + General 1.67
Test Comparative descriptivesGlide/Pool 46 Percent Predators by HDI rating
Performed by Neil Haugerud Date 9 November 2004
PredPct by Index rating n Mean SD SE 90% CI of Mean Median IQR 90% CI of MedianGood 5 16.274 10.2457 4.5820 6.505 to 26.042 11.296 17.935 6.818 to 28.177
Fair 26 23.692 21.5163 4.2197 16.484 to 30.900 17.315 14.533 12.399 to 26.415Poor 4 10.346 11.0556 5.5278 -2.663 to 23.355 8.897 19.919 - to -
-20
0
20
40
60
80
100
Good Fair Poor
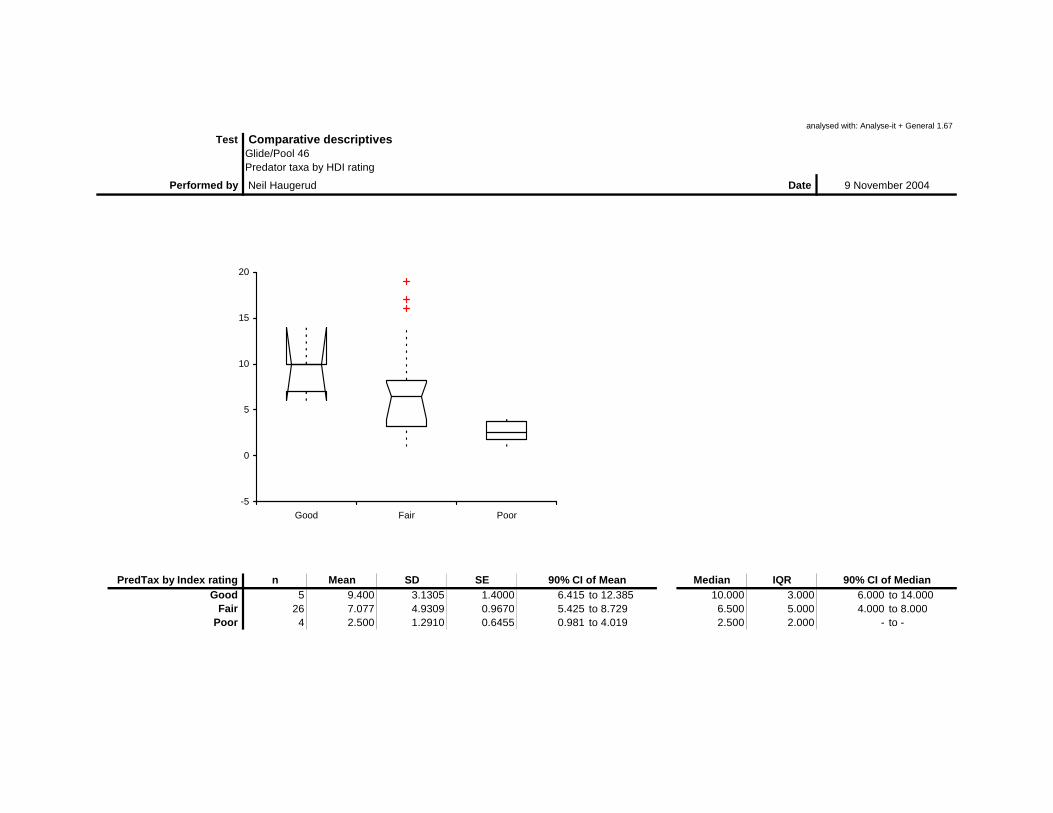
analysed with: Analyse-it + General 1.67
Test Comparative descriptivesGlide/Pool 46Predator taxa by HDI rating
Performed by Neil Haugerud Date 9 November 2004
PredTax by Index rating n Mean SD SE 90% CI of Mean Median IQR 90% CI of MedianGood 5 9.400 3.1305 1.4000 6.415 to 12.385 10.000 3.000 6.000 to 14.000
Fair 26 7.077 4.9309 0.9670 5.425 to 8.729 6.500 5.000 4.000 to 8.000Poor 4 2.500 1.2910 0.6455 0.981 to 4.019 2.500 2.000 - to -
-5
0
5
10
15
20
Good Fair Poor

analysed with: Analyse-it + General 1.67
Test Comparative descriptivesGlide/Pool 46 Percent Scrapers by HDI rating
Performed by Neil Haugerud Date 9 November 2004
ScrapPct by Index rating n Mean SD SE 90% CI of Mean Median IQR 90% CI of MedianGood 5 15.649 20.5699 9.1991 -3.963 to 35.260 5.301 17.463 0.664 to 49.841
Fair 26 21.670 24.6024 4.8249 13.428 to 29.912 8.928 26.045 4.012 to 25.000Poor 4 24.963 29.6461 14.8231 -9.921 to 59.847 20.270 54.219 - to -
-30
-10
10
30
50
70
Good Fair Poor

analysed with: Analyse-it + General 1.67
Test Comparative descriptivesGlide/Pool 46Scraper taxa by HDI rating
Performed by Neil Haugerud Date 9 November 2004
ScrapTax by Index rating n Mean SD SE 90% CI of Mean Median IQR 90% CI of MedianGood 5 3.000 1.5811 0.7071 1.493 to 4.507 3.000 2.000 1.000 to 5.000
Fair 26 2.577 1.4744 0.2892 2.083 to 3.071 2.000 2.250 2.000 to 3.000Poor 4 1.500 1.2910 0.6455 -0.019 to 3.019 1.500 2.000 - to -
-1
0
1
2
3
4
5
6
7
Good Fair Poor
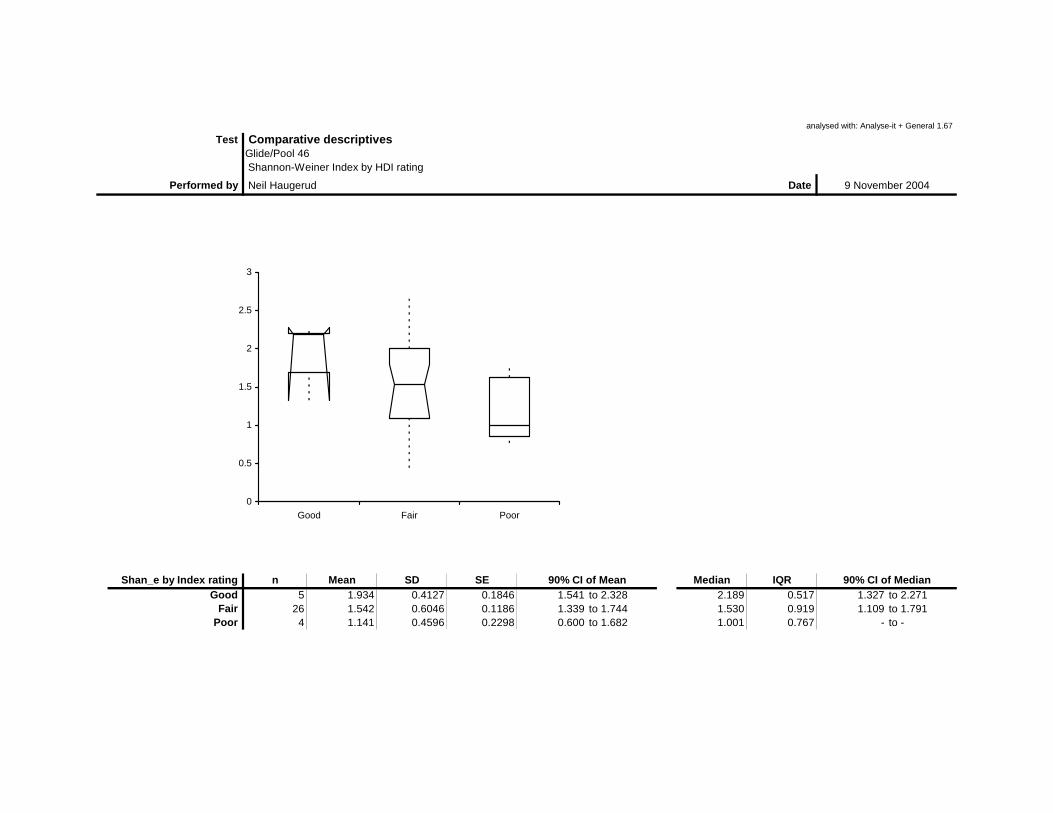
analysed with: Analyse-it + General 1.67
Test Comparative descriptivesGlide/Pool 46 Shannon-Weiner Index by HDI rating
Performed by Neil Haugerud Date 9 November 2004
Shan_e by Index rating n Mean SD SE 90% CI of Mean Median IQR 90% CI of MedianGood 5 1.934 0.4127 0.1846 1.541 to 2.328 2.189 0.517 1.327 to 2.271
Fair 26 1.542 0.6046 0.1186 1.339 to 1.744 1.530 0.919 1.109 to 1.791Poor 4 1.141 0.4596 0.2298 0.600 to 1.682 1.001 0.767 - to -
0
0.5
1
1.5
2
2.5
3
Good Fair Poor
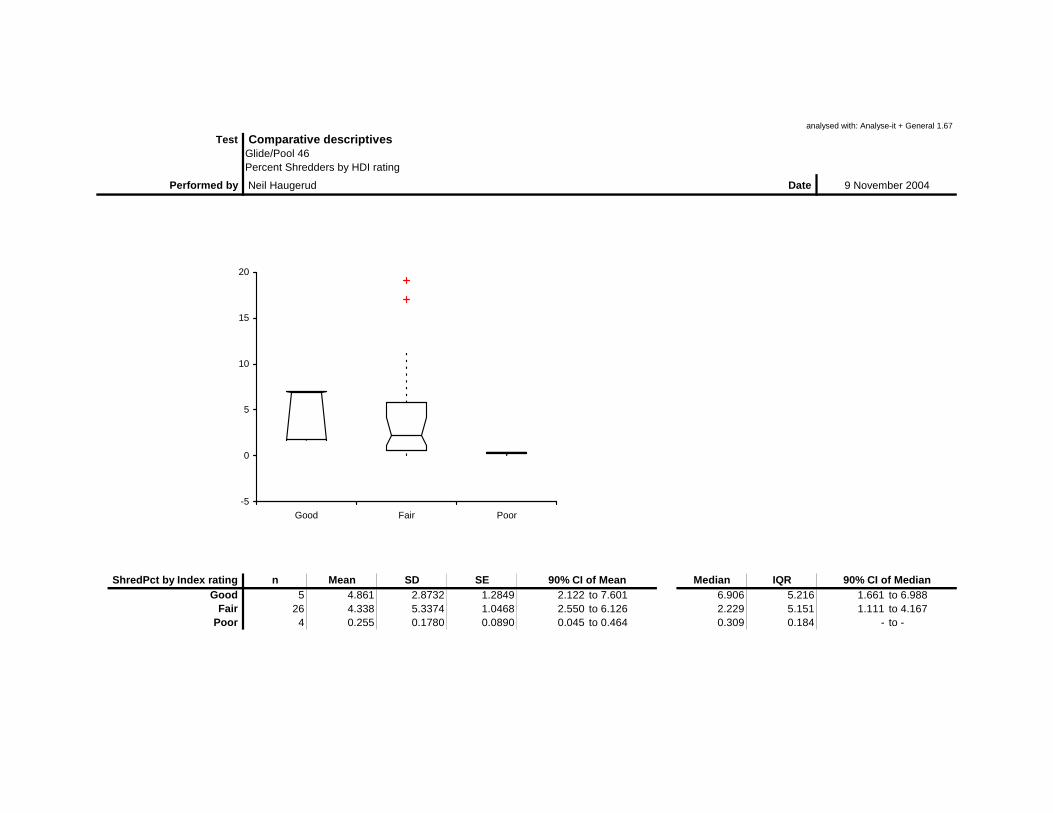
analysed with: Analyse-it + General 1.67
Test Comparative descriptivesGlide/Pool 46Percent Shredders by HDI rating
Performed by Neil Haugerud Date 9 November 2004
ShredPct by Index rating n Mean SD SE 90% CI of Mean Median IQR 90% CI of MedianGood 5 4.861 2.8732 1.2849 2.122 to 7.601 6.906 5.216 1.661 to 6.988
Fair 26 4.338 5.3374 1.0468 2.550 to 6.126 2.229 5.151 1.111 to 4.167Poor 4 0.255 0.1780 0.0890 0.045 to 0.464 0.309 0.184 - to -
-5
0
5
10
15
20
Good Fair Poor

analysed with: Analyse-it + General 1.67
Test Comparative descriptivesGlide/Pool 46Shredder taxa by HDI rating
Performed by Neil Haugerud Date 9 November 2004
ShredTax by Index rating n Mean SD SE 90% CI of Mean Median IQR 90% CI of MedianGood 5 3.400 1.3416 0.6000 2.121 to 4.679 4.000 2.000 2.000 to 5.000
Fair 26 1.808 1.5753 0.3089 1.280 to 2.335 1.000 1.000 1.000 to 2.000Poor 4 0.750 0.5000 0.2500 0.162 to 1.338 1.000 0.250 - to -
-1
0
1
2
3
4
5
6
7
8
Good Fair Poor
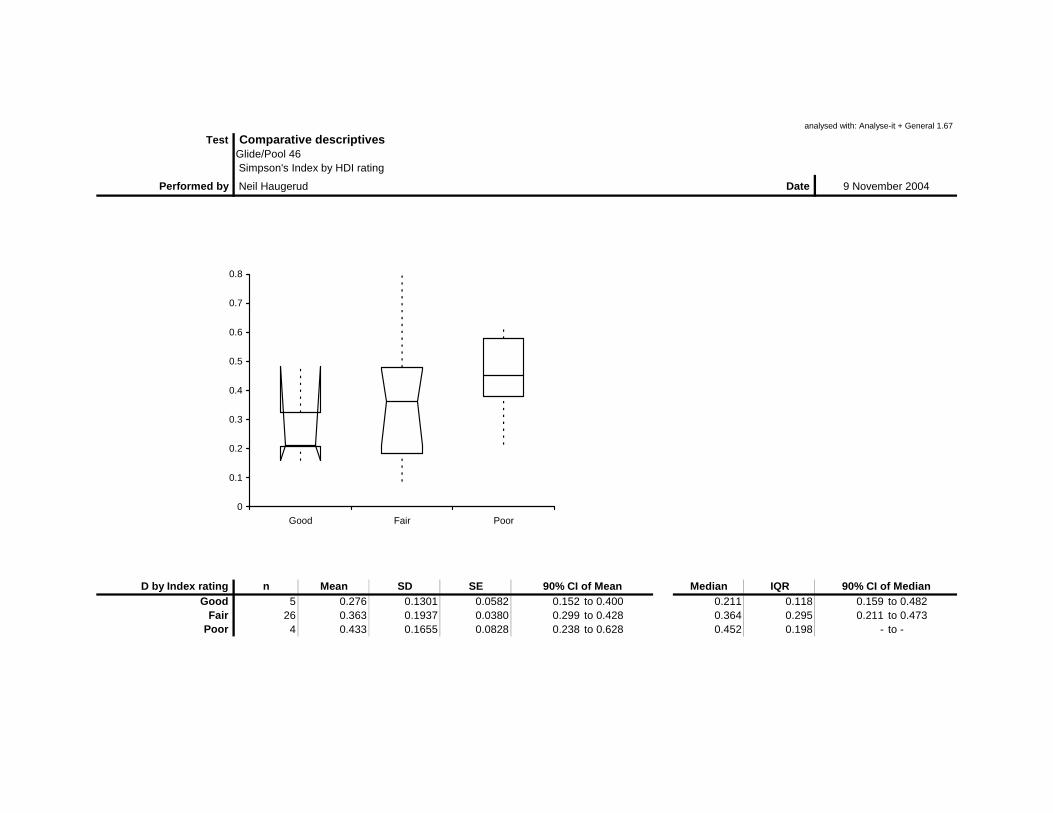
analysed with: Analyse-it + General 1.67
Test Comparative descriptivesGlide/Pool 46 Simpson's Index by HDI rating
Performed by Neil Haugerud Date 9 November 2004
D by Index rating n Mean SD SE 90% CI of Mean Median IQR 90% CI of MedianGood 5 0.276 0.1301 0.0582 0.152 to 0.400 0.211 0.118 0.159 to 0.482
Fair 26 0.363 0.1937 0.0380 0.299 to 0.428 0.364 0.295 0.211 to 0.473Poor 4 0.433 0.1655 0.0828 0.238 to 0.628 0.452 0.198 - to -
0
0.1
0.2
0.3
0.4
0.5
0.6
0.7
0.8
Good Fair Poor

analysed with: Analyse-it + General 1.67
Test Comparative descriptivesGlide/Pool 46Percent Sprawlers by HDI rating
Performed by Neil Haugerud Date 9 November 2004
SprwlPct by Index rating n Mean SD SE 90% CI of Mean Median IQR 90% CI of MedianGood 5 1.941 2.0691 0.9253 -0.032 to 3.914 1.905 1.488 0.000 to 5.301
Fair 26 1.256 2.6280 0.5154 0.376 to 2.137 0.000 0.365 0.000 to 0.295Poor 4 4.239 8.4775 4.2388 -5.737 to 14.214 0.000 12.716 - to -
-10
-5
0
5
10
15
20
Good Fair Poor

analysed with: Analyse-it + General 1.67
Test Comparative descriptivesGlide/Pool 46Sprawler taxa by HDI rating
Performed by Neil Haugerud Date 9 November 2004
SprwlTax by Index rating n Mean SD SE 90% CI of Mean Median IQR 90% CI of MedianGood 5 1.400 0.8944 0.4000 0.547 to 2.253 2.000 1.000 0.000 to 2.000
Fair 26 0.731 1.1509 0.2257 0.345 to 1.116 0.000 1.000 0.000 to 1.000Poor 4 0.250 0.5000 0.2500 -0.338 to 0.838 0.000 0.750 - to -
-2
-1
0
1
2
3
4
5
Good Fair Poor
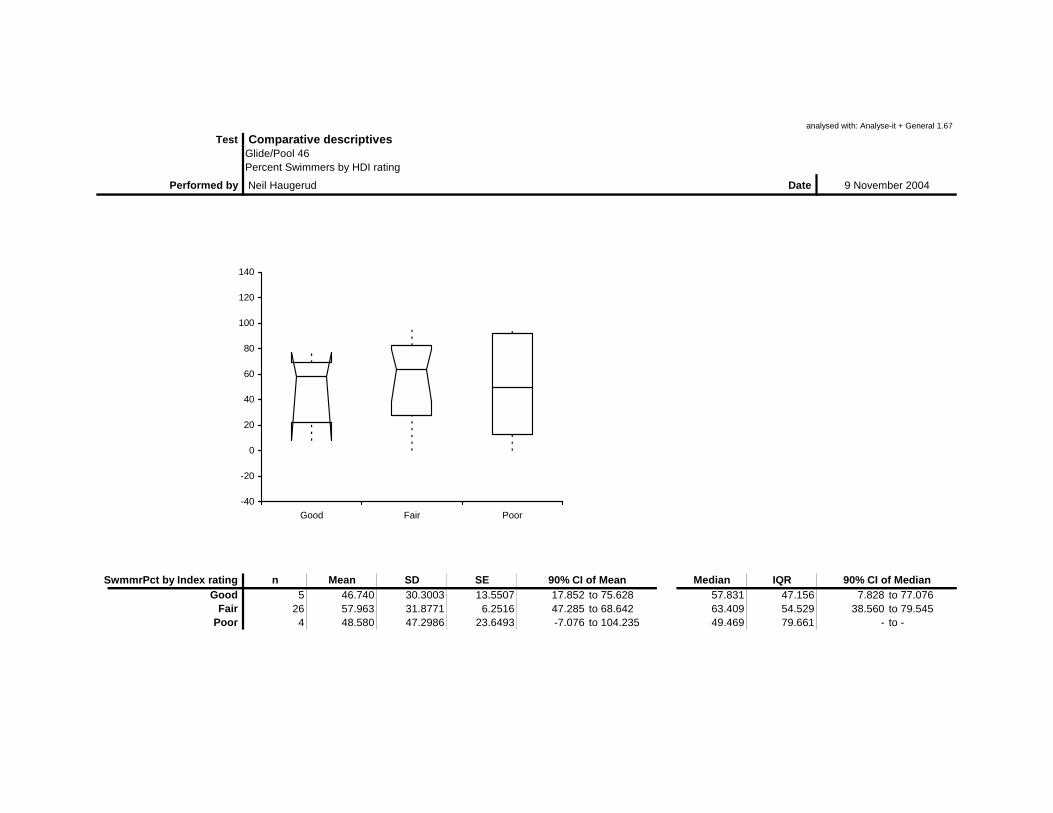
analysed with: Analyse-it + General 1.67
Test Comparative descriptivesGlide/Pool 46Percent Swimmers by HDI rating
Performed by Neil Haugerud Date 9 November 2004
SwmmrPct by Index rating n Mean SD SE 90% CI of Mean Median IQR 90% CI of MedianGood 5 46.740 30.3003 13.5507 17.852 to 75.628 57.831 47.156 7.828 to 77.076
Fair 26 57.963 31.8771 6.2516 47.285 to 68.642 63.409 54.529 38.560 to 79.545Poor 4 48.580 47.2986 23.6493 -7.076 to 104.235 49.469 79.661 - to -
-40
-20
0
20
40
60
80
100
120
140
Good Fair Poor

analysed with: Analyse-it + General 1.67
Test Comparative descriptivesGlide/Pool 46Swimmer taxa by HDI rating
Performed by Neil Haugerud Date 9 November 2004
SwmmrTax by Index rating n Mean SD SE 90% CI of Mean Median IQR 90% CI of MedianGood 5 9.000 2.1213 0.9487 6.978 to 11.022 9.000 3.000 7.000 to 12.000
Fair 26 6.538 4.2542 0.8343 5.113 to 7.964 6.500 5.000 5.000 to 8.000Poor 4 2.750 2.2174 1.1087 0.141 to 5.359 3.000 3.250 - to -
-2
0
2
4
6
8
10
12
14
16
Good Fair Poor

analysed with: Analyse-it + General 1.67
Test Comparative descriptivesGlide/Pool 46Percent Tolerant by HDI rating
Performed by Neil Haugerud Date 9 November 2004
TolerPct by Index rating n Mean SD SE 90% CI of Mean Median IQR 90% CI of MedianGood 5 48.556 14.8354 6.6346 34.413 to 62.700 53.333 16.876 26.010 to 62.707
Fair 26 63.480 26.3609 5.1698 54.649 to 72.310 70.537 26.801 63.208 to 76.515Poor 4 62.000 17.8699 8.9350 40.973 to 83.027 67.063 19.672 - to -
0
20
40
60
80
100
120
Good Fair Poor

analysed with: Analyse-it + General 1.67
Test Comparative descriptivesGlide/Pool 46Tolerant taxa by HDI rating
Performed by Neil Haugerud Date 9 November 2004
TolerTax by Index rating n Mean SD SE 90% CI of Mean Median IQR 90% CI of MedianGood 5 8.000 2.7386 1.2247 5.389 to 10.611 8.000 3.000 4.000 to 11.000
Fair 26 6.769 3.9730 0.7792 5.438 to 8.100 6.000 5.000 4.000 to 8.000Poor 4 2.750 1.7078 0.8539 0.740 to 4.760 2.500 2.750 - to -
-2
0
2
4
6
8
10
12
14
16
Good Fair Poor

analysed with: Analyse-it + General 1.67
Test Comparative descriptivesGlide/Pool 46Total taxa by HDI rating
Performed by Neil Haugerud Date 9 November 2004
TotalTax by Index rating n Mean SD SE 90% CI of Mean Median IQR 90% CI of MedianGood 5 24.000 5.3385 2.3875 18.910 to 29.090 25.000 9.000 18.000 to 30.000
Fair 26 16.731 9.8043 1.9228 13.446 to 20.015 15.000 10.250 9.000 to 19.000Poor 4 8.500 3.3166 1.6583 4.597 to 12.403 8.000 4.500 - to -
0
5
10
15
20
25
30
35
40
45
Good Fair Poor
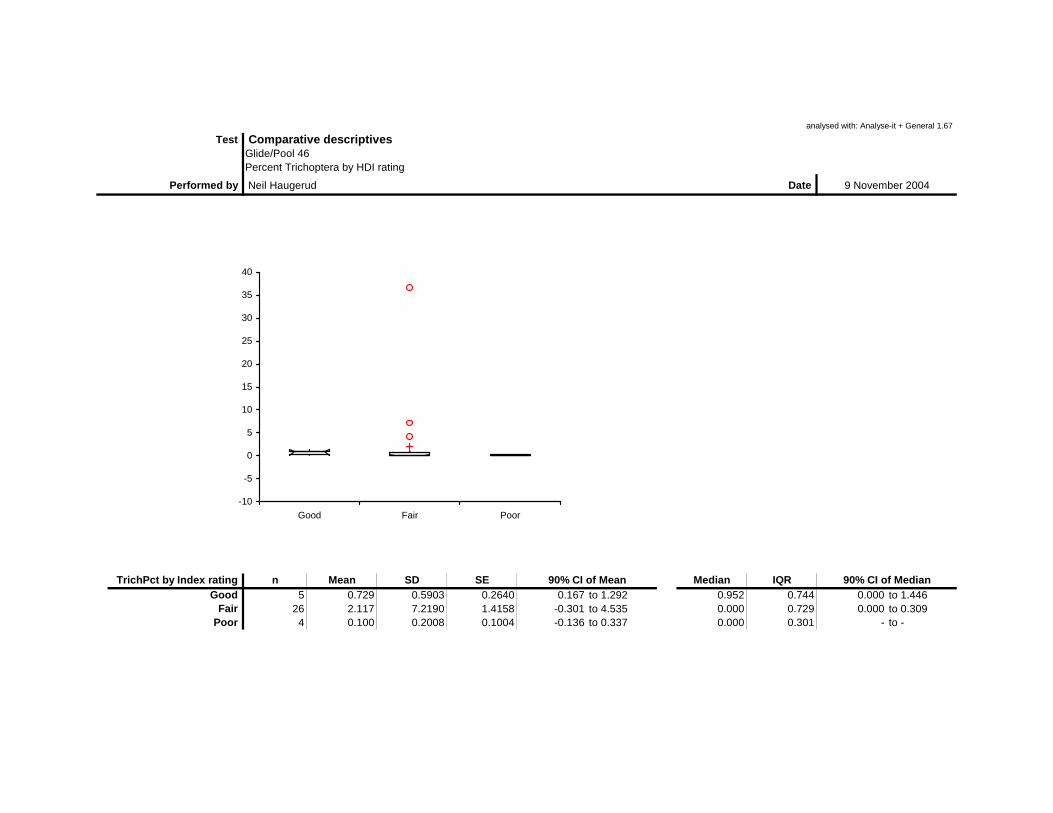
analysed with: Analyse-it + General 1.67
Test Comparative descriptivesGlide/Pool 46Percent Trichoptera by HDI rating
Performed by Neil Haugerud Date 9 November 2004
TrichPct by Index rating n Mean SD SE 90% CI of Mean Median IQR 90% CI of MedianGood 5 0.729 0.5903 0.2640 0.167 to 1.292 0.952 0.744 0.000 to 1.446
Fair 26 2.117 7.2190 1.4158 -0.301 to 4.535 0.000 0.729 0.000 to 0.309Poor 4 0.100 0.2008 0.1004 -0.136 to 0.337 0.000 0.301 - to -
-10
-5
0
5
10
15
20
25
30
35
40
Good Fair Poor

analysed with: Analyse-it + General 1.67
Test Comparative descriptivesGlide/Pool 46Trichoptera taxa by HDI rating
Performed by Neil Haugerud Date 9 November 2004
TrichTax by Index rating n Mean SD SE 90% CI of Mean Median IQR 90% CI of MedianGood 5 1.200 1.0954 0.4899 0.156 to 2.244 1.000 0.000 0.000 to 3.000
Fair 26 0.615 1.0228 0.2006 0.273 to 0.958 0.000 1.000 0.000 to 1.000Poor 4 0.250 0.5000 0.2500 -0.338 to 0.838 0.000 0.750 - to -
-2
-1
0
1
2
3
4
5
Good Fair Poor

analysed with: Analyse-it + General 1.67
Test Comparative descriptivesGlide/Pool 46Percent Univoltine by HDI rating
Performed by Neil Haugerud Date 9 November 2004
UniVolPct by Index rating n Mean SD SE 90% CI of Mean Median IQR 90% CI of MedianGood 5 32.387 17.1971 7.6908 15.991 to 48.783 34.254 24.984 13.889 to 54.921
Fair 26 33.912 26.7495 5.2460 24.951 to 42.873 28.519 34.651 16.804 to 34.957Poor 4 43.000 42.8219 21.4110 -7.387 to 93.388 41.738 75.296 - to -
-40
-20
0
20
40
60
80
100
120
Good Fair Poor

analysed with: Analyse-it + General 1.62
Test Comparative descriptivesRiffle/ Run 46Percent Amphipoda by HDI rating
Performed by Neil Haugerud Date 1 March 2006
AmphPct by Index rating n Mean SD SE 90% CI of Mean Median IQR 90% CI of MedianGood 5 17.199 17.3274 7.7490 0.679 to 33.719 10.801 11.677 1.212 to 45.783
Fair 43 32.991 29.4828 4.4961 25.429 to 40.553 24.855 46.654 17.751 to 40.909Poor 5 36.239 20.0038 8.9460 17.167 to 55.310 33.333 8.630 17.910 to 70.009
-20
0
20
40
60
80
100
Good Fair Poor
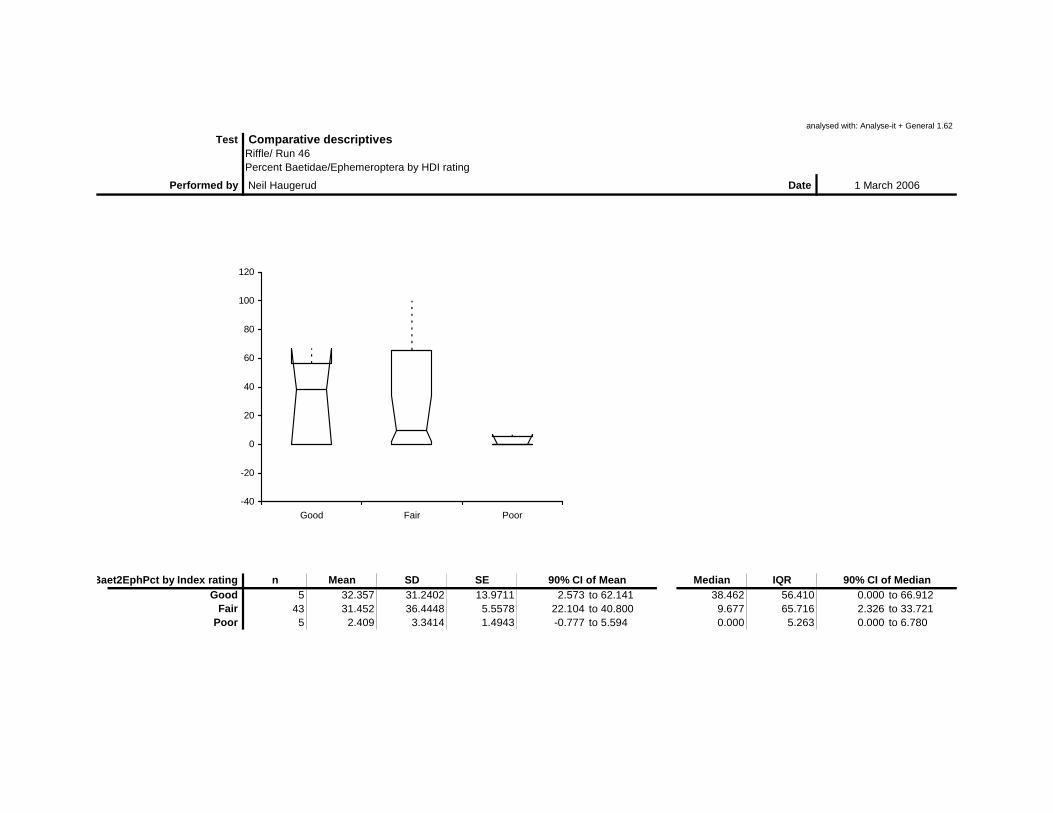
analysed with: Analyse-it + General 1.62
Test Comparative descriptivesRiffle/ Run 46Percent Baetidae/Ephemeroptera by HDI rating
Performed by Neil Haugerud Date 1 March 2006
Baet2EphPct by Index rating n Mean SD SE 90% CI of Mean Median IQR 90% CI of MedianGood 5 32.357 31.2402 13.9711 2.573 to 62.141 38.462 56.410 0.000 to 66.912
Fair 43 31.452 36.4448 5.5578 22.104 to 40.800 9.677 65.716 2.326 to 33.721Poor 5 2.409 3.3414 1.4943 -0.777 to 5.594 0.000 5.263 0.000 to 6.780
-40
-20
0
20
40
60
80
100
120
Good Fair Poor

analysed with: Analyse-it + General 1.62
Test Comparative descriptivesRiffle/ Run 46 Beck Biotic Index by HDI rating
Performed by Neil Haugerud Date 1 March 2006
BeckBI by Index rating n Mean SD SE 90% CI of Mean Median IQR 90% CI of MedianGood 5 4.000 1.5811 0.7071 2.493 to 5.507 4.000 2.000 2.000 to 6.000
Fair 43 2.767 1.4612 0.2228 2.393 to 3.142 3.000 2.000 2.000 to 3.000Poor 5 1.000 0.7071 0.3162 0.326 to 1.674 1.000 0.000 0.000 to 2.000
-1
0
1
2
3
4
5
6
7
Good Fair Poor

analysed with: Analyse-it + General 1.62
Test Comparative descriptivesRiffle/ Run 46Percent Bivalvia by HDI rating
Performed by Neil Haugerud Date 1 March 2006
BivalPct by Index rating n Mean SD SE 90% CI of Mean Median IQR 90% CI of MedianGood 5 4.106 4.3477 1.9444 -0.039 to 8.251 4.050 3.155 0.000 to 11.150
Fair 43 1.558 3.7678 0.5746 0.592 to 2.525 0.000 0.773 0.000 to 0.295Poor 5 0.947 1.9591 0.8761 -0.921 to 2.815 0.000 0.292 0.000 to 4.444
-5
0
5
10
15
20
Good Fair Poor

analysed with: Analyse-it + General 1.62
Test Comparative descriptivesRiffle/ Run 46Percent Burrowers by HDI rating
Performed by Neil Haugerud Date 1 March 2006
BrrwrPct by Index rating n Mean SD SE 90% CI of Mean Median IQR 90% CI of MedianGood 5 13.864 10.8792 4.8653 3.492 to 24.236 8.723 3.269 7.273 to 33.101
Fair 43 17.546 16.7004 2.5468 13.263 to 21.830 12.895 22.139 6.309 to 19.329Poor 5 9.930 11.1925 5.0055 -0.741 to 20.601 4.762 15.581 0.292 to 26.032
-10
0
10
20
30
40
50
60
70
80
Good Fair Poor

analysed with: Analyse-it + General 1.62
Test Comparative descriptivesRiffle/ Run 46Burrower taxa by HDI rating
Performed by Neil Haugerud Date 1 March 2006
BrrwrTax by Index rating n Mean SD SE 90% CI of Mean Median IQR 90% CI of MedianGood 5 2.200 0.8367 0.3742 1.402 to 2.998 2.000 1.000 1.000 to 3.000
Fair 43 2.605 1.3997 0.2134 2.246 to 2.964 2.000 1.000 2.000 to 3.000Poor 5 2.400 1.6733 0.7483 0.805 to 3.995 2.000 2.000 1.000 to 5.000
-1
0
1
2
3
4
5
6
7
8
Good Fair Poor
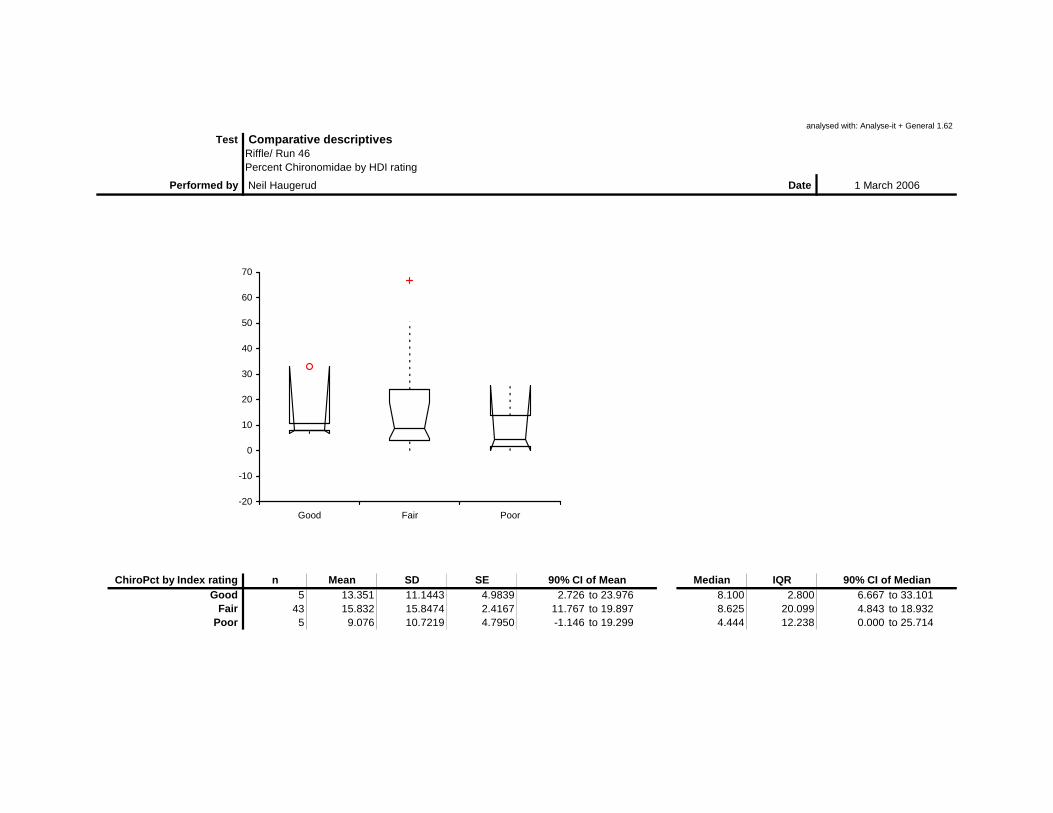
analysed with: Analyse-it + General 1.62
Test Comparative descriptivesRiffle/ Run 46Percent Chironomidae by HDI rating
Performed by Neil Haugerud Date 1 March 2006
ChiroPct by Index rating n Mean SD SE 90% CI of Mean Median IQR 90% CI of MedianGood 5 13.351 11.1443 4.9839 2.726 to 23.976 8.100 2.800 6.667 to 33.101
Fair 43 15.832 15.8474 2.4167 11.767 to 19.897 8.625 20.099 4.843 to 18.932Poor 5 9.076 10.7219 4.7950 -1.146 to 19.299 4.444 12.238 0.000 to 25.714
-20
-10
0
10
20
30
40
50
60
70
Good Fair Poor
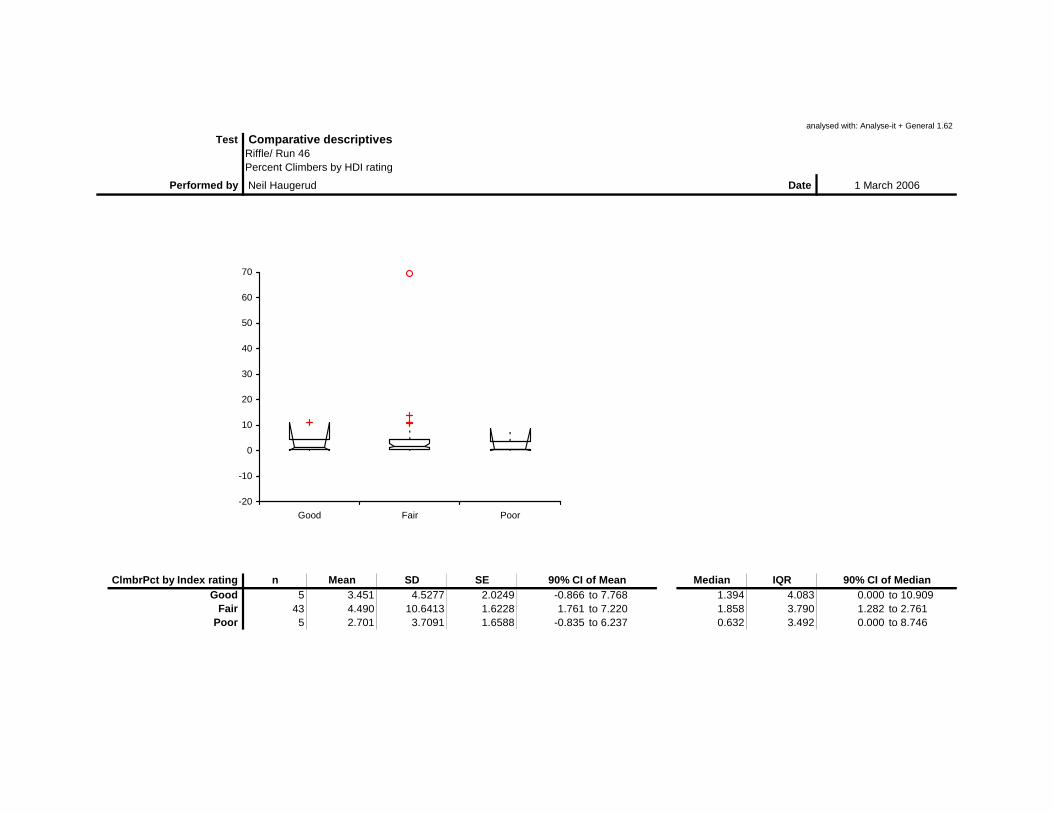
analysed with: Analyse-it + General 1.62
Test Comparative descriptivesRiffle/ Run 46Percent Climbers by HDI rating
Performed by Neil Haugerud Date 1 March 2006
ClmbrPct by Index rating n Mean SD SE 90% CI of Mean Median IQR 90% CI of MedianGood 5 3.451 4.5277 2.0249 -0.866 to 7.768 1.394 4.083 0.000 to 10.909
Fair 43 4.490 10.6413 1.6228 1.761 to 7.220 1.858 3.790 1.282 to 2.761Poor 5 2.701 3.7091 1.6588 -0.835 to 6.237 0.632 3.492 0.000 to 8.746
-20
-10
0
10
20
30
40
50
60
70
Good Fair Poor

analysed with: Analyse-it + General 1.62
Test Comparative descriptivesRiffle/ Run 46Climber taxa by HDI rating
Performed by Neil Haugerud Date 1 March 2006
ClmbrTax by Index rating n Mean SD SE 90% CI of Mean Median IQR 90% CI of MedianGood 5 3.000 2.0000 0.8944 1.093 to 4.907 4.000 2.000 0.000 to 5.000
Fair 43 2.302 1.6695 0.2546 1.874 to 2.731 2.000 2.000 2.000 to 3.000Poor 5 1.800 1.3038 0.5831 0.557 to 3.043 2.000 2.000 0.000 to 3.000
-1
0
1
2
3
4
5
6
7
Good Fair Poor

analysed with: Analyse-it + General 1.62
Test Comparative descriptivesRiffle/ Run 46Percent Clingers by HDI rating
Performed by Neil Haugerud Date 1 March 2006
ClngrPct by Index rating n Mean SD SE 90% CI of Mean Median IQR 90% CI of MedianGood 5 35.152 28.7882 12.8745 7.705 to 62.598 28.349 38.805 8.434 to 77.174
Fair 43 22.623 18.5606 2.8305 17.862 to 27.383 17.486 28.146 10.811 to 29.773Poor 5 27.061 32.1798 14.3912 -3.619 to 57.741 7.302 47.846 2.168 to 71.642
-40
-20
0
20
40
60
80
100
Good Fair Poor

analysed with: Analyse-it + General 1.62
Test Comparative descriptivesRiffle/ Run 46Clinger taxa by HDI rating
Performed by Neil Haugerud Date 1 March 2006
ClngrTax by Index rating n Mean SD SE 90% CI of Mean Median IQR 90% CI of MedianGood 5 6.000 1.2247 0.5477 4.832 to 7.168 6.000 1.000 4.000 to 7.000
Fair 43 4.860 2.4357 0.3714 4.236 to 5.485 5.000 3.500 4.000 to 6.000Poor 5 4.800 0.8367 0.3742 4.002 to 5.598 5.000 1.000 4.000 to 6.000
0
2
4
6
8
10
Good Fair Poor

analysed with: Analyse-it + General 1.62
Test Comparative descriptivesRiffle/ Run 46Percent Coleoptera by HDI rating
Performed by Neil Haugerud Date 1 March 2006
ColeoPct by Index rating n Mean SD SE 90% CI of Mean Median IQR 90% CI of MedianGood 5 6.233 10.7926 4.8266 -4.056 to 16.523 1.957 1.666 0.000 to 25.455
Fair 43 4.254 5.3376 0.8140 2.885 to 5.623 2.367 3.914 1.242 to 3.757Poor 5 0.889 0.6329 0.2831 0.285 to 1.492 0.952 0.916 0.000 to 1.493
-15
-10
-5
0
5
10
15
20
25
30
Good Fair Poor

analysed with: Analyse-it + General 1.62
Test Comparative descriptivesRiffle/ Run 46Coleoptera taxa by HDI rating
Performed by Neil Haugerud Date 1 March 2006
ColeoTax by Index rating n Mean SD SE 90% CI of Mean Median IQR 90% CI of MedianGood 5 3.200 2.5884 1.1576 0.732 to 5.668 3.000 2.000 0.000 to 7.000
Fair 43 3.419 2.9939 0.4566 2.651 to 4.187 3.000 3.000 2.000 to 4.000Poor 5 2.200 1.4832 0.6633 0.786 to 3.614 2.000 1.000 0.000 to 4.000
-2
0
2
4
6
8
10
12
14
Good Fair Poor

analysed with: Analyse-it + General 1.62
Test Comparative descriptivesRiffle/ Run 46 Percent Collectors by HDI rating
Performed by Neil Haugerud Date 1 March 2006
CllctPct by Index rating n Mean SD SE 90% CI of Mean Median IQR 90% CI of MedianGood 5 53.001 18.9549 8.4769 34.930 to 71.073 58.133 7.743 20.870 to 70.383
Fair 43 61.776 22.5113 3.4329 56.002 to 67.550 63.881 24.576 57.098 to 72.105Poor 5 52.035 29.2323 13.0731 24.165 to 79.904 43.810 42.585 19.403 to 89.070
0
20
40
60
80
100
Good Fair Poor

analysed with: Analyse-it + General 1.62
Test Comparative descriptivesRiffle/ Run 46Collector taxa by HDI rating
Performed by Neil Haugerud Date 1 March 2006
CllctTax by Index rating n Mean SD SE 90% CI of Mean Median IQR 90% CI of MedianGood 5 7.200 1.6432 0.7348 5.633 to 8.767 7.000 1.000 6.000 to 10.000
Fair 43 6.372 2.0357 0.3104 5.850 to 6.894 6.000 2.000 6.000 to 7.000Poor 5 5.400 1.9494 0.8718 3.541 to 7.259 6.000 0.000 2.000 to 7.000
1
3
5
7
9
11
Good Fair Poor

analysed with: Analyse-it + General 1.62
Test Comparative descriptivesRiffle/ Run 46Percent Crustacea/Mollusca by HDI rating
Performed by Neil Haugerud Date 1 March 2006
CrMolPct by Index rating n Mean SD SE 90% CI of Mean Median IQR 90% CI of MedianGood 5 13.337 14.1344 6.3211 -0.139 to 26.813 7.530 5.727 1.522 to 37.576
Fair 43 8.867 12.3879 1.8891 5.689 to 12.044 3.896 11.173 1.579 to 5.611Poor 5 12.493 21.3998 9.5703 -7.910 to 32.895 3.731 6.308 0.000 to 50.437
-30
-20
-10
0
10
20
30
40
50
60
Good Fair Poor
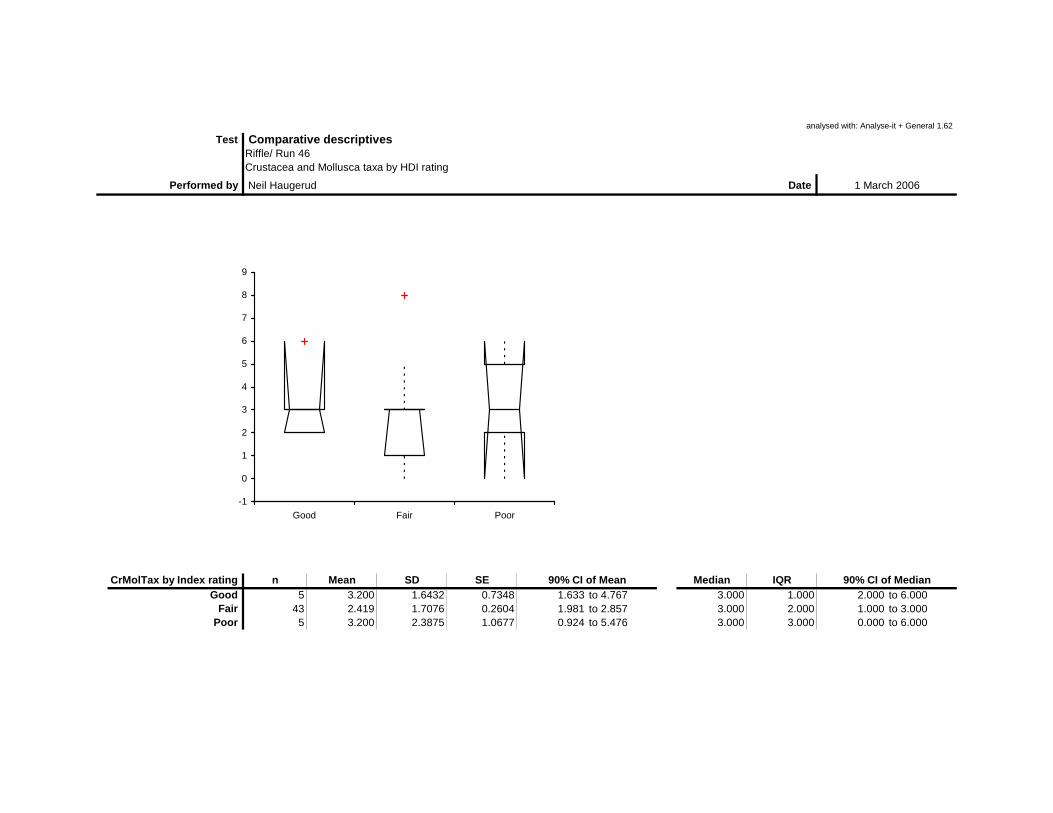
analysed with: Analyse-it + General 1.62
Test Comparative descriptivesRiffle/ Run 46Crustacea and Mollusca taxa by HDI rating
Performed by Neil Haugerud Date 1 March 2006
CrMolTax by Index rating n Mean SD SE 90% CI of Mean Median IQR 90% CI of MedianGood 5 3.200 1.6432 0.7348 1.633 to 4.767 3.000 1.000 2.000 to 6.000
Fair 43 2.419 1.7076 0.2604 1.981 to 2.857 3.000 2.000 1.000 to 3.000Poor 5 3.200 2.3875 1.0677 0.924 to 5.476 3.000 3.000 0.000 to 6.000
-1
0
1
2
3
4
5
6
7
8
9
Good Fair Poor

analysed with: Analyse-it + General 1.62
Test Comparative descriptivesRiffle/ Run 46Percent Diptera by HDI rating
Performed by Neil Haugerud Date 1 March 2006
DipPct by Index rating n Mean SD SE 90% CI of Mean Median IQR 90% CI of MedianGood 5 21.746 17.8393 7.9780 4.738 to 38.754 11.747 24.452 6.667 to 47.174
Fair 43 23.639 22.8639 3.4867 17.775 to 29.504 15.805 26.760 9.827 to 24.927Poor 5 9.656 11.5694 5.1740 -1.374 to 20.686 4.444 13.232 0.000 to 27.619
-20
0
20
40
60
80
Good Fair Poor

analysed with: Analyse-it + General 1.62
Test Comparative descriptivesRiffle/ Run 46Diptera taxa by HDI rating
Performed by Neil Haugerud Date 1 March 2006
DipTax by Index rating n Mean SD SE 90% CI of Mean Median IQR 90% CI of MedianGood 5 2.000 0.7071 0.3162 1.326 to 2.674 2.000 0.000 1.000 to 3.000
Fair 43 2.512 1.2606 0.1922 2.188 to 2.835 2.000 1.000 2.000 to 3.000Poor 5 2.000 2.3452 1.0488 -0.236 to 4.236 1.000 1.000 0.000 to 6.000
-2
-1
0
1
2
3
4
5
6
7
Good Fair Poor

analysed with: Analyse-it + General 1.62
Test Comparative descriptivesRiffle/ Run 46Dominant taxa by HDI rating
Performed by Neil Haugerud Date 1 March 2006
Dom01Pct by Index rating n Mean SD SE 90% CI of Mean Median IQR 90% CI of MedianGood 5 34.304 7.7460 3.4641 26.919 to 41.689 33.101 10.782 26.061 to 44.880
Fair 43 47.625 19.6196 2.9920 42.593 to 52.658 43.443 27.826 38.718 to 50.751Poor 5 47.305 16.3564 7.3148 31.711 to 62.899 39.942 24.670 33.333 to 70.009
10
20
30
40
50
60
70
80
90
100
Good Fair Poor
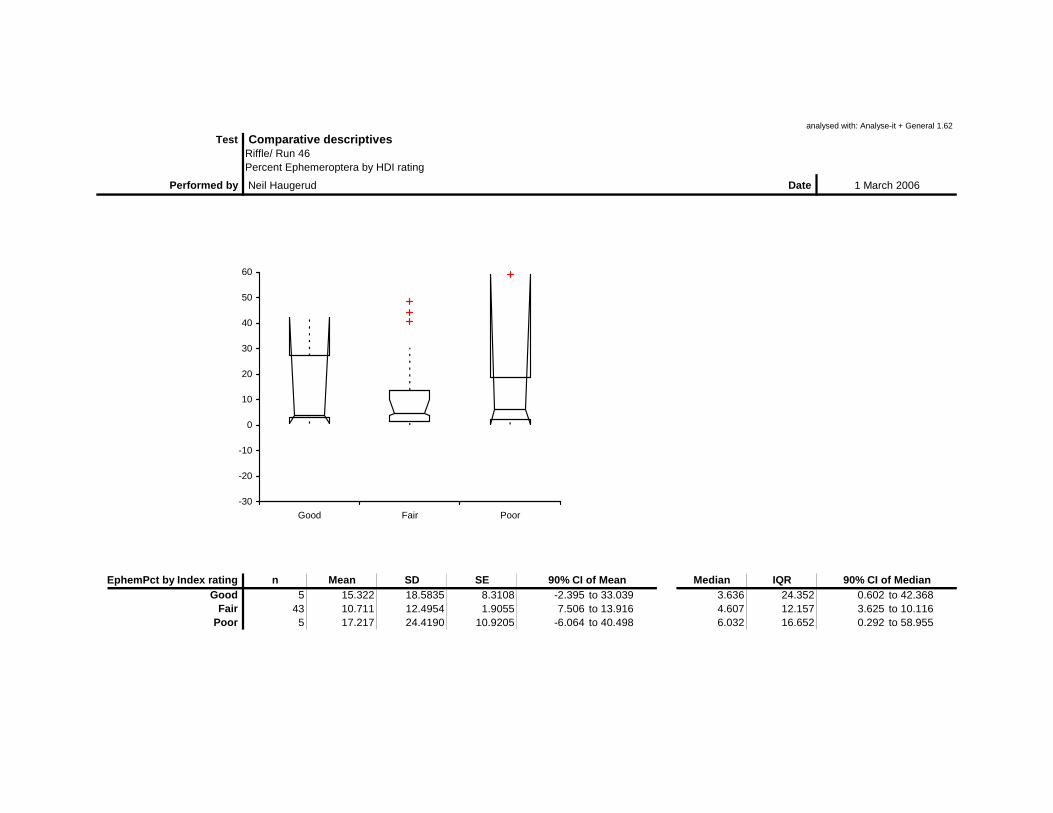
analysed with: Analyse-it + General 1.62
Test Comparative descriptivesRiffle/ Run 46Percent Ephemeroptera by HDI rating
Performed by Neil Haugerud Date 1 March 2006
EphemPct by Index rating n Mean SD SE 90% CI of Mean Median IQR 90% CI of MedianGood 5 15.322 18.5835 8.3108 -2.395 to 33.039 3.636 24.352 0.602 to 42.368
Fair 43 10.711 12.4954 1.9055 7.506 to 13.916 4.607 12.157 3.625 to 10.116Poor 5 17.217 24.4190 10.9205 -6.064 to 40.498 6.032 16.652 0.292 to 58.955
-30
-20
-10
0
10
20
30
40
50
60
Good Fair Poor
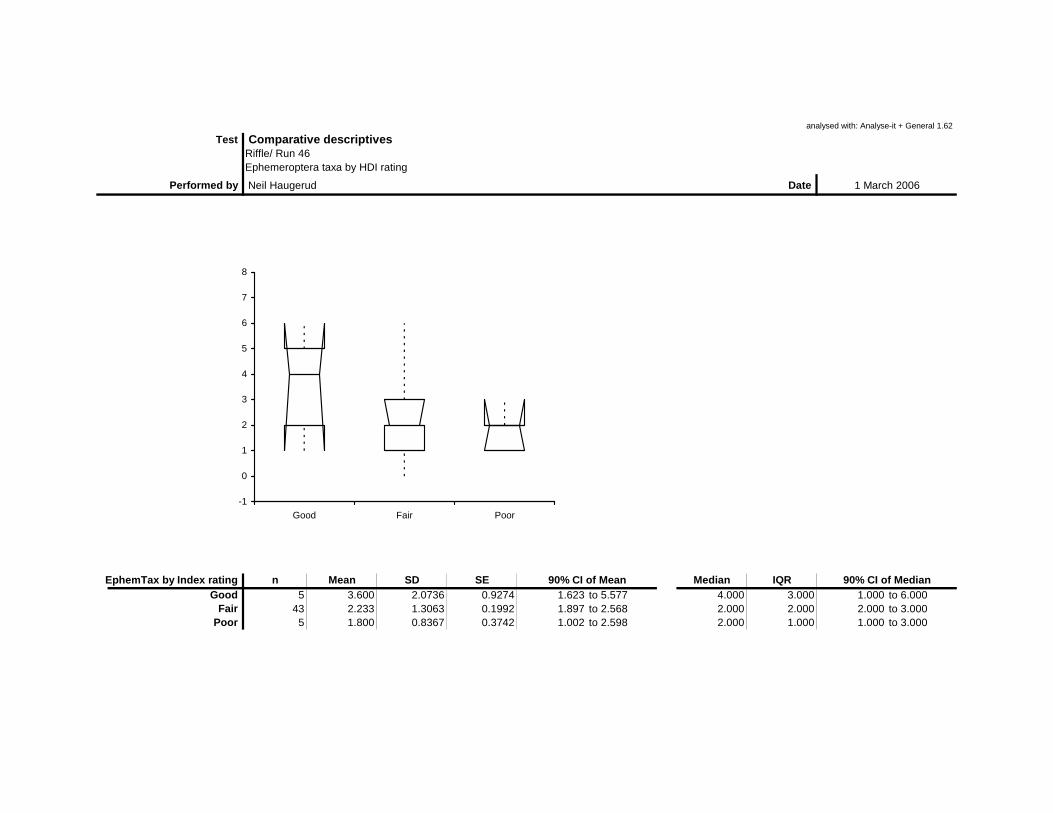
analysed with: Analyse-it + General 1.62
Test Comparative descriptivesRiffle/ Run 46Ephemeroptera taxa by HDI rating
Performed by Neil Haugerud Date 1 March 2006
EphemTax by Index rating n Mean SD SE 90% CI of Mean Median IQR 90% CI of MedianGood 5 3.600 2.0736 0.9274 1.623 to 5.577 4.000 3.000 1.000 to 6.000
Fair 43 2.233 1.3063 0.1992 1.897 to 2.568 2.000 2.000 2.000 to 3.000Poor 5 1.800 0.8367 0.3742 1.002 to 2.598 2.000 1.000 1.000 to 3.000
-1
0
1
2
3
4
5
6
7
8
Good Fair Poor

analysed with: Analyse-it + General 1.62
Test Comparative descriptivesRiffle/ Run 46 Percent Ephemeroptera, Plecoptera and Trichoptera by HDI rating
Performed by Neil Haugerud Date 1 March 2006
EPTPct by Index rating n Mean SD SE 90% CI of Mean Median IQR 90% CI of MedianGood 5 28.539 21.9453 9.8143 7.616 to 49.461 33.101 29.559 5.120 to 57.944
Fair 43 15.557 17.7628 2.7088 11.001 to 20.113 9.073 17.773 5.641 to 15.526Poor 5 19.448 28.1893 12.6067 -7.428 to 46.323 6.349 18.240 0.583 to 67.910
-40
-20
0
20
40
60
80
Good Fair Poor

analysed with: Analyse-it + General 1.62
Test Comparative descriptivesRiffle/ Run 46Ephemeroptera, Plecoptera and Trichoptera taxa by HDI rating
Performed by Neil Haugerud Date 1 March 2006
EPTTax by Index rating n Mean SD SE 90% CI of Mean Median IQR 90% CI of MedianGood 5 7.000 2.9155 1.3038 4.220 to 9.780 8.000 4.000 3.000 to 10.000
Fair 43 3.953 2.4098 0.3675 3.335 to 4.572 4.000 2.500 3.000 to 4.000Poor 5 3.000 1.4142 0.6325 1.652 to 4.348 2.000 2.000 2.000 to 5.000
-2
0
2
4
6
8
10
12
Good Fair Poor
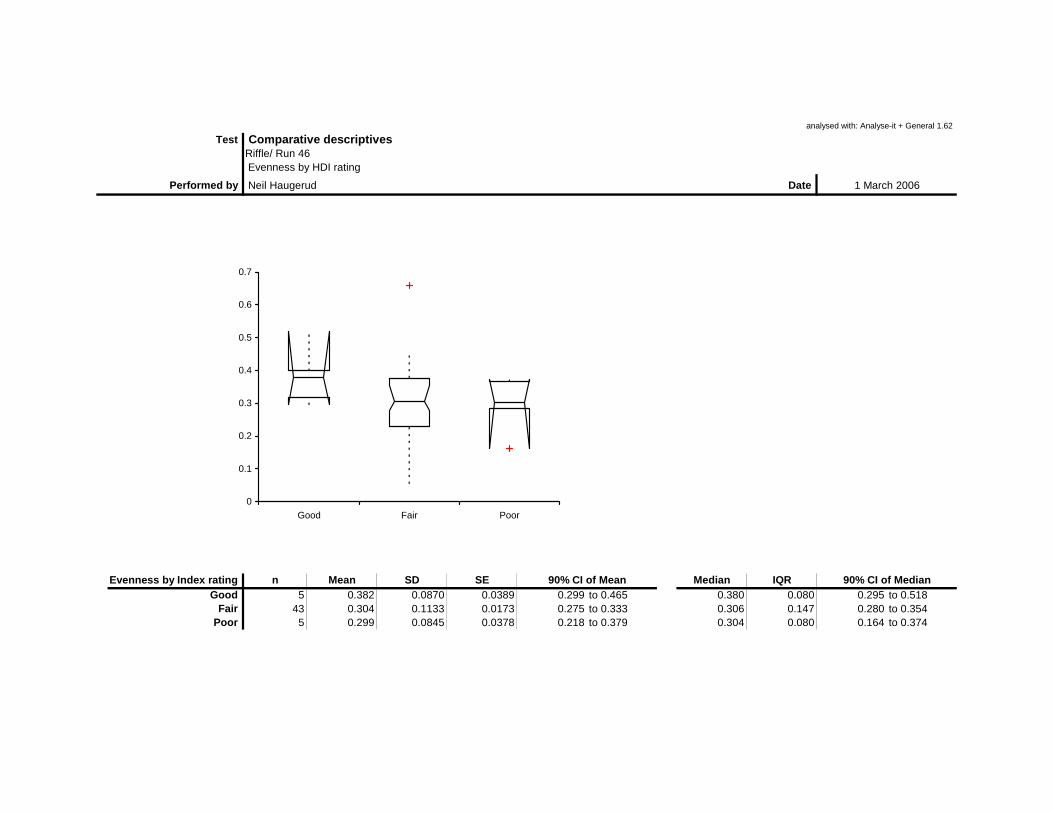
analysed with: Analyse-it + General 1.62
Test Comparative descriptivesRiffle/ Run 46 Evenness by HDI rating
Performed by Neil Haugerud Date 1 March 2006
Evenness by Index rating n Mean SD SE 90% CI of Mean Median IQR 90% CI of MedianGood 5 0.382 0.0870 0.0389 0.299 to 0.465 0.380 0.080 0.295 to 0.518
Fair 43 0.304 0.1133 0.0173 0.275 to 0.333 0.306 0.147 0.280 to 0.354Poor 5 0.299 0.0845 0.0378 0.218 to 0.379 0.304 0.080 0.164 to 0.374
0
0.1
0.2
0.3
0.4
0.5
0.6
0.7
Good Fair Poor
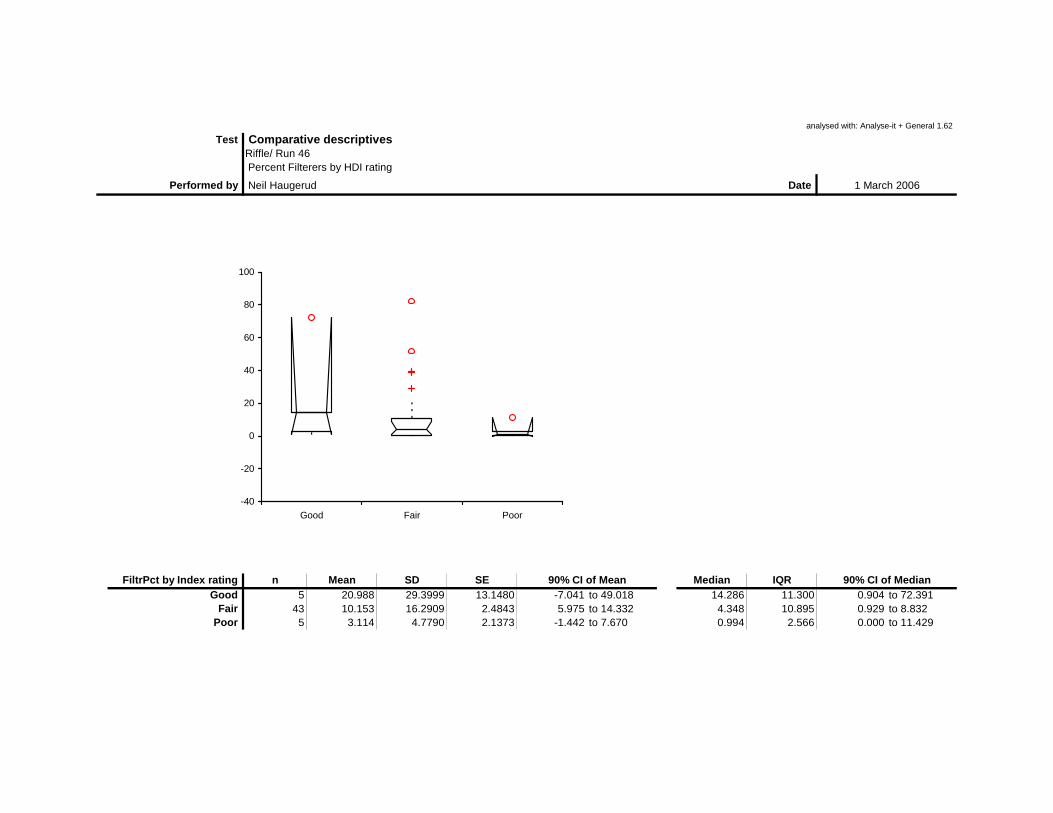
analysed with: Analyse-it + General 1.62
Test Comparative descriptivesRiffle/ Run 46 Percent Filterers by HDI rating
Performed by Neil Haugerud Date 1 March 2006
FiltrPct by Index rating n Mean SD SE 90% CI of Mean Median IQR 90% CI of MedianGood 5 20.988 29.3999 13.1480 -7.041 to 49.018 14.286 11.300 0.904 to 72.391
Fair 43 10.153 16.2909 2.4843 5.975 to 14.332 4.348 10.895 0.929 to 8.832Poor 5 3.114 4.7790 2.1373 -1.442 to 7.670 0.994 2.566 0.000 to 11.429
-40
-20
0
20
40
60
80
100
Good Fair Poor
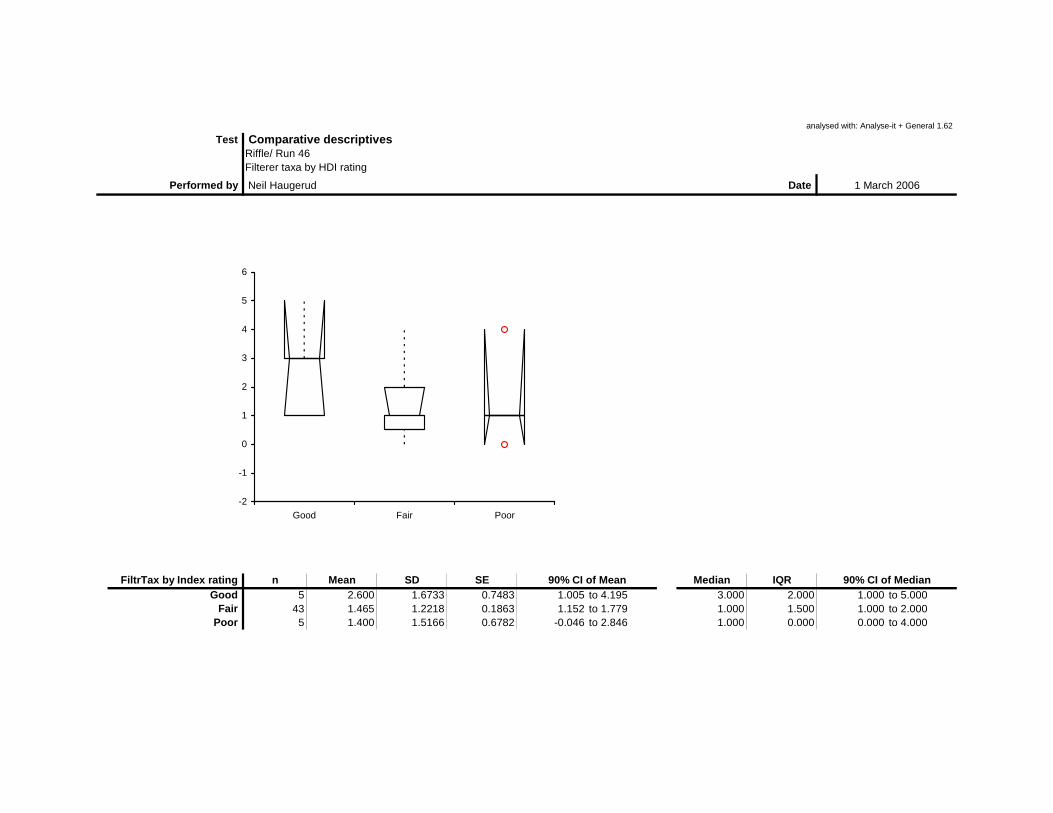
analysed with: Analyse-it + General 1.62
Test Comparative descriptivesRiffle/ Run 46Filterer taxa by HDI rating
Performed by Neil Haugerud Date 1 March 2006
FiltrTax by Index rating n Mean SD SE 90% CI of Mean Median IQR 90% CI of MedianGood 5 2.600 1.6733 0.7483 1.005 to 4.195 3.000 2.000 1.000 to 5.000
Fair 43 1.465 1.2218 0.1863 1.152 to 1.779 1.000 1.500 1.000 to 2.000Poor 5 1.400 1.5166 0.6782 -0.046 to 2.846 1.000 0.000 0.000 to 4.000
-2
-1
0
1
2
3
4
5
6
Good Fair Poor
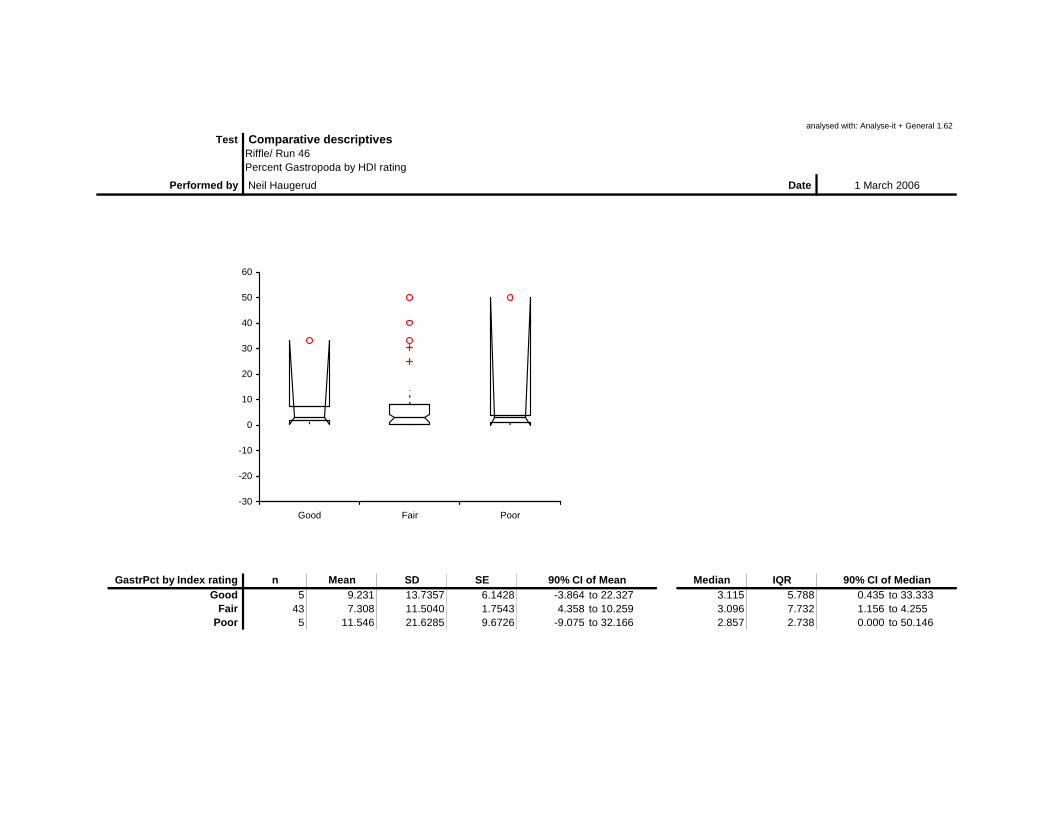
analysed with: Analyse-it + General 1.62
Test Comparative descriptivesRiffle/ Run 46Percent Gastropoda by HDI rating
Performed by Neil Haugerud Date 1 March 2006
GastrPct by Index rating n Mean SD SE 90% CI of Mean Median IQR 90% CI of MedianGood 5 9.231 13.7357 6.1428 -3.864 to 22.327 3.115 5.788 0.435 to 33.333
Fair 43 7.308 11.5040 1.7543 4.358 to 10.259 3.096 7.732 1.156 to 4.255Poor 5 11.546 21.6285 9.6726 -9.075 to 32.166 2.857 2.738 0.000 to 50.146
-30
-20
-10
0
10
20
30
40
50
60
Good Fair Poor
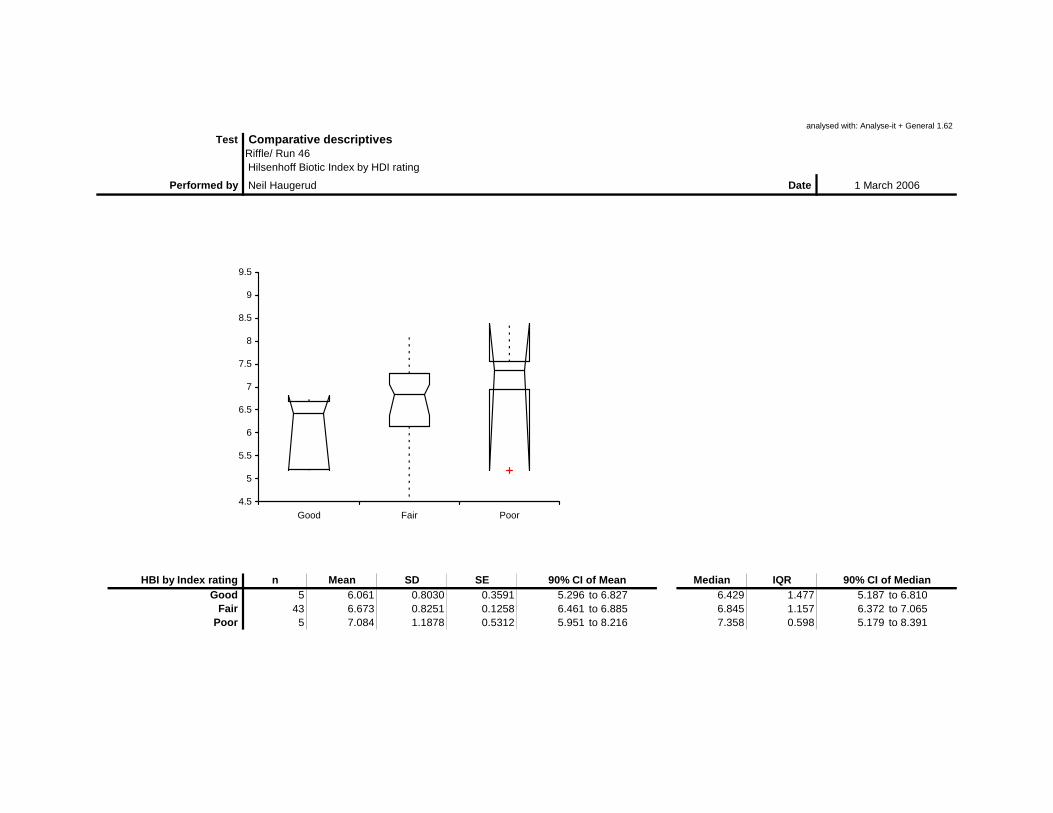
analysed with: Analyse-it + General 1.62
Test Comparative descriptivesRiffle/ Run 46 Hilsenhoff Biotic Index by HDI rating
Performed by Neil Haugerud Date 1 March 2006
HBI by Index rating n Mean SD SE 90% CI of Mean Median IQR 90% CI of MedianGood 5 6.061 0.8030 0.3591 5.296 to 6.827 6.429 1.477 5.187 to 6.810
Fair 43 6.673 0.8251 0.1258 6.461 to 6.885 6.845 1.157 6.372 to 7.065Poor 5 7.084 1.1878 0.5312 5.951 to 8.216 7.358 0.598 5.179 to 8.391
4.5
5
5.5
6
6.5
7
7.5
8
8.5
9
9.5
Good Fair Poor

analysed with: Analyse-it + General 1.62
Test Comparative descriptivesRiffle/ Run 46Percent Hydropsychidae/Ephemeroptera, Plecoptera and Trichoptera by HDI rating
Performed by Neil Haugerud Date 1 March 2006
Hyd2EPTPct by Index rating n Mean SD SE 90% CI of Mean Median IQR 90% CI of MedianGood 5 23.466 36.7339 16.4279 -11.555 to 58.488 9.474 20.430 0.000 to 87.429
Fair 43 8.375 15.3370 2.3389 4.442 to 12.309 0.000 11.543 0.000 to 1.887Poor 5 0.313 0.6988 0.3125 -0.354 to 0.979 0.000 0.000 0.000 to 1.563
-40
-20
0
20
40
60
80
100
Good Fair Poor

analysed with: Analyse-it + General 1.62
Test Comparative descriptivesRiffle/ Run 46Percent Hydropsychidae/Trichoptera by HDI rating
Performed by Neil Haugerud Date 1 March 2006
Hyd2TriPct by Index rating n Mean SD SE 90% CI of Mean Median IQR 90% CI of MedianGood 5 45.658 44.7937 20.0323 2.953 to 88.364 52.941 76.000 0.000 to 99.351
Fair 43 26.115 35.9326 5.4797 16.898 to 35.331 0.000 47.822 0.000 to 33.333Poor 5 4.000 8.9443 4.0000 -4.527 to 12.527 0.000 0.000 0.000 to 20.000
-40
-20
0
20
40
60
80
100
120
Good Fair Poor

analysed with: Analyse-it + General 1.62
Test Comparative descriptivesRiffle/ Run 46Percent Intolerant by HDI rating
Performed by Neil Haugerud Date 1 March 2006
IntolPct by Index rating n Mean SD SE 90% CI of Mean Median IQR 90% CI of MedianGood 5 10.118 11.6188 5.1961 -0.959 to 21.195 3.833 10.971 1.807 to 29.130
Fair 43 4.185 7.9424 1.2112 2.148 to 6.222 0.450 4.167 0.000 to 2.168Poor 5 0.000 0.0000 0.0000 0.000 to 0.000 0.000 0.000 0.000 to 0.000
-10
-5
0
5
10
15
20
25
30
35
40
Good Fair Poor

analysed with: Analyse-it + General 1.62
Test Comparative descriptivesRiffle/ Run 46Intolerant taxa by HDI rating
Performed by Neil Haugerud Date 1 March 2006
IntolTax by Index rating n Mean SD SE 90% CI of Mean Median IQR 90% CI of MedianGood 5 1.600 0.8944 0.4000 0.747 to 2.453 1.000 1.000 1.000 to 3.000
Fair 43 1.093 1.1915 0.1817 0.787 to 1.399 1.000 2.000 0.000 to 1.000Poor 5 0.000 0.0000 0.0000 0.000 to 0.000 0.000 0.000 0.000 to 0.000
-1
0
1
2
3
4
Good Fair Poor
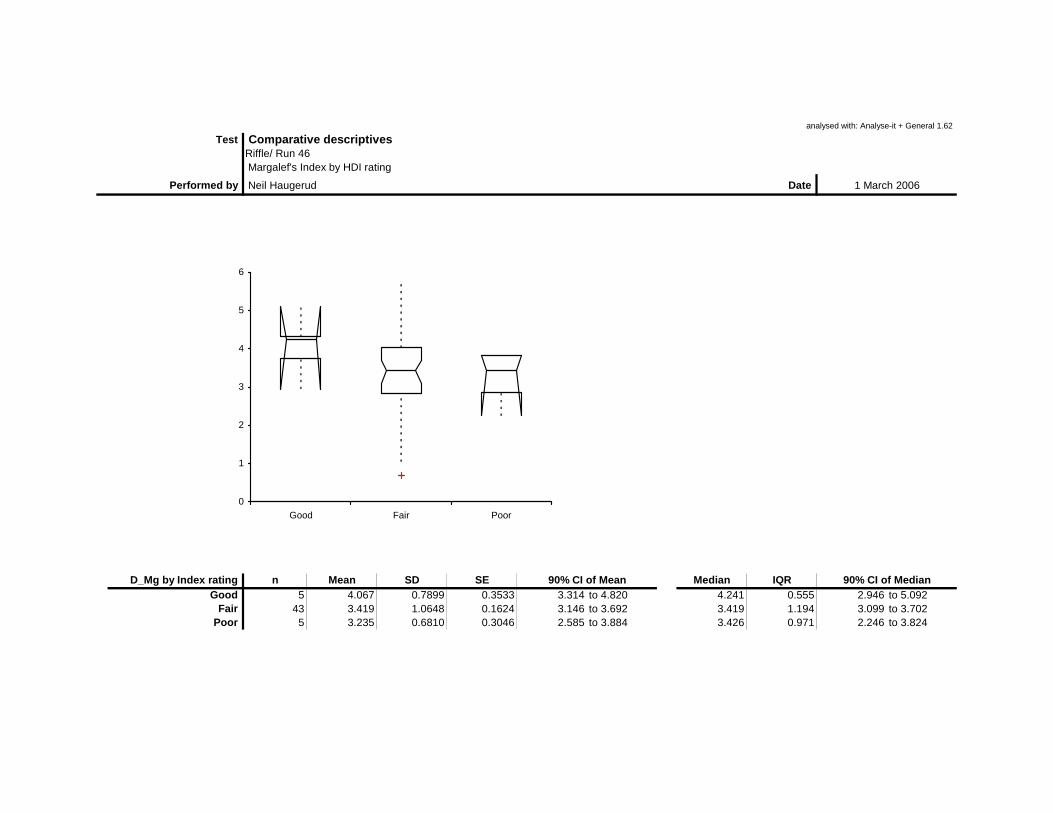
analysed with: Analyse-it + General 1.62
Test Comparative descriptivesRiffle/ Run 46 Margalef's Index by HDI rating
Performed by Neil Haugerud Date 1 March 2006
D_Mg by Index rating n Mean SD SE 90% CI of Mean Median IQR 90% CI of MedianGood 5 4.067 0.7899 0.3533 3.314 to 4.820 4.241 0.555 2.946 to 5.092
Fair 43 3.419 1.0648 0.1624 3.146 to 3.692 3.419 1.194 3.099 to 3.702Poor 5 3.235 0.6810 0.3046 2.585 to 3.884 3.426 0.971 2.246 to 3.824
0
1
2
3
4
5
6
Good Fair Poor
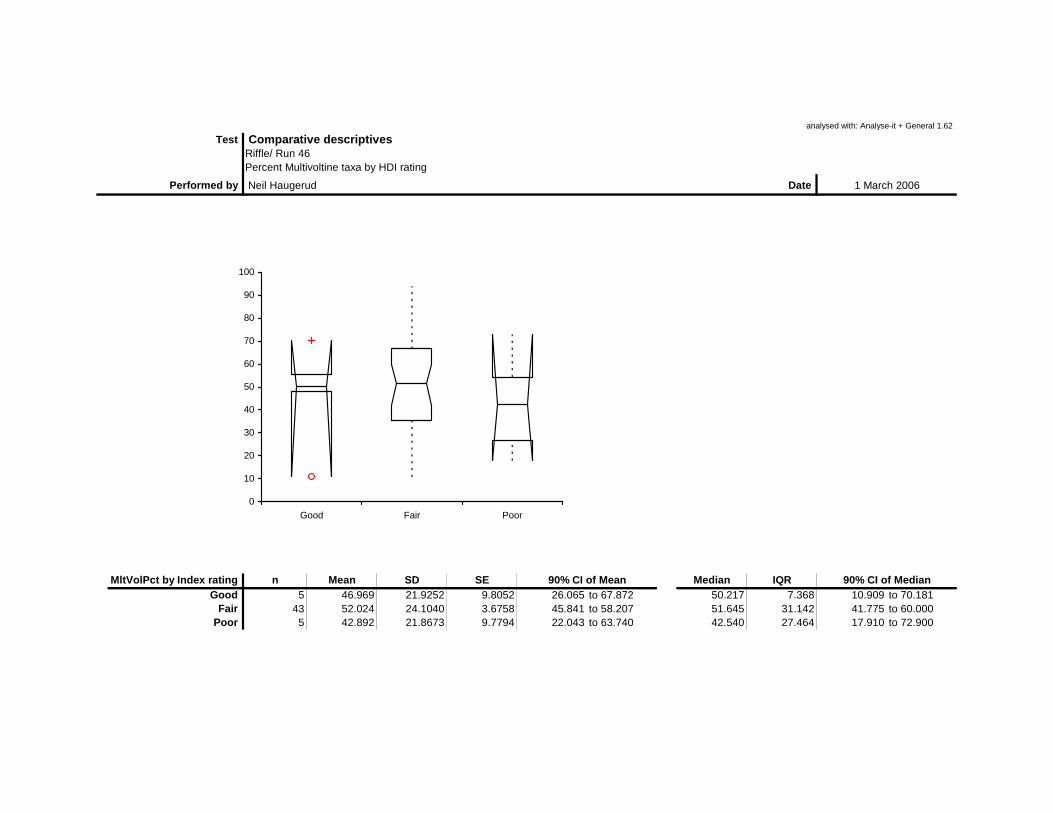
analysed with: Analyse-it + General 1.62
Test Comparative descriptivesRiffle/ Run 46Percent Multivoltine taxa by HDI rating
Performed by Neil Haugerud Date 1 March 2006
MltVolPct by Index rating n Mean SD SE 90% CI of Mean Median IQR 90% CI of MedianGood 5 46.969 21.9252 9.8052 26.065 to 67.872 50.217 7.368 10.909 to 70.181
Fair 43 52.024 24.1040 3.6758 45.841 to 58.207 51.645 31.142 41.775 to 60.000Poor 5 42.892 21.8673 9.7794 22.043 to 63.740 42.540 27.464 17.910 to 72.900
0
10
20
30
40
50
60
70
80
90
100
Good Fair Poor

analysed with: Analyse-it + General 1.62
Test Comparative descriptivesRiffle/ Run 46Percent Non-Insect by HDI rating
Performed by Neil Haugerud Date 1 March 2006
NonInPct by Index rating n Mean SD SE 90% CI of Mean Median IQR 90% CI of MedianGood 5 36.415 17.7760 7.9497 19.467 to 53.362 32.399 20.944 12.174 to 56.627
Fair 43 46.600 27.7518 4.2321 39.482 to 53.718 48.701 42.822 29.787 to 59.538Poor 5 54.254 22.5078 10.0658 32.795 to 75.713 52.381 31.168 23.134 to 76.968
0
10
20
30
40
50
60
70
80
90
100
Good Fair Poor

analysed with: Analyse-it + General 1.62
Test Comparative descriptivesRiffle/ Run 46Percent Odonata by HDI rating
Performed by Neil Haugerud Date 1 March 2006
OdonPct by Index rating n Mean SD SE 90% CI of Mean Median IQR 90% CI of MedianGood 5 0.925 1.0427 0.4663 -0.069 to 1.919 0.697 1.506 0.000 to 2.424
Fair 43 1.898 2.2783 0.3474 1.313 to 2.482 1.316 2.374 0.578 to 1.813Poor 5 2.520 3.7100 1.6592 -1.017 to 6.057 0.361 2.857 0.000 to 8.746
-4
-2
0
2
4
6
8
10
12
Good Fair Poor

analysed with: Analyse-it + General 1.62
Test Comparative descriptivesRiffle/ Run 46Percent Oligocheata by HDI rating
Performed by Neil Haugerud Date 1 March 2006
OligoPct by Index rating n Mean SD SE 90% CI of Mean Median IQR 90% CI of MedianGood 5 0.349 0.4011 0.1794 -0.034 to 0.731 0.217 0.623 0.000 to 0.904
Fair 43 1.494 3.5008 0.5339 0.596 to 2.392 0.473 1.456 0.279 to 0.619Poor 5 0.736 1.3143 0.5878 -0.517 to 1.989 0.292 0.317 0.000 to 3.071
-5
0
5
10
15
20
25
Good Fair Poor

analysed with: Analyse-it + General 1.62
Test Comparative descriptivesRiffle/ Run 46 Percent Predators by HDI rating
Performed by Neil Haugerud Date 1 March 2006
PredPct by Index rating n Mean SD SE 90% CI of Mean Median IQR 90% CI of MedianGood 5 8.834 10.6353 4.7563 -1.305 to 18.974 5.923 4.618 0.000 to 27.108
Fair 43 13.089 13.0786 1.9945 9.734 to 16.443 9.910 15.654 5.397 to 12.384Poor 5 14.287 5.2925 2.3669 9.241 to 19.333 12.687 5.714 8.311 to 21.866
-10
0
10
20
30
40
50
60
70
Good Fair Poor

analysed with: Analyse-it + General 1.62
Test Comparative descriptivesRiffle/ Run 46Predator taxa by HDI rating
Performed by Neil Haugerud Date 1 March 2006
PredTax by Index rating n Mean SD SE 90% CI of Mean Median IQR 90% CI of MedianGood 5 6.600 4.3932 1.9647 2.412 to 10.788 7.000 5.000 0.000 to 11.000
Fair 43 7.256 4.0947 0.6244 6.206 to 8.306 6.000 5.000 5.000 to 8.000Poor 5 7.800 3.3466 1.4967 4.609 to 10.991 9.000 2.000 2.000 to 10.000
-5
0
5
10
15
20
25
Good Fair Poor

analysed with: Analyse-it + General 1.62
Test Comparative descriptivesRiffle/ Run 46 Percent Scrapers by HDI rating
Performed by Neil Haugerud Date 1 March 2006
ScrapPct by Index rating n Mean SD SE 90% CI of Mean Median IQR 90% CI of MedianGood 5 7.415 5.0748 2.2695 2.576 to 12.253 7.530 3.001 1.522 to 15.265
Fair 43 8.886 12.2390 1.8664 5.747 to 12.025 3.779 9.341 2.244 to 6.294Poor 5 23.112 28.7784 12.8701 -4.325 to 50.549 6.032 43.904 0.952 to 62.687
-30
-10
10
30
50
70
Good Fair Poor

analysed with: Analyse-it + General 1.62
Test Comparative descriptivesRiffle/ Run 46Scraper taxa by HDI rating
Performed by Neil Haugerud Date 1 March 2006
ScrapTax by Index rating n Mean SD SE 90% CI of Mean Median IQR 90% CI of MedianGood 5 2.800 0.8367 0.3742 2.002 to 3.598 3.000 1.000 2.000 to 4.000
Fair 43 2.372 1.5279 0.2330 1.980 to 2.764 3.000 2.000 2.000 to 3.000Poor 5 3.000 1.5811 0.7071 1.493 to 4.507 3.000 2.000 1.000 to 5.000
-1
0
1
2
3
4
5
6
7
8
Good Fair Poor

analysed with: Analyse-it + General 1.62
Test Comparative descriptivesRiffle/ Run 46 Shannon-Weiner Index by HDI rating
Performed by Neil Haugerud Date 1 March 2006
Shan_e by Index rating n Mean SD SE 90% CI of Mean Median IQR 90% CI of MedianGood 5 2.151 0.3400 0.1521 1.827 to 2.476 2.193 0.408 1.810 to 2.644
Fair 43 1.738 0.5780 0.0881 1.590 to 1.886 1.838 0.874 1.599 to 2.049Poor 5 1.715 0.4372 0.1955 1.298 to 2.132 1.774 0.702 1.147 to 2.150
0
0.5
1
1.5
2
2.5
3
Good Fair Poor

analysed with: Analyse-it + General 1.62
Test Comparative descriptivesRiffle/ Run 46Percent Shredders by HDI rating
Performed by Neil Haugerud Date 1 March 2006
ShredPct by Index rating n Mean SD SE 90% CI of Mean Median IQR 90% CI of MedianGood 5 7.940 6.4758 2.8960 1.766 to 14.114 6.325 3.570 1.957 to 18.788
Fair 43 5.308 10.6711 1.6273 2.571 to 8.045 2.564 4.184 1.724 to 3.825Poor 5 2.057 2.3301 1.0421 -0.165 to 4.278 0.952 2.353 0.000 to 5.714
-20
-10
0
10
20
30
40
50
60
70
Good Fair Poor
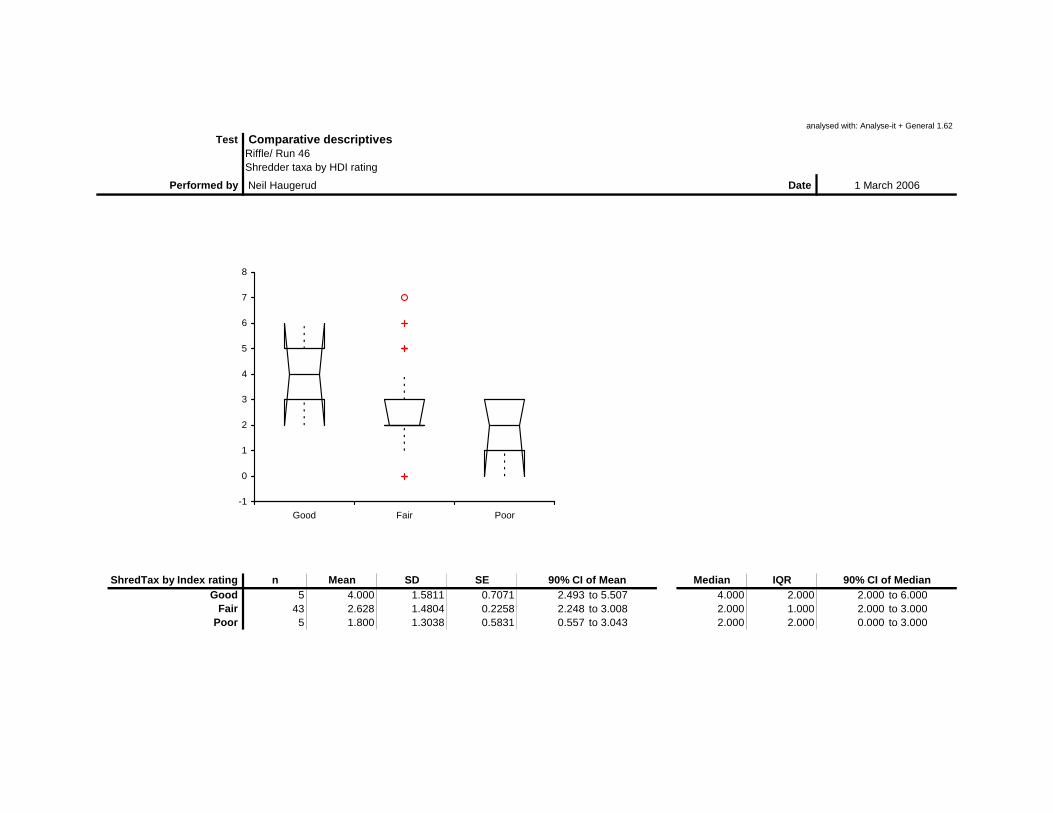
analysed with: Analyse-it + General 1.62
Test Comparative descriptivesRiffle/ Run 46Shredder taxa by HDI rating
Performed by Neil Haugerud Date 1 March 2006
ShredTax by Index rating n Mean SD SE 90% CI of Mean Median IQR 90% CI of MedianGood 5 4.000 1.5811 0.7071 2.493 to 5.507 4.000 2.000 2.000 to 6.000
Fair 43 2.628 1.4804 0.2258 2.248 to 3.008 2.000 1.000 2.000 to 3.000Poor 5 1.800 1.3038 0.5831 0.557 to 3.043 2.000 2.000 0.000 to 3.000
-1
0
1
2
3
4
5
6
7
8
Good Fair Poor
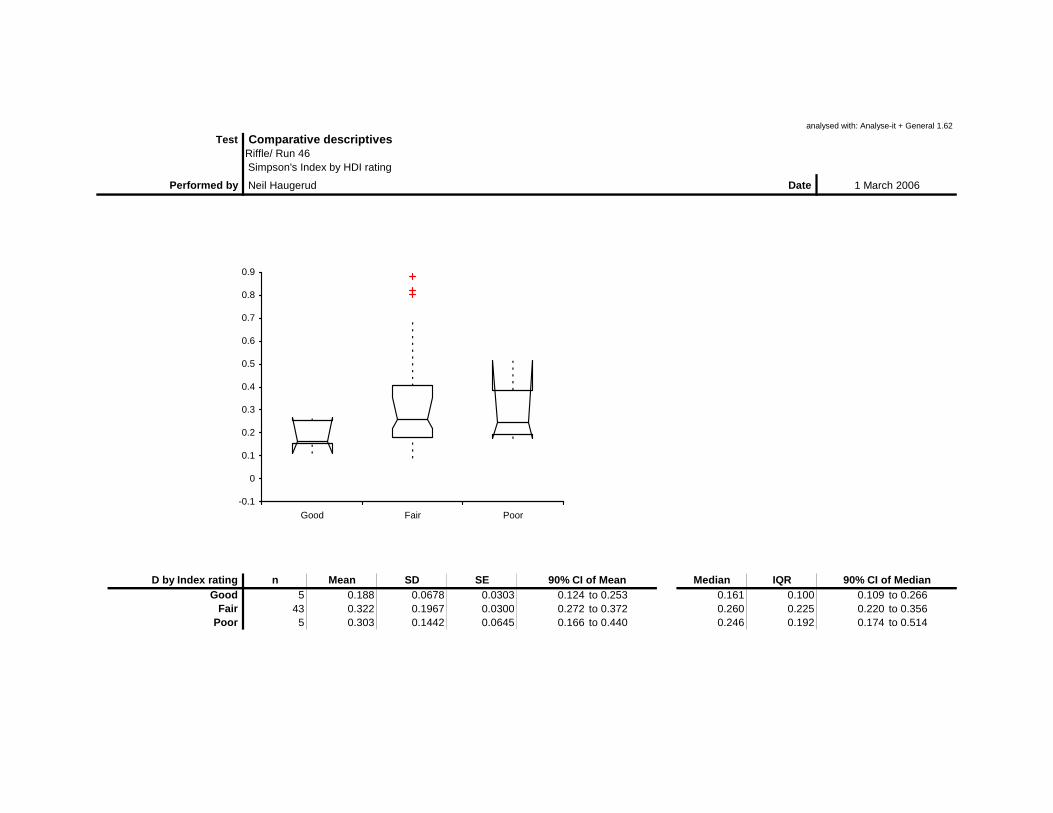
analysed with: Analyse-it + General 1.62
Test Comparative descriptivesRiffle/ Run 46 Simpson's Index by HDI rating
Performed by Neil Haugerud Date 1 March 2006
D by Index rating n Mean SD SE 90% CI of Mean Median IQR 90% CI of MedianGood 5 0.188 0.0678 0.0303 0.124 to 0.253 0.161 0.100 0.109 to 0.266
Fair 43 0.322 0.1967 0.0300 0.272 to 0.372 0.260 0.225 0.220 to 0.356Poor 5 0.303 0.1442 0.0645 0.166 to 0.440 0.246 0.192 0.174 to 0.514
-0.1
0
0.1
0.2
0.3
0.4
0.5
0.6
0.7
0.8
0.9
Good Fair Poor

analysed with: Analyse-it + General 1.62
Test Comparative descriptivesRiffle/ Run 46Percent Sprawlers by HDI rating
Performed by Neil Haugerud Date 1 March 2006
SprwlPct by Index rating n Mean SD SE 90% CI of Mean Median IQR 90% CI of MedianGood 5 5.195 4.1838 1.8711 1.206 to 9.183 4.361 3.655 0.435 to 11.498
Fair 43 5.732 7.6189 1.1619 3.778 to 7.686 3.419 7.186 1.397 to 5.202Poor 5 4.287 7.4006 3.3096 -2.768 to 11.343 1.587 1.224 0.000 to 17.460
-10
0
10
20
30
40
Good Fair Poor
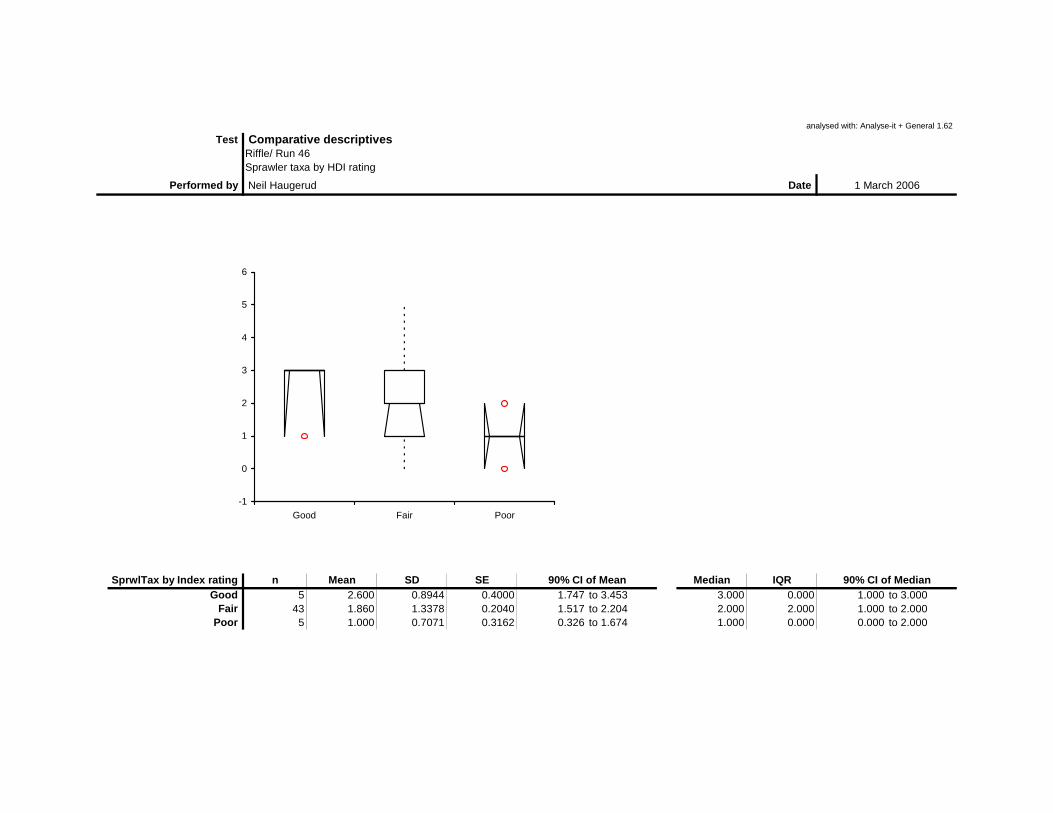
analysed with: Analyse-it + General 1.62
Test Comparative descriptivesRiffle/ Run 46Sprawler taxa by HDI rating
Performed by Neil Haugerud Date 1 March 2006
SprwlTax by Index rating n Mean SD SE 90% CI of Mean Median IQR 90% CI of MedianGood 5 2.600 0.8944 0.4000 1.747 to 3.453 3.000 0.000 1.000 to 3.000
Fair 43 1.860 1.3378 0.2040 1.517 to 2.204 2.000 2.000 1.000 to 2.000Poor 5 1.000 0.7071 0.3162 0.326 to 1.674 1.000 0.000 0.000 to 2.000
-1
0
1
2
3
4
5
6
Good Fair Poor

analysed with: Analyse-it + General 1.62
Test Comparative descriptivesRiffle/ Run 46Percent Swimmers by HDI rating
Performed by Neil Haugerud Date 1 March 2006
SwmmrPct by Index rating n Mean SD SE 90% CI of Mean Median IQR 90% CI of MedianGood 5 33.714 25.5933 11.4457 9.314 to 58.115 24.390 35.905 10.217 to 70.181
Fair 43 44.604 27.0951 4.1320 37.654 to 51.554 41.991 37.890 26.923 to 53.968Poor 5 51.064 22.9639 10.2698 29.170 to 72.958 47.302 31.992 21.642 to 77.416
-20
0
20
40
60
80
100
Good Fair Poor

analysed with: Analyse-it + General 1.62
Test Comparative descriptivesRiffle/ Run 46Swimmer taxa by HDI rating
Performed by Neil Haugerud Date 1 March 2006
SwmmrTax by Index rating n Mean SD SE 90% CI of Mean Median IQR 90% CI of MedianGood 5 6.000 2.3452 1.0488 3.764 to 8.236 7.000 4.000 3.000 to 8.000
Fair 43 5.698 2.9644 0.4521 4.937 to 6.458 5.000 3.500 4.000 to 6.000Poor 5 6.000 1.5811 0.7071 4.493 to 7.507 6.000 2.000 4.000 to 8.000
0
2
4
6
8
10
12
14
16
Good Fair Poor

analysed with: Analyse-it + General 1.62
Test Comparative descriptivesRiffle/ Run 46Percent Tolerant by HDI rating
Performed by Neil Haugerud Date 1 March 2006
TolerPct by Index rating n Mean SD SE 90% CI of Mean Median IQR 90% CI of MedianGood 5 35.092 18.3590 8.2104 17.588 to 52.595 37.979 21.745 9.565 to 56.325
Fair 43 49.046 27.3707 4.1740 42.026 to 56.067 53.943 49.648 33.437 to 60.694Poor 5 64.077 23.9801 10.7242 41.214 to 86.939 66.349 11.158 23.881 to 86.297
0
20
40
60
80
100
120
Good Fair Poor

analysed with: Analyse-it + General 1.62
Test Comparative descriptivesRiffle/ Run 46Tolerant taxa by HDI rating
Performed by Neil Haugerud Date 1 March 2006
TolerTax by Index rating n Mean SD SE 90% CI of Mean Median IQR 90% CI of MedianGood 5 9.400 3.3615 1.5033 6.195 to 12.605 10.000 5.000 5.000 to 13.000
Fair 43 7.628 2.5074 0.3824 6.985 to 8.271 7.000 3.000 6.000 to 9.000Poor 5 8.800 2.8636 1.2806 6.070 to 11.530 9.000 1.000 5.000 to 13.000
2
4
6
8
10
12
14
16
Good Fair Poor
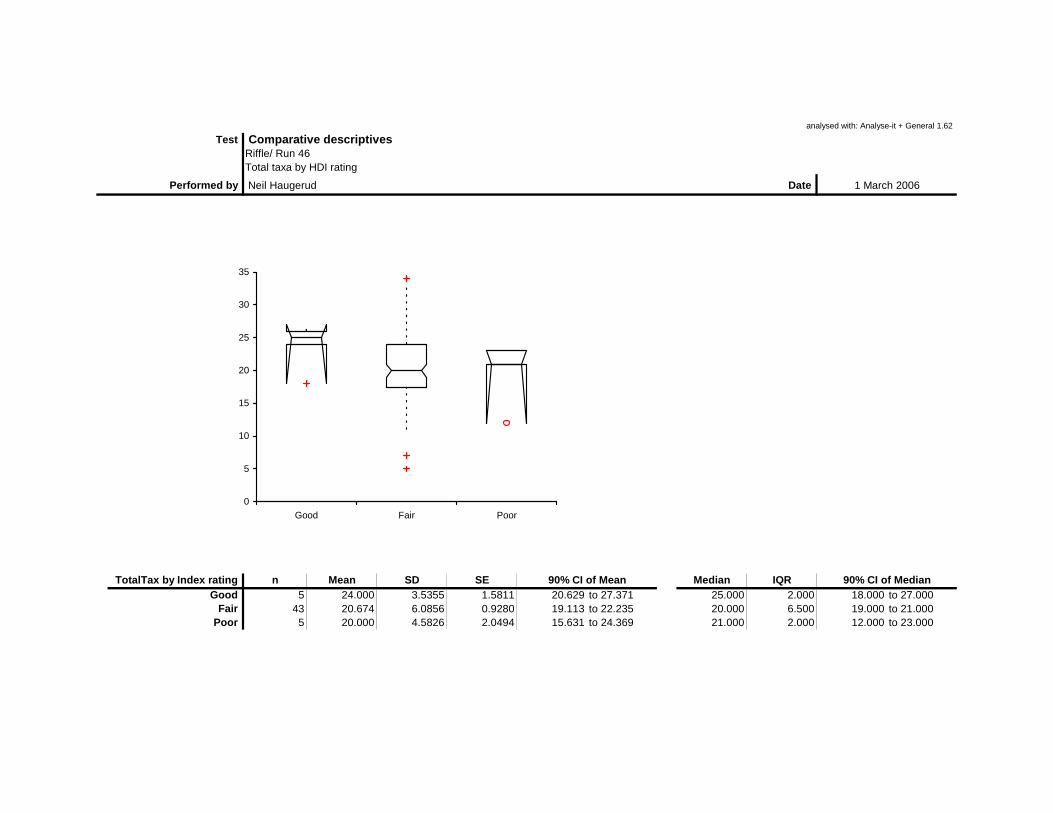
analysed with: Analyse-it + General 1.62
Test Comparative descriptivesRiffle/ Run 46Total taxa by HDI rating
Performed by Neil Haugerud Date 1 March 2006
TotalTax by Index rating n Mean SD SE 90% CI of Mean Median IQR 90% CI of MedianGood 5 24.000 3.5355 1.5811 20.629 to 27.371 25.000 2.000 18.000 to 27.000
Fair 43 20.674 6.0856 0.9280 19.113 to 22.235 20.000 6.500 19.000 to 21.000Poor 5 20.000 4.5826 2.0494 15.631 to 24.369 21.000 2.000 12.000 to 23.000
0
5
10
15
20
25
30
35
Good Fair Poor

analysed with: Analyse-it + General 1.62
Test Comparative descriptivesRiffle/ Run 46Percent Trichoptera by HDI rating
Performed by Neil Haugerud Date 1 March 2006
TrichPct by Index rating n Mean SD SE 90% CI of Mean Median IQR 90% CI of MedianGood 5 12.869 12.3933 5.5425 1.053 to 24.685 5.923 10.728 4.518 to 33.478
Fair 43 4.703 11.2329 1.7130 1.822 to 7.585 1.212 3.941 0.590 to 1.913Poor 5 2.230 3.8089 1.7034 -1.401 to 5.862 0.317 1.296 0.000 to 8.955
-20
-10
0
10
20
30
40
50
60
70
Good Fair Poor

analysed with: Analyse-it + General 1.62
Test Comparative descriptivesRiffle/ Run 46Trichoptera taxa by HDI rating
Performed by Neil Haugerud Date 1 March 2006
TrichTax by Index rating n Mean SD SE 90% CI of Mean Median IQR 90% CI of MedianGood 5 3.200 0.8367 0.3742 2.402 to 3.998 3.000 1.000 2.000 to 4.000
Fair 43 1.674 1.4095 0.2149 1.313 to 2.036 2.000 1.000 1.000 to 2.000Poor 5 1.200 1.0954 0.4899 0.156 to 2.244 1.000 0.000 0.000 to 3.000
-1
0
1
2
3
4
5
6
7
Good Fair Poor

analysed with: Analyse-it + General 1.62
Test Comparative descriptivesRiffle/ Run 46Percent Univoltine by HDI rating
Performed by Neil Haugerud Date 1 March 2006
UniVolPct by Index rating n Mean SD SE 90% CI of Mean Median IQR 90% CI of MedianGood 5 31.665 20.7737 9.2903 11.860 to 51.471 31.153 25.794 11.847 to 62.424
Fair 43 23.841 17.1648 2.6176 19.438 to 28.244 18.879 26.254 14.563 to 28.479Poor 5 40.083 30.3386 13.5678 11.159 to 69.008 40.952 58.089 9.304 to 72.388
-10
0
10
20
30
40
50
60
70
80
90
Good Fair Poor
Appendix E
Landscape Index Scores, Habitat Rankings, Habitat Scores and Raw Metric Scores

Table E-1. Landscape Index Scores Calculated Using the Analytical Tools Interface for Landscape Assessments (ATtILA, Version 3.0) for Glide/Pool Stream Reaches of the Northern Glaciated Plains Ecoregion (46) Within North Dakota for the Sites used in Metric Development.
Storet Number Stream Name
HDI Rank AGPSL3 AGCSL3 RAGC30 RNG30 RDDENS P_LOAD
Landscape Index Score
HDI Score
552007 Wintering River Good 5 1 1 20 5 3 35 138.3552021 Willow Creek Good 3 2 4 16 11 6 42 135.0552029 Snake Creek Good 5 2 1 16 7 4 35 157.3552031 Unnamed Tributary of Souris R. Good 7 1 1 20 3 9 41 136.8554005 Pipestem Creek Good 5 1 1 20 5 3 35 138.3
551207 Sheyenne River Poor 8 12 18 7 18 17 80 90.33 551215 Sheyenne River Poor 16 11 10 3 20 7 67 82.67 551216 Sheyenne River Poor 16 13 7 3 20 7 66 95.50 554026 Bear Creek Poor 7 9 13 6 12 18 65 91.33
551167 Maple River Fair 3 8 17 7 17 14 66 101.0551168 Maple River Fair 2 4 16 2 11 8 43 119.1551193 Sheyenne River Fair 13 6 10 9 4 13 55 115.6551194 Sheyenne River Fair 11 3 2 17 16 8 57 109.0551195 Sheyenne River Fair 11 7 1 8 17 16 60 112.5551197 Sheyenne River Fair 9 19 9 3 7 16 63 116.5551198 North Fork Sheyenne River Fair 13 12 9 6 5 16 61 112.6551200 Big Coulee Fair 8 7 6 8 5 17 51 116.0551201 Sheyenne River Fair 11 7 5 3 7 8 41 129.3551202 Sheyenne River Fair 10 16 10 3 3 4 46 119.6551203 Sheyenne River Fair 10 11 3 5 5 4 38 114.3551206 Sheyenne River Fair 11 12 10 1 9 1 44 125.3551210 Baldhill Creek Fair 10 9 11 1 5 3 39 134.0551212 Baldhill Creek Fair 5 8 15 3 14 14 59 121.3551214 Sheyenne River Fair 13 12 13 4 12 6 60 114.5552010 Deep Creek Little Fair 3 3 11 15 16 7 55 111.1552011 Deep River Fair 4 4 9 11 17 3 48 122.0552032 Souris River Fair 7 1 1 20 3 10 42 131.0552044 Souris River Fair 13 10 1 17 15 5 61 113.6552046 Souris River Fair 7 10 10 2 5 4 38 132.8

Table E-1. Continued Storet Number Stream Name
HDI Rank AGPSL3 AGCSL3 RAGC30 RNG30 RDDENS P_LOAD
Landscape Index Score
HDI Score
552011 Souris River Fair 5 2 1 20 19 13 60 114.00 551206 Pipestem Creek Fair 6 19 13 1 9 9 57 112.00 551210 James River Fair 2 8 15 3 14 17 59 100.33 551201 Elm River Fair 3 2 13 4 8 18 48 120.50 552032 South Fork Maple River Fair 4 4 15 6 8 18 55 120.17 552046 James River Fair 7 7 7 7 20 3 51 104.50
Table E-2. Landscape Index Scores Calculated Using the Analytical Tools Interface for Landscape Assessments (ATtILA, Version 3.0) for Glide/Pool Stream Reaches of the Northern Glaciated Plains Ecoregion (46) Within North Dakota for the Validation and Between-Year Revisit Sites.
Storet Number Stream Name Site Type
HDI Rank AGPSL3 AGCSL3 RAGC30 RNG30 RDDENS P_LOAD
Landscape Index Score
HDI Score
552041 Souris River Validation Poor 16 13 3 18 19 8 77 93.33 552022 Willow Creek Validation Good 1 1 4 9 11 4 30 146.00 551240 Sheyenne River Validation Fair 17 9 3 3 20 8 60 120.50 551211 Silver Creek Validation Fair 7 2 11 2 9 15 46 124.67 551208 Sheyenne River Validation Fair 12 17 16 6 6 12 69 102.00 552042 Souris River Validation Fair 12 14 4 20 10 10 70.00 100.67 551199 Sheyenne River Validation Fair 12 16 14 7 14 17 80.00 95.83 552005 Wintering River Validation Fair 10 6 1 20 13 11 61.00 113.67
551197 Sheyenne River Revisit Fair 9 19 9 3 7 16 63 116.50 551198 North Fork Sheyenne River Revisit Fair 13 12 9 6 5 16 61 112.67 551201 Sheyenne River Revisit Fair 11 7 5 3 7 8 41 129.33 551214 Sheyenne River Revisit Fair 13 12 13 4 12 6 60 114.50 551216 Sheyenne River Revisit Poor 16 13 7 3 20 7 66 95.50 552031 Unnamed Tributary of Souris R. Revisit Good 7 1 1 20 3 9 41 156.33 551215 Sheyenne River Revisit Poor 16 11 10 3 20 7 67 82.67
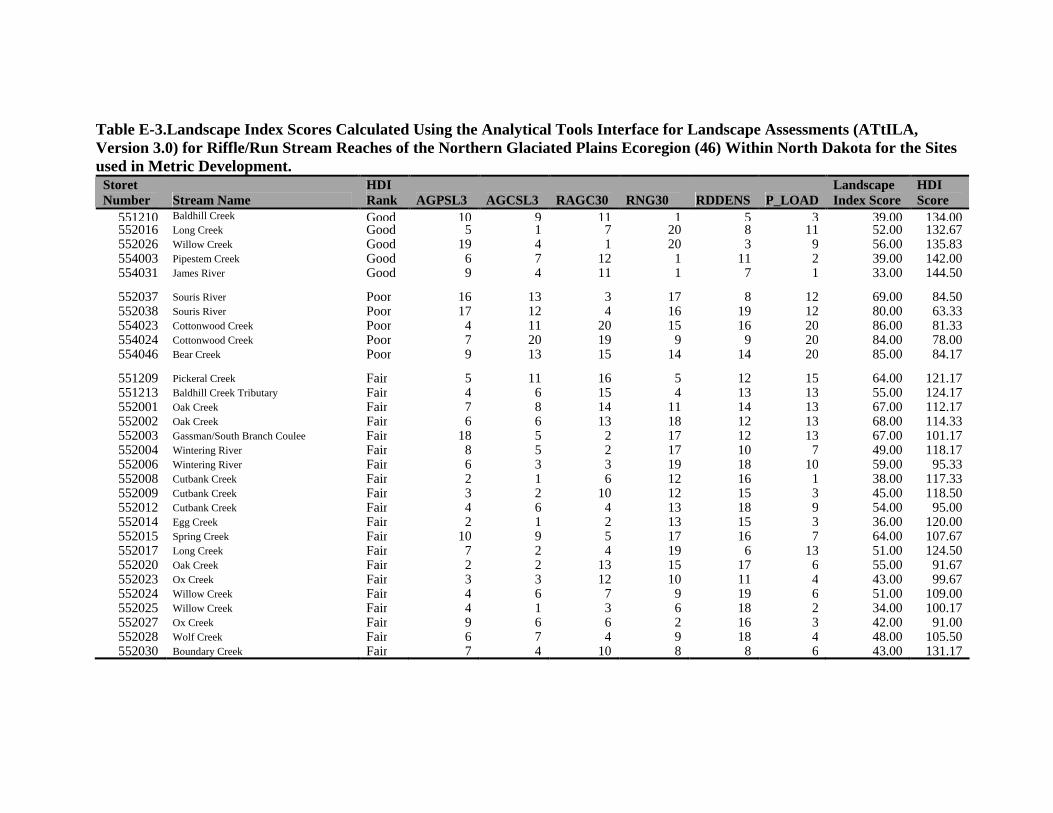
Table E-3.Landscape Index Scores Calculated Using the Analytical Tools Interface for Landscape Assessments (ATtILA, Version 3.0) for Riffle/Run Stream Reaches of the Northern Glaciated Plains Ecoregion (46) Within North Dakota for the Sites used in Metric Development.
Storet Number Stream Name
HDI Rank AGPSL3 AGCSL3 RAGC30 RNG30 RDDENS P_LOAD
Landscape Index Score
HDI Score
551210 Baldhill Creek Good 10 9 11 1 5 3 39.00 134.00 552016 Long Creek Good 5 1 7 20 8 11 52.00 132.67 552026 Willow Creek Good 19 4 1 20 3 9 56.00 135.83 554003 Pipestem Creek Good 6 7 12 1 11 2 39.00 142.00 554031 James River Good 9 4 11 1 7 1 33.00 144.50
552037 Souris River Poor 16 13 3 17 8 12 69.00 84.50 552038 Souris River Poor 17 12 4 16 19 12 80.00 63.33 554023 Cottonwood Creek Poor 4 11 20 15 16 20 86.00 81.33 554024 Cottonwood Creek Poor 7 20 19 9 9 20 84.00 78.00 554046 Bear Creek Poor 9 13 15 14 14 20 85.00 84.17
551209 Pickeral Creek Fair 5 11 16 5 12 15 64.00 121.17 551213 Baldhill Creek Tributary Fair 4 6 15 4 13 13 55.00 124.17 552001 Oak Creek Fair 7 8 14 11 14 13 67.00 112.17 552002 Oak Creek Fair 6 6 13 18 12 13 68.00 114.33 552003 Gassman/South Branch Coulee Fair 18 5 2 17 12 13 67.00 101.17 552004 Wintering River Fair 8 5 2 17 10 7 49.00 118.17 552006 Wintering River Fair 6 3 3 19 18 10 59.00 95.33 552008 Cutbank Creek Fair 2 1 6 12 16 1 38.00 117.33 552009 Cutbank Creek Fair 3 2 10 12 15 3 45.00 118.50 552012 Cutbank Creek Fair 4 6 4 13 18 9 54.00 95.00 552014 Egg Creek Fair 2 1 2 13 15 3 36.00 120.00 552015 Spring Creek Fair 10 9 5 17 16 7 64.00 107.67 552017 Long Creek Fair 7 2 4 19 6 13 51.00 124.50 552020 Oak Creek Fair 2 2 13 15 17 6 55.00 91.67 552023 Ox Creek Fair 3 3 12 10 11 4 43.00 99.67 552024 Willow Creek Fair 4 6 7 9 19 6 51.00 109.00 552025 Willow Creek Fair 4 1 3 6 18 2 34.00 100.17 552027 Ox Creek Fair 9 6 6 2 16 3 42.00 91.00 552028 Wolf Creek Fair 6 7 4 9 18 4 48.00 105.50 552030 Boundary Creek Fair 7 4 10 8 8 6 43.00 131.17

Table E-3. Continued Storet Number Stream Name
HDI Rank AGPSL3 AGCSL3 RAGC30 RNG30 RDDENS P_LOAD
Landscape Index Score
HDI Score
552033 Souris River Fair 13 9 2 20 13 7 64.00 114.67 552034 Des Lacs River Fair 16 10 8 16 10 10 70.00 95.67 552036 Souris River Fair 13 14 6 18 15 8 74.00 87.33 552040 Souris River Fair 14 15 2 19 17 9 76.00 100.67 552043 Souris River Fair 7 1 5 16 5 4 38.00 130.33 554001 James River Fair 12 17 14 2 3 5 53.00 120.83 554007 Pipestem Creek Fair 7 15 12 2 11 3 50.00 113.83 554008 James River Fair 5 10 15 2 13 11 56.00 111.83 554010 James River Fair 5 16 14 6 13 17 71.00 87.83 554012 James River Fair 4 3 8 6 15 6 42.00 129.00 554013 Beaver Creek Fair 6 13 13 4 6 6 48.00 116.50 554015 Bone Hill Creek Fair 4 15 19 11 17 20 86.00 95.83 554016 Streaman Coulee Fair 10 13 14 3 13 18 71.00 113.83 554017 Elm River Fair 6 3 7 4 13 17 50.00 127.83 554020 South Fork Maple River Fair 5 14 18 5 8 18 68.00 99.83 554021 Maple River Fair 3 8 15 4 11 20 61.00 113.67 554022 Maple River Fair 4 15 19 11 10 20 79.00 102.67 554025 Cottonwood Creek Fair 6 17 19 15 3 20 80.00 104.33 554027 Bear Creek Fair 9 15 15 14 14 20 87.00 95.00 554028 Bear Creek Fair 6 7 18 12 14 19 76.00 96.17 554029 Sevenmile Coulee Fair 10 5 12 2 15 1 45.00 97.00 554030 Sevenmile Coulee Fair 10 5 12 2 15 1 45.00 118.00 554042 Bone Hill Creek Fair 10 16 14 13 8 19 80.00 92.83

Table E-4. Landscape Index Scores Calculated Using the Analytical Tools Interface for Landscape Assessments (ATtILA, Version 3.0) for Riffle/Run Stream Reaches of the Northern Glaciated Plains Ecoregion (46) Within North Dakota for the Validation, Between-Year Revisit (BY-Revisit) Sites and Within-Year Revisit (WY-Revisit) Sites.
Storet Number Stream Name Site Type
HDI Rank AGPSL3 AGCSL3 RAGC30 RNG30 RDDENS P_LOAD
Landscape Index Score
HDI Score
554002 Kelly Creek Validation Good 11 17 3 1 6 4 42.00 140.00 554014 Beaver Creek Validation Poor 10 18 16 13 3 19 79.00 84.67 552018 Oak Creek Validation Fair 15 12 1 20 4 5 57.00 110.00 552045 Des Lacs River Validation Fair 16 6 7 19 16 11 75.00 88.50 552035 Des Lacs River Validation Fair 17 10 12 19 8 11 77.00 90.33 552019 Oak Creek Validation Fair 3 2 13 17 10 12 57.00 110.50 552013 Cutbank Creek Validation Fair 4 1 3 3 14 4 29.00 100.33 552039 Souris River Validation Fair 14 15 2 19 17 9 76.00 100.67
551185 Sheyenne River BY-Revisit Fair 9 9 11 5 20 6 60.00 128.00 552001 Oak Creek BY-Revisit Fair 7 8 14 11 14 13 67.00 112.17 552004 Wintering River BY-Revisit Fair 8 5 2 17 10 7 49.00 118.17 552040 Souris River BY-Revisit Fair 15 8 2 16 17 9 67.00 105.67 554007 Pipestem Creek BY-Revisit Fair 7 15 12 2 11 3 50.00 113.83 554013 Beaver Creek BY-Revisit Fair 6 13 13 4 6 6 48.00 116.50 554020 S. Fork Maple River BY-Revisit Fair 5 14 18 5 8 18 68.00 99.83 554021 Maple River BY-Revisit Fair 3 8 15 4 11 20 61.00 113.67 554023 Cottonwood Creek BY-Revisit Poor 4 11 20 15 16 20 86.00 81.33
551185 Sheyenne River WY-Revisit Fair 9 9 11 5 20 6 60.00 128.00 552004 Wintering River WY-Revisit Fair 8 5 2 17 10 7 49.00 118.17 554013 Beaver Creek WY-Revisit Fair 6 13 13 4 6 6 48.00 116.50 554021 Maple River WY-Revisit Fair 3 8 15 4 11 20 61.00 113.67 554031 James River WY-Revisit Good 9 4 11 1 7 1 33.00 144.50
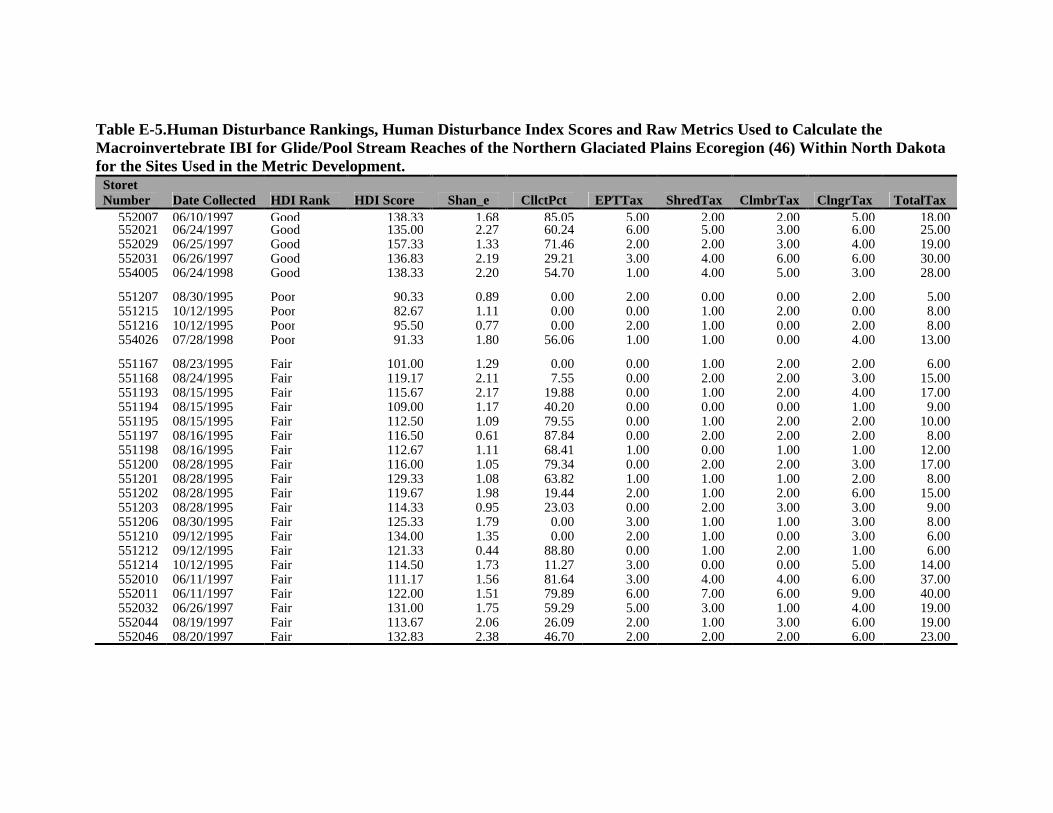
Table E-5.Human Disturbance Rankings, Human Disturbance Index Scores and Raw Metrics Used to Calculate the Macroinvertebrate IBI for Glide/Pool Stream Reaches of the Northern Glaciated Plains Ecoregion (46) Within North Dakota for the Sites Used in the Metric Development.
Storet Number Date Collected HDI Rank HDI Score Shan_e CllctPct EPTTax ShredTax ClmbrTax ClngrTax TotalTax
552007 06/10/1997 Good 138.33 1.68 85.05 5.00 2.00 2.00 5.00 18.00 552021 06/24/1997 Good 135.00 2.27 60.24 6.00 5.00 3.00 6.00 25.00 552029 06/25/1997 Good 157.33 1.33 71.46 2.00 2.00 3.00 4.00 19.00 552031 06/26/1997 Good 136.83 2.19 29.21 3.00 4.00 6.00 6.00 30.00 554005 06/24/1998 Good 138.33 2.20 54.70 1.00 4.00 5.00 3.00 28.00
551207 08/30/1995 Poor 90.33 0.89 0.00 2.00 0.00 0.00 2.00 5.00 551215 10/12/1995 Poor 82.67 1.11 0.00 0.00 1.00 2.00 0.00 8.00 551216 10/12/1995 Poor 95.50 0.77 0.00 2.00 1.00 0.00 2.00 8.00 554026 07/28/1998 Poor 91.33 1.80 56.06 1.00 1.00 0.00 4.00 13.00
551167 08/23/1995 Fair 101.00 1.29 0.00 0.00 1.00 2.00 2.00 6.00 551168 08/24/1995 Fair 119.17 2.11 7.55 0.00 2.00 2.00 3.00 15.00 551193 08/15/1995 Fair 115.67 2.17 19.88 0.00 1.00 2.00 4.00 17.00 551194 08/15/1995 Fair 109.00 1.17 40.20 0.00 0.00 0.00 1.00 9.00 551195 08/15/1995 Fair 112.50 1.09 79.55 0.00 1.00 2.00 2.00 10.00 551197 08/16/1995 Fair 116.50 0.61 87.84 0.00 2.00 2.00 2.00 8.00 551198 08/16/1995 Fair 112.67 1.11 68.41 1.00 0.00 1.00 1.00 12.00 551200 08/28/1995 Fair 116.00 1.05 79.34 0.00 2.00 2.00 3.00 17.00 551201 08/28/1995 Fair 129.33 1.08 63.82 1.00 1.00 1.00 2.00 8.00 551202 08/28/1995 Fair 119.67 1.98 19.44 2.00 1.00 2.00 6.00 15.00 551203 08/28/1995 Fair 114.33 0.95 23.03 0.00 2.00 3.00 3.00 9.00 551206 08/30/1995 Fair 125.33 1.79 0.00 3.00 1.00 1.00 3.00 8.00 551210 09/12/1995 Fair 134.00 1.35 0.00 2.00 1.00 0.00 3.00 6.00 551212 09/12/1995 Fair 121.33 0.44 88.80 0.00 1.00 2.00 1.00 6.00 551214 10/12/1995 Fair 114.50 1.73 11.27 3.00 0.00 0.00 5.00 14.00 552010 06/11/1997 Fair 111.17 1.56 81.64 3.00 4.00 4.00 6.00 37.00 552011 06/11/1997 Fair 122.00 1.51 79.89 6.00 7.00 6.00 9.00 40.00 552032 06/26/1997 Fair 131.00 1.75 59.29 5.00 3.00 1.00 4.00 19.00 552044 08/19/1997 Fair 113.67 2.06 26.09 2.00 1.00 3.00 6.00 19.00 552046 08/20/1997 Fair 132.83 2.38 46.70 2.00 2.00 2.00 6.00 23.00

Table E-5. Continued Storet Number Date Collected HDI Rank HDI Score Shan_e CllctPct EPTTax ShredTax ClmbrTax ClngrTax TotalTax
552011 08/20/1997 Fair 114.00 0.86 69.59 2.00 3.00 3.00 2.00 17.00 551206 06/24/1998 Fair 112.00 2.51 56.17 3.00 5.00 4.00 4.00 31.00 551210 07/01/1998 Fair 100.33 1.55 23.63 1.00 2.00 1.00 3.00 20.00 551201 07/15/1998 Fair 120.50 2.33 63.61 3.00 2.00 4.00 5.00 30.00 552032 07/15/1998 Fair 120.17 2.67 36.50 3.00 1.00 3.00 7.00 30.00 552046 08/17/1998 Fair 104.50 0.98 6.19 2.00 1.00 1.00 1.00 9.00
Table E-6. Human Disturbance Rankings, Human Disturbance Index Scores and Raw Metrics Used to Calculate the Macroinvertebrate IBI for Glide/Pool Stream Reaches of the Northern Glaciated Plains Ecoregion (46) Within North Dakota for the Validation and Between-Year Revisit Sites.
Storet Number
Date Collected Site Type
HDI Rank
HDI Score Shan_e CllctPct EPTTax ShredTax ClmbrTax ClngrTax TotalTax
552041 08/18/1997 Validation Poor 93.33 1.19 75.80 1.00 3.00 3.00 6.00 26.00 552022 06/24/1997 Validation Good 146.0 1.96 71.11 4.00 4.00 3.00 1.00 25.00 551240 08/21/2002 Validation Fair 120.5 2.22 68.47 6.00 3.00 3.00 9.00 35.00 551211 09/12/1995 Validation Fair 124.6 1.81 15.96 0.00 1.00 3.00 2.00 12.00 551208 08/30/1995 Validation Fair 102.0 0.65 0.00 0.00 1.00 0.00 0.00 2.00 552042 08/18/1997 Validation Fair 100.6 2.02 29.17 8.00 2.00 0.00 7.00 18.00 551199 08/16/1995 Validation Fair 95.83 1.22 71.68 0.00 1.00 1.00 5.00 13.00 552005 06/10/1997 Validation Fair 113.6 1.95 54.44 1.00 0.00 2.00 6.00 22.00
551197 08/16/1995 Revisit Fair 116.5 1.64 93.71 3.00 1.00 3.00 1.00 19.00 551197 08/16/1995 Revisit Fair 116.5 0.97 95.07 2.00 0.00 1.00 3.00 13.00 551198 08/16/1995 Revisit Fair 112.6 0.99 92.57 2.00 0.00 2.00 1.00 18.00 551198 08/16/1995 Revisit Fair 112.6 1.02 96.74 2.00 0.00 0.00 0.00 10.00 551201 08/28/1995 Revisit Fair 129.3 1.51 86.44 5.00 0.00 1.00 6.00 17.00 551201 08/28/1995 Revisit Fair 129.3 2.39 69.41 10.00 1.00 0.00 12.00 25.00 551214 10/12/1995 Revisit Fair 114.5 1.73 11.27 3.00 0.00 0.00 5.00 14.00 551214 09/17/1996 Revisit Fair 114.5 2.45 58.87 10.00 0.00 3.00 11.00 24.00 551216 09/18/1996 Revisit Poor 95.5 0.77 0.00 2.00 1.00 0.00 2.00 8.00 551216 10/23/1995 Revisit Poor 95.5 2.54 31.00 8.00 0.00 1.00 7.00 23.00 552031 08/12/1998 Revisit Good 136.8 2.19 29.21 3.00 4.00 6.00 6.00 30.00 552031 10/27/1997 Revisit Good 156.3 1.25 74.80 1.00 2.00 4.00 3.00 18.00 551215 10/17/1995 Revisit Poor 82.67 1.11 0.00 0.00 1.00 2.00 0.00 8.00 551215 10/17/1995 Revisit Poor 82.67 2.33 24.49 3.00 0.00 3.00 4.00 16.00
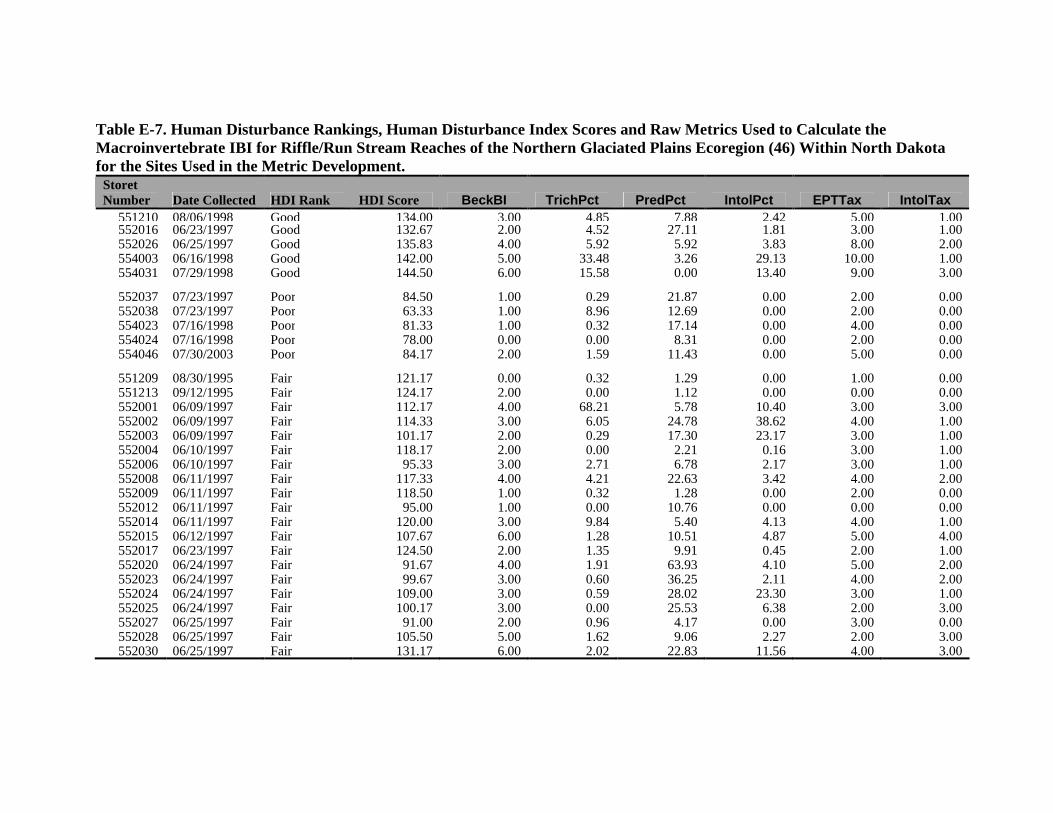
Table E-7. Human Disturbance Rankings, Human Disturbance Index Scores and Raw Metrics Used to Calculate the Macroinvertebrate IBI for Riffle/Run Stream Reaches of the Northern Glaciated Plains Ecoregion (46) Within North Dakota for the Sites Used in the Metric Development.
Storet Number Date Collected HDI Rank HDI Score BeckBI TrichPct PredPct IntolPct EPTTax IntolTax
551210 08/06/1998 Good 134.00 3.00 4.85 7.88 2.42 5.00 1.00 552016 06/23/1997 Good 132.67 2.00 4.52 27.11 1.81 3.00 1.00 552026 06/25/1997 Good 135.83 4.00 5.92 5.92 3.83 8.00 2.00 554003 06/16/1998 Good 142.00 5.00 33.48 3.26 29.13 10.00 1.00 554031 07/29/1998 Good 144.50 6.00 15.58 0.00 13.40 9.00 3.00
552037 07/23/1997 Poor 84.50 1.00 0.29 21.87 0.00 2.00 0.00 552038 07/23/1997 Poor 63.33 1.00 8.96 12.69 0.00 2.00 0.00 554023 07/16/1998 Poor 81.33 1.00 0.32 17.14 0.00 4.00 0.00 554024 07/16/1998 Poor 78.00 0.00 0.00 8.31 0.00 2.00 0.00 554046 07/30/2003 Poor 84.17 2.00 1.59 11.43 0.00 5.00 0.00
551209 08/30/1995 Fair 121.17 0.00 0.32 1.29 0.00 1.00 0.00 551213 09/12/1995 Fair 124.17 2.00 0.00 1.12 0.00 0.00 0.00 552001 06/09/1997 Fair 112.17 4.00 68.21 5.78 10.40 3.00 3.00 552002 06/09/1997 Fair 114.33 3.00 6.05 24.78 38.62 4.00 1.00 552003 06/09/1997 Fair 101.17 2.00 0.29 17.30 23.17 3.00 1.00 552004 06/10/1997 Fair 118.17 2.00 0.00 2.21 0.16 3.00 1.00 552006 06/10/1997 Fair 95.33 3.00 2.71 6.78 2.17 3.00 1.00 552008 06/11/1997 Fair 117.33 4.00 4.21 22.63 3.42 4.00 2.00 552009 06/11/1997 Fair 118.50 1.00 0.32 1.28 0.00 2.00 0.00 552012 06/11/1997 Fair 95.00 1.00 0.00 10.76 0.00 0.00 0.00 552014 06/11/1997 Fair 120.00 3.00 9.84 5.40 4.13 4.00 1.00 552015 06/12/1997 Fair 107.67 6.00 1.28 10.51 4.87 5.00 4.00 552017 06/23/1997 Fair 124.50 2.00 1.35 9.91 0.45 2.00 1.00 552020 06/24/1997 Fair 91.67 4.00 1.91 63.93 4.10 5.00 2.00 552023 06/24/1997 Fair 99.67 3.00 0.60 36.25 2.11 4.00 2.00 552024 06/24/1997 Fair 109.00 3.00 0.59 28.02 23.30 3.00 1.00 552025 06/24/1997 Fair 100.17 3.00 0.00 25.53 6.38 2.00 3.00 552027 06/25/1997 Fair 91.00 2.00 0.96 4.17 0.00 3.00 0.00 552028 06/25/1997 Fair 105.50 5.00 1.62 9.06 2.27 2.00 3.00 552030 06/25/1997 Fair 131.17 6.00 2.02 22.83 11.56 4.00 3.00
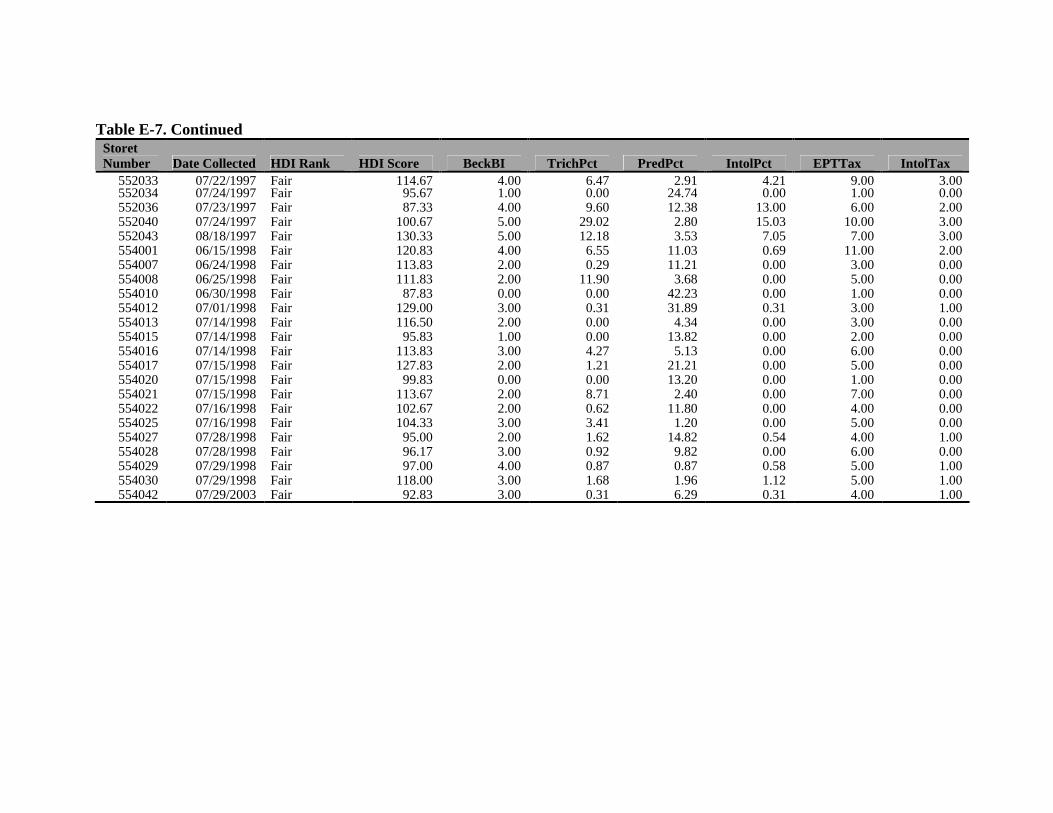
Table E-7. Continued Storet Number Date Collected HDI Rank HDI Score BeckBI TrichPct PredPct IntolPct EPTTax IntolTax
552033 07/22/1997 Fair 114.67 4.00 6.47 2.91 4.21 9.00 3.00 552034 07/24/1997 Fair 95.67 1.00 0.00 24.74 0.00 1.00 0.00 552036 07/23/1997 Fair 87.33 4.00 9.60 12.38 13.00 6.00 2.00 552040 07/24/1997 Fair 100.67 5.00 29.02 2.80 15.03 10.00 3.00 552043 08/18/1997 Fair 130.33 5.00 12.18 3.53 7.05 7.00 3.00 554001 06/15/1998 Fair 120.83 4.00 6.55 11.03 0.69 11.00 2.00 554007 06/24/1998 Fair 113.83 2.00 0.29 11.21 0.00 3.00 0.00 554008 06/25/1998 Fair 111.83 2.00 11.90 3.68 0.00 5.00 0.00 554010 06/30/1998 Fair 87.83 0.00 0.00 42.23 0.00 1.00 0.00 554012 07/01/1998 Fair 129.00 3.00 0.31 31.89 0.31 3.00 1.00 554013 07/14/1998 Fair 116.50 2.00 0.00 4.34 0.00 3.00 0.00 554015 07/14/1998 Fair 95.83 1.00 0.00 13.82 0.00 2.00 0.00 554016 07/14/1998 Fair 113.83 3.00 4.27 5.13 0.00 6.00 0.00 554017 07/15/1998 Fair 127.83 2.00 1.21 21.21 0.00 5.00 0.00 554020 07/15/1998 Fair 99.83 0.00 0.00 13.20 0.00 1.00 0.00 554021 07/15/1998 Fair 113.67 2.00 8.71 2.40 0.00 7.00 0.00 554022 07/16/1998 Fair 102.67 2.00 0.62 11.80 0.00 4.00 0.00 554025 07/16/1998 Fair 104.33 3.00 3.41 1.20 0.00 5.00 0.00 554027 07/28/1998 Fair 95.00 2.00 1.62 14.82 0.54 4.00 1.00 554028 07/28/1998 Fair 96.17 3.00 0.92 9.82 0.00 6.00 0.00 554029 07/29/1998 Fair 97.00 4.00 0.87 0.87 0.58 5.00 1.00 554030 07/29/1998 Fair 118.00 3.00 1.68 1.96 1.12 5.00 1.00 554042 07/29/2003 Fair 92.83 3.00 0.31 6.29 0.31 4.00 1.00
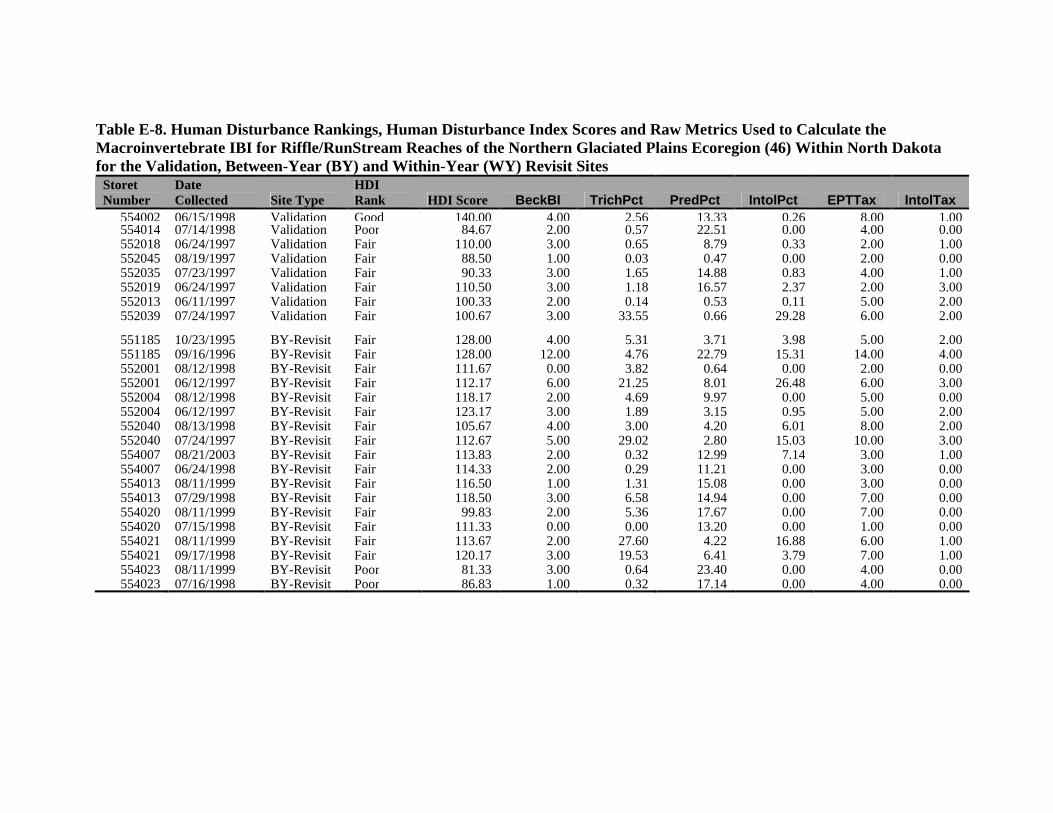
Table E-8. Human Disturbance Rankings, Human Disturbance Index Scores and Raw Metrics Used to Calculate the Macroinvertebrate IBI for Riffle/RunStream Reaches of the Northern Glaciated Plains Ecoregion (46) Within North Dakota for the Validation, Between-Year (BY) and Within-Year (WY) Revisit Sites
Storet Number
Date Collected Site Type
HDI Rank HDI Score BeckBI TrichPct PredPct IntolPct EPTTax IntolTax
554002 06/15/1998 Validation Good 140.00 4.00 2.56 13.33 0.26 8.00 1.00 554014 07/14/1998 Validation Poor 84.67 2.00 0.57 22.51 0.00 4.00 0.00 552018 06/24/1997 Validation Fair 110.00 3.00 0.65 8.79 0.33 2.00 1.00 552045 08/19/1997 Validation Fair 88.50 1.00 0.03 0.47 0.00 2.00 0.00 552035 07/23/1997 Validation Fair 90.33 3.00 1.65 14.88 0.83 4.00 1.00 552019 06/24/1997 Validation Fair 110.50 3.00 1.18 16.57 2.37 2.00 3.00 552013 06/11/1997 Validation Fair 100.33 2.00 0.14 0.53 0.11 5.00 2.00 552039 07/24/1997 Validation Fair 100.67 3.00 33.55 0.66 29.28 6.00 2.00
551185 10/23/1995 BY-Revisit Fair 128.00 4.00 5.31 3.71 3.98 5.00 2.00 551185 09/16/1996 BY-Revisit Fair 128.00 12.00 4.76 22.79 15.31 14.00 4.00 552001 08/12/1998 BY-Revisit Fair 111.67 0.00 3.82 0.64 0.00 2.00 0.00 552001 06/12/1997 BY-Revisit Fair 112.17 6.00 21.25 8.01 26.48 6.00 3.00 552004 08/12/1998 BY-Revisit Fair 118.17 2.00 4.69 9.97 0.00 5.00 0.00 552004 06/12/1997 BY-Revisit Fair 123.17 3.00 1.89 3.15 0.95 5.00 2.00 552040 08/13/1998 BY-Revisit Fair 105.67 4.00 3.00 4.20 6.01 8.00 2.00 552040 07/24/1997 BY-Revisit Fair 112.67 5.00 29.02 2.80 15.03 10.00 3.00 554007 08/21/2003 BY-Revisit Fair 113.83 2.00 0.32 12.99 7.14 3.00 1.00 554007 06/24/1998 BY-Revisit Fair 114.33 2.00 0.29 11.21 0.00 3.00 0.00 554013 08/11/1999 BY-Revisit Fair 116.50 1.00 1.31 15.08 0.00 3.00 0.00 554013 07/29/1998 BY-Revisit Fair 118.50 3.00 6.58 14.94 0.00 7.00 0.00 554020 08/11/1999 BY-Revisit Fair 99.83 2.00 5.36 17.67 0.00 7.00 0.00 554020 07/15/1998 BY-Revisit Fair 111.33 0.00 0.00 13.20 0.00 1.00 0.00 554021 08/11/1999 BY-Revisit Fair 113.67 2.00 27.60 4.22 16.88 6.00 1.00 554021 09/17/1998 BY-Revisit Fair 120.17 3.00 19.53 6.41 3.79 7.00 1.00 554023 08/11/1999 BY-Revisit Poor 81.33 3.00 0.64 23.40 0.00 4.00 0.00 554023 07/16/1998 BY-Revisit Poor 86.83 1.00 0.32 17.14 0.00 4.00 0.00

Table E-8. Continued Storet Number
Date Collected Site Type
HDI Rank HDI Score BeckBI TrichPct PredPct IntolPct EPTTax IntolTax
551185 09/16/1996 WY-Revisit Fair 128.00 12.00 4.76 22.79 15.31 14.00 4.00 551185 08/26/1996 WY-Revisit Fair 128.00 14.00 3.94 15.77 13.98 18.00 6.00 552004 06/10/1997 WY-Revisit Fair 123.17 2.00 0.00 2.21 0.16 3.00 1.00 552004 06/12/1997 WY-Revisit Fair 123.17 3.00 1.89 3.15 0.95 5.00 2.00 554013 07/14/1998 WY-Revisit Fair 117.00 2.00 0.00 4.34 0.00 3.00 0.00 554013 07/29/1998 WY-Revisit Fair 118.50 3.00 6.58 14.94 0.00 7.00 0.00 554021 07/15/1998 WY-Revisit Fair 120.17 2.00 8.71 2.40 0.00 7.00 0.00 554021 09/17/1998 WY-Revisit Fair 120.17 3.00 19.53 6.41 3.79 7.00 1.00 554031 07/29/1998 WY-Revisit Good 144.50 6.00 15.58 0.00 13.40 9.00 3.00 554031 09/16/1998 WY-Revisit Good 144.50 5.00 22.80 4.74 16.25 6.00 1.00
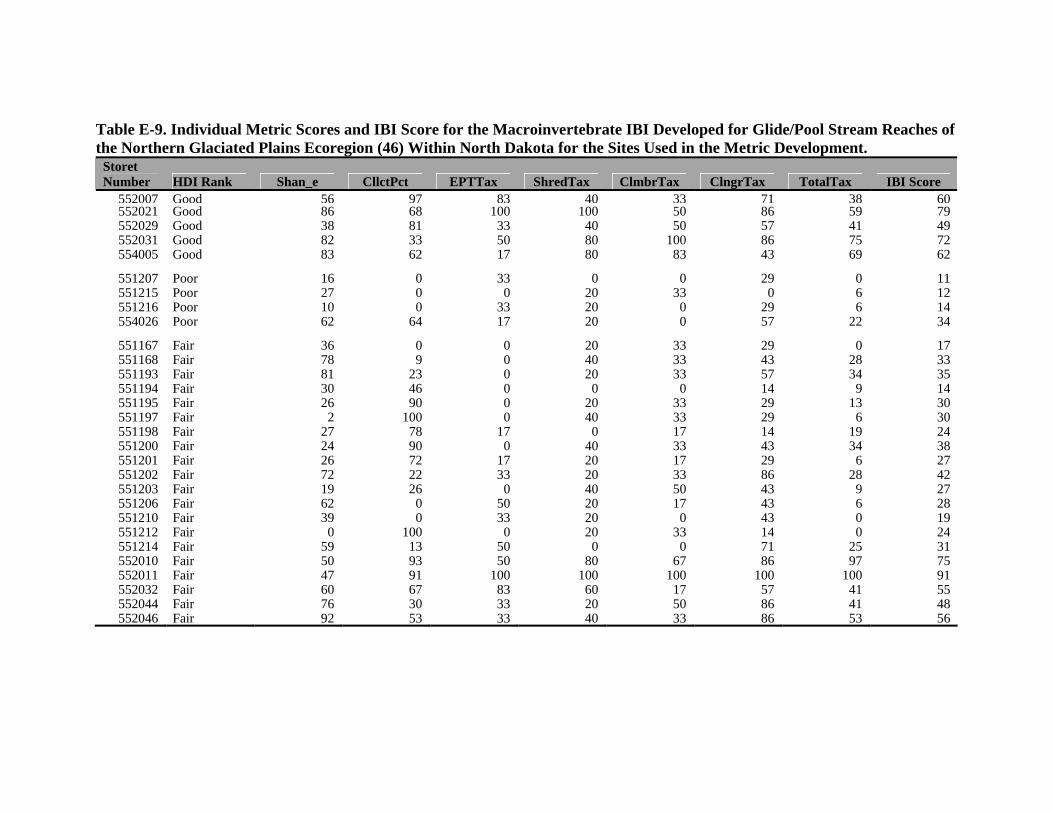
Table E-9. Individual Metric Scores and IBI Score for the Macroinvertebrate IBI Developed for Glide/Pool Stream Reaches of the Northern Glaciated Plains Ecoregion (46) Within North Dakota for the Sites Used in the Metric Development.
Storet Number HDI Rank Shan_e CllctPct EPTTax ShredTax ClmbrTax ClngrTax TotalTax IBI Score
552007 Good 56 97 83 40 33 71 38 60 552021 Good 86 68 100 100 50 86 59 79 552029 Good 38 81 33 40 50 57 41 49 552031 Good 82 33 50 80 100 86 75 72 554005 Good 83 62 17 80 83 43 69 62
551207 Poor 16 0 33 0 0 29 0 11 551215 Poor 27 0 0 20 33 0 6 12 551216 Poor 10 0 33 20 0 29 6 14 554026 Poor 62 64 17 20 0 57 22 34
551167 Fair 36 0 0 20 33 29 0 17 551168 Fair 78 9 0 40 33 43 28 33 551193 Fair 81 23 0 20 33 57 34 35 551194 Fair 30 46 0 0 0 14 9 14 551195 Fair 26 90 0 20 33 29 13 30 551197 Fair 2 100 0 40 33 29 6 30 551198 Fair 27 78 17 0 17 14 19 24 551200 Fair 24 90 0 40 33 43 34 38 551201 Fair 26 72 17 20 17 29 6 27 551202 Fair 72 22 33 20 33 86 28 42 551203 Fair 19 26 0 40 50 43 9 27 551206 Fair 62 0 50 20 17 43 6 28 551210 Fair 39 0 33 20 0 43 0 19 551212 Fair 0 100 0 20 33 14 0 24 551214 Fair 59 13 50 0 0 71 25 31 552010 Fair 50 93 50 80 67 86 97 75 552011 Fair 47 91 100 100 100 100 100 91 552032 Fair 60 67 83 60 17 57 41 55 552044 Fair 76 30 33 20 50 86 41 48 552046 Fair 92 53 33 40 33 86 53 56

Table E-9. Continued Storet Number HDI Rank Shan_e CllctPct EPTTax ShredTax ClmbrTax ClngrTax TotalTax IBI Score
552011 Fair 14 79 33 60 50 29 34 43 551206 Fair 98 64 50 100 67 57 78 73 551210 Fair 50 27 17 40 17 43 44 34 551201 Fair 89 72 50 40 67 71 75 66 552032 Fair 100 41 50 20 50 100 75 62 552046 Fair 20 7 33 20 17 14 9 17
Table E-10. Individual Metric Scores and IBI Score for the Macroinvertebrate IBI Developed for Glide/Pool Stream Reaches of the Northern Glaciated Plains Ecoregion (46) Within North Dakota for the Validation and Between-Year Revisit Sites.
Storet Number
Date Collected Site Type
HDI Rank Shan_e CllctPct EPTTax ShredTax ClmbrTax ClngrTax TotalTax
IBI Score
552041 08/18/1997 Validation Poor 31 86 17 60 50 86 63 56 552022 06/24/1997 Validation Good 71 81 67 80 50 14 59 60 551240 08/21/2002 Validation Fair 84 78 100 60 50 100 91 80 551211 09/12/1995 Validation Fair 63 18 0 20 50 29 19 28 551208 08/30/1995 Validation Fair 3 0 0 20 0 0 0 3 552042 08/18/1997 Validation Fair 74 33 100 40 0 100 38 55 551199 08/16/1995 Validation Fair 33 81 0 20 17 71 22 35 552005 06/10/1997 Validation Fair 70 62 17 0 33 86 50 45
551197 08/16/1995 Revisit Fair 54 100 50 20 50 14 41 47 551197 08/16/1995 Revisit Fair 20 100 33 0 17 43 22 34 551198 08/16/1995 Revisit Fair 21 100 33 0 33 14 38 34 551198 08/16/1995 Revisit Fair 23 100 33 0 0 0 13 24 551201 08/28/1995 Revisit Fair 47 98 83 0 17 86 34 52 551201 08/28/1995 Revisit Fair 92 79 100 20 0 100 59 64 551214 10/12/1995 Revisit Fair 59 13 50 0 0 71 25 31 551214 09/17/1996 Revisit Fair 95 67 100 0 50 100 56 67 551216 09/18/1996 Revisit Poor 10 0 33 20 0 29 6 14 551216 10/23/1995 Revisit Poor 100 35 100 0 17 100 53 58 552031 08/12/1998 Revisit Good 82 33 50 80 100 86 75 72 552031 10/27/1997 Revisit Good 34 85 17 40 67 43 38 46 551215 10/17/1995 Revisit Poor 27 0 0 20 33 0 6 12 551215 10/17/1995 Revisit Poor 89 28 50 0 50 57 31 44

Table E-11. Storet Number HDI Rank BeckBI TrichPct PredPct IntolPct EPTTax IntolTax IBI Score
551210 Good 50 16 82 10 50 33 40 552016 Good 33 15 30 7 30 33 25 552026 Good 67 20 87 15 80 67 56 554003 Good 83 100 94 100 100 33 85 554031 Good 100 51 100 53 90 100 82
552037 Poor 17 1 44 0 20 0 14 552038 Poor 17 29 69 0 20 0 22 554023 Poor 17 1 56 0 40 0 19 554024 Poor 0 0 80 0 20 0 17 554046 Poor 33 5 72 0 50 0 27
551209 Fair 0 1 99 0 10 0 18 551213 Fair 33 0 100 0 0 0 22 552001 Fair 67 100 87 42 30 100 71 552002 Fair 50 20 36 100 40 33 47 552003 Fair 33 1 56 92 30 33 41 552004 Fair 33 0 97 1 30 33 32 552006 Fair 50 9 85 9 30 33 36 552008 Fair 67 14 42 14 40 67 40 552009 Fair 17 1 99 0 20 0 23 552012 Fair 17 0 74 0 0 0 15 552014 Fair 50 32 88 16 40 33 43 552015 Fair 100 4 74 19 50 100 58 552017 Fair 33 4 76 2 20 33 28 552020 Fair 67 6 0 16 50 67 34 552023 Fair 50 2 5 8 40 67 29 552024 Fair 50 2 27 93 30 33 39 552025 Fair 50 0 34 25 20 100 38 552027 Fair 33 3 92 0 30 0 26 552028 Fair 83 5 78 9 20 100 49 552030 Fair 100 7 41 46 40 100 56

Table E-11. Continued Storet Number HDI Rank BeckBI TrichPct PredPct IntolPct EPTTax IntolTax IBI Score
552033 Fair 67 21 95 17 90 100 65 552034 Fair 17 0 36 0 10 0 10 552036 Fair 67 32 69 52 60 67 58 552040 Fair 83 96 95 60 100 100 89 552043 Fair 83 40 93 28 70 100 69 554001 Fair 67 22 73 3 100 67 55 554007 Fair 33 1 73 0 30 0 23 554008 Fair 33 39 93 0 50 0 36 554010 Fair 0 0 0 0 10 0 2 554012 Fair 50 1 17 1 30 33 22 554013 Fair 33 0 91 0 30 0 26 554015 Fair 17 0 65 0 20 0 17 554016 Fair 50 14 89 0 60 0 36 554017 Fair 33 4 45 0 50 0 22 554020 Fair 0 0 67 0 10 0 13 554021 Fair 33 29 96 0 70 0 38 554022 Fair 33 2 71 0 40 0 24 554025 Fair 50 11 100 0 50 0 35 554027 Fair 33 5 63 2 40 33 29 554028 Fair 50 3 76 0 60 0 32 554029 Fair 67 3 100 2 50 33 43 554030 Fair 50 6 98 4 50 33 40 554042 Fair 50 1 86 1 40 33 35

Table E-12. Storet Number
Date Collected Site Type
HDI Rank BeckBI TrichPct PredPct IntolPct EPTTax IntolTax IBI Score
554002 06/15/1998 Validation Good 67 8 67 1 80 33 43 554014 07/14/1998 Validation Poor 33 2 42 0 40 0 20 552018 06/24/1997 Validation Fair 50 2 79 1 20 33 31 552045 08/19/1997 Validation Fair 17 0 100 0 20 0 23 552035 07/23/1997 Validation Fair 50 5 63 3 40 33 32 552019 06/24/1997 Validation Fair 50 4 58 9 20 100 40 552013 06/11/1997 Validation Fair 33 0 100 0 50 67 42 552039 07/24/1997 Validation Fair 50 100 100 100 60 67 79
551185 10/23/1995 BY-Revisit Fair 67 17 93 16 50 67 52 551185 09/16/1996 BY-Revisit Fair 100 16 41 61 100 100 70 552001 08/12/1998 BY-Revisit Fair 0 13 100 0 20 0 22 552001 06/12/1997 BY-Revisit Fair 100 70 81 100 60 100 85 552004 08/12/1998 BY-Revisit Fair 33 15 76 0 50 0 29 552004 06/12/1997 BY-Revisit Fair 50 6 94 4 50 67 45 552040 08/13/1998 BY-Revisit Fair 67 10 91 24 80 67 56 552040 07/24/1997 BY-Revisit Fair 83 96 95 60 100 100 89 554007 08/21/2003 BY-Revisit Fair 33 1 68 29 30 33 32 554007 06/24/1998 BY-Revisit Fair 33 1 73 0 30 0 23 554013 08/11/1999 BY-Revisit Fair 17 4 62 0 30 0 19 554013 07/29/1998 BY-Revisit Fair 50 22 62 0 70 0 34 554020 08/11/1999 BY-Revisit Fair 33 18 55 0 70 0 29 554020 07/15/1998 BY-Revisit Fair 0 0 67 0 10 0 13 554021 08/11/1999 BY-Revisit Fair 33 91 91 67 60 33 63 554021 09/17/1998 BY-Revisit Fair 50 64 85 15 70 33 53 554023 08/11/1999 BY-Revisit Poor 50 2 40 0 40 0 22 554023 07/16/1998 BY-Revisit Poor 17 1 56 0 40 0 19
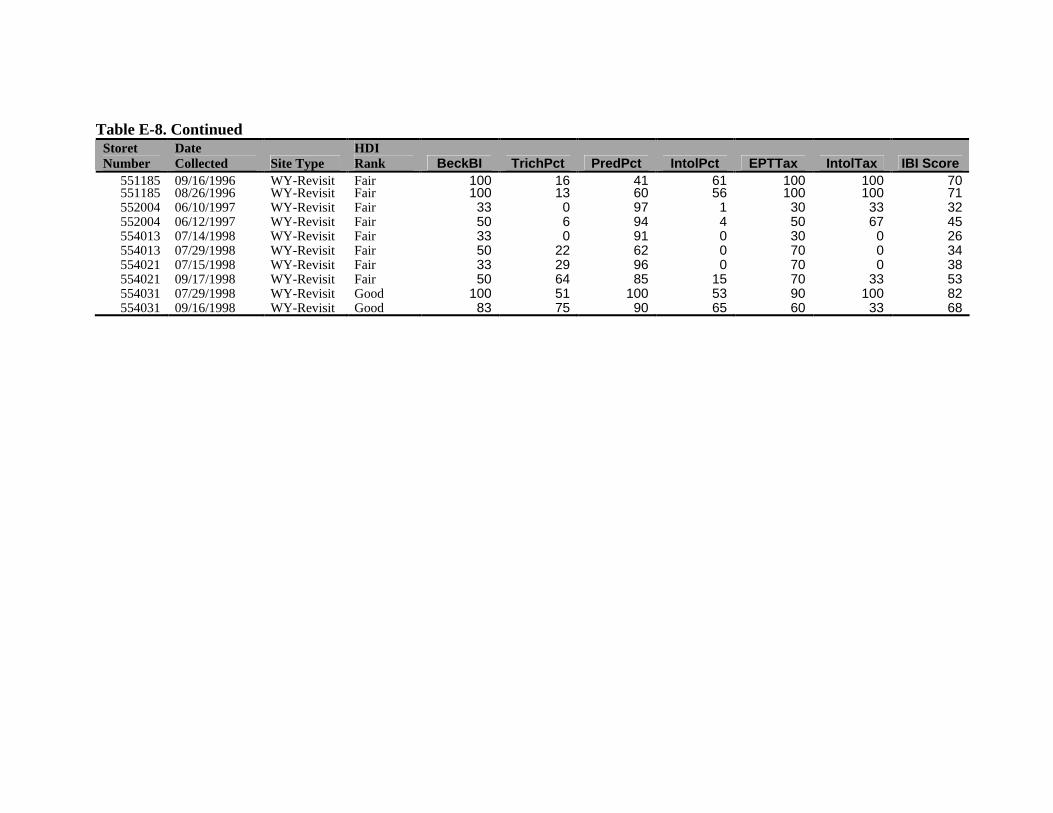
Table E-8. Continued Storet Number
Date Collected Site Type
HDI Rank BeckBI TrichPct PredPct IntolPct EPTTax IntolTax IBI Score
551185 09/16/1996 WY-Revisit Fair 100 16 41 61 100 100 70 551185 08/26/1996 WY-Revisit Fair 100 13 60 56 100 100 71 552004 06/10/1997 WY-Revisit Fair 33 0 97 1 30 33 32 552004 06/12/1997 WY-Revisit Fair 50 6 94 4 50 67 45 554013 07/14/1998 WY-Revisit Fair 33 0 91 0 30 0 26 554013 07/29/1998 WY-Revisit Fair 50 22 62 0 70 0 34 554021 07/15/1998 WY-Revisit Fair 33 29 96 0 70 0 38 554021 09/17/1998 WY-Revisit Fair 50 64 85 15 70 33 53 554031 07/29/1998 WY-Revisit Good 100 51 100 53 90 100 82 554031 09/16/1998 WY-Revisit Good 83 75 90 65 60 33 68