Embed Size (px)
Citation preview

Macroeconomics

• Macroeconomics - the performance, structure, behavior, and decision-making of the entire economy. • This includes a national, regional, or
global economy• An economy is measured using
economic indicators

“Time Vocabulary”Annual – one year
Quarter – three monthsFirst Quarter (Q1): January – MarchSecond Quarter (Q2): April – May Third Quarter (Q3): June – AugustFourth Quarter (Q4): September - December
• Inflation – an increase in prices as a result of a growing economy
• Economic indicators are used to measure and explain inflation
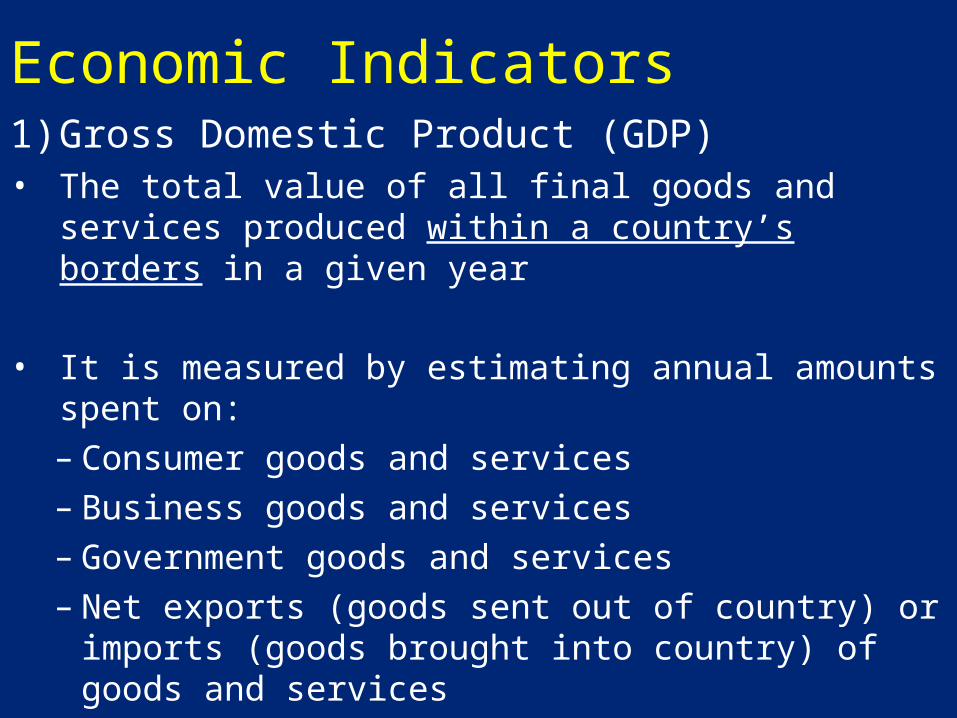
Economic Indicators1) Gross Domestic Product (GDP)• The total value of all final goods and services
produced within a country’s borders in a given year
• It is measured by estimating annual amounts spent on:– Consumer goods and services– Business goods and services– Government goods and services–Net exports (goods sent out of country) or
imports (goods brought into country) of goods and services
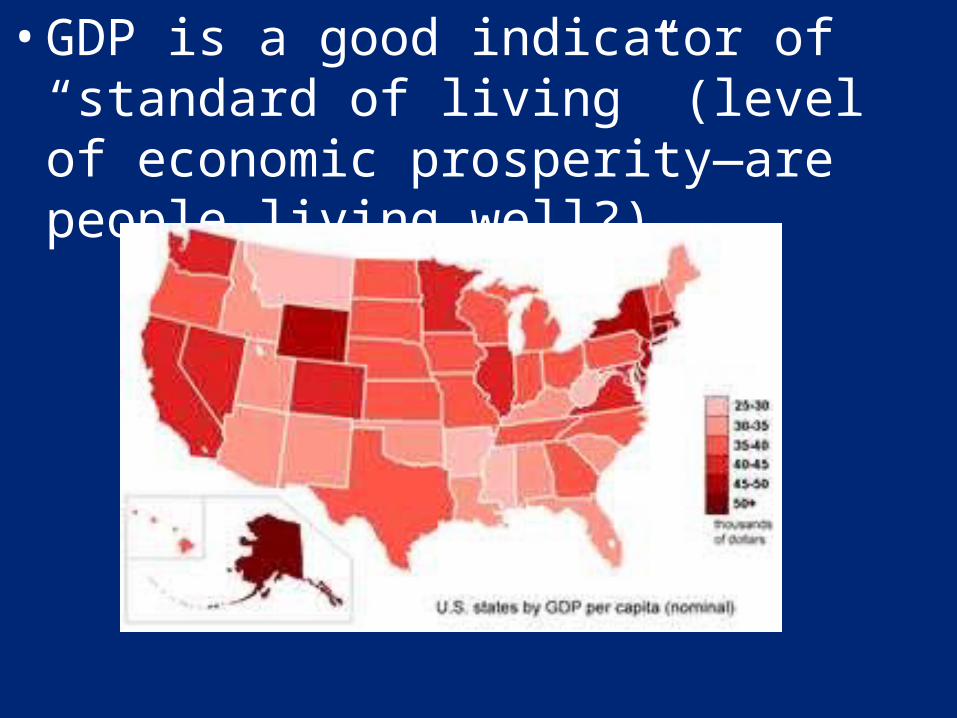
• GDP is a good indicator of “standard of living” (level of economic prosperity—are people living well?)

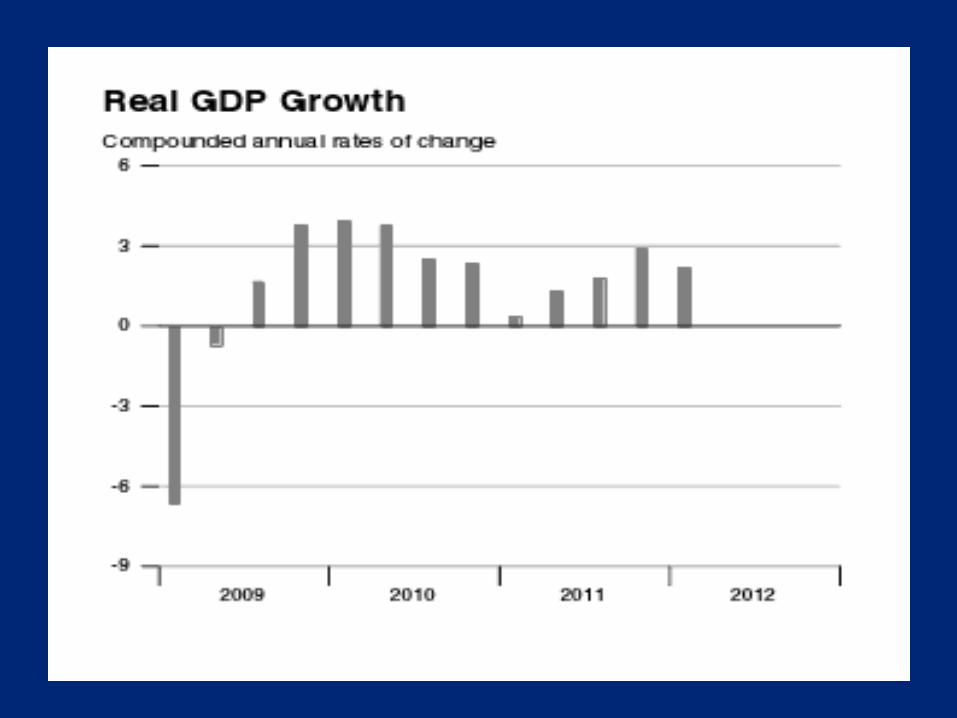
***GDP growth is most important statistic about economy’s health
– If GDP growing – jobs, personal income, and businesses increasing
– If GDP slowing down – businesses slow down, no hiring, consumers not buy g/s
– If GDP growth rate is negative recession
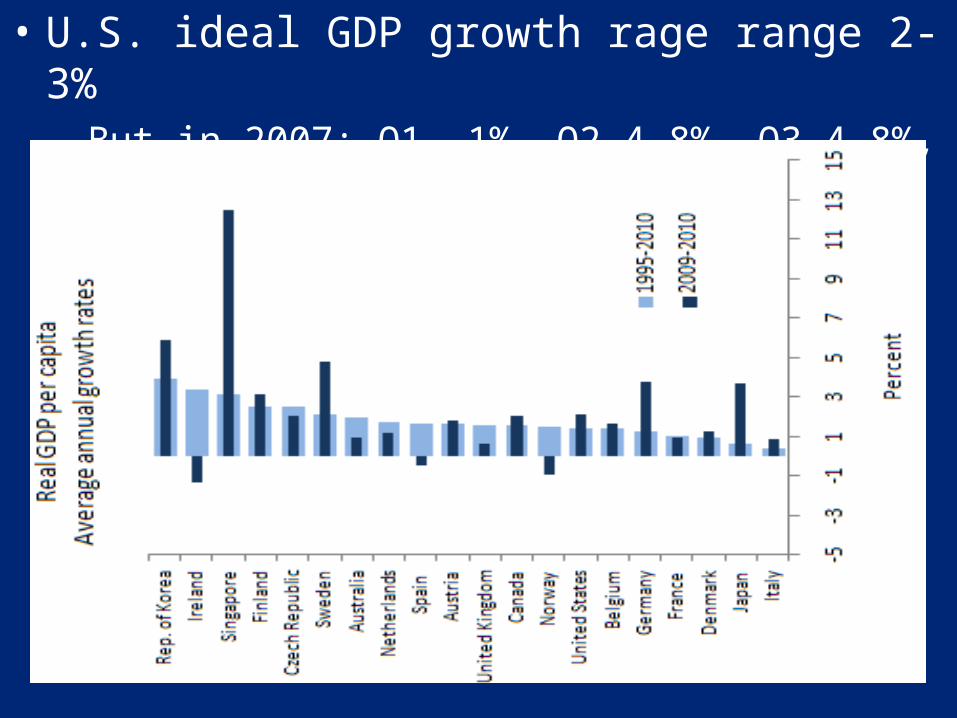
• U.S. ideal GDP growth rage range 2-3%– But in 2007: Q1 .1%, Q2 4.8%, Q3 4.8%, Q4
-.02%

2) Gross National Product (GNP)- the amount of goods produced by a country in one year- Can be misleading:
1) only looks at final product2) foreign business
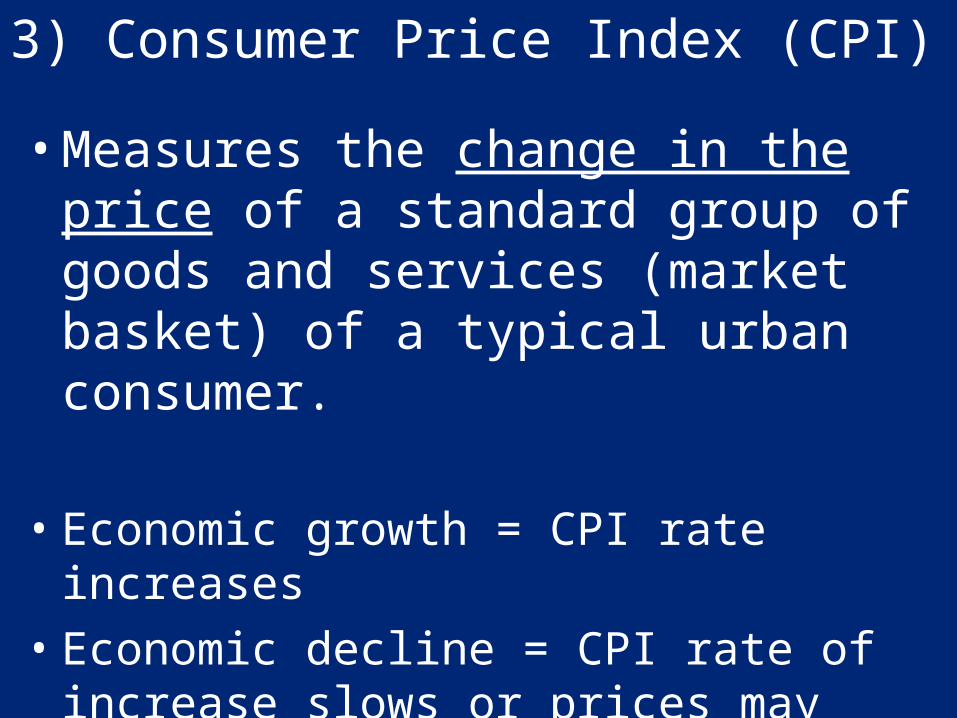
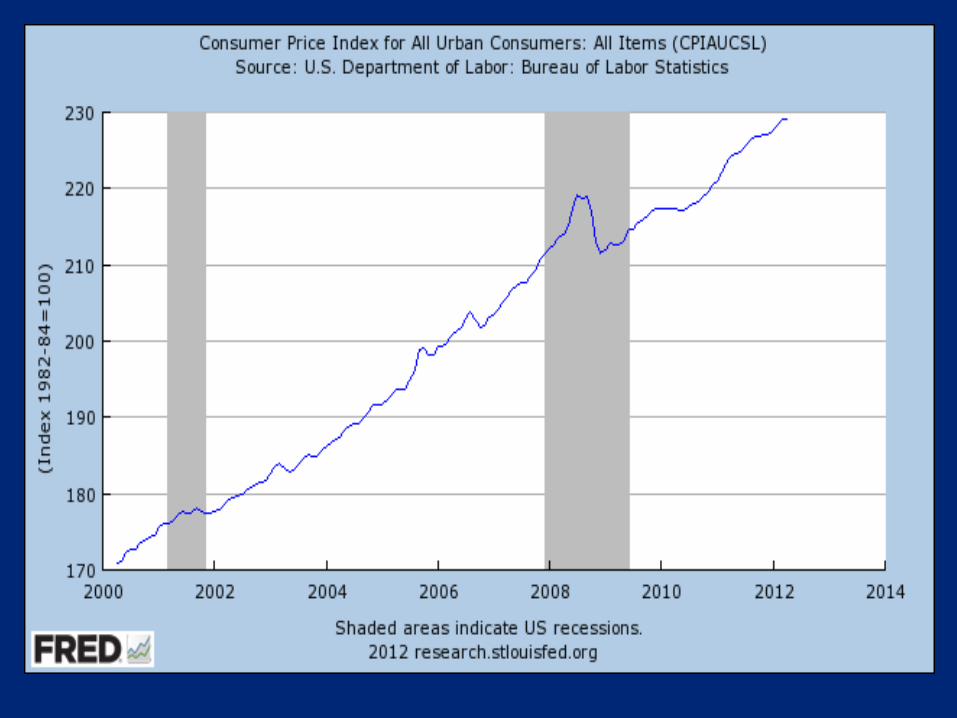
3) Consumer Price Index (CPI)
• Measures the change in the price of a standard group of goods and services (market basket) of a typical urban consumer.
• Economic growth = CPI rate increases
• Economic decline = CPI rate of increase slows or prices may even fall
• Measures changes in purchasing power
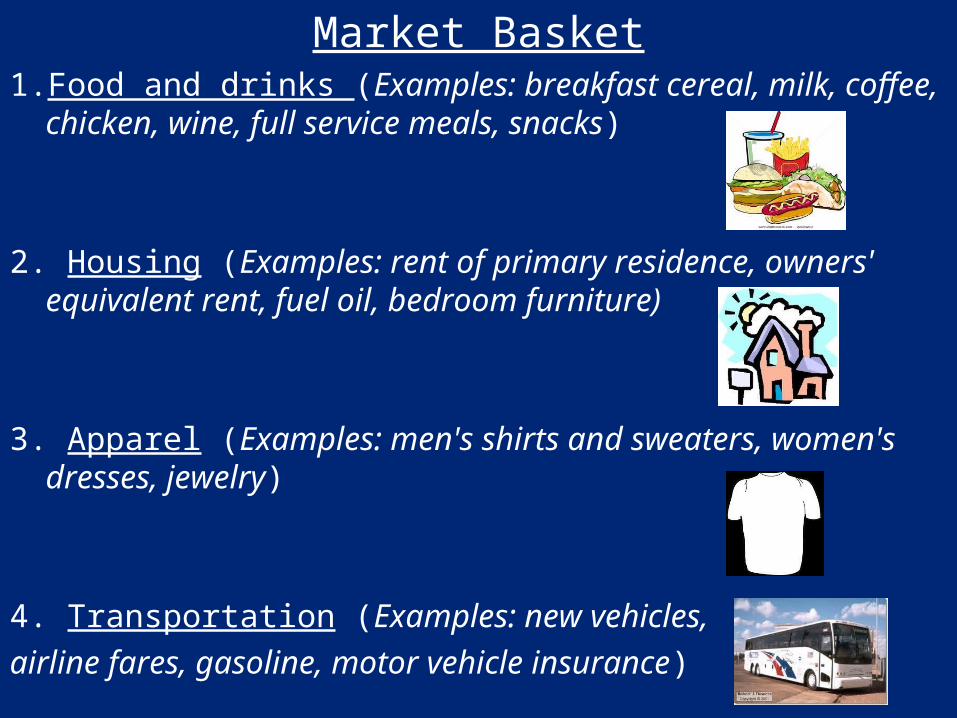
Market Basket1. Food and drinks (Examples: breakfast cereal, milk,
coffee, chicken, wine, full service meals, snacks)
2. Housing (Examples: rent of primary residence, owners' equivalent rent, fuel oil, bedroom furniture)
3. Apparel (Examples: men's shirts and sweaters, women's dresses, jewelry)
4. Transportation (Examples: new vehicles, airline fares, gasoline, motor vehicle insurance)
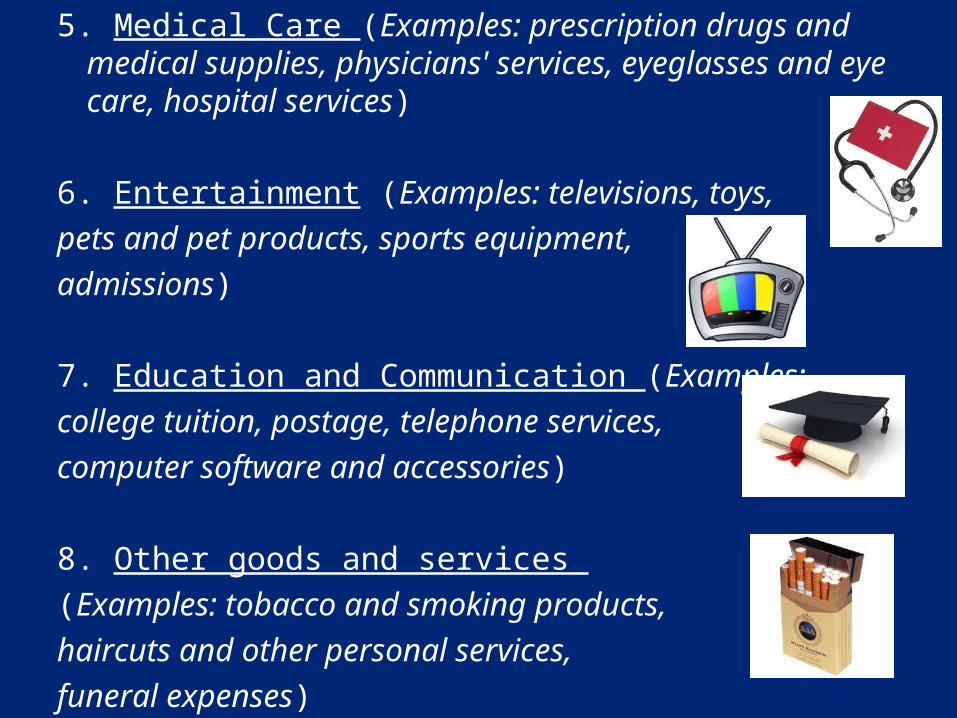
5. Medical Care (Examples: prescription drugs and medical supplies, physicians' services, eyeglasses and eye care, hospital services)
6. Entertainment (Examples: televisions, toys, pets and pet products, sports equipment, admissions)
7. Education and Communication (Examples: college tuition, postage, telephone services, computer software and accessories)
8. Other goods and services (Examples: tobacco and smoking products, haircuts and other personal services, funeral expenses)
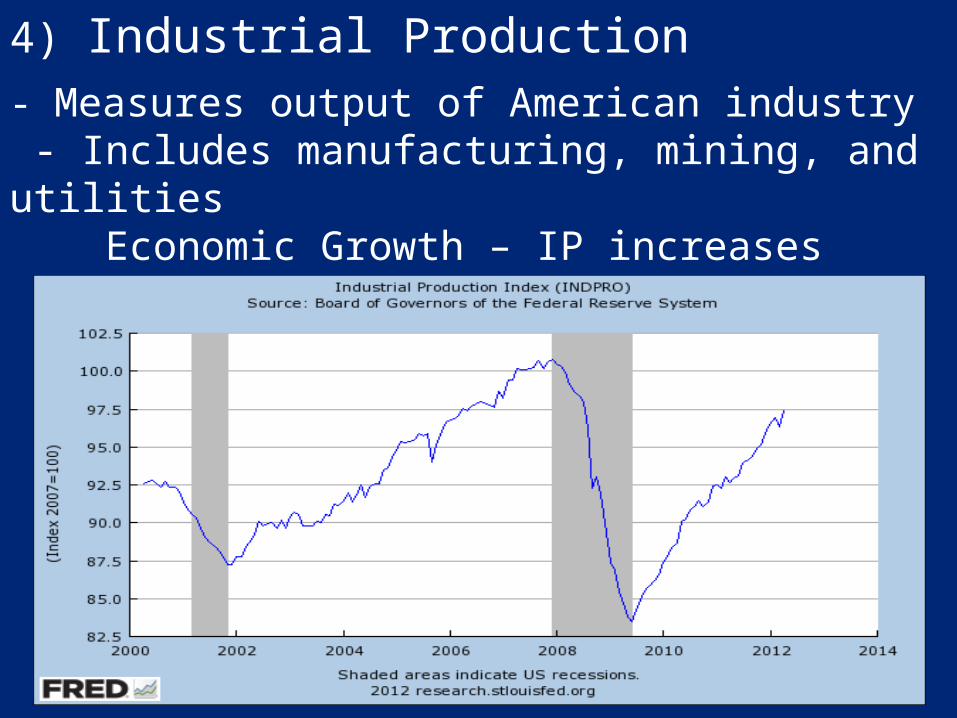
4) Industrial Production- Measures output of American industry - Includes manufacturing, mining, and utilities
Economic Growth – IP increasesEconomic Decline – IP decreases

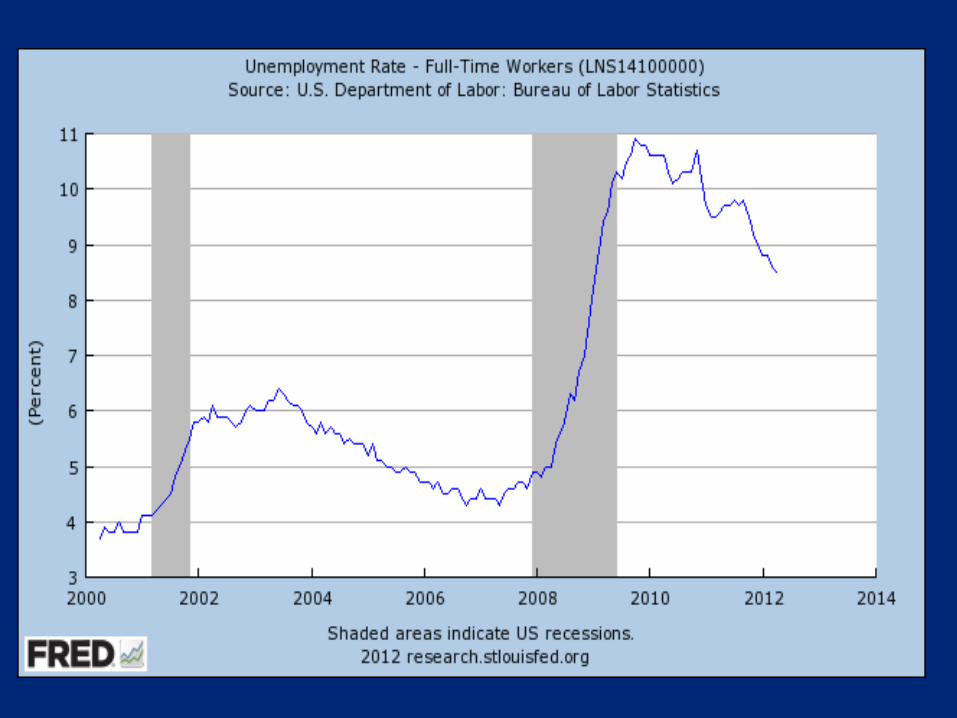
5) Unemployment RateMeasures percentage of people in
labor force who were not working during the week of the survey, but had been looking for work within the previous four weeks
6) Poverty Line/Poverty “Threshold”
•Dollar amounts used to determine poverty status •Thresholds vary according to: – Size of the family– Ages of the members
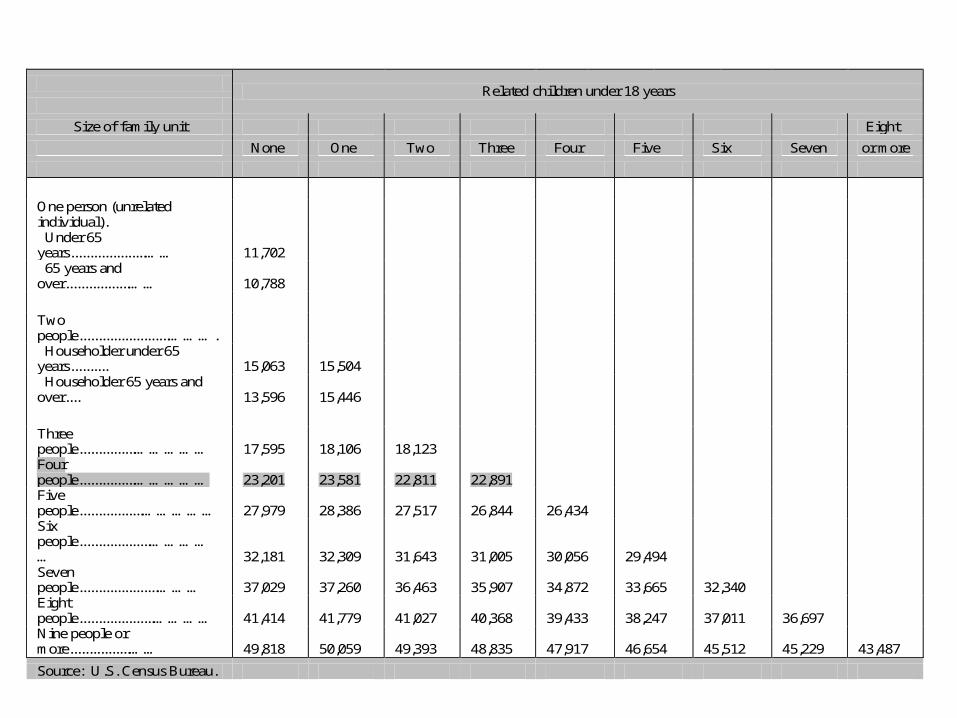
Related children under 18 years
Size of family unit Eight
None One Two Three Four Five Six Seven or more
One person (unrelated individual). Under 65 years....................……
11,702
65 years and over.................……
10,788
Two people........................………. Householder under 65 years..........
15,063
15,504
Householder 65 years and over....
13,596
15,446
Three people...............……………
17,595
18,106
18,123
Four people...............……………
23,201
23,581
22,811
22,891
Five people.................……………
27,979
28,386
27,517
26,844
26,434
Six people...................……………
32,181
32,309
31,643
31,005
30,056
29,494
Seven people.....................………
37,029
37,260
36,463
35,907
34,872
33,665
32,340
Eight people....................…………
41,414
41,779
41,027
40,368
39,433
38,247
37,011
36,697
Nine people or more................……
49,818
50,059
49,393
48,835
47,917
46,654
45,512
45,229
43,487
Source: U.S. Census Bureau.