Embed Size (px)
Citation preview
macroeconomía del desarrollo S
E
R
I
E
35
International migration,
capital flows and the global economy: a long run view Andrés Solimano Nathalie Watts
Economic Development Division
Santiago, Chile, February 2005
This document was prepared by Andrés Solimano, Regional Adviser of the Economic Development Division, Economic Commission for Latin America and the Caribbean and Nathalie Watts, FOCAL-Canada Internship in ECLAC. Useful comments by Ricardo Carciofi are appreciated.
The views expressed in this document, which has been reproduced without formal editing, are those of the authors and do not necessarily reflect the views of the Organization. United Nations Publication ISSN printed version 1680-8843 ISSN online version 1680-8851 ISBN: 92-1-121538-2 LC/L.2259-P Sales No.: E.05.II.G.16 Copyright © United Nations, February 2005. All rights reserved Printed in United Nations, Santiago, Chile Applications for the right to reproduce this work are welcomed and should be sent to the Secretary of the Publications Board, United Nations Headquarters, New York, N.Y. 10017, U.S.A. Member States and their governmental institutions may reproduce this work without prior authorization, but are requested to mention the source and inform the United Nations of such reproduction.
CEPAL - SERIE Macroeconomía del desarrollo N° 35
Contents
Abstract ........................................................................................5 I. Introduction ................................................................................7 II. Migration flows and capital flows: conceptual issues ....9 III. A look at the historical evidence.........................................11 1. International labor and capital markets in the first
wave of globalization (c. 1870-1913)...................................14 2. Economic instability, political trubulence and
de-globalization (1913-1945) ...............................................21 3. The post 1945 period: reconstruction and the second
wave of globalization ...........................................................25 IV. Retrospect .................................................................................31 Bibliography ............................................................................35 Serie Macroeconomía del desarrollo: issues published .............................................................................39
Tables
Table 1 Living standards and productivity, 1870-1913.............17 Table 2 Distribution of european foreign investment
1913-1914.....................................................................20 Table 3 International real wages indices, 1870-1988 ................29 Table 4 Levels of GDP per hour worked, 1870-1998................30 Table 5 Gross domestic product per capita................................30 Table 6 Net immigration (1) ......................................................33 Table 7 Foreign savings, domestics savings and investment,
1871-2002.....................................................................34
3
International migration, capital flows and the global economy: a long run view
Figures
Figures 1 Conjecture? A stylized view of capital mobility in modern history........................... 12 Figures 2.a Immigration to the United States................................................................................ 12 Figures 2.b Immigration to the United States................................................................................ 13 Figures 2.c Immigration to the United States by region of origen................................................ 13 Figures 3 Division fo pre-www1 British capital exports into six time periods.......................... 15 Figures 4 Emigration from Europe 1846-1924 (Five Years averages) ...................................... 15 Figure 5 Immigraton to the Americas, 1846-1924 ................................................................... 16
4
CEPAL - SERIE Macroeconomía del desarrollo N° 35
Abstract
Historically, periods of increased trade and capital mobility have been also accompanied by more intense labor mobility across national borders. Conversely, in periods of global instability, stagnation, nationalism and more restrictive policies toward migration and capital mobility we observed less action in global factor markets. The first wave of globalization from around 1870 to 1913 was a period in which capital and labor were both free to move internationally. The interwar period with its economic turbulence, political disarray and rising nationalism witnessed both a movement towards reduced intercontinental migration and more chaotic and diminished capital flows.
After World War II, the Bretton-Woods system restricted international private capital mobility and national governments gave more priority to the achievement of domestic policy goals. In the early 1970s the Bretton-Woods dollar-gold standard was abandoned and international capital mobility surged. International financial intermediation, however, was of the type of “diversification finance” among industrial economies rather than one-way “development finance” observed in the late 19th and early 20th centuries.
Since the 1970s international labor markets, particularly for unskilled labor, have remained more regulated than global capital markets, particularly regarding migration from developing countries. The source of global savings and investment balances changed in the 1980s and 1990s as the United States started to run persistent current account deficits and became a net debtor economy.
5
International migration, capital flows and the global economy: a long run view
This document analyzes various economic policy regimes and “political-economy epochs” since the 1870s to the early 21st century and their impact on international migration and international capital mobility. We take a long run view and examine to what extent periods of increased international migration have also been accompanied by periods of greater capital mobility and vice-versa. We investigate the patterns and interactions between these two types of international resource transfers and the changing global savings and investment balances in the world economy.
6
CEPAL - SERIE Macroeconomía del desarrollo N° 35
I. Introduction
The international mobility of labor and capital are linked phenomena as the global economic history of the last century and a half shows. Therefore both phenomena must be analyzed jointly. In periods in which the world economy is open to trade and factor mobility, people and capital moved to countries, regions and cities that offered better jobs, more profits and higher wages than those encountered at home. Historically, periods of increased trade and capital mobility have been also accompanied by more intense labor mobility across national borders. Conversely, in periods of global instability, stagnation, nationalism and more restrictive policies toward migration and capital mobility we observed less action in global factor markets. The first wave of globalization from around 1870 to 1913 was a period in which capital and labor were both free to move internationally; as a consequence international labor and capital markets became more integrated than in any period afterwards. The interwar period with its economic turbulence, political disarray and rising nationalism witnessed both a movement towards reduced intercontinental migration and more chaotic and diminished capital flows. After World War II, the Bretton-Woods system restricted international private capital mobility and national governments gave more priority to the achievement of domestic policy goals. In the early 1970s the Bretton-Woods dollar-gold standard was abandoned and international capital mobility surged. International financial intermediation, however, was largely concentrated in a group of economies with an important role played by “diversification finance” among industrial economies rather than one-way “development
7
International migration, capital flows and the global economy: a long run view
finance” of the type observed in the late 19th and early 20th centuries. Since the 1970s international labor markets, particularly for unskilled labor, have remained more regulated than global capital markets, particularly regarding migration from developing countries. Nevertheless, in spite of migration regulations, actual migration flows to the U.S and other industrial economies have been on the rise in the last two decades of the 20th century. The source of global savings and investment balances changed in the 1980s and 1990s as the United States started to run persistent current account deficits and became a net debtor economy. This feature reflects the low domestic savings relative to investment in the U.S. In contrast, countries that are running a large surplus of savings over investment (current account surplus) are Japan, China, Taiwan, Korea, and contribute to finance the current account deficits of the United States. On the side of international labor mobility, the U.S continued to be the main recipient country of immigrants in the world, a role that comes from the 19th century.
This historically-oriented document analyses various economic policy regimes and “political-economy epochs” since the 1870s to the early 21st century and their impact on international migration and international capital mobility. We take a long run view and examine to what extent periods of increased international migration have also been accompanied by periods of greater capital mobility and vice-versa. We investigate the patterns and interactions between these two types of international resource transfers, the direction of labor and capital flows throughout different historical periods and the relation with international inequality. We are also interested in identifying the changing global savings and investment balances in the world economy in terms of source and destinations of capital exports and imports. This document is organized in three sections besides this introduction. The second section briefly reviews the main analytical links between the international mobility of labor and capital; section three traces the historical evolution and interactions between global labor and capital markets in the two waves of globalization and the interwar (de-globalization) period. The fourth section concludes.
8
CEPAL - SERIE Macroeconomía del desarrollo N° 35
II. Migration flows and capital flows: conceptual issues
The literature has focused, traditionally, on the relationship between international trade in goods and services and migration discussing whether trade and migration are complements or substitutes. In contrast, the relation between international capital and labor mobility has been compartively less studied. This paper focuses in the later topic. In a closed economy the demand for labor and capital are met by the domestic supply of these two factors. Macroeconomic equilibrium and factor market clearing takes place without flows of labor and capital to and from of the rest of the world. In contrast, in an open economy to international factor mobility international migration offers an additional adjustment mechanism to labor market imbalances in source and destination countries by altering the total supply of labor. Emigration reduces the supply of labor in the source country and immigration increases the supply of labor in the destination country. In general a country with a persistently higher real wage at home than abroad will tend to be a net immigration country.
In turn, if there is an excess demand for investment relative to domestic savings the country will absorb foreign savings from the rest of the world by running a current account deficit in the balance of payments. Conversely, a country may run an excess of savings over investment, exporting capital, by running a surplus in its current account. An economy in which the (risk adjusted) rate of return of capital at home is lower than the relevant (adjusted by country risk)
9
International migration, capital flows and the global economy: a long run view
rate of return of capital will export capital, all this for given levels of domestic and foreign incomes.
Countries can have different configurations in labor markets and the savings-investment balance. A country can be either a net importer of labor (i.e. a net immigration country) or a net exporter of capital; alternatively it can be a net exporter of labor (emigration country) and be a net importer of capital. In turn, these configurations change over time as we shall see in this paper.
The experience of the United States illustrates how a country can change its position of net exporter of capital over time. From the 19th century until the 1980s the U.S was, on average a net exporter of capital (and a net importer of people). That situation regarding the savings-investment balance changed in the 1980s when the country started to run persistent current account deficits as national savings fell short of investment, financing the gap with savings from the rest of the world, mainly from positive net savings economies in Asia. In addition, the U.S became a net debtor as its foreign liabilities exceed its net foreign assets. On the migration side, still the U.S continues to be a net immigration country and the ratio of foreign population to total population has increased over time. An example of how a country can change its net migration position over time is Argentina that at the turn of the 20th century was both a net immigration country -absorbing large contingents of immigrants coming mainly from Spain and Italy- while being a net importer of capital, chiefly from Great Britain. That situation reverted in the last decades of the 20th century and early 21st century as Argentina suffered from emigration flows particularly of high skills people and professionals due to the poor development prospects of the country and the lack of democracy during authoritarian periods. In turn, capital often flew out of the country, particularly during its repeated economic crises.
Another factor that historically mattered for the direction of labor migration and capital flows was the abundance of natural resources in recipient countries. As we shall see below, in the 19th century the countries of the New World (Argentina, Australia, New Zealand, Canada, the United States) had abundance of natural resources (land, gold in some countries, mineral resources) and scarcity of labor and capital inviting an international transfer of these two resources to exploit natural resources.
Another important factor that influences the international movement of capital and labor is the migration and capital account policy regime in recipient and source countries. Restrictive labor migration, quotas, special tests, visa systems and others have been used historically to restrict labor flows. In turn, tax on capital flows and capital repatriation, foreign exchange controls minimum reserve requirements have been used to reduce capital mobility. Exchange rate, monetary and fiscal policies also affect capital flows.
Political considerations matter in international migration and capital flows. International investment is very sensitive to “political risk’ say the risk of expropriation or taxation of international capital flows or dividends of foreign investment due to political instability and social conflict in the recipient country. Also nationalism, populism, xenophobia and authoritarian politics against intellectuals and the working class reduce the international mobility of labor as we shall see in this historical overview.
10
CEPAL - SERIE Macroeconomía del desarrollo N° 35
III. A look at the historical evidence
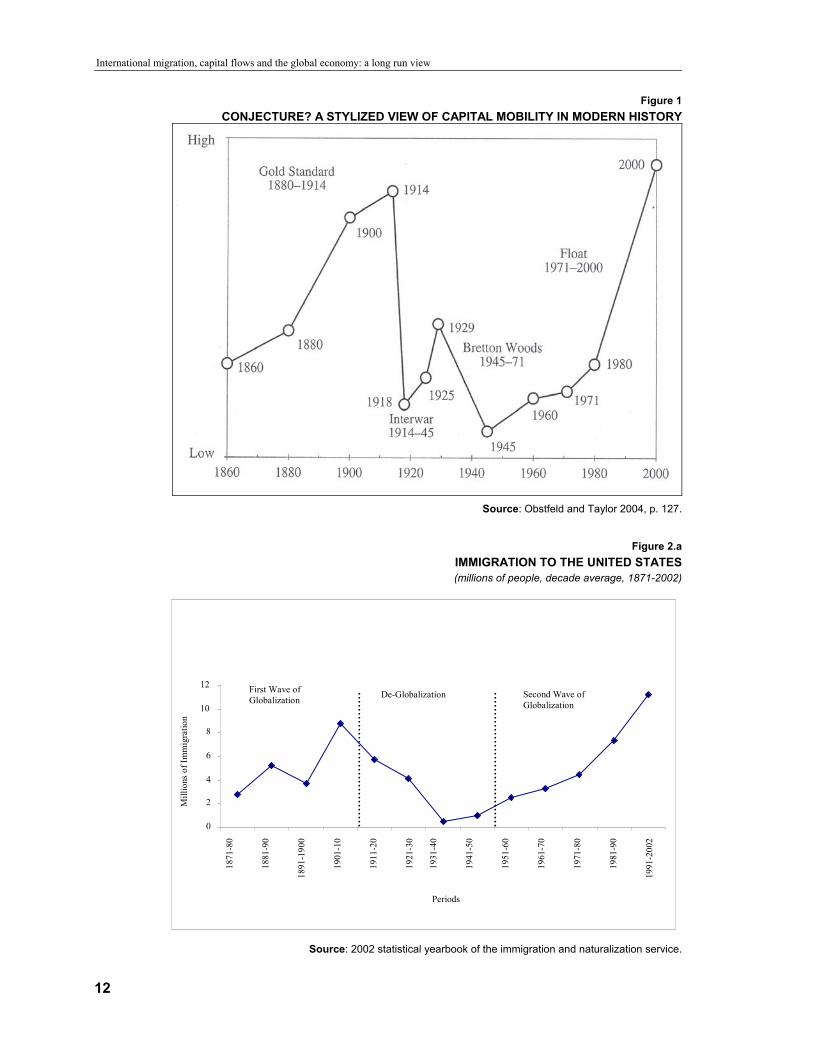
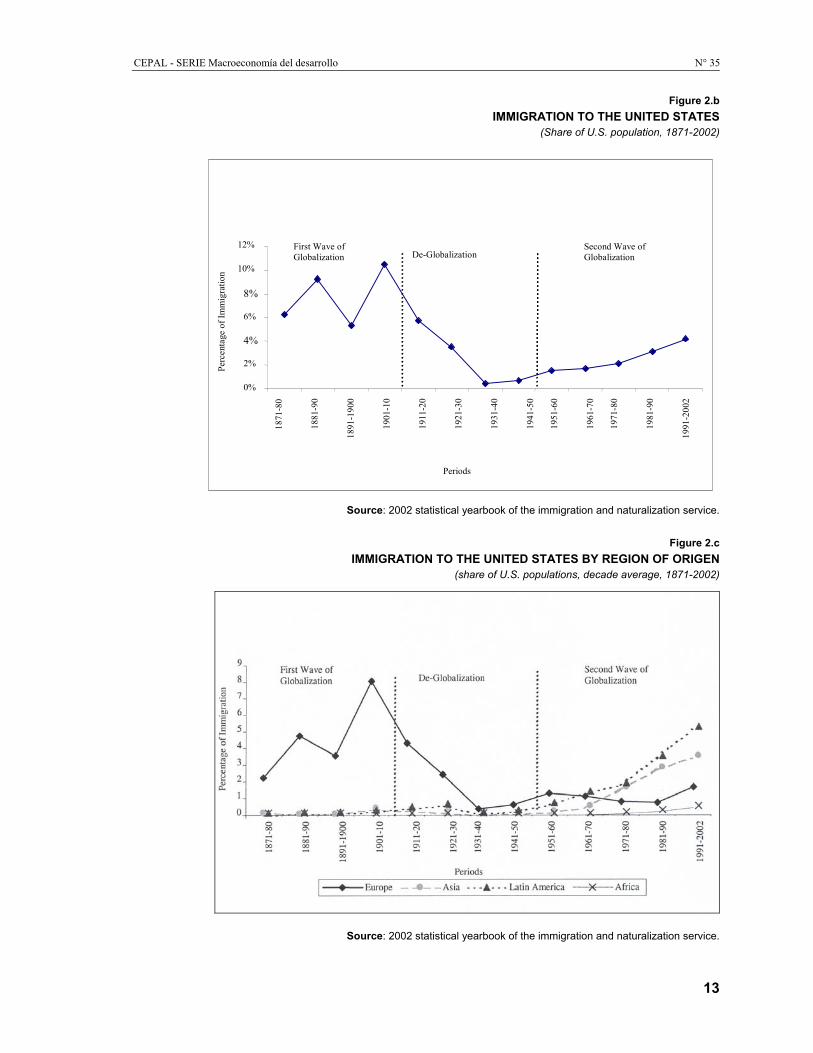
A synoptic view of the evolution of international capital mobility since the late 19th century until the early 21st century is provided by figure 1 borrowed from Obstfeld and Taylor (2004). In turn, figure 2 a) -c) shows the evolution, over a similar period,of labor immigration (in absoluter number, as a share of population and per source country/region) to the United States, the main immigration country in the last century and half or so.
Figure 1 shows a rise of capital mobility between 1860 and 1914, the period of the gold standard and first wave of globalization, followed by a sharp decline in the interwar years to slowly recuperate between 1945 and the early 1970s under the Bretton-Woods regime. Capital mobility accelerates after the breakdown of the Bretton- Woods system of fixed exchange rates in the early 1970s due to the recycling of large oil revenues and the move to open capital mobility in industrial and, to some extent, developing countries. This trend deepens in the 1980s and 1990s, albeit punctuated by successive financial crises in the 1990s and early 2000s.
11
International migration, capital flows and the global economy: a long run view
Figure 1 CONJECTURE? A STYLIZED VIEW OF CAPITAL MOBILITY IN MODERN HISTORY
Source: Obstfeld and Taylor 2004, p. 127.
Figure 2.a
IMMIGRATION TO THE UNITED STATES (millions of people, decade average, 1871-2002)
0
2
4
6
8
10
12
Periods
Second Wave of Globalization
De-Globalization First Wave of Globalization
1881
-90
1891
-190
0
1871
-80
1901
-10
1911
-20
1921
-30
1931
-40
1941
-50
1951
-60
1961
-70
1971
-80
1981
-90
1991
-200
2
Mill
ions
of I
mm
igra
tion
Source: 2002 statistical yearbook of the immigration and naturalization service.
12
CEPAL - SERIE Macroeconomía del desarrollo N° 35
Figure 2.b IMMIGRATION TO THE UNITED STATES
(Share of U.S. population, 1871-2002)
0%
2%
4% 6%
8% 10%
12%
Periods
First Wave of Globalization De-Globalization
Second Wave of Globalization
1871
-80
1881
-90
1891
-190
0
1901
-10
1911
-20
1921
-30
1931
-40
1941
-50
1951
-60
1961
-70
1971
-80
1981
-90
1991
-200
2
Perc
enta
ge o
f Im
mig
ratio
n
Source: 2002 statistical yearbook of the immigration and naturalization service.
Figure 2.c
IMMIGRATION TO THE UNITED STATES BY REGION OF ORIGEN (share of U.S. populations, decade average, 1871-2002)
Source: 2002 statistical yearbook of the immigration and naturalization service.
13
International migration, capital flows and the global economy: a long run view
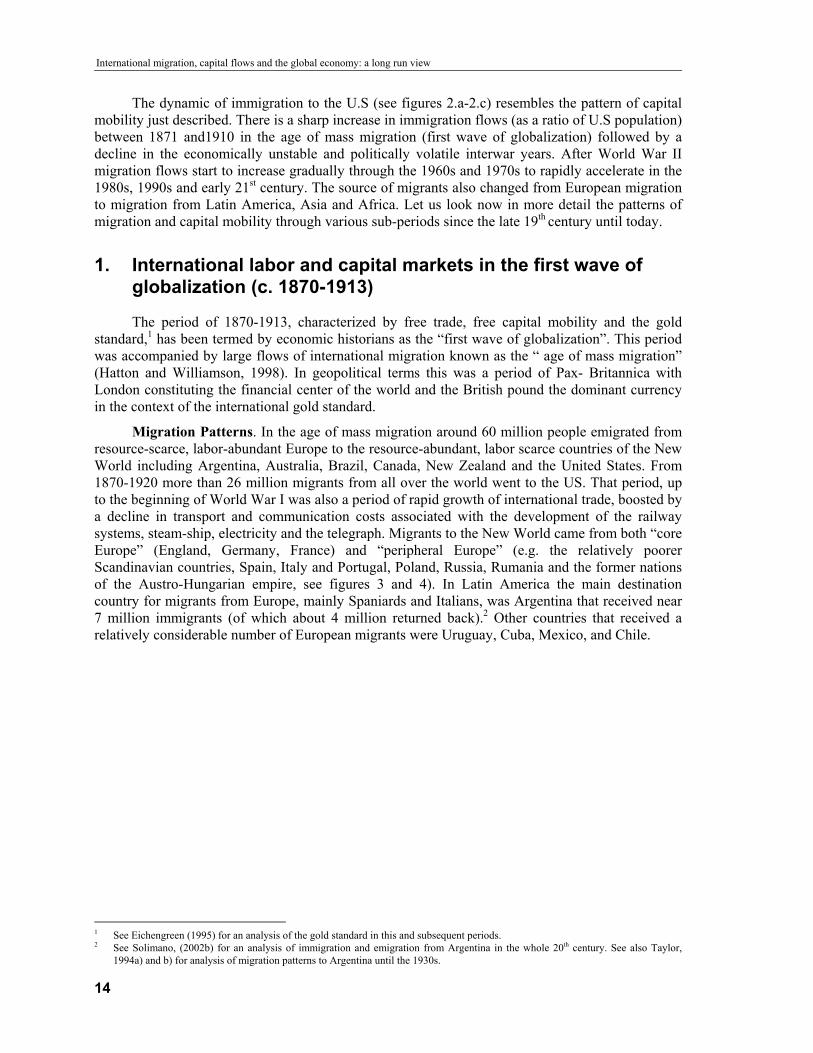
The dynamic of immigration to the U.S (see figures 2.a-2.c) resembles the pattern of capital mobility just described. There is a sharp increase in immigration flows (as a ratio of U.S population) between 1871 and1910 in the age of mass migration (first wave of globalization) followed by a decline in the economically unstable and politically volatile interwar years. After World War II migration flows start to increase gradually through the 1960s and 1970s to rapidly accelerate in the 1980s, 1990s and early 21st century. The source of migrants also changed from European migration to migration from Latin America, Asia and Africa. Let us look now in more detail the patterns of migration and capital mobility through various sub-periods since the late 19th century until today.
1. International labor and capital markets in the first wave of globalization (c. 1870-1913)
The period of 1870-1913, characterized by free trade, free capital mobility and the gold standard,1 has been termed by economic historians as the “first wave of globalization”. This period was accompanied by large flows of international migration known as the “ age of mass migration” (Hatton and Williamson, 1998). In geopolitical terms this was a period of Pax- Britannica with London constituting the financial center of the world and the British pound the dominant currency in the context of the international gold standard.
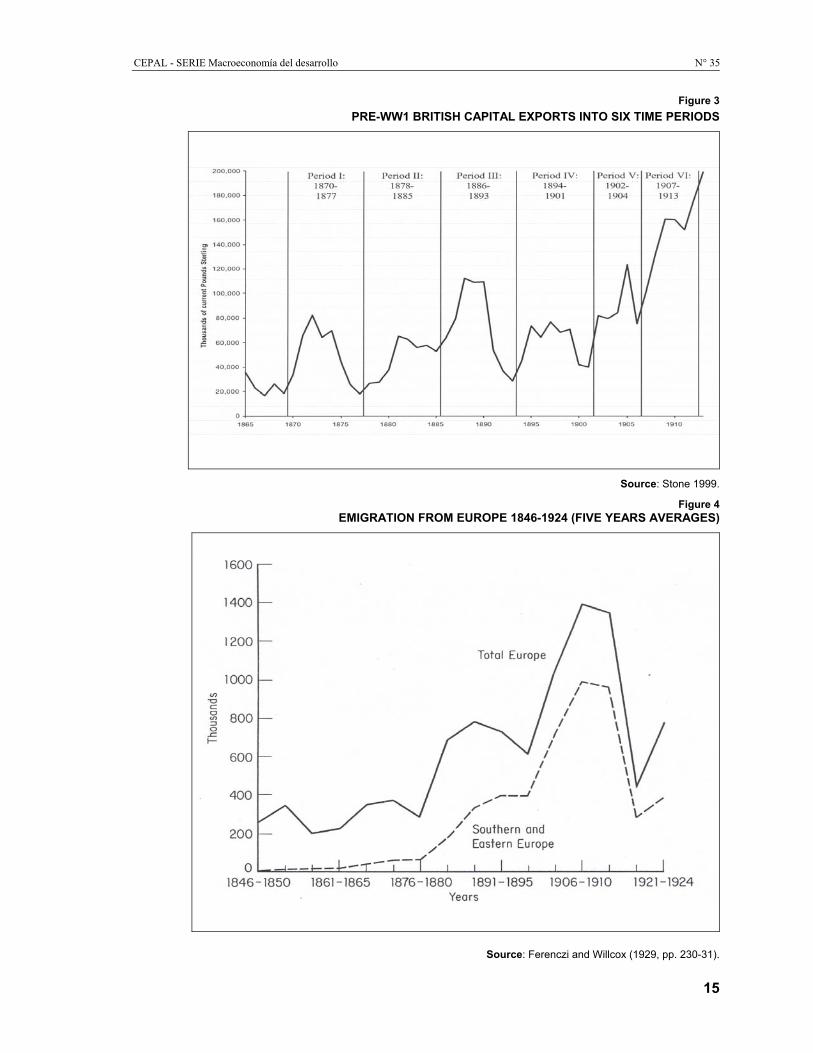
Migration Patterns. In the age of mass migration around 60 million people emigrated from resource-scarce, labor-abundant Europe to the resource-abundant, labor scarce countries of the New World including Argentina, Australia, Brazil, Canada, New Zealand and the United States. From 1870-1920 more than 26 million migrants from all over the world went to the US. That period, up to the beginning of World War I was also a period of rapid growth of international trade, boosted by a decline in transport and communication costs associated with the development of the railway systems, steam-ship, electricity and the telegraph. Migrants to the New World came from both “core Europe” (England, Germany, France) and “peripheral Europe” (e.g. the relatively poorer Scandinavian countries, Spain, Italy and Portugal, Poland, Russia, Rumania and the former nations of the Austro-Hungarian empire, see figures 3 and 4). In Latin America the main destination country for migrants from Europe, mainly Spaniards and Italians, was Argentina that received near 7 million immigrants (of which about 4 million returned back).2 Other countries that received a relatively considerable number of European migrants were Uruguay, Cuba, Mexico, and Chile.
1 See Eichengreen (1995) for an analysis of the gold standard in this and subsequent periods. 2 See Solimano, (2002b) for an analysis of immigration and emigration from Argentina in the whole 20th century. See also Taylor,
1994a) and b) for analysis of migration patterns to Argentina until the 1930s.
14
CEPAL - SERIE Macroeconomía del desarrollo N° 35
Figure 3 PRE-WW1 BRITISH CAPITAL EXPORTS INTO SIX TIME PERIODS
Source: Stone 1999.
Figure 4 EMIGRATION FROM EUROPE 1846-1924 (FIVE YEARS AVERAGES)
Source: Ferenczi and Willcox (1929, pp. 230-31).
15
International migration, capital flows and the global economy: a long run view
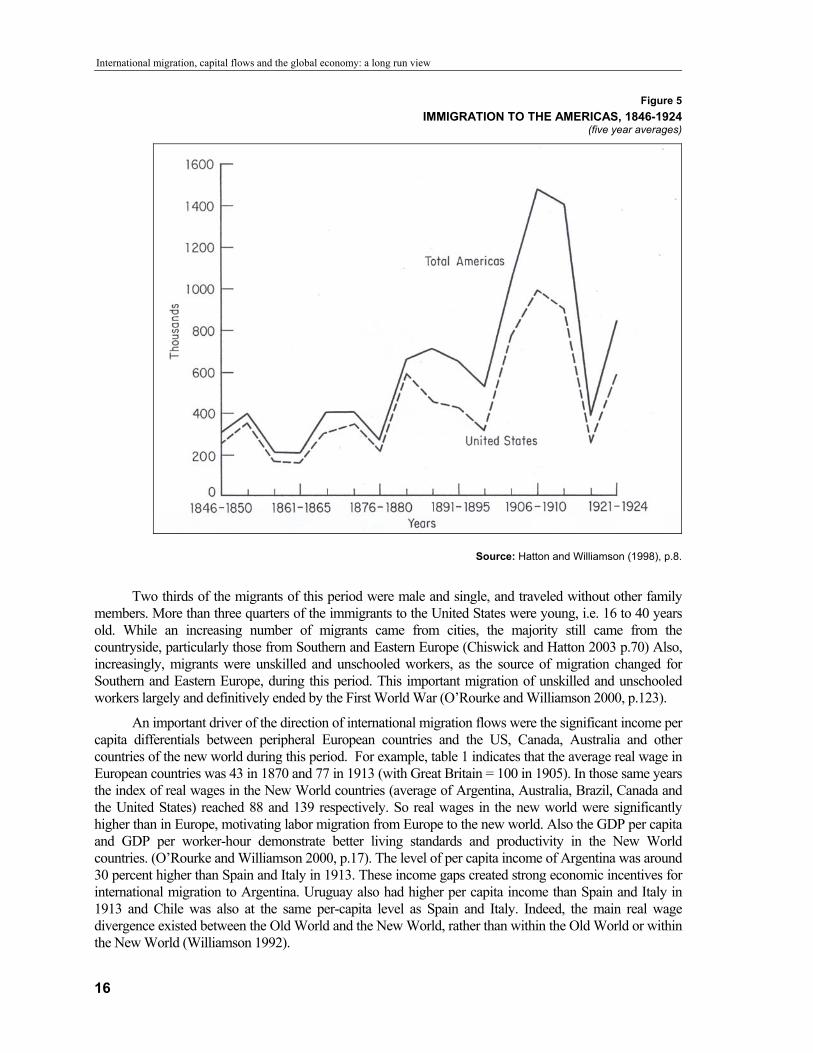
Figure 5 IMMIGRATION TO THE AMERICAS, 1846-1924
(five year averages)
Source: Hatton and Williamson (1998), p.8.
Two thirds of the migrants of this period were male and single, and traveled without other family members. More than three quarters of the immigrants to the United States were young, i.e. 16 to 40 years old. While an increasing number of migrants came from cities, the majority still came from the countryside, particularly those from Southern and Eastern Europe (Chiswick and Hatton 2003 p.70) Also, increasingly, migrants were unskilled and unschooled workers, as the source of migration changed for Southern and Eastern Europe, during this period. This important migration of unskilled and unschooled workers largely and definitively ended by the First World War (O’Rourke and Williamson 2000, p.123).
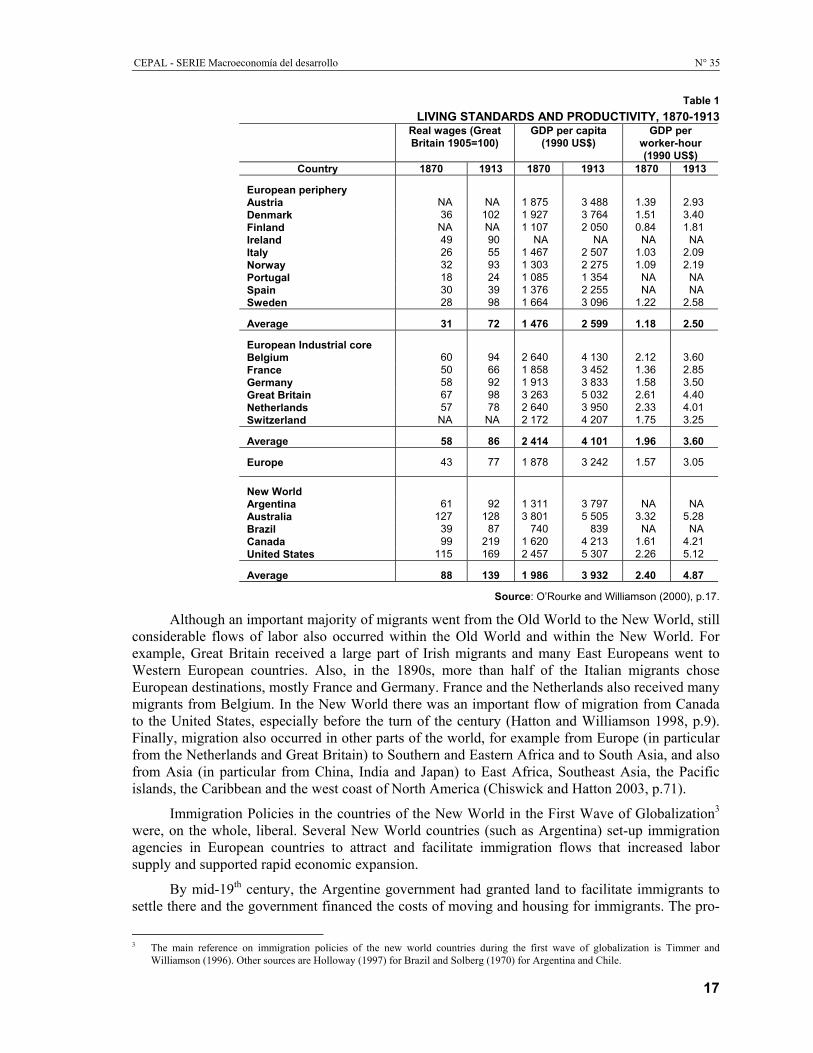
An important driver of the direction of international migration flows were the significant income per capita differentials between peripheral European countries and the US, Canada, Australia and other countries of the new world during this period. For example, table 1 indicates that the average real wage in European countries was 43 in 1870 and 77 in 1913 (with Great Britain = 100 in 1905). In those same years the index of real wages in the New World countries (average of Argentina, Australia, Brazil, Canada and the United States) reached 88 and 139 respectively. So real wages in the new world were significantly higher than in Europe, motivating labor migration from Europe to the new world. Also the GDP per capita and GDP per worker-hour demonstrate better living standards and productivity in the New World countries. (O’Rourke and Williamson 2000, p.17). The level of per capita income of Argentina was around 30 percent higher than Spain and Italy in 1913. These income gaps created strong economic incentives for international migration to Argentina. Uruguay also had higher per capita income than Spain and Italy in 1913 and Chile was also at the same per-capita level as Spain and Italy. Indeed, the main real wage divergence existed between the Old World and the New World, rather than within the Old World or within the New World (Williamson 1992).
16
CEPAL - SERIE Macroeconomía del desarrollo N° 35
Table 1 LIVING STANDARDS AND PRODUCTIVITY, 1870-1913
Real wages (Great Britain 1905=100)
GDP per capita (1990 US$)
GDP per worker-hour (1990 US$)
Country 1870 1913 1870 1913 1870 1913
European periphery
Austria NA NA 1 875 3 488 1.39 2.93 Denmark 36 102 1 927 3 764 1.51 3.40 Finland NA NA 1 107 2 050 0.84 1.81 Ireland 49 90 NA NA NA NA Italy 26 55 1 467 2 507 1.03 2.09 Norway 32 93 1 303 2 275 1.09 2.19 Portugal 18 24 1 085 1 354 NA NA Spain 30 39 1 376 2 255 NA NA Sweden 28 98 1 664 3 096 1.22 2.58
Average 31 72 1 476 2 599 1.18 2.50
European Industrial core Belgium 60 94 2 640 4 130 2.12 3.60 France 50 66 1 858 3 452 1.36 2.85 Germany 58 92 1 913 3 833 1.58 3.50 Great Britain 67 98 3 263 5 032 2.61 4.40 Netherlands 57 78 2 640 3 950 2.33 4.01 Switzerland NA NA 2 172 4 207 1.75 3.25
Average 58 86 2 414 4 101 1.96 3.60
Europe 43 77 1 878 3 242 1.57 3.05
New World Argentina 61 92 1 311 3 797 NA NA Australia 127 128 3 801 5 505 3.32 5.28 Brazil 39 87 740 839 NA NA Canada 99 219 1 620 4 213 1.61 4.21 United States 115 169 2 457 5 307 2.26 5.12
Average 88 139 1 986 3 932 2.40 4.87
Source: O’Rourke and Williamson (2000), p.17.
Although an important majority of migrants went from the Old World to the New World, still considerable flows of labor also occurred within the Old World and within the New World. For example, Great Britain received a large part of Irish migrants and many East Europeans went to Western European countries. Also, in the 1890s, more than half of the Italian migrants chose European destinations, mostly France and Germany. France and the Netherlands also received many migrants from Belgium. In the New World there was an important flow of migration from Canada to the United States, especially before the turn of the century (Hatton and Williamson 1998, p.9). Finally, migration also occurred in other parts of the world, for example from Europe (in particular from the Netherlands and Great Britain) to Southern and Eastern Africa and to South Asia, and also from Asia (in particular from China, India and Japan) to East Africa, Southeast Asia, the Pacific islands, the Caribbean and the west coast of North America (Chiswick and Hatton 2003, p.71).
Immigration Policies in the countries of the New World in the First Wave of Globalization3 were, on the whole, liberal. Several New World countries (such as Argentina) set-up immigration agencies in European countries to attract and facilitate immigration flows that increased labor supply and supported rapid economic expansion.
By mid-19th century, the Argentine government had granted land to facilitate immigrants to settle there and the government financed the costs of moving and housing for immigrants. The pro-
3 The main reference on immigration policies of the new world countries during the first wave of globalization is Timmer and
Williamson (1996). Other sources are Holloway (1997) for Brazil and Solberg (1970) for Argentina and Chile.
17
International migration, capital flows and the global economy: a long run view
migration climate of the ruling elite in Argentina at that time was captured by the phrase, coined by the Argentinean thinker Juan Baustista Alberdi, “To Govern is to Populate”.4 However, gradually, policies supporting immigration became less generous. In 1916, new legislation introduced restrictions for different classes of immigrants (e.g. disabled people, unaccompanied women with children, etc.) and by the 1920s policies became definitely less favorable for immigration, being perceived as preventing the improvement of living standards of domestic labor.
Ethnic discrimination (against migration from Asia, particularly from China) was a common practice in several receiving countries. In the second half of the 19th century U.S. immigration legislation went through different changes. To begin with, immigration policy became federal rather than state legislation. Racial considerations were important. The 1882 Chinese Exclusion Act passed by the U.S. Congress blocked Chinese migration for nearly eighty years until the 1965 Immigration Act removed the discriminatory quota system. American historian L. Ling-chi Wang notes, “America was open to everybody who wanted to come. We welcomed everybody. The only people we excluded by law at that time were prostitutes, lepers, and morons, and in 1882 we added Chinese to that list”.5 In 1917 a new Immigration Act established a literacy test for immigrants and in 1921 quotas were established to restrict immigration. In general immigrants from Canada, Mexico, Central America and the Caribbean to the U.S. were treated more favorably than immigrants coming from Asian countries. The U.S Immigration Committee published its’ forty-one volume report in 1911 which made a sharp distinction between the old immigrants (those from Belgium, Great Britain, Ireland, France, Germany, the Netherlands, Scandinavia and Switzerland) and the new immigrants (those from Austria-Hungary, Bulgaria, Greece, Italy, Montenegro, Poland, Portugal, Romania, Russia, Serbia, Spain, and Turkey). The commission presented a report negative on new immigration concluding that “the new immigration on the whole were ‘far less intelligent’ and were ‘actuated by different ideals’ than the old immigrants”.6 Immigration was seen as keeping real wages down and increasing domestic inequality (an issue we will return in chapter 3). In this period, strong labor unions contributed to develop an attitude less friendly to immigration that was being perceived as preventing a more steady improvement in living standards of the American working class.
In Australia, in the 19th century, immigration policies tended to favor those coming from British Commonwealth countries by subsidizing the transportation of immigrants and supporting them at arrival. At the same time Australia restricted the immigration of Chinese citizens through taxes and quotas. Some of these laws were repealed afterwards and then adopted again. In the early 20th century Australia naturalization laws became aligned with England’s. Brazil also encouraged emigration and settlements through subsidies, special benefits for land acquisition and other budget support. In the case of Brazil, immigration helped to substitute the effects on labor supply of abolition of slavery in the late 19th century, for the sugar –producing areas (north-east) and coffee-producing areas in the São-Paulo province.7 Later on, like in the cases of Argentina and Australia, Brazilian legislation became more restrictive in the first two decades of the 20th century. In Canada by the 1860s the parliament granted autonomy to the provinces to handle immigration issues and policies. Land was offered at reduced prices to encourage immigrants to settle in Canada. In 1910 immigration from Asian countries was restricted through a higher head tax than that of immigrants from non-Asian countries.
In sum, immigration policies in the countries of the New World in several cases promoted and encouraged international migration in response to the need for increased labor supply to support rapid economic expansion. However, these policies became gradually more restrictive towards the end of that century and the early 20th century, particularly in the 1910s and 1920s. Ethnic 4 See Solberg (1970). 5 Source: http://www.asianreporter.com/arts/12-03chinamer.htm.. 6 See Timothy J. Hatton and Jeffrey G. Williamson (1998) p. 124. 7 See Holloway (1977).
18
CEPAL - SERIE Macroeconomía del desarrollo N° 35
discrimination (against migration from Asia, in particular from China) was a common practice, particularly in Australia, Canada and the US, a feature seemingly absent in Argentinean and Brazilian immigration policies at that time.
International Capital Markets. Like the migration flow, the global capital flow also sharply increased during the first wave of globalization, as we can see in the figure 1. Interested in the exploitation of the abundant and cheap natural resources of the New World and considering the immobility of these resources, the countries of the Old World started to invest and to export technologies to the countries of the New World, where there were a scarcity of capital. These capital flows accelerated after 1870, as more and more countries joined the gold standard, initiated by the United Kingdom in 1717. During that time, an increasing number of countries became interested in abandoning silver-based money for the credible and stable gold-standard as a way to improve their commercial and financial relations with the leading world economic power. But the vast majority of these countries, except the western European countries, did not adopt the gold-standard until the end of the nineteenth century. From these national decisions to use gold for global commercial and financial transactions and in a context of improved technologies in transport and communication a new monetary system of fixed exchange-rates without capital controls or an active role of banks was created. This expanding liberal capital market, joined to the improving national banking systems, allowed for an expanded global commercial network and wide range of international transactions: bills of exchange, bond finances, equity issues, foreign direct investment, etc. Between 1900 and 1914, the period considered as the zenith of the classical gold-standard, foreign assets were estimated at almost 20 percent of global GDP, while they represented only 7 percent thirty years before (Obstfeld and Taylor 2004).
Regarding the direction and source of capital flows during this period, the most important flow of capital occurred from Great Britain to the New World countries, more or less following the same trajectory as the migration flows. London constituted the financial center of the global market and was called the “banker of the world”. It is estimated that the surplus of domestic savings over investment in the U.K was around 50 percent in the first decade of the 20th century (Obstfeld and Taylor, 2004). The British pound was the dominant currency in the context of the international gold standard. The United Kingdom contributed to a peak average of 80 percent of total global foreign investment. For example, between 1907 and 1913, Britain’s foreign assets were estimated at £1,127 million, from which 61 percent or £689 million went to Canada, Australasia, Argentina and the United States. This percentage rises to 76% or £857 million if we add the other countries of Latin America (Taylor and Williamson 1994, p.1). This region continued receiving a significant amount of capital until the 1930s.
Capital flows in this period were characterized by the accumulation of enormous one-way positions and a great portfolio diversification by the principal creditor countries, in particular Great Britain, and inversely little diversification and high foreign capital “dependence” by the debtor New World countries. For example, foreigners held one-fifth of the capital stock of Australia and owned almost half of the capital stock of Argentina. Even the United States presented high levels of foreign capital dependence at the end of the century, in spite of its increasing domestic savings and investments since the 1830s (O’Rourke and Williamson 2000, p.209). Thus, gross assets during this period were almost equal to net assets. Also investments took the form of long-term finance to less developed countries, what Obstfeld and Taylor (2004) called “development finance”. For example, in 1900, one third of global assets went to countries in Latin America and, to a lesser extent, Asia and Africa. We will see later on that the situation is very different in today’s global capital markets.
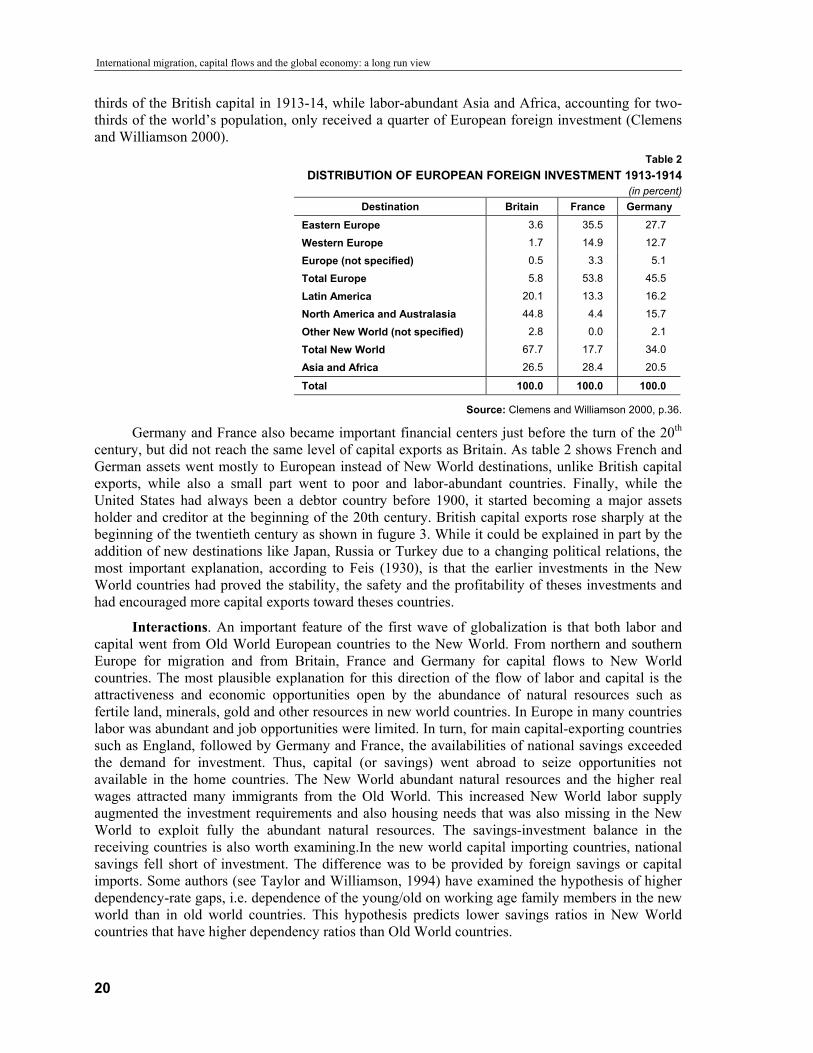
It is interesting to note that capital flew to rich and labor-scarce New World countries instead of going to poor and labor-abundant Asian and African countries, where it could, in principle, have been more profitable given the abundance of cheap labor. Indeed, as indicated in table 2 the labor-scarce New World countries, where only a tenth of the world’s population lived, received two-
19
International migration, capital flows and the global economy: a long run view
thirds of the British capital in 1913-14, while labor-abundant Asia and Africa, accounting for two-thirds of the world’s population, only received a quarter of European foreign investment (Clemens and Williamson 2000).
Table 2 DISTRIBUTION OF EUROPEAN FOREIGN INVESTMENT 1913-1914
(in percent) Destination Britain France Germany
Eastern Europe 3.6 35.5 27.7
Western Europe 1.7 14.9 12.7
Europe (not specified) 0.5 3.3 5.1
Total Europe 5.8 53.8 45.5
Latin America 20.1 13.3 16.2
North America and Australasia 44.8 4.4 15.7
Other New World (not specified) 2.8 0.0 2.1
Total New World 67.7 17.7 34.0
Asia and Africa 26.5 28.4 20.5
Total 100.0 100.0 100.0
Source: Clemens and Williamson 2000, p.36.
Germany and France also became important financial centers just before the turn of the 20th century, but did not reach the same level of capital exports as Britain. As table 2 shows French and German assets went mostly to European instead of New World destinations, unlike British capital exports, while also a small part went to poor and labor-abundant countries. Finally, while the United States had always been a debtor country before 1900, it started becoming a major assets holder and creditor at the beginning of the 20th century. British capital exports rose sharply at the beginning of the twentieth century as shown in fugure 3. While it could be explained in part by the addition of new destinations like Japan, Russia or Turkey due to a changing political relations, the most important explanation, according to Feis (1930), is that the earlier investments in the New World countries had proved the stability, the safety and the profitability of theses investments and had encouraged more capital exports toward theses countries.
Interactions. An important feature of the first wave of globalization is that both labor and capital went from Old World European countries to the New World. From northern and southern Europe for migration and from Britain, France and Germany for capital flows to New World countries. The most plausible explanation for this direction of the flow of labor and capital is the attractiveness and economic opportunities open by the abundance of natural resources such as fertile land, minerals, gold and other resources in new world countries. In Europe in many countries labor was abundant and job opportunities were limited. In turn, for main capital-exporting countries such as England, followed by Germany and France, the availabilities of national savings exceeded the demand for investment. Thus, capital (or savings) went abroad to seize opportunities not available in the home countries. The New World abundant natural resources and the higher real wages attracted many immigrants from the Old World. This increased New World labor supply augmented the investment requirements and also housing needs that was also missing in the New World to exploit fully the abundant natural resources. The savings-investment balance in the receiving countries is also worth examining.In the new world capital importing countries, national savings fell short of investment. The difference was to be provided by foreign savings or capital imports. Some authors (see Taylor and Williamson, 1994) have examined the hypothesis of higher dependency-rate gaps, i.e. dependence of the young/old on working age family members in the new world than in old world countries. This hypothesis predicts lower savings ratios in New World countries that have higher dependency ratios than Old World countries.
20
CEPAL - SERIE Macroeconomía del desarrollo N° 35
That labor moved from relatively lower wage (labor abundant) European countries to higher wage (labor scarce) new world countries is fully understandable, provided migration regimes were open to (mass) flows of migration as it was the case at that time. However, the direction of capital flows is less obvious. One possibility was for financial capital to “stay in Europe” taking advantage of cheaper labor than in the New World. However, as we saw before the demand for investment was lower than the supply of savings in the main capital exporting European countries. The existence of natural resources in the New World created investment opportunities not available at home. However, the question arises also of why capital did not go (in massive) amounts to labor abundant countries such as Africa and Latin America that also were abundant in natural resources and had lower wages than the New World countries. The answer lies in that cheap labor is probably not the most important factor governing the direction of capital flows (i.e foreign investment). Other economic and political conditions in the recipient country also count. Capital to be invested productively and earn an attractive rate of return needs also a work force with adequate skills and education levels, property rights that can be enforced and institutions “friendly” to foreign capital. Apparently, these conditions were more likely to be found in the New World countries than in poor Africa and backward Latin America (with the exception, perhaps, of Argentina). In addition, we have to remember that several New World countries (Australia, Canada, New Zealand, the United States) had closer ties (either for being former colonies and or members of the British commonwealth) with Britain the dominant power at that time and the main source of capital in the world economy.
2. Economic instability, political turbulence and de-globalization (1913-1945)
World War I (WWI) interrupted the process of economic interdependence and labor market integration (although this later started to face restrictive practices) across countries that characterized the first wave of globalization. Beginning in 1914 with the onset of WWI, a period of de-globalization was inaugurated with near 30 years of economic instability (high inflation, macroeconomic volatility, disintegration of capital markets) and political turbulence. After the war, the main European empires disintegrated: the Romanov following the Russian revolution of 1917, the Ottoman Empire and the Austro-Hungarian Empire of the Habsburg monarchy and the Kaiser in Germany. In the years to come, recomposing a stable economic and geo-political equilibrium proved to be exceedingly complicated.
Migration Patterns. In the interwar years, “political migration” became an important feature of the international mobility of population. The Bolshevik revolution led significant emigration flows from Russia in the initial years of the revolution. Rising nationalism and xenophobia in Germany led to emigration flows, mainly of Jewish population. General Franco’s Spain in the late 1930s also ignited massive emigration of defeated Republicans and their families from authoritarian Spain. At the same time, on the other side of the Atlantic the United States was restricting immigration since the late 1910s and more fully in the 1920s. In turn, Europe was not particularly open to migration flows and refugees in the interwar years.
Migration flows to the United States fell sharply during the interwar period with its lowest level during the Great Depression years of the 1930s, as we can see in figure 2. Indeed, in some years of that decade, emigration from the United States to Europe reached higher levels than immigration to the U.S causing a unique situation of negative net migration (Chiswick and Hatton 2003 p.74). This interwar period was characterized by increasingly restrictive immigration policies in the New World countries, mainly in the 1920s. Moreover, the great depression of the early 1930s in the United States further contributed to reduce immigration to this country. These restrictive immigration policies in the New World caused an important change in actual migration flows.
21
International migration, capital flows and the global economy: a long run view
As a consequence of the U.S enacting immigration quotas in 1921 and 1924, the flow of immigrants coming from Europe declined from near one million migrants per year to around 350,000 (James, 2001). Canada also enacted list of “preferred source countries” for immigrants (non-preferred countries were those of southern and eastern Europe). In this policy climate, migrants coming from the Old War started to switch to Brazil and Argentina. During this period Argentina received around 3 million immigrants from Europe in the 1920s although as many as 2 millions returned.8 European migration tried to turn also intra-continent with France being the largest and more open recipient of migrants. Italy was the main source country of migration in France. At the same time emigration restrictions were enacted in the Soviet Union that reduced Russia’s share in global migration flows to the Americas. In the early 1930s, South Africa also strongly discouraged immigration as well as Australia that had powerful labor unions, restricted immigration from Eastern Europe and Italy.9
The new League of Nations reformed trade negotiations so they were no longer bilateral and instead was conducted within a framework of large international conferences. Out of the Versailles Treaty, the International Labor Organization was born. Historian Harold James notes that, “rarely had there been so much enthusiasm for internationalism and international institutions as in the 1920s”.10 Yet migration policies had never been stricter.
Importantly, the inauguration of the League of Nations marked a new system of power in European relations based on the quest for economic stability and collective security. For the past three hundred years, Europe’s system was based on a balance of power and alliance system.11 However, the League of Nations proved unable to fulfill the underlying premise of collective’s security - the prevention of war and collective resistance to aggression. This became evident in the League’s failure to respond to the Japanese invasion of Manchuria in 1931, and the 1935 Italian invasion of Abyssinia, the last independent African nation. Without an effective global security system, Germany, under the leadership of Gustav Stresemann -Germany’s Foreign Minister and then Chancellor in 1923 until his death in 1929- was able to successfully rearm.
Besides the rise of Nationalistic ideologies, the inter-war years were isolationist and anti-trade and anti-immigration because of a globalization backlash. A world of passports and visas became pervasive in those years. Hostility to economic globalization, particularly towards the late 1920s was based on the perception that globalism brought inherent instability and volatility to populations already exhausted by economic insecurity and political turbulence in the 1920s. In the 1930s the great depression further contributed to this belief. Globalization in that period was perceived as a system that fails because “humans and the institutions they create cannot handle the psychological and institutional consequences of the interconnected world".12 Another factor that created an atmosphere hostile to globalization was the rise in domestic inequality.13 Economic historians Hatton and Williamson state that this rise of inequality between citizens was another contributing factor to the breakdown of globalization in the interwar years. “It appears that the inequality trends that globalization produced are at least partly responsible for the interwar retreat from globalization manifested by immigration quotas, tariffs, restrictions on international capital flows, competitive devaluations, and other autarkic policy interventions. This fact should make us look to the next century with some anxiety: will the world economy retreat once again from its
8 See Chiswick and Hatton, 1920. 9 See James (2001). 10 See Harold James (2001) p. 25. 11 Polanyi, K. (1944). 12 See Harold James (2001) pp. 4-5. 13 To counteract in-egalitarian trends some European governments tightened immigration policy and increased social spending. In
France, social services accounted for 4.3 percent of central government expenditure in 1912, but 21.7 percent in 1928; the comparable figures for Germany are 5.0 percent and 34.2 percent (see James, 2001).
22
CEPAL - SERIE Macroeconomía del desarrollo N° 35
commitment to globalization?”.14 The League of Nations failure at providing global security generated no effective checks on the growing nationalist movements15 like Nazism in Germany and Fascism in Italy. The rise of extreme nationalism in the form of fascism, Nazism and other national movements in former Austrian-Hungarian countries was not a completely new phenomenon in Europe, although it reached proportions unheard of in the 1930s, mainly in Germany. The roots to central European nationalism that emerged in the inter-war period can be traced back to 1848 and the fall of Prince Klemens von Metternich of the Hapsburg Dynasty. The Revolutions of 1848 and countries exhaustive search for independence began the formation of Nationalism that re-emerged in new forms in the inter-war years. Historian Robert Wiebe provides some interesting insights into the rise and fall of Nationalist movements in Europe over the last 150 years. Wiebe (2002) cites Nationalist movements in Europe as growing out of a vast demographic revolution that doubled Europe’s population between 18th and late 19th century, driving tens of millions of people from the land into cities and across oceans and countries, in the great migrations beginning in 1800. Wiebe (2002) points out that Irish nationalism grew out of overpopulation and famine and centered on hatred of the British. While German nationalism, was rooted in Prussia’s humiliation of its old enemy France in 1870.16
The Nationalist movements that grew in Europe in this time contributed to anti-immigration attitudes and policies and contributed to the animosity that exploded into World War II. This climate led to emigration of Jewish minorities in Central Europe to Britain, north and South America as intolerance and racism developed.
At the same time, both Nazi Germany and Fascist Italy justified the need to conquer new territory in order to support a labor-abundant, land-scarce population. Nazi and Fascist leaders saw territorial expansion as a substitute of emigration. In this vein, Mussolini justified the Italian invasion of Abyssinia as a search for an outlet in Africa for the surplus Italians. In turn, Hitler maintained that his people, who he deemed superior to others, had the right to expand their nation state and territorial holdings to maintain a steady standard of living if population growth infringed on this standard of living.17 Germany’s policy of Lebensraum in the east led to the annexation of Austria and Czechoslovakia in the 1937 complemented by forced emigration of one million of Austrians and two million from Czechoslovakia.18
The Disruption of Global Capital Markets. During the inter- war period capital flows fell dramatically as a consequence of economic and political instability and the use of foreign exchange and capital controls. While the average annual flow of capital from Britain, France, Germany and the United States to the rest of the world was US$1.4 billion between 1911 and 1913, it fell sharply to US$860 million or US$550 million between 1924 and 1928. Moreover, the United States took the place of Britain as “banker of the world” and became the most important foreign creditor, with New York as the new world financial center. Between 1924 and 1930, for example, the United States assumed 60% of global capital flows, estimated at US$9 billion, and possibly as much as US$11 billion, while US$1.3 billion and US$1.34 billion came from Britain and France 14 See Timothy J. Hatton and Jeffrey G. Williamson (1998) p. 248. For further analysis of inequality issues see Solimano, 1998 and
2001b). 15 Harold James asserts in his book, The End of Globalization: Lessons Learned From the Great Depression, that nationalism is derived
by two distinct processes. First, nationalism is a state’s formulation of identities and commonalities in response to an external threat or the perception of a threat. He notes that this can and has easily translated into xenophobia. Secondly, nationalism is a process of institution-building, which is justified by the typical political construct of the 19th century that a nation-state evolved as a defensive mechanism against threats to stability from outside.
16 James J. Sheehan, who wrote the forward to Wiebe’s book, further explains that the rise of Nazism in Germany was an extreme case of the rise of an all powerful state where the state, “entices nationalists into Faustian bargains in which it offers power in exchange for their democratic souls.” Nationalism manipulated historical memory to build exaggerated or false ideas of nationalist identity. In the context of the emergence of Nazism and its’ demagogic leader, scholars point out that Hitler’s authoritarian nationalism partly grew out of his historical memory of Germany’s loss in WWI.
17 Hitler in Mein Kampf cites the “popular” ideology of the need for more land to support a growing population. “The right to possess soil can become a duty if without the extension of its soil a great nation seems doomed to destruction.”See Ian Kershaw ( 1999).
18 See James, 2001.
23
International migration, capital flows and the global economy: a long run view
respectively. Also, during this inter-war period, Germany received the larger part of these capital exports for its reconstruction of the damage of World War I (James 2002, p.48).
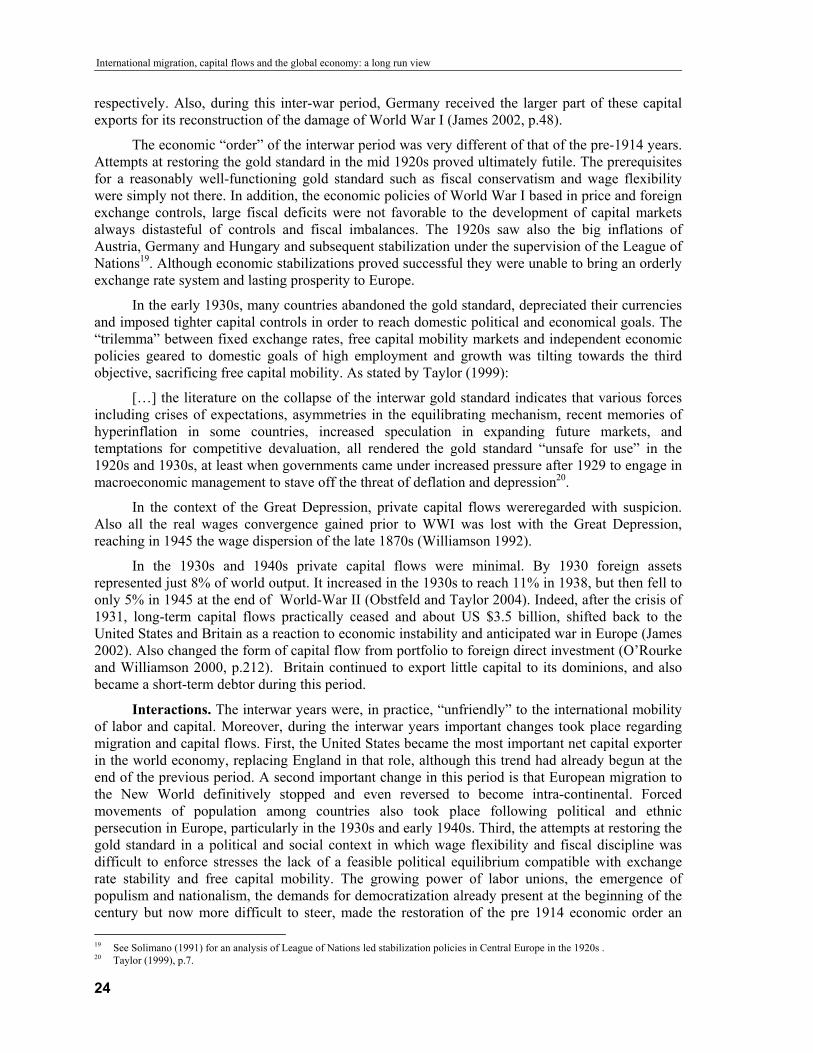
The economic “order” of the interwar period was very different of that of the pre-1914 years. Attempts at restoring the gold standard in the mid 1920s proved ultimately futile. The prerequisites for a reasonably well-functioning gold standard such as fiscal conservatism and wage flexibility were simply not there. In addition, the economic policies of World War I based in price and foreign exchange controls, large fiscal deficits were not favorable to the development of capital markets always distasteful of controls and fiscal imbalances. The 1920s saw also the big inflations of Austria, Germany and Hungary and subsequent stabilization under the supervision of the League of Nations19. Although economic stabilizations proved successful they were unable to bring an orderly exchange rate system and lasting prosperity to Europe.
In the early 1930s, many countries abandoned the gold standard, depreciated their currencies and imposed tighter capital controls in order to reach domestic political and economical goals. The “trilemma” between fixed exchange rates, free capital mobility markets and independent economic policies geared to domestic goals of high employment and growth was tilting towards the third objective, sacrificing free capital mobility. As stated by Taylor (1999):
[…] the literature on the collapse of the interwar gold standard indicates that various forces including crises of expectations, asymmetries in the equilibrating mechanism, recent memories of hyperinflation in some countries, increased speculation in expanding future markets, and temptations for competitive devaluation, all rendered the gold standard “unsafe for use” in the 1920s and 1930s, at least when governments came under increased pressure after 1929 to engage in macroeconomic management to stave off the threat of deflation and depression20.
In the context of the Great Depression, private capital flows wereregarded with suspicion. Also all the real wages convergence gained prior to WWI was lost with the Great Depression, reaching in 1945 the wage dispersion of the late 1870s (Williamson 1992).
In the 1930s and 1940s private capital flows were minimal. By 1930 foreign assets represented just 8% of world output. It increased in the 1930s to reach 11% in 1938, but then fell to only 5% in 1945 at the end of World-War II (Obstfeld and Taylor 2004). Indeed, after the crisis of 1931, long-term capital flows practically ceased and about US $3.5 billion, shifted back to the United States and Britain as a reaction to economic instability and anticipated war in Europe (James 2002). Also changed the form of capital flow from portfolio to foreign direct investment (O’Rourke and Williamson 2000, p.212). Britain continued to export little capital to its dominions, and also became a short-term debtor during this period.
Interactions. The interwar years were, in practice, “unfriendly” to the international mobility of labor and capital. Moreover, during the interwar years important changes took place regarding migration and capital flows. First, the United States became the most important net capital exporter in the world economy, replacing England in that role, although this trend had already begun at the end of the previous period. A second important change in this period is that European migration to the New World definitively stopped and even reversed to become intra-continental. Forced movements of population among countries also took place following political and ethnic persecution in Europe, particularly in the 1930s and early 1940s. Third, the attempts at restoring the gold standard in a political and social context in which wage flexibility and fiscal discipline was difficult to enforce stresses the lack of a feasible political equilibrium compatible with exchange rate stability and free capital mobility. The growing power of labor unions, the emergence of populism and nationalism, the demands for democratization already present at the beginning of the century but now more difficult to steer, made the restoration of the pre 1914 economic order an 19 See Solimano (1991) for an analysis of League of Nations led stabilization policies in Central Europe in the 1920s . 20 Taylor (1999), p.7.
24
CEPAL - SERIE Macroeconomía del desarrollo N° 35
ephemeral and ultimately futile goal. The instability of the 1920s, the depression of the early 1930s and an anti-globalization sentiment (without that name) were all inimical to the free mobility of people and capital across national boundaries. In this environment, there was a proliferation of immigration quotas, visa systems, ethnic discrimination, tariffs, restrictions on international capital flows, competitive devaluations, and other autarkic policy interventions. Definitely a strong departure from the liberal economic policies and cosmopolitanism of the pre- 1914 era. In Latin America, the instability of capital markets in the 1920 affected the supply of foreign capital and the depression of the 1930s hit hard the economies of the region and prompted the adoption of inward -looking, import- substitution policies.
3. The post 1945 period: reconstruction and the second wave of globalization
Towards the end of World-War II (WWII) , it was clear that economic reconstruction and global peace needed a new set of political and financial institutions at international level. Global capitalism was seen an inherently unstable system; prone both to periods of volatility and inflation, as in the 1920s, or to recessionary trends without self correcting mechanisms that assure full employment, as it was patently demonstrated in the 1930s.
The United Nations was formed to preserve world peace and boost economic development in less advanced areas of the world. A new set of global financial institutions emerged in the mid 1940s, known as the Bretton Woods Institutions largely shaped under the dictum of the United States and the United Kingdom personified in their key representatives Harry Dexter White and John Maynard Keynes, respectively. The International Monetary Fund was given the mandate of assuring a normal payments system under a system of fixed exchange rates, and providing external financing to countries running balance of payments deficits. Private capital movements were maintained closely restricted. The role of the World Bank was to provide long term financing for economic reconstruction and development. A world trade organization was proposed but never implemented (until the mid 1990s with the creation of the World Trade Organization); the International Labor Office, founded, in 1919 continued its existence.
The end of the war, the economic reconstruction of Europe and the rebuilding of trade and investment relations among nations in the second half of the 1940s and early 1950s gave rise to a new period of economic prosperity and stability in the global economy that lasted until the early 1970s (the so-called “golden age of capitalism”). This period has been a period of Pax Americana with the U.S dollar as the main world currency for international transactions. The post 1945 period can be usefully divided in two sub-periods: the Bretton-Woods era lasting until 1971-73 and the post 1973 period of flexible exchange rates, financial globalization and increased migration flows.
Migration Patterns. International labor markets operate under a more constrained immigration policy framework than the one that existed until 1913 but probably freer than in the inter-war years. Whereas the recovery post-World War II encouraged more permissive immigration policies in developed countries at the beginning of that period, increasing immigration and slower real-wage growth during the 1970s forced these countries to switch back to more restrictive immigration policies, in particular for people with low skills and the poor. In contrast, well-educated, skilled migrants (e.g. international executives, information technology experts, etc.) face much more open immigration regimes than less skilled labor in industrial countries. Thus, these constraints exerted on migration flow limited strongly the potential of migration and caused an excess of immigration demand, that exerted pressure on receiving countries in the form of increasing waiting list and illegal immigration. (Hatton and Williamson 2002, pp.2-3)
25
International migration, capital flows and the global economy: a long run view
The direction of international migration flows changed significantly during the second half of the 20th century. European emigration (which lasted until the 1950s) declined and immigration to the United States, Canada and Europe from Latin America, Asia and Africa increased.21 In the 1820-1920 period, European migration to the U.S was around 88 percent of total migration, in contrast in the period 1971-1998 the percentage of European migration declined to around 14 percent.22
Total immigration to the United States increased from about 1 million migrants per decade in the 1940s and 2.5 million migrants in the 1950s to near 7.5 million migrants per decade, on average, in the 1980s and 1990s.23 Still as a share of total population international migration to the U.S in the post 1970 period is below that of the first wave of globalization (1870-1913). The United States underwent since the 1960s significant changes in the legislation regarding immigration.24 The 1965 amendment to the Immigration and Naturalization Act was intended to regulate immigration through a preference system according to family status regarding US citizens and encouraged immigrants with skills in short supply in the U.S. Nationality quotas were still in effect but an attempt was made to avoid ethnic discrimination. That legislation was changed again in 1986 in an attempt at trying to curb illegal immigration through tightened border control while at the same time creating schemes of regularization of aliens. The 1990 Immigration Act replaced the system of preference based on family reunification by a system of visas distribution according to occupational attributes. In turn, another law amendment in 1996 sought to further reduce illegal migration through a new Illegal Immigrant Reform and Responsibility Act.
The role of Europe as a source of migrants also changed in the post 1950 world. After WWII, as Europe was recovering from the war, and through the 1950s, many Europeans left to the United States, Canada, Argentina, Australia and other countries in search for better economic conditions. However, as European output and job creation accelerated in the 1950s and income per capita differentials with destination countries narrowed (i.e. Argentina’s advantage over Italy and Spain disappeared completely in the 1970s) the incentives to emigrate overseas started to fade away. At the same time, intra-European migration increased reflecting income per capita differentials within Europe. In the 1960s and 1970s there was significant migration from Portugal, Spain, Italy to richer European countries such as Germany, France, England, Sweden and others. In turn, severe restrictions to international migration from the socialist countries of Eastern Europe to the west were enacted since the mid to late 1950s. A reality that changed swiftly after the collapse of communism in the late 1980s and early 1990s led to emigration from Russia, and other Eastern European countries to Western Europe, the U.S, Israel and other destinations; an option largely closed under the “ancien socialist regime”.25 In the European Union (EU) immigration policies are, largely, defined at supra-national level. The main feature of EU migration policies is a sharp distinction between the EU and non-EU origin of the migrants: while EU citizens have full rights to reside and work in any country of the Union, the latter faces restrictions to immigration and needs working visas to reside legally and work in the European Union area. International migration from the new member countries to the EU will be subject to a transitional period of 7 years. The schedule for trade liberalization and capital mobility is in general faster than for migration.
21 In the period 1971-98, the main source region of immigration to the U.S. was Latin America (46 percent of the total), followed by
immigration from Asia (34 percent). Historically, Mexico, Cuba and the Dominican Republic are the principal Latin American sending countries of immigrants. Illegal migration in the U.S. rose during the 1990s, from 3.3 millions in 1992 to 5 millions in 1996. Illegal immigrants in the US are coming from several countries: Mexico followed by El Salvador, Guatemala, Haiti, Honduras, Canada and the Philippines. The main Asian sending countries were the Philippines, China, Korea and India, and the main European sending countries are Germany, Italy, United Kingdom and Ireland.
22 Source OECD (2003) “Trends in International Migration” p.19. 23 International migration to the U.S as a share of total population, declined from around 7 percent in the period 1871-1920 to 2.5
percent in the last third of the 20th century. Between 1999 and 2000, nearly 850,000 new permanent immigrants were admitted in 2000, up more than 30% from the previous year.
24 For a discussion of U.S. immigration policies since the 1960s, see Sassen (1998) and Jasso, Rosenzweig and Smith (1998). 25 See Solimano (2002a).
26
CEPAL - SERIE Macroeconomía del desarrollo N° 35
Freedom of movement is much older in the Nordic countries (Denmark, Finland, Iceland, Norway, and Sweden), a passport-free zone since 1954. Furthermore, in 1996, Denmark, Finland, and Sweden joined the Schengen system,26 while Iceland and Norway (non-EU members) negotiated co-operation agreements. Even older practices in this regard can be found in Austral-Asia where, since 1920 there has been no restriction on mobility between New Zealand and Australia. In 1973 both countries signed the Trans-Tasman Travel Arrangement, which allowed both countries citizens to live and work in either country free of permits.
In contrast, North America (including Mexico) is a case in which free trade and liberal foreign investment policies among Canada, the U.S and Mexico co-exist with restrictive migration policies for migrants coming from Mexico. In fact, NAFTA, in effect since 1994, authorizes only a limited number of temporary work visas for Mexicans, and unlimited temporary work visas (TN visa) for Canadians.27.28
During the 1990s, OECD countries have tended to favor trade agreements over common markets with third countries (taking the EU as a unity) as the later arrangement would imply free immigration policies within a common market area. In the case of NAFTA, liberalization of trade and investment between the U.S. and Canada with Mexico did not include a relaxation of the barriers to entry of migrants from Mexico to the U.S. (rather NAFTA tightened them). In the case of the EU, an interesting case is Turkey, a country with large emigration flows towards Europe. The EU signed a trade agreement with Turkey but postponed, for later periods, negotiations for full people mobility in the EU.
Evolution of global capital markets. International capital mobility increased very gradually between 1945 and 1971 in the Bretton-Woods system but accelerated significantly in the 1970s, 1980s and particularly in the 1990s when confidence in global capital markets was greatly boosted by the collapse of communism and the growing enthusiasm with market economics promoted by the U.S. Developed economies integrated their capital markets with each other much more rapidly than developing countries . Capital account convertibility among industrial countries started in the 1970s and was fully completed in the 1990s. In turn, several Latin American countries and other developing nations, although opened their economies to private capital inflows in the 1970s, they suffered the debt crises of the early 1980s that induced them to slow down or even reverse capital account convertibility. In the 1990s convertibility in the capital account was advanced in developing countries but cautiously due to the high frequency of financial crises in that decade.29
Financial integration in the post 1980 period shows various features that makes it different from the pre 1914 period of high international capital mobility. First, in the pre-1914 period, most capital inflows were unidirectional and took the form of long term capital. As Obstfeld and Taylor (2004) note the United Kingdom, France and Germany, main capital exporters at that time, took dominant one- way positions in their portfolios. The exception was the United States that had large capital outflows and inflows. Currently, most capital flows occur between rich and industrialized countries,which is an important difference with the first wave of globalization. At the turn of the 20th century, in 1900, the less developed countries of Asia, Latin America and Africa received 33% of global liabilities. In 1990 only 11% of global liabilities 26 The Schengen Treaty is an agreement originally signed in March 1995, by the seven EU countries. As of 2003 there are fifteen
Schengen signatories and they include: Austria, Belgium, Denmark, Finland, France, Germany, Iceland, Italy, Greece, Luxembourg, the Netherlands, Norway, Portugal, Spain, and Sweden. The goal of this treaty is to end border checkpoints and controls within the Schengen area and harmonize external border controls. Source: Wikipedia Encyclopedia. http://www.wikipedia.org/wiki/Schengen_treaty.
27 Another case is important to note within U.S. immigration policies and that is Puerto Rico. Formerly a Spanish colony, Puerto Rico became a commonwealth state of the U.S. in 1898 during the Spanish-American War. Puerto Ricans were granted a special status of U.S. citizenship in 1917 that gave them all the rights and duties associated with American citizenship, except the right to vote in presidential elections. According to the 2000 census figures, Puerto Rico has a population of 3.6 million plus about 3.4 million Puerto Ricans living in the United States (see OECD, 2003).
28 Source OECD (2003) “Trends in International Migration” p. 34. 29 See Eichengreen ( 2003) and Obstfeld and Taylor ( 2004). The crises of that period include Mexico 1994-95, Asia 1997, Russia
1998, Brazil 1999, Turkey in 2001 and Argentina in 2001-02.
27
International migration, capital flows and the global economy: a long run view
went to these same countries, which account for the bulk of the world population and a significant part of the world output. Also we can see that the majority of today’s asset holders, which are OECD countries, are also liability holders (Obstfeld and Taylor 2004). Since the 1970s, gross stocks have expanded rapidly but not net stocks. In today’s world capital flows and foreign investment aims for risk sharing and diversification instead of long-term financing to build infrastructure and housing as was the case in the pre 1914 world. Regarding the direction of international capital flows we face the so-called Lucas Paradox in which there is too little capital flows to capital-scarce, poor countries. As we discussed before the list of factors why this is the case include the lack of educated and properly trained work force in poor countries, lack of enforceable property rights, bureaucracy, political instability, weak institutions, small domestic markets and other factors. The literature of growth under increasing returns suggest that capital, skilled labor, superior institutions tend to go together and concentrate in a certain group of countries (Easterly 2001). This is an important result that can help to explain why migration and capital flows tend to go together. Also, while the correlation of investments and savings demonstrates that the financial markets are not more integrated today than at the beginning of the 20th century, a change occurred in the composition of capital flows, especially an increase of the short-term capital flows relatively to long-term capital flows (Baldwin and Martin 1999).
Another difference between the first wave of globalization and contemporaneous financial globalization is the importance of capital flows as proportion of savings and investment of source and receiving countries. Although financial globalization since the 1970s and 1980s has expanded very rapidly in relative terms it is lower than in the pre-1914 world. In fact, Obstfeld and Taylor (2004) report that in 1900-1913 overseas investment represented about one half of domestic savings of the U.K (and one-third, on average, between 1870 and 1914). In other capital exporter countries such as Germany, overseas investment represented about 10 percent of national savings in 1910-1913. In turn, around 50 percent of the capital stock of Argentina in 1914 was in hands of foreigners (in Canada and Australia that percentage was in the range 20-30 percent). These numbers are lower in the new wave of globalization. After 1970 the ratio of net capital outflows over savings in the capital exporting countries never exceeded 5 percent (this is influenced by the large current account deficits of the United States). In turn, capital inflows, on average, in the same period never exceeded 15 percent of investment in capital importing countries (Obstfeld and Taylor, 2004).
After World War I British financial hegemony was replaced by the United States as the main capital exporter of the world economy. The US role as a net capital exporter lasted until the early 1980s when it started to run persistent current account deficits, importing savings from the rest of the world to finance a level of expenditure above its real output.30 In 2002-2003 the current account deficit of the US is about 5 percent of its Gross Domestic Product or near 500 billion U.S dollars. In contrast, countries such as Japan, China, Korea are running large current account surpluses and/or holding large sotcks of international reserves in U.S. dollars in these years contributing to finance the savings short-fall of the United States (see table 7).
Interactions. The evolution of international migration and capital flows has followed relatively similar trends since the second half of the 1940s. Taking as an indicator migration to the United States, both capital flows and migration followed a gradual increase between 1945 and about 1980 to further accelerate afterwards. The direction of labor and capital flows is as follows: labor emigrates from relatively low real wages countries in Latin America, Asia and Africa to high real wage OECD countries (mainly United States, Canada and Europe) in a direction “south to –north”. In contrast, the direction of capital flows in the post 1980 period is dominantly “north-north” (say capital flows between rich -industrialized countries in “diversification-finance” fashion). The lack of sizeable and diversified capital flows to the south deprives these nations from potential new capital and new jobs; as a result people migrates to rich economies looking for better job opportunities. Of course this is a simplification as certain large and relatively poor countries such as 30 In the 1980s and up to 1993 and after 2000, U.S public sector deficits contributed significantly to the current account deficits.
28
CEPAL - SERIE Macroeconomía del desarrollo N° 35
China and other Asian economies currently receive large of flows foreign investment. However, the pattern of international investment is tilted to a handful of countries.
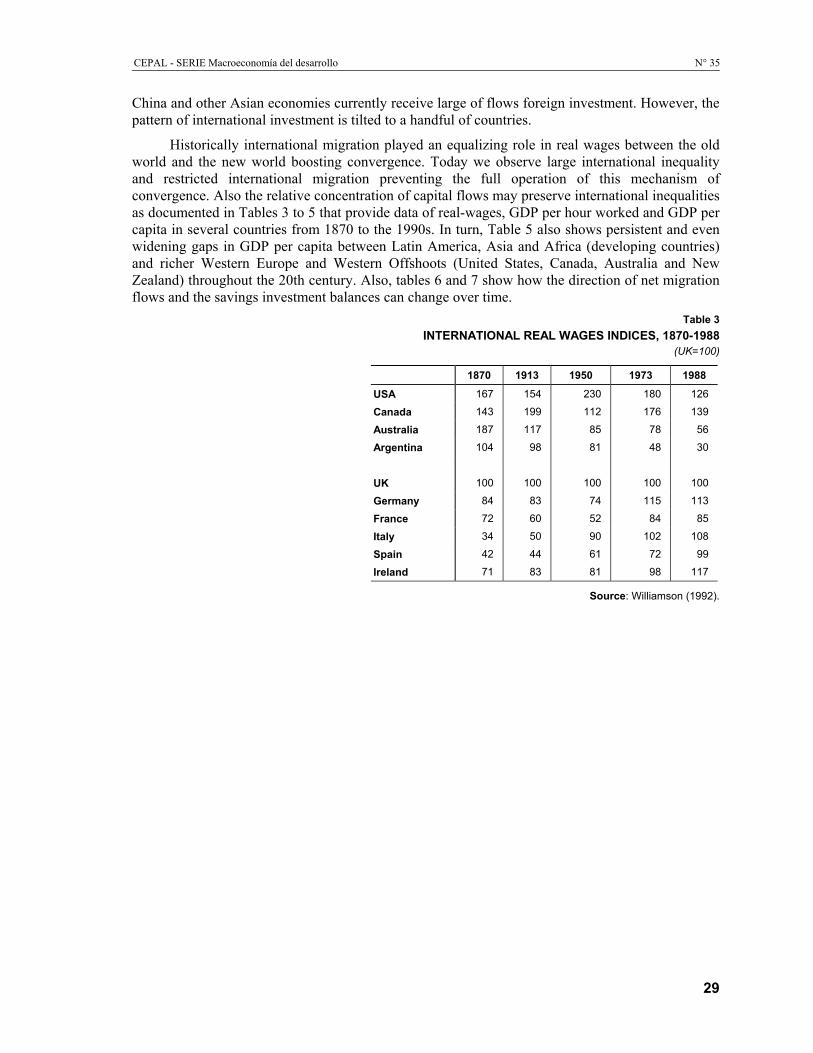
Historically international migration played an equalizing role in real wages between the old world and the new world boosting convergence. Today we observe large international inequality and restricted international migration preventing the full operation of this mechanism of convergence. Also the relative concentration of capital flows may preserve international inequalities as documented in Tables 3 to 5 that provide data of real-wages, GDP per hour worked and GDP per capita in several countries from 1870 to the 1990s. In turn, Table 5 also shows persistent and even widening gaps in GDP per capita between Latin America, Asia and Africa (developing countries) and richer Western Europe and Western Offshoots (United States, Canada, Australia and New Zealand) throughout the 20th century. Also, tables 6 and 7 show how the direction of net migration flows and the savings investment balances can change over time.
Table 3 INTERNATIONAL REAL WAGES INDICES, 1870-1988
(UK=100)
1870 1913 1950 1973 1988
USA 167 154 230 180 126
Canada 143 199 112 176 139
Australia 187 117 85 78 56
Argentina 104 98 81 48 30
UK 100 100 100 100 100
Germany 84 83 74 115 113
France 72 60 52 84 85
Italy 34 50 90 102 108
Spain 42 44 61 72 99
Ireland 71 83 81 98 117
Source: Williamson (1992).
29
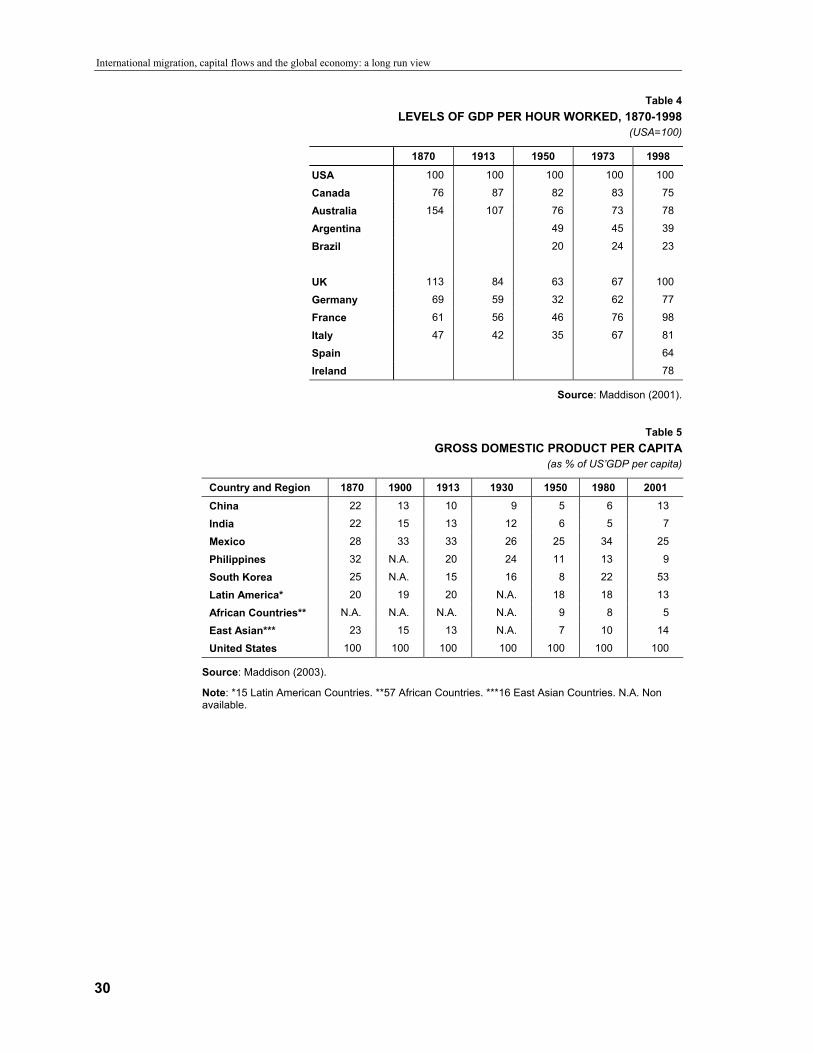
International migration, capital flows and the global economy: a long run view
Table 4 LEVELS OF GDP PER HOUR WORKED, 1870-1998
(USA=100)
1870 1913 1950 1973 1998
USA 100 100 100 100 100
Canada 76 87 82 83 75
Australia 154 107 76 73 78
Argentina 49 45 39
Brazil 20 24 23
UK 113 84 63 67 100
Germany 69 59 32 62 77
France 61 56 46 76 98
Italy 47 42 35 67 81
Spain 64
Ireland 78
Source: Maddison (2001).
Table 5 GROSS DOMESTIC PRODUCT PER CAPITA
(as % of US’GDP per capita)
Country and Region 1870 1900 1913 1930 1950 1980 2001
China 22 13 10 9 5 6 13
India 22 15 13 12 6 5 7
Mexico 28 33 33 26 25 34 25
Philippines 32 N.A. 20 24 11 13 9
South Korea 25 N.A. 15 16 8 22 53
Latin America* 20 19 20 N.A. 18 18 13
African Countries** N.A. N.A. N.A. N.A. 9 8 5
East Asian*** 23 15 13 N.A. 7 10 14
United States 100 100 100 100 100 100 100
Source: Maddison (2003).
Note: *15 Latin American Countries. **57 African Countries. ***16 East Asian Countries. N.A. Non available.
30
CEPAL - SERIE Macroeconomía del desarrollo N° 35
IV. Retrospect
This paper shows that between 1870 and the early 21st century the world economy went through very different phases and policy regimes that affected in significant ways the direction and magnitudes of the international mobility of people and capital across countries and regions of the world. The first wave of globalization (1870-1913) entailed free international mobility of capital under the gold standard along with largely unrestricted labour mobility across national borders. This led to convergence in real wages and per capita income between the old and new worlds (Europe and the settler economies) but that convergence was largely absent for countries and regions outside that international circuit of “massive migration” and capital mobility. The pre- 1914 economic and political order collapsed with World War I, giving rise to two decades of economic instability, inflation, exchange and capital controls, depression and exacerbated nationalism. These trends were clearly inimical to both international migration and international capital mobility. Internartional trade became also more restrictive in that period. Attempts to restore the gold standard in the mid 1920s were ultimately inconsistent with the new realities of increasing social mobilization, stronger labour unions and growing demands for democratisation that shattered public finances and reduced the room for wage flexibility. After World War II a new economic and political equilibrium developed under a dominant role of the United States and a growing competition with the emergent socialist block. Until the early 1970s, domestic objectives of full employment, growth and social progress took prominence over international capital mobility.
The Bretton Woods era presided over a quarter century of a “golden age of capitalism” characterized by rapid growth, stability and managed market economies. Nevertheless, the internal
31
International migration, capital flows and the global economy: a long run view
contradictions of the system proved to be inescapable. The monetary order of the dollar-gold o fixed parities was abandoned in the early 1970s after cumulative fiscal deficits in the U.S and divergent trends in productivity growth among industrial economies. A system of floating exchange rates among main currencies substituted the Bretton Woods parities and gold convertibility was phased out. Capital markets started to flourish helped by the abundance of petrodollars and by the reduction of barriers to capital mobility among developed economies and gradually also in developing countries. In the 1990s the post-communist euphoria that took over global capital markets was only cooled –down by repeated financial crisis in Latin America, Asia and Russia. Currently an important part of international capital flows takes place between developed countries with mature and sophisticated financial systems and full convertibility in their capital accounts. A trend of north-north finance combined with south-north migration accompany the large disparities of national income per capita in the world economy. Convergence in per capita income takes place mainly between OECD economies as almost a century before it was between the old and new worlds.
International migration flows started to pick-up in the 1980s and 1990s mainly to the United States, a country of many job and business opportunities, although migration flows measured as share of total U.S. population never reached the levels achieved in the first wave of globalization. Throughout the 20th century, with the exception of some years in the interwar period, the U.S was a net immigration country, first from Europe and then from developing countries. However in the 1980s the United States started to run current account deficits and eventually became a net debtor country that sustain a higher level of domestic expenditure than output by drawing on savings from the rest of the world. How these imbalances will be corrected in the years ahead will be critical for the world economy and the patterns of labor migration and capital mobility.
32
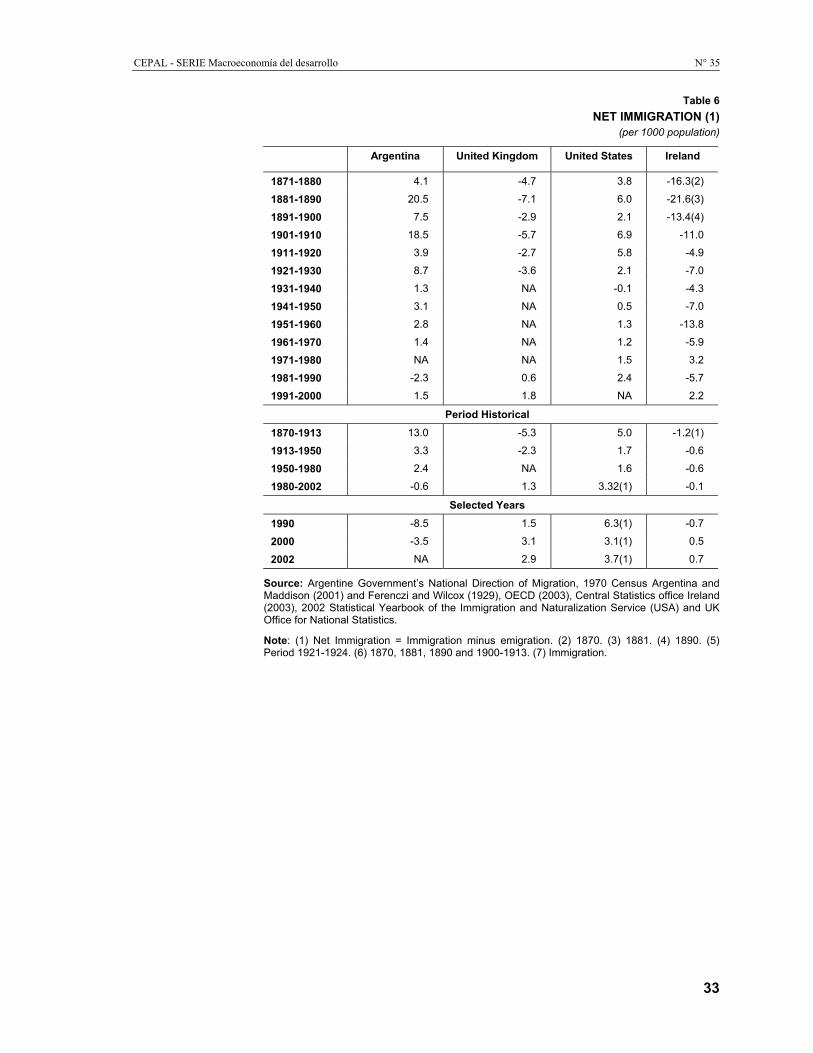
CEPAL - SERIE Macroeconomía del desarrollo N° 35
Table 6 NET IMMIGRATION (1)
(per 1000 population)
Argentina United Kingdom United States Ireland
1871-1880 4.1 -4.7 3.8 -16.3(2)
1881-1890 20.5 -7.1 6.0 -21.6(3)
1891-1900 7.5 -2.9 2.1 -13.4(4)
1901-1910 18.5 -5.7 6.9 -11.0
1911-1920 3.9 -2.7 5.8 -4.9
1921-1930 8.7 -3.6 2.1 -7.0
1931-1940 1.3 NA -0.1 -4.3
1941-1950 3.1 NA 0.5 -7.0
1951-1960 2.8 NA 1.3 -13.8
1961-1970 1.4 NA 1.2 -5.9
1971-1980 NA NA 1.5 3.2
1981-1990 -2.3 0.6 2.4 -5.7
1991-2000 1.5 1.8 NA 2.2
Period Historical
1870-1913 13.0 -5.3 5.0 -1.2(1)
1913-1950 3.3 -2.3 1.7 -0.6
1950-1980 2.4 NA 1.6 -0.6
1980-2002 -0.6 1.3 3.32(1) -0.1
Selected Years
1990 -8.5 1.5 6.3(1) -0.7
2000 -3.5 3.1 3.1(1) 0.5
2002 NA 2.9 3.7(1) 0.7
Source: Argentine Government’s National Direction of Migration, 1970 Census Argentina and Maddison (2001) and Ferenczi and Wilcox (1929), OECD (2003), Central Statistics office Ireland (2003), 2002 Statistical Yearbook of the Immigration and Naturalization Service (USA) and UK Office for National Statistics.
Note: (1) Net Immigration = Immigration minus emigration. (2) 1870. (3) 1881. (4) 1890. (5) Period 1921-1924. (6) 1870, 1881, 1890 and 1900-1913. (7) Immigration.
33
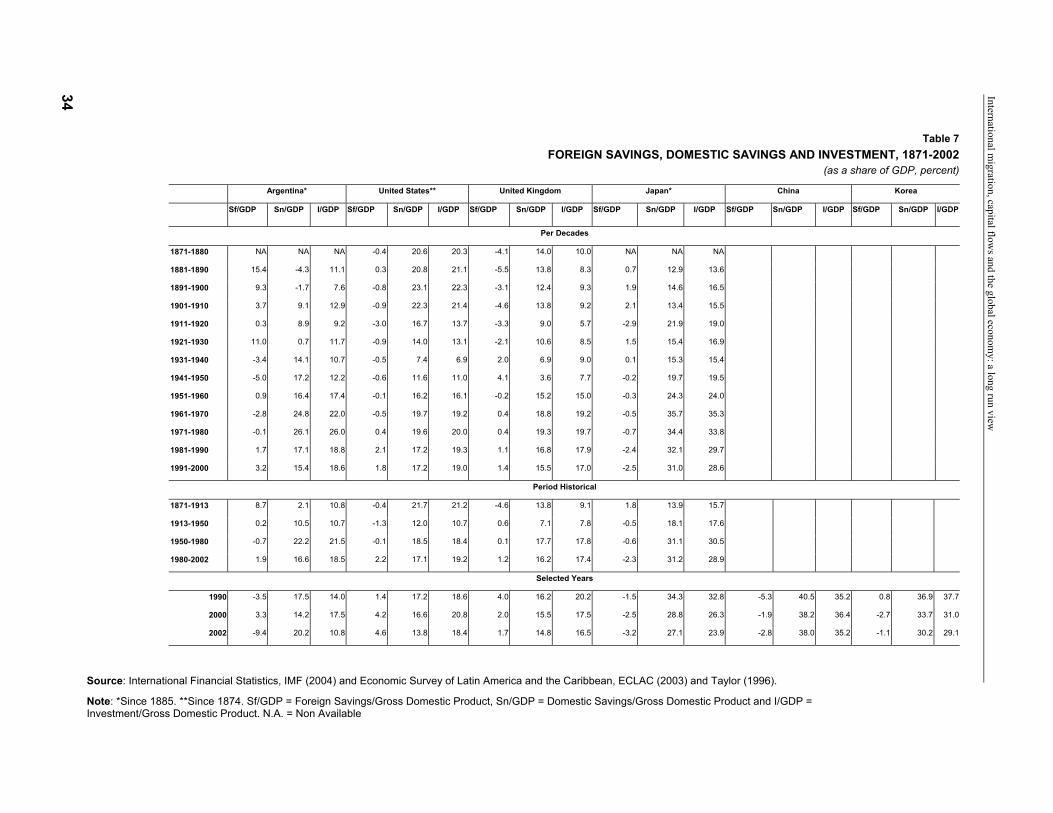
Table 7 FOREIGN SAVINGS, DOMESTIC SAVINGS AND INVESTMENT, 1871-2002
(as a share of GDP, percent)
Argentina* United States** United Kingdom Japan* China Korea
Sf/GDP Sn/GDP I/GDP Sf/GDP Sn/GDP I/GDP Sf/GDP Sn/GDP I/GDP Sf/GDP Sn/GDP I/GDP Sf/GDP Sn/GDP I/GDP Sf/GDP Sn/GDP I/GDP
Per Decades
1871-1880 NA NA NA -0.4 20.6 20.3 -4.1 14.0 10.0 NA NA NA
1881-1890 15.4 -4.3 11.1 0.3 20.8 21.1 -5.5 13.8 8.3 0.7 12.9 13.6
1891-1900 9.3 -1.7 7.6 -0.8 23.1 22.3 -3.1 12.4 9.3 1.9 14.6 16.5
1901-1910 3.7 9.1 12.9 -0.9 22.3 21.4 -4.6 13.8 9.2 2.1 13.4 15.5
1911-1920 0.3 8.9 9.2 -3.0 16.7 13.7 -3.3 9.0 5.7 -2.9 21.9 19.0
1921-1930 11.0 0.7 11.7 -0.9 14.0 13.1 -2.1 10.6 8.5 1.5 15.4 16.9
1931-1940 -3.4 14.1 10.7 -0.5 7.4 6.9 2.0 6.9 9.0 0.1 15.3 15.4
1941-1950 -5.0 17.2 12.2 -0.6 11.6 11.0 4.1 3.6 7.7 -0.2 19.7 19.5
1951-1960 0.9 16.4 17.4 -0.1 16.2 16.1 -0.2 15.2 15.0 -0.3 24.3 24.0
1961-1970 -2.8 24.8 22.0 -0.5 19.7 19.2 0.4 18.8 19.2 -0.5 35.7 35.3
1971-1980 -0.1 26.1 26.0 0.4 19.6 20.0 0.4 19.3 19.7 -0.7 34.4 33.8
1981-1990 1.7 17.1 18.8 2.1 17.2 19.3 1.1 16.8 17.9 -2.4 32.1 29.7
1991-2000 3.2 15.4 18.6 1.8 17.2 19.0 1.4 15.5 17.0 -2.5 31.0 28.6
Period Historical
1871-1913 8.7 2.1 10.8 -0.4 21.7 21.2 -4.6 13.8 9.1 1.8 13.9 15.7
1913-1950 0.2 10.5 10.7 -1.3 12.0 10.7 0.6 7.1 7.8 -0.5 18.1 17.6
1950-1980 -0.7 22.2 21.5 -0.1 18.5 18.4 0.1 17.7 17.8 -0.6 31.1 30.5
1980-2002 1.9 16.6 18.5 2.2 17.1 19.2 1.2 16.2 17.4 -2.3 31.2 28.9
Selected Years
1990 -3.5 17.5 14.0 1.4 17.2 18.6 4.0 16.2 20.2 -1.5 34.3 32.8 -5.3 40.5 35.2 0.8 36.9 37.7
2000 3.3 14.2 17.5 4.2 16.6 20.8 2.0 15.5 17.5 -2.5 28.8 26.3 -1.9 38.2 36.4 -2.7 33.7 31.0
2002 -9.4 20.2 10.8 4.6 13.8 18.4 1.7 14.8 16.5 -3.2 27.1 23.9 -2.8 38.0 35.2 -1.1 30.2 29.1
International migration, capital flow
s and the global economy: a long run view
34
Source: International Financial Statistics, IMF (2004) and Economic Survey of Latin America and the Caribbean, ECLAC (2003) and Taylor (1996).
Note: *Since 1885. **Since 1874. Sf/GDP = Foreign Savings/Gross Domestic Product, Sn/GDP = Domestic Savings/Gross Domestic Product and I/GDP = Investment/Gross Domestic Product. N.A. = Non Available
CEPAL - SERIE Macroeconomía del desarrollo N° 35
Bibliography
Baldwin, Richard E. and Philippe Martin (1999), “Two Waves of Globalization: Superficial Similarities, Fundamental Differences”, NBER Working Paper Series, no.6904.
Bordo, Michael D., Eichengreen, Barry and Jongwoo Kim (1998), “Was There Really an Earlier Period of International Financial Integration Comparable to Today ?”, NBER Working Paper Series, no.6738.
Borjas, G. (2001), Heaven’s Door. Princeton University Press. Bunge, A. and C. Garcia-Mata (1969), Argentina in W. Willcox, International
Migrations, NBER. Carrington, W. and E. Detraigiache (1998), “How Big is the Brain Drain?”
IMF, Working Paper/98/102. Chiswick, Barry R. and Timothy J. Hatton (2003), “International Migration
and the Integration of Labor Markets” in Michael D. Bordo, Alan M. Taylor and Jeffrey G. Williamson, Globalization in Historical Perspective, Chicago, The University of Chicago Press, 2003.
Clemens, Michael A. and Jeffrey G. Williamson (2000), “Where Did British Foreign Capital Go? Fundamentals, Failures and the Lucas Paradox. 1870-1913”, NBER Working Paper Series, no.8028, December.
Cline, W. (1997), Trade and Income Distribution, Washington: Institute for International Economics.
Della Paolera G. and A. Taylor (1997), “Economic Recovery From the Argentine Great Depression: Institutions, Expectations and the Change of Macroeconomic Regime”, NBER Working Paper, no.6767.
Diaz-Alejandro, C.F. (1970), Essays on the Economic History of the Argentine Republic, New Haven: Yale University Press.
ECLAC (2002a), Globalization and Development, Report for bi-annual session period, of ECLAC Brazilia.
______ (2002b), Estudio económico de América Latina y el Caribe 2001-2002, Naciones Unidas.
35
International migration, capital flows and the global economy: a long run view
Eichengreen, B. (1995), Globalizing Capital. A History of the International Monetary System. Princeton University Press.
Feis, H. (1930), Europe, The World’s Banker 1870-1914, New Haven, Conn.: Yale University Press. Hatton, Timothy J. and Jeffrey G. Williamson (2002), “What Fundamentals Drive World Migration”, NBER
Working Paper Series, no.9159. Hatton, Timothy J. and J.G. Williamson (1998), The Age of Mass Migration. Causes and Economic Impact.
Oxford University Press. ______ (1998), “What This Book Is About” and “The Issues” in The Age of Mass Migration: Causes and
Economic Impact, New York: Oxford University Press. Holloway, T. H. (1977), “Immigration and Abolition. The Transition from Slave to Free Labor in the Sao
Paulo Coffee Zone” in Alden, D. and W. Dean (eds) Essays Concerning the Socioeconomic History of Brazil and Portuguese India. A Florida International University Book. The University Presses of Florida, Gainsville.
Jachimowicz, M. (July 1, 2003), “Report Alleges Abuse of Immigrant Detainees Post Sept. 11” Migration Policy Institute.
James, H. (2001), The End of Globalization. Lessons from the Great Depression, Harvard University Press. Jasso, G., Rosenzweig M. and J. Smith (1998), “The Changing Skill of New Immigrants to the United States:
Recent Trends and their Determinants” NBER Working Paper N. 6764, Cambridge, MA. Kershaw, I. (1999), Hitler 1889-1936: Hubris. New York: W.W Norton. Kevles, D. (July/August, 2003) “Biotech’s Big Chill” MIT Technology Review. Lindert, P. and J. Williamson (2000), “Does Globalization Make the World More Unequal?”, in M. Bordo, A.
Taylor and J. Williamson editors Globalization in Historical Perspective Chicago, The University of Chicago Press.
Lucas, Robert E. (1990), “Why Doesn’t Capital Flow from Rich to Poor Countries?”, The American Economic Review, vol.80, no.2, May.
Maddison, A.(2001), The World Economy. A Millennian Perspective, Development Center, OECD. Marglin, S. and J. Schor (1991), The Golden Age of Capitalism. Oxford University Press. Obstfeld, Maurice and Alan M. Taylor (2004) Global Capital Markets. Integration, Crisis and Growth.
Cambridge University Press. ______ (2003), “Globalization and Capital Markets” in Michael D. Bordo, Alan M. Taylor and Jeffrey G.
Williamson, Globalization in Historical Perspective, Chicago, The University of Chicago Press. OECD (2003), Trends in International Migration. ______ (2002), OECD Economic Outlook, vol.2, no.72, December. O’Rourke, K. and Williamson J. (2000), Globalization and History. The Evolution of a Nineteenth-Century
Economy, The MIT Press. Polanyi, K. (1994), The Great Transformation. Beacon Press. Sassen, S. (1998), Globalization and its Discontents. Essays on the New Mobility of People and Money. The
New Press. Solberg, C.E. (1978), “Mass Migration in Argentina, 1870-1970” in W. H. McNeill and R. S. Adams,
(editors) Human Migration, Patterns and Policies. ______ (1970), Immigration and Nationalism, Argentina and Chile, 1890-1914. University of Texas Press,
Austin and London. Stone, I. (1999), “The Global Export of Capital from Great Britain, 1865-1914”, St. Martin’s Press, New
York. Solimano, A. (2002a), “Globalizing Talent and Human Capital: Implications for Developing Countries”
Series Macroeconomics of Development, No 15, ECLAC, United Nations. Also in World Bank (2004), ABCDE Conference on Development Economics for Europe.
______ (2005b,) “Development Cycles, Political Regimes and International Migration: Argentina in the 20th Century” Chapter 12 in G. Borjas and J. Crisp, editors Poverty, International Migration and Asylum Palgrave Mac Millan, also in series Macroeconomía del Desarrollo #22, ECLAC.
______ (2001a), “International Migration and the Global Economic Order; An Overview” Policy, Research Working Paper 2720, The World Bank, November.
______ (2001b), “The Evolution of World Income Inequality: Assessing the Impact of Globalization” Series Macroeconomics of Development No 14, ECLAC, United Nations.
______ (1999), "Globalization and National Development at the End of the 20th century", Policy Research Working Paper 2137, The World Bank.
36
CEPAL - SERIE Macroeconomía del desarrollo N° 35
______ (1998), editor. Social Inequality, University of Michigan Press. Series Development and Inequality in the Market Economy.
______ (1991), The Economies of Central and Eastern Europe: An Historical and International Perspective”, chapter 2 in Corbo, V., Coricelli, F. and J. Bossak, (editors) Reforming Central and Eastern European Economies. Initial Results and Challenges. A World Bank Symposium.
Taylor, A. (1999), “Latin America and Foreign Capital in the Twentieth Century: Economics, Politics, and Institutional Change”, NBER Working Paper Series, no.7394, October.
______ (1996), “International Capital Mobility in History: The Saving-Investment Relationship”, NBER Working Paper Series, no.5743.
______ (1995), “Peopling the Pampa: On the Economic Impact of Mass Migration to the River Plate: 1870-1914” NBER Working Papers Series on the Historical Factors in Long Run Growth, Historical Papers #68.
______ and Jeffrey G. Williamson (1994), “Capital Flows to the New World as an Intergenerational Transfer”, Journal of Political Economy, vol.102, no.2, April.
______ (1994a), “Three Phases of Argentine Economic Growth” NBER Working Paper Series on Historical Factors in Long Run Growth, Historical Papers # 60.
______ (1994b), “Mass Migration to Distant Shores: Argentina and Australia, 1870-1939” in T. Hatton and J. Williamson (eds) Migration and the International Labor Markets, 1850-1939. Routledge, London and New York.
Timmer, A. and Williamson, J. (1996), “Racism, Xenophobia or Markets? The Political Economy of Immigration Policy Prior to the Thirties” NBER Working Paper 5867, Cambridge, MA.
Williamson, J. (1997), “Globalization and Inequality, Past and Present” The World Bank Research Observer, vol. 12 no. 2 (August 1997)
______ (1992), “The Evolution of Global Markets in the First and Second World Since 1830: Background Evidence and Hypotheses”, NBER Working Paper Series on Historical Factors in Long Run Growth, no.36, February.
Zlotnik, Hania (1999), “Trends of International Migration since 1965: What Existing Data Reveal” International Migration, Quarterly Review Vol. 37, No.1, 1999. International Organization for Migration.
37

CEPAL - SERIE Macroeconomía del desarrollo N° 35
Issues publis
1. The impact oEscaith and S
2. ModernizaciAtenburg, Re
3. ExportacioneBenavente, (
4. GlobalizationNo E.01.II.G
5. Job CreationWeller (LC/L
6. Procesos de(LC/L.1649–
7. Tributación aBrasil, Ronal
8. Long Run EcAndré A. Ho
9. Financial ReCrisis, Barba
10. La problemáS.01.II.G.209
11. The Evoluti(LC/L.1686–
12. ¿Cuán dinámNo de venta S
13. Euro and theMiotti, Domi
14. Regional inteEscaith, Chri
15. Globalizing tNo E.02.II.G
16. Las políticasS.02.II.G.128
17. Las políticas venta S.02.II
18. Las políticasS.02.II.G.140
19. Las políticasventa S.02.II
20. Emergencia (coordinadore
21. Estudio de laMato, (LC/L.
Serie
Macroeconomía del desarrollohed* f structural reforms on growth in Latin America and the Caribbean: an empirical estimation, Hubert amuel Morley (LC/L.1446–P), Sales No E.00.II.G.123 (US$10.00), 2000. www
ón económica y empleo en América Latina. Propuestas para un desarrollo incluyente, Tilman gine Qualmann y Jürgen Weller (LC/L.1512–P), No de venta S.01.II.G.55 (US$ 10.00), 2001. www s de manufacturas de América Latina: ¿Desarme unilateral o integración regional?, José Miguel
LC/L.11523–P), No de venta S.01.II.G.66 (US$ 10.00), 2001. www and Liberalization: The Impact on Developing Countries, Barbara Stallings, (LC/L.1571–P), Sales
.114 (US$ 10.00), 2001. www in Latin America in the 1990s: The Foundation for Social Policy, Barbara Stallings and Jürgen .1572–P), Sales No E.01.II.G.115 (US$ 10.00), 2001. www
exclusión e inclusión laboral: la expansión del empleo en el sector terciario, Jürgen Weller, P), No de venta S.01.II.G.187 (US$ 10.00), 2001. www mbiental, macroeconomía y medio ambiente en América Latina: aspectos conceptuales y el caso de do Seroa da Motta, (LC/L.1650–P), No de venta S.01.II.G.188 (US$ 10.00), 2001. www onomic Development in Latin America in a Comparative Perspective: Proximate and Ultimate Causes,
fman, (LC/L.1665–P), Sales No E.01.II.G.199 (US$ 10.00), 2001. www gulation and Supervision in Emerging Markets: The Experience of Latin America since the Tequila ra Stallings and Rogerio Studart, (LC/L.1670–P), Sales No E.01.II.G.205 (US$ 10.00), 2001. www tica de la coordinación de políticas económicas, Christian Ghymers, (LC/L.1674–P), No de venta (US$ 10.00), 2001. www
on of World Income Inequality: Assessing the Impact of Globalization, Andrés Solimano, P), Sales No E.01.II.G.124 (US$ 10.00), 2001. www icas son las exportaciones intrarregionales latinoamericanas?, José Miguel Benavente, (LC/L.1669–P), .02.II.G.10 (US$ 10.00), 2002. www financial relations between Latin America and Europe: medium and long–term implications, Luis
nique Plihon y Carlos Quenan, (LC/L.1716–P), Sales No E.02.II.G.27 (US$ 10.00), 2002. www gration and the issue of choosing an appropriate exchange–rate regime in Latin America, Hubert
stian Ghymers and Rogerio Studart (LC/L.1732–P), Sales No E.02.II.G.86 (US$ 10.00), 2002. www alent and human capital: implications for developing countries, Andrés Solimano (LC/L.1773–P), Sales .87 (US$ 10.00), 2002. www del mercado de trabajo y su evaluación en Brasil, Carlos Alberto Ramos (LC/L.1814-P), Nº de venta (US$ 10.00), 2002. www de mercado de trabajo y sus evaluaciones en Chile, Guillermo García-Huidobro (LC/L.1833-P), Nº de .G.139 (US$ 10.00), 2002. www de mercado de trabajo en México y su evaluación, Norma Samaniego (LC/L.1834-P), Nº de venta (US$ 10.00), 2002. www
de mercado de trabajo y su evaluación en América Latina, Norma Samaniego (LC/L.1836-P), Nº de .G.142 (US$ 10.00), 2002. www del euro y sus implicaciones para América Latina y el Caribe, Hubert Escaith y Carlos Quenan s) (LC/L.1842-P), Nº de venta S.03.II.G.7 (US$ 10.00), 2003. www
s experiencias europeas de instrumentos de evaluación de las políticas del mercado de trabajo, Francisco 1846-P), Nº de venta S.03.II.G.13 (US$ 10.00), 2003. www
39
International migration, capital flows and the global economy: a long run view
40
22. Development cycles, political regimes and international migration: Argentina in the twentieth century, Andrés Solimano, (LC/L.1847-P), Sales Nº E.03.II.G.14 (US$10.00), 2003. www
23. Governance crisis and the Andean region: a political economy analysis, Andrés Solimano (LC/L.1860-P), Sales Nº E.03.II.G.33 (US$ 10.00), 2003. www
24. Regional integration in latin America and dynamic gains from macroeconomic cooperation, Hubert Escaith and Igor Paunovic, (LC/L.1933-P), Sales Nº E.03.II.G.92 (US$10.00), 2003. www
25. Balance estructural del Gobierno central de Chile: análisis y propuestas, Heriberto Tapia (LC/L.1938-P), Nº de venta S.03.II.G.97 (US$ 10.00), 2003. www
26. Remittances by emigrants: issues and evidence, Andrés Solimano, (LC/L.1990–P), Sales Nº E.03.II.G.152 (US$ 10.00), 2003. www
27. Prevention and insurance of conflict and terrorism: issues and evidence for Latin Americam, Andrés Solimano (LC/L.2005-P), Sales Nº E.03.II.G.166 (US$ 10.00), 2003 . www
28. La problemática inserción laboral de los y las jóvenes, Jürgen Weller (LC/L.2029–P), No de venta S.03.II.G.192 (US$ 10.00), 2003. www
29. Towards development in landlocked economies, Rodrigo Cárcamo-Díaz (LC/L.2075-P), Sales NºE.04.II.G.18 (US$ 10.00), 2004. www
30. Political violence and economic development in Latin America: issues and evidence, Andrés Solimano (LC/L.2194-P), Sales NºE.04.II.G.121 (US$ 10.00), 2004. www
31. La inversión para la provisión de servicios públicos y su financiamiento en América Latina y el Caribe: evolución reciente, situación actual y políticas, Luis Lucioni (LC/L.2213-P), Sales Nº S.04.II.G.135 (US$ 10.00), 2004. www
32. El papel del poder legislativo en el proceso presupuestario: la experiencia argentina, Jesús Rodríguez y Alejandro Bonvecchi (LC/L.2225-P), No de venta S.04.II.G.144 (US$ 10.00), 2004. www
33. Economic growth in Latin America in the late 20th century: evidence and interpretation, Andrés Solimano and Raimundo Soto (LC/L.2236-P), Sales NºE.04.II.G.156 (US$ 10.00), 2005. www
34. El Andean exchange-rate regimes, 1994-2003: a brief for “stable but flexible” regimes, Paul Beckerman (LC/L.2237-P), Sales NºE.04.II.G.157 (US$ 10.00), 2004. www
35. International migration, capital flows and the global economy: a long run view, Andrés Solimano and Nathalie Watts (LC/L.2259-P), Sales NºE.05.II.G.16 (US$ 10.00), 2005. www
____________________________ * Readers wishing to obatain the listed issues can do so by writing to: Distribution Unit, ECLAC, Casilla 179-D, Santiago, Chile,
Fax (562) 210 2069, E-mail: [email protected]. www These publications are also available on the Internet: http://www.cepal.org/ o http://www.eclac.org
Name:.......................................................................................................................................
Activity: ...................................................................................................................................
Address: ...................................................................................................................................
Postal code, city, country .........................................................................................................
Tel.: ............................ Fax:.........................E.mail address: ....................................................