Embed Size (px)
Citation preview

CHAPTER TWO
The Data of Macroeconomics
i
Macroeconomics
macroeconomicsfifth edition
N. Gregory Mankiw
PowerPoint® Slides by Ron Cronovich
© 2002 Worth Publishers, all rights reserved
Learning objectivesLearning objectives
In this chapter, you will learn about:
Gross Domestic Product (GDP)
the Consumer Price Index (CPI)the Consumer Price Index (CPI)
the Unemployment Rate
CHAPTER 2CHAPTER 2 The Data of MacroeconomicsThe Data of Macroeconomics slide 1
Gross Domestic ProductGross Domestic Product
Two definitions:
1. Total expenditure on domestically-produceddomestically produced final goods and services: C + I + G + NX+ NX
2. Total income earned by domestically-located factors of production
CHAPTER 2CHAPTER 2 The Data of MacroeconomicsThe Data of Macroeconomics slide 2
p
Why expenditure = incomeWhy expenditure = income
In every transactionIn every transactionIn every transaction, In every transaction, the buyer’s expenditure the buyer’s expenditure
becomes the seller’s income.becomes the seller’s income.
Thus the sum of allThus the sum of allThus, the sum of all Thus, the sum of all expenditure equals expenditure equals
th f ll ith f ll ithe sum of all income.the sum of all income.
CHAPTER 2CHAPTER 2 The Data of MacroeconomicsThe Data of Macroeconomics slide 3
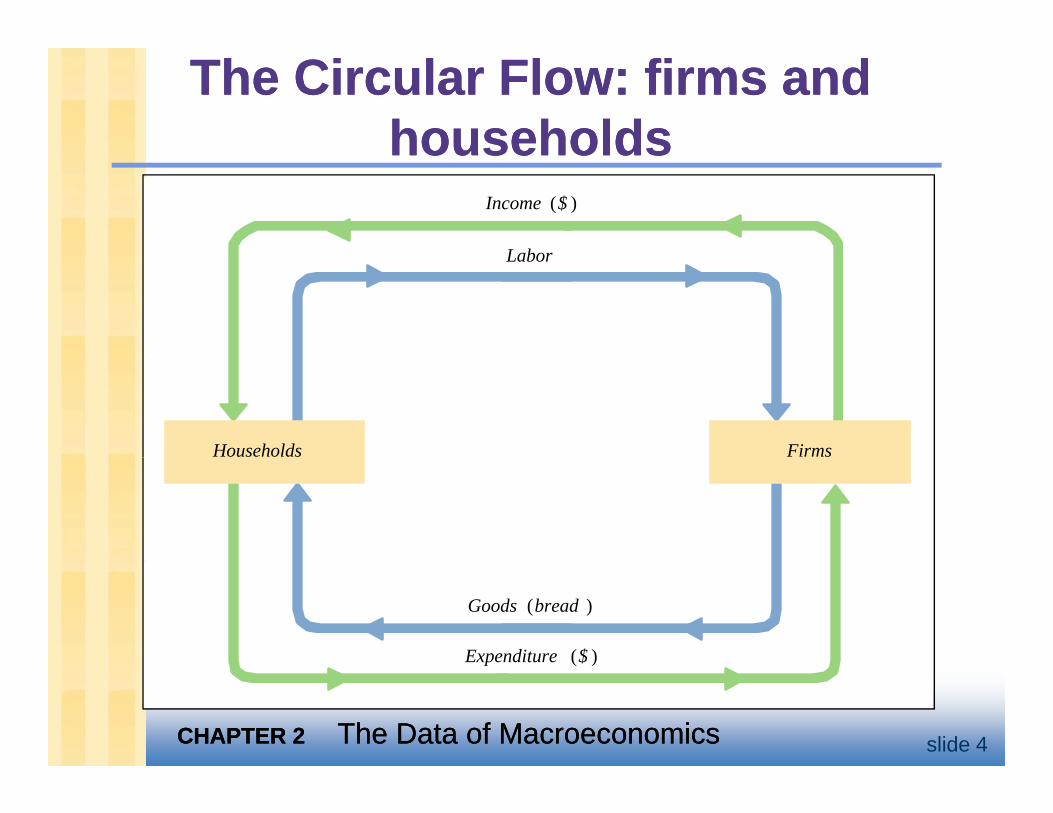
The Circular The Circular Flow: firms and Flow: firms and householdshouseholdshouseholdshouseholds
Income ($ )
L bLabor
Households Firms
Goods (bread )
Expenditure ($ )
CHAPTER 2CHAPTER 2 The Data of MacroeconomicsThe Data of Macroeconomics slide 4
p ($ )
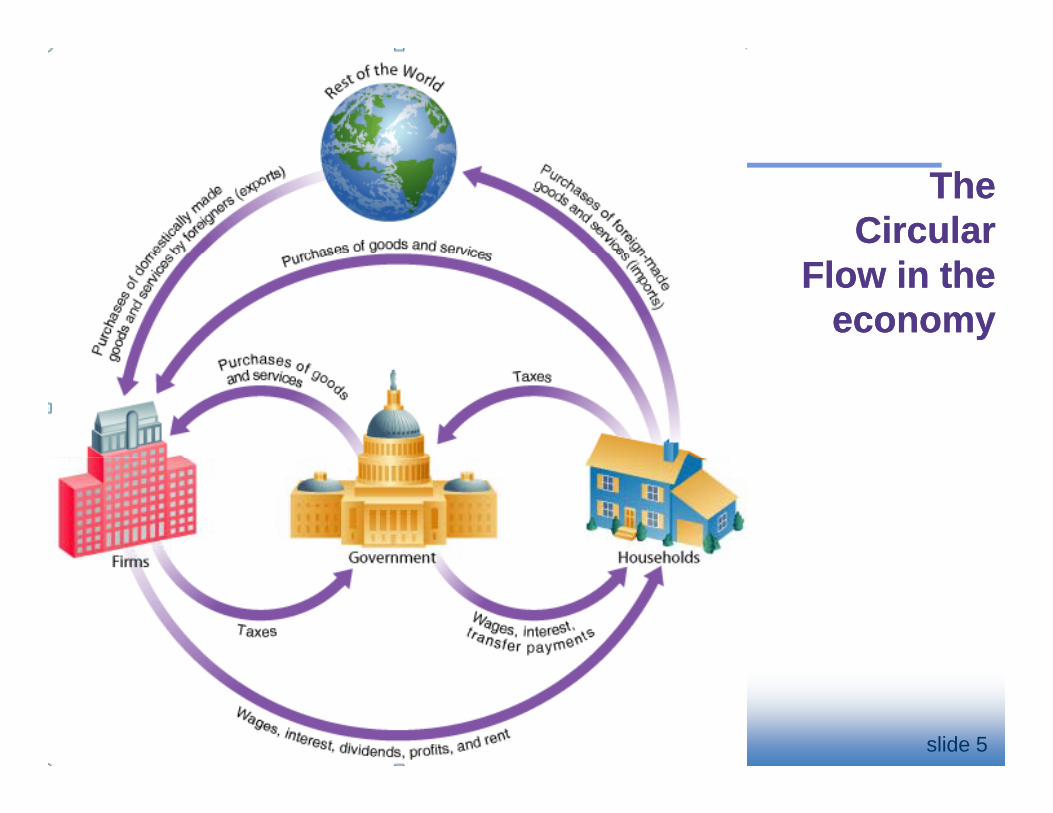
The The Circular Circular
Flow in the Flow in the economyeconomy
CHAPTER 2CHAPTER 2 The Data of MacroeconomicsThe Data of Macroeconomics slide 5
Value addedValue added
Definition: A firm’s value added is
the value of its output iminus
the value of the inputs the firm used to p od ce that o tp tproduce that output.
CHAPTER 2CHAPTER 2 The Data of MacroeconomicsThe Data of Macroeconomics slide 6
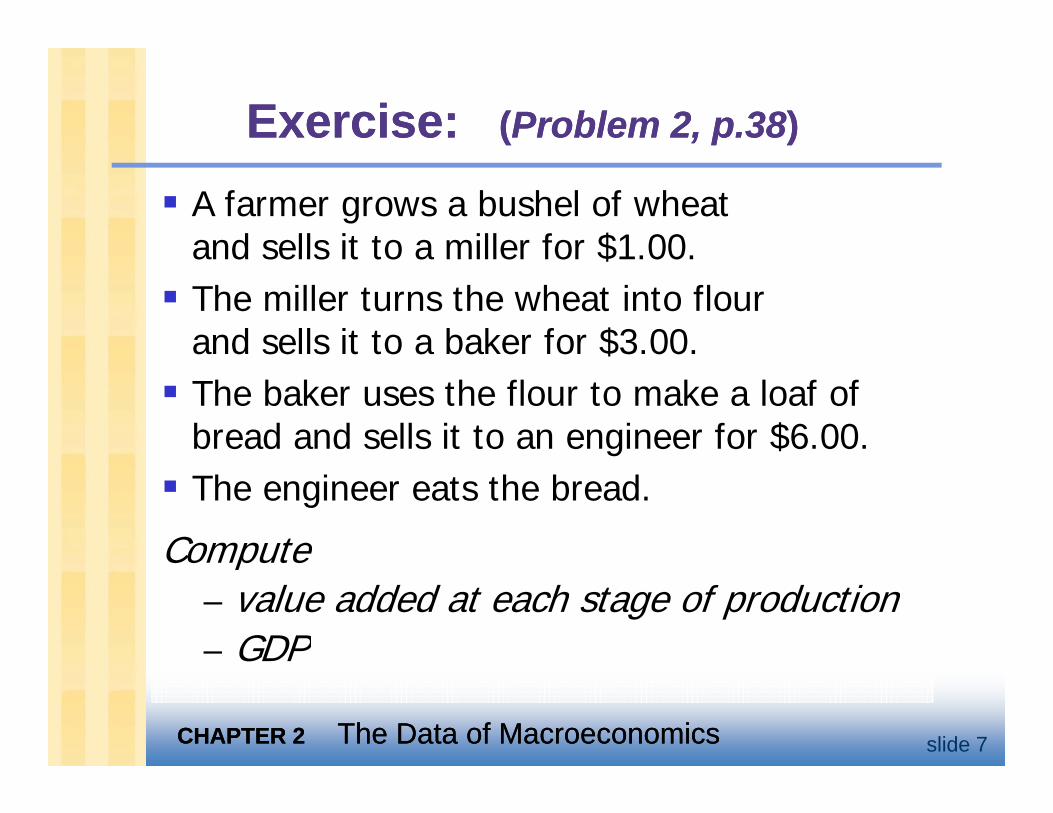
Exercise: Exercise: ((Problem 2, p.38Problem 2, p.38))
A farmer grows a bushel of wheat and sells it to a miller for $1 00and sells it to a miller for $1.00. The miller turns the wheat into flour and sells it to a baker for $3.00. $The baker uses the flour to make a loaf of bread and sells it to an engineer for $6.00. The engineer eats the bread.
ComputeCompute– value added at each stage of production– GDP
CHAPTER 2CHAPTER 2 The Data of MacroeconomicsThe Data of Macroeconomics slide 7
Final goods, value added, and GDPFinal goods, value added, and GDPGDP = value of final goods produced
sum of value added at all stages= sum of value added at all stages of production
The value of the final goods already includes the value of the intermediate goods, so including intermediate goods in GDP would be double-counting.
CHAPTER 2CHAPTER 2 The Data of MacroeconomicsThe Data of Macroeconomics slide 8
The expenditure components of GDPThe expenditure components of GDP
• Consumption (C)
• Investment (I)
di (G)• government spending (G)
• net exports (NX)net exports (NX)
CHAPTER 2CHAPTER 2 The Data of MacroeconomicsThe Data of Macroeconomics slide 9
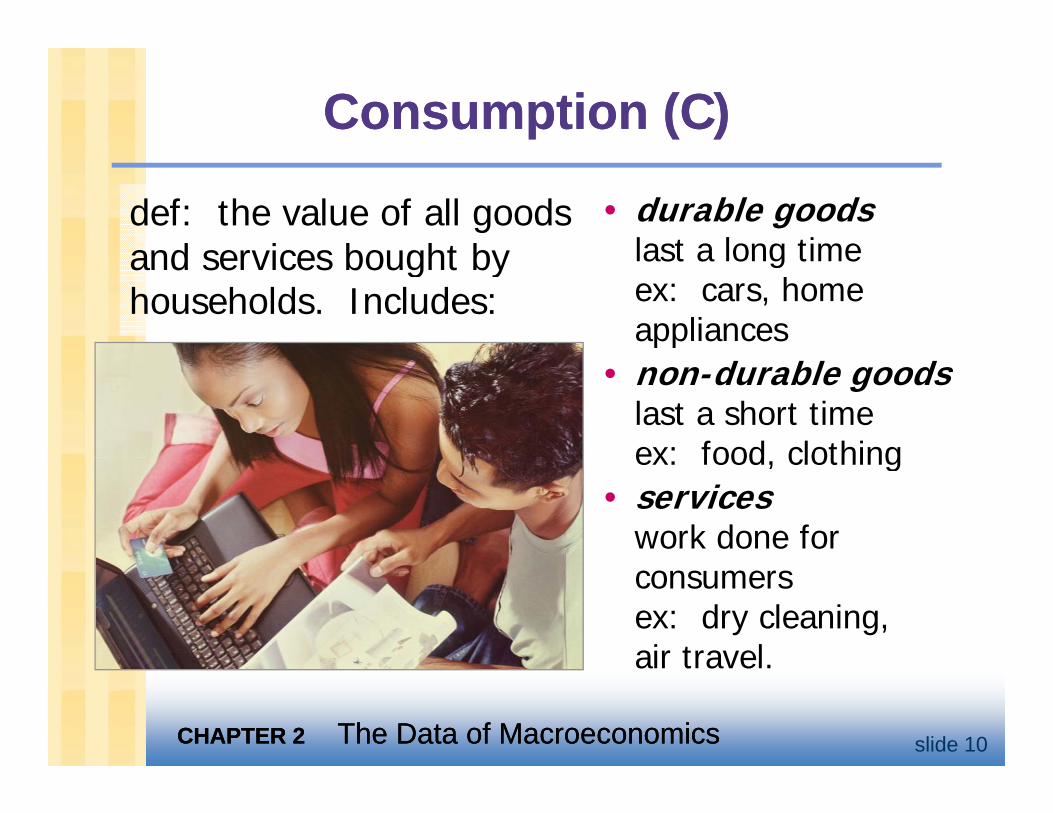
Consumption (Consumption (CC))
• durable goodslast a long time
def: the value of all goods and services bought by last a long time
ex: cars, home appliances
and services bought by households. Includes:
• non-durable goodslast a short time ex: food clothingex: food, clothing
• serviceswork done for consumers ex: dry cleaning, air travel
CHAPTER 2CHAPTER 2 The Data of MacroeconomicsThe Data of Macroeconomics slide 10
air travel.
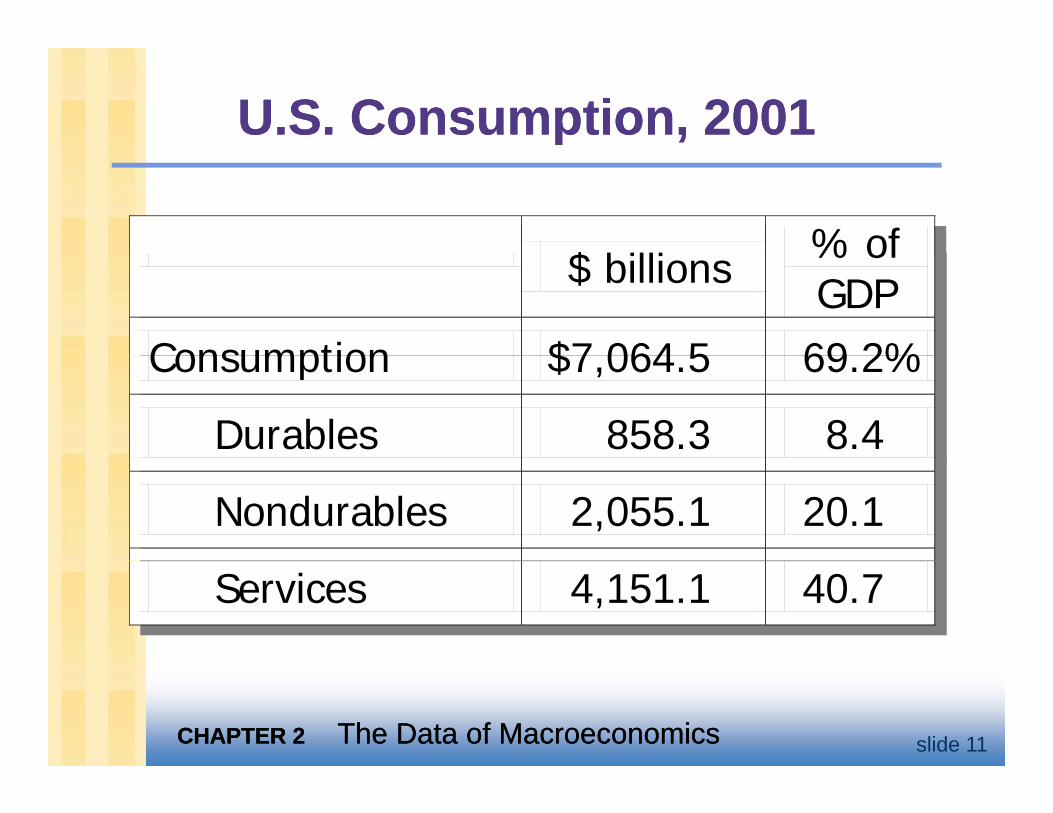
U.S. Consumption, 2001U.S. Consumption, 2001
$ billi % of $ billions % of GDP
Consumption $7 064 5 69 2%Consumption $7,064.5 69.2%
Durables 858.3 8.4
Nondurables 2,055.1 20.1
Services 4,151.1 40.7
CHAPTER 2CHAPTER 2 The Data of MacroeconomicsThe Data of Macroeconomics slide 11
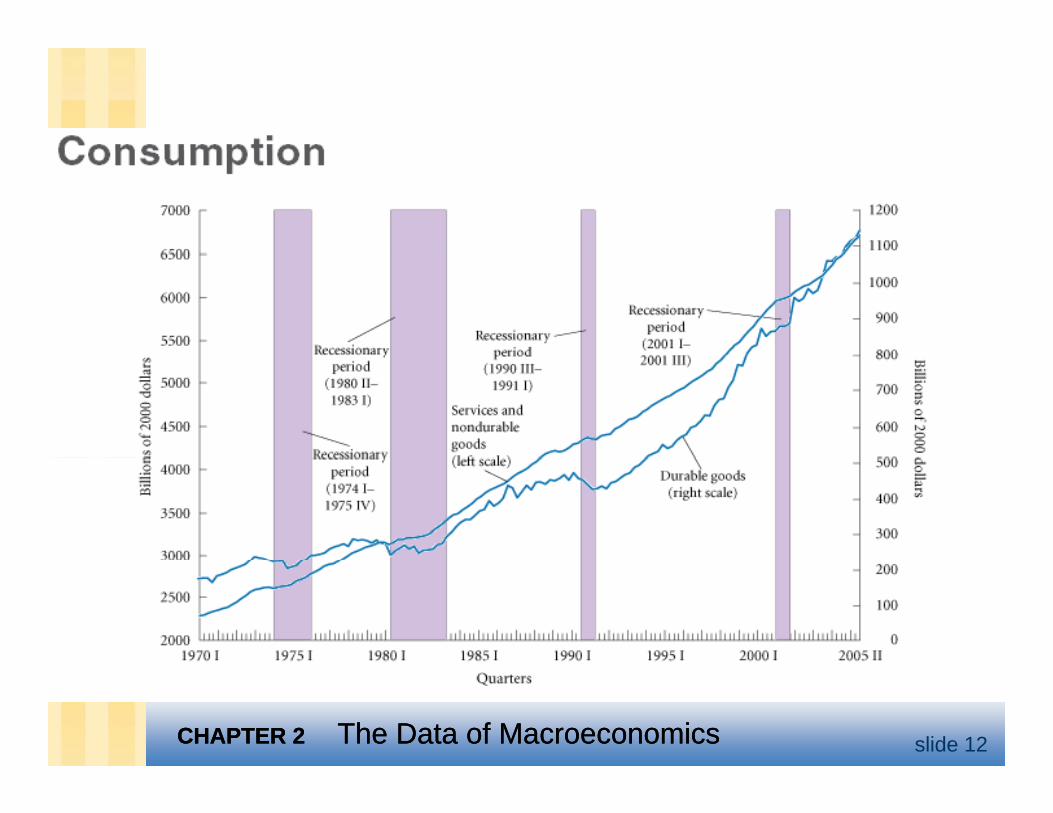
CHAPTER 2CHAPTER 2 The Data of MacroeconomicsThe Data of Macroeconomics slide 12
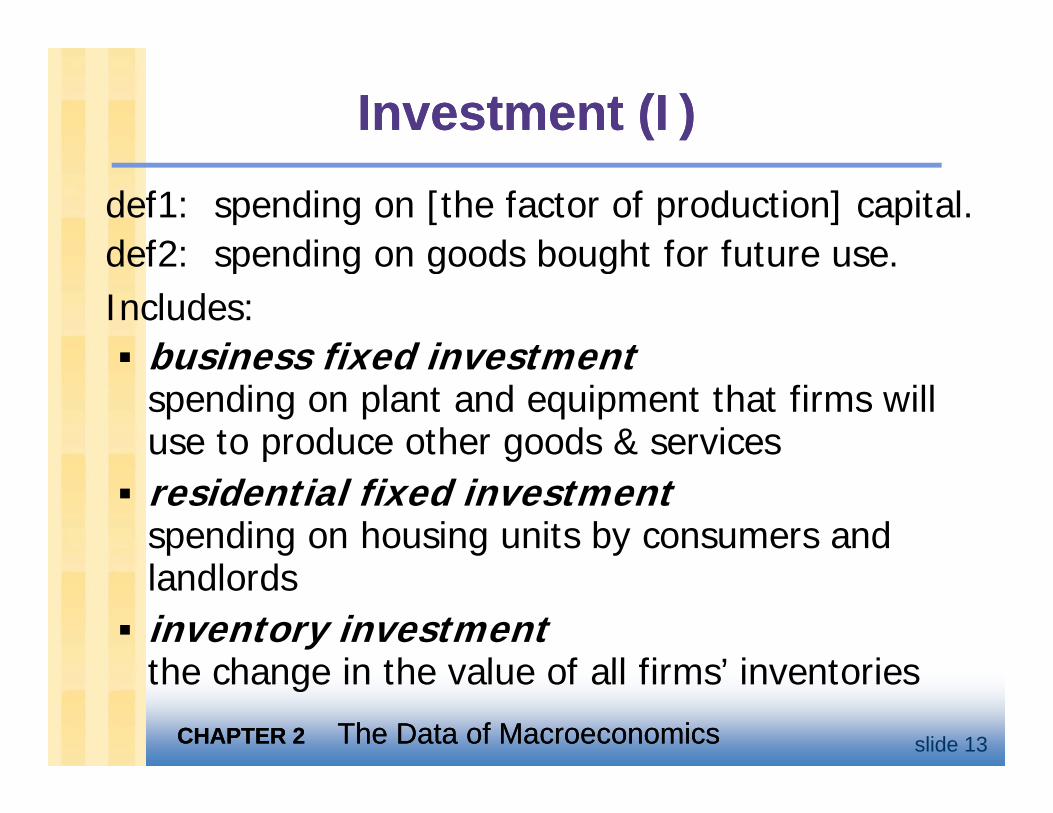
Investment (Investment (II))
def1: spending on [the factor of production] capital.def2: spending on goods bought for future usedef2: spending on goods bought for future use.Includes:
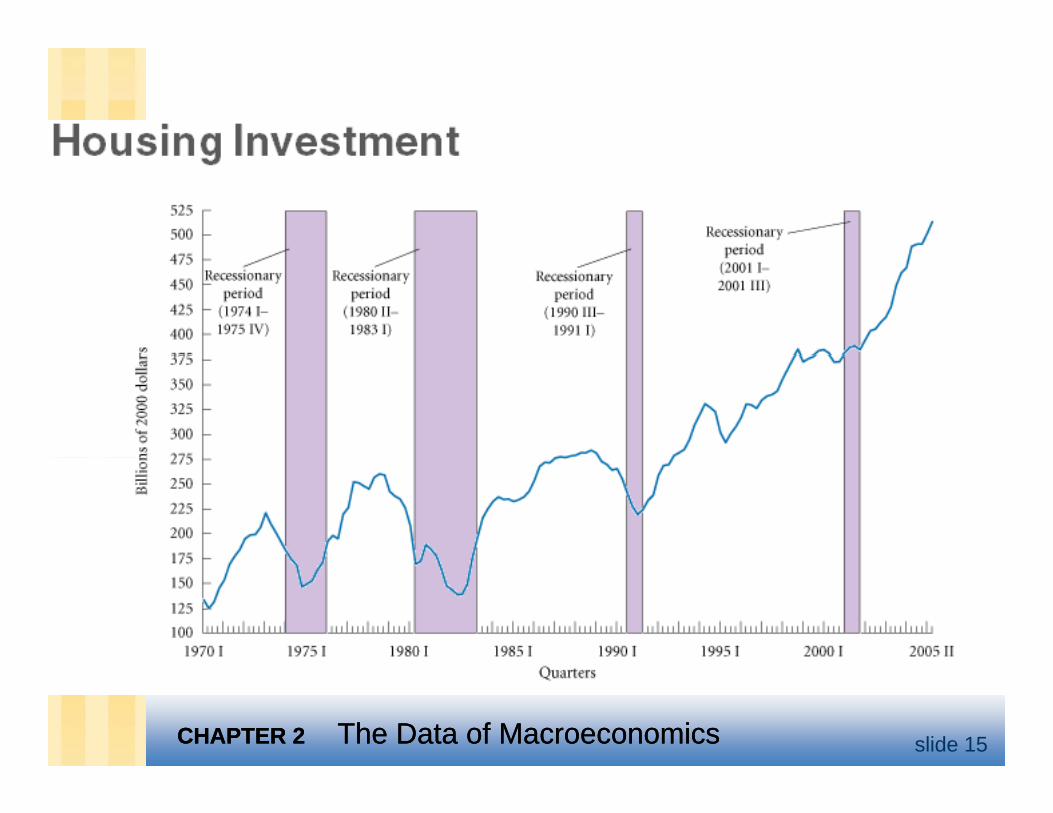
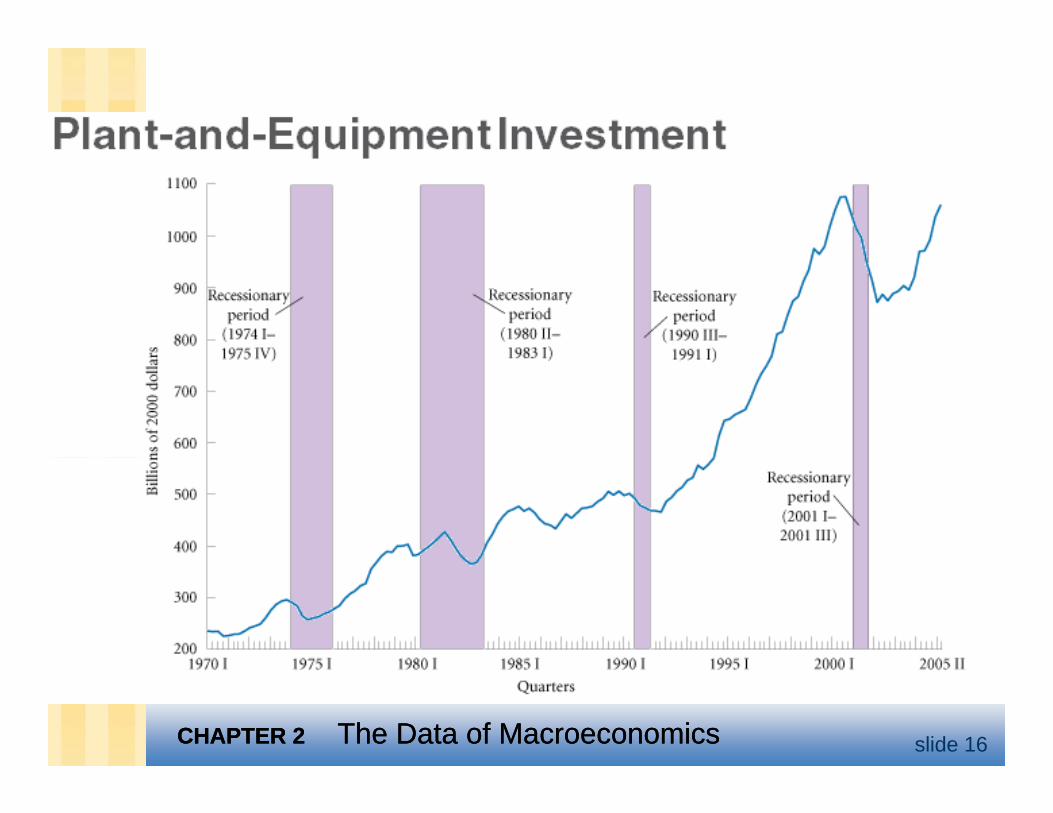
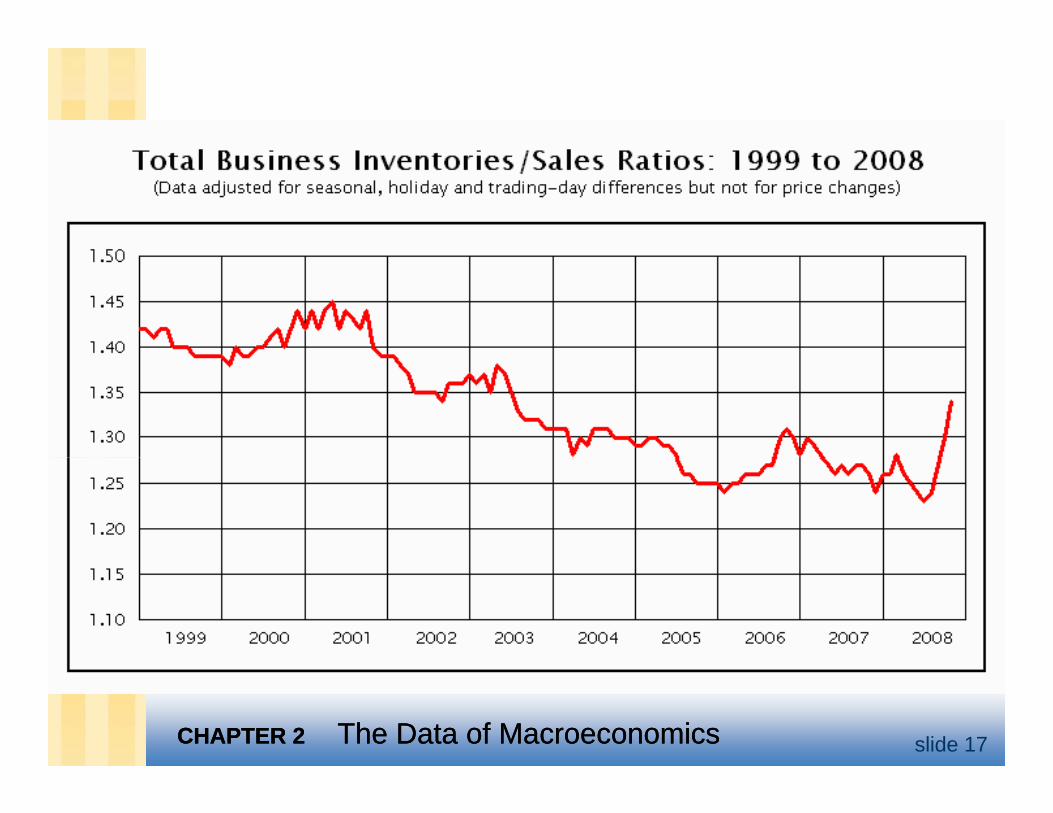
business fixed investmentbusiness fixed investmentspending on plant and equipment that firms will use to produce other goods & servicesp gresidential fixed investmentspending on housing units by consumers and landlordsinventory investmentth h i th l f ll fi ’ i t i
CHAPTER 2CHAPTER 2 The Data of MacroeconomicsThe Data of Macroeconomics slide 13
the change in the value of all firms’ inventories
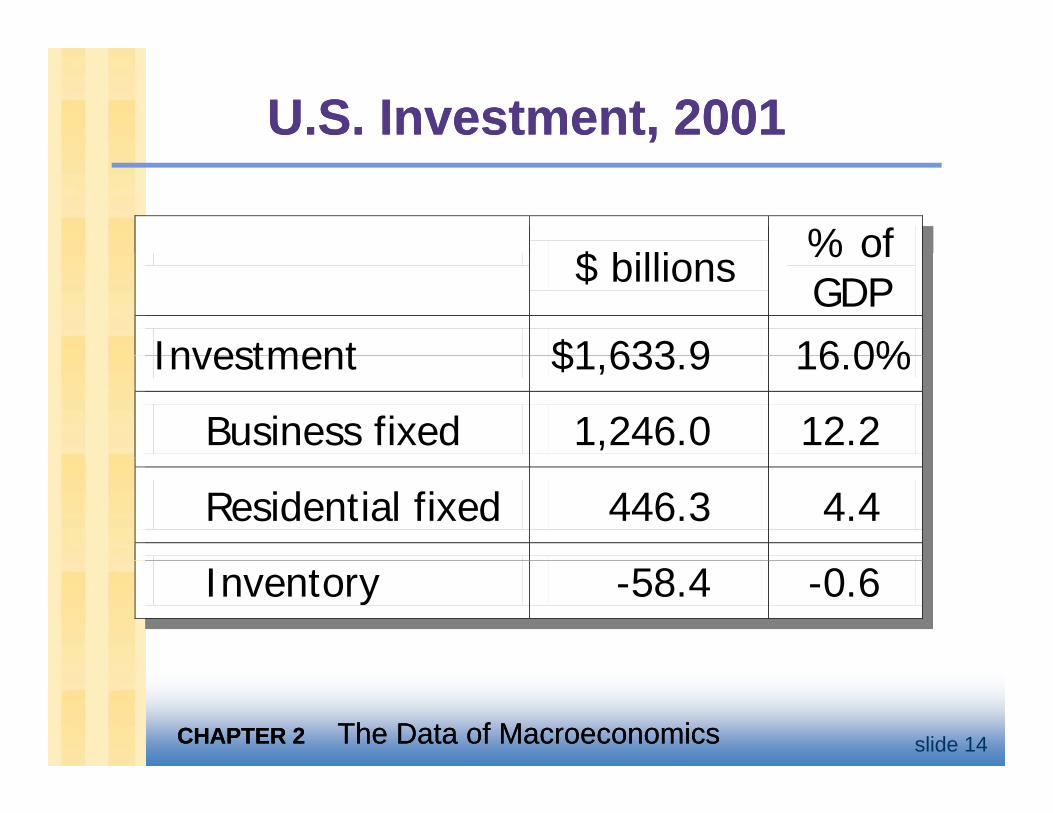
U.S. Investment, 2001U.S. Investment, 2001
$ billi % of $ billions % of GDP
Investment $1 633 9 16 0%Investment $1,633.9 16.0%
Business fixed 1,246.0 12.2
Residential fixed 446.3 4.4
Inventory -58.4 -0.6
CHAPTER 2CHAPTER 2 The Data of MacroeconomicsThe Data of Macroeconomics slide 14
CHAPTER 2CHAPTER 2 The Data of MacroeconomicsThe Data of Macroeconomics slide 15
CHAPTER 2CHAPTER 2 The Data of MacroeconomicsThe Data of Macroeconomics slide 16
CHAPTER 2CHAPTER 2 The Data of MacroeconomicsThe Data of Macroeconomics slide 17
Investment vs. CapitalInvestment vs. Capital
Capital is one of the factors of production. At any given moment, the economy has a certain overall stock of capital.
Investment is spending on new capital.
CHAPTER 2CHAPTER 2 The Data of MacroeconomicsThe Data of Macroeconomics slide 18
Investment vs. CapitalInvestment vs. Capital
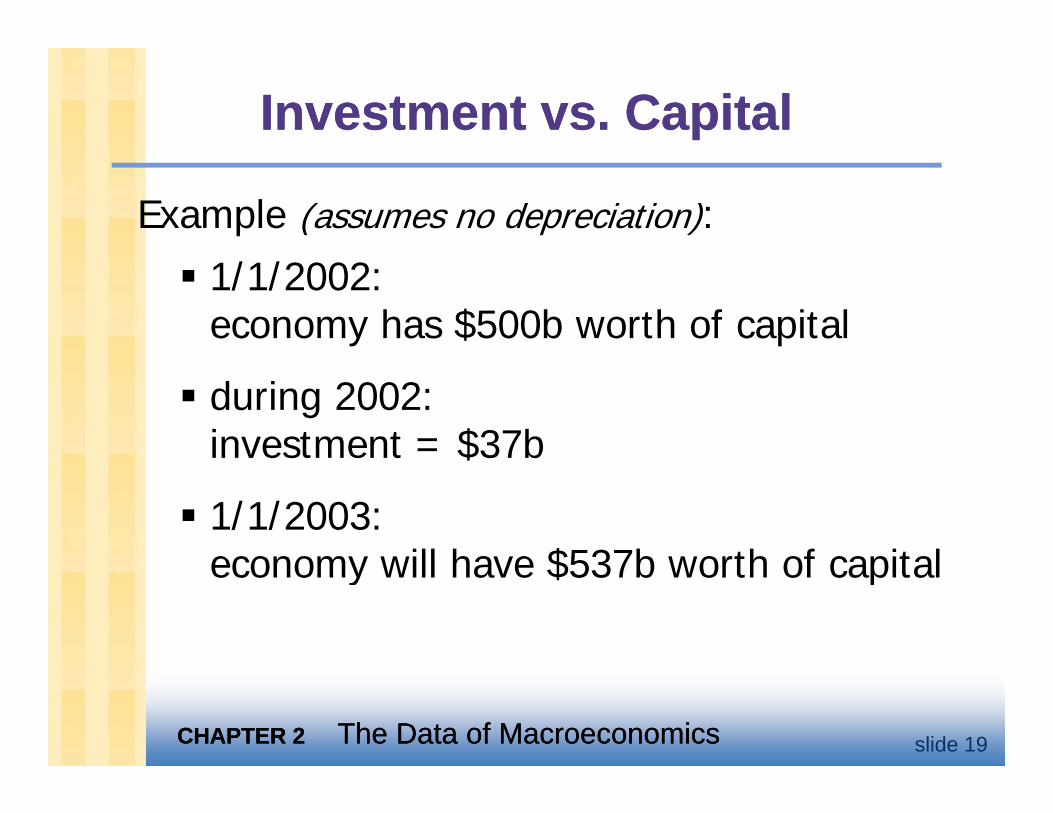
Example (assumes no depreciation):
1/1/2002: economy has $500b worth of capital
during 2002:investment = $37best e t $3 b
1/1/2003: economy will have $537b worth of capitaleconomy will have $537b worth of capital
CHAPTER 2CHAPTER 2 The Data of MacroeconomicsThe Data of Macroeconomics slide 19
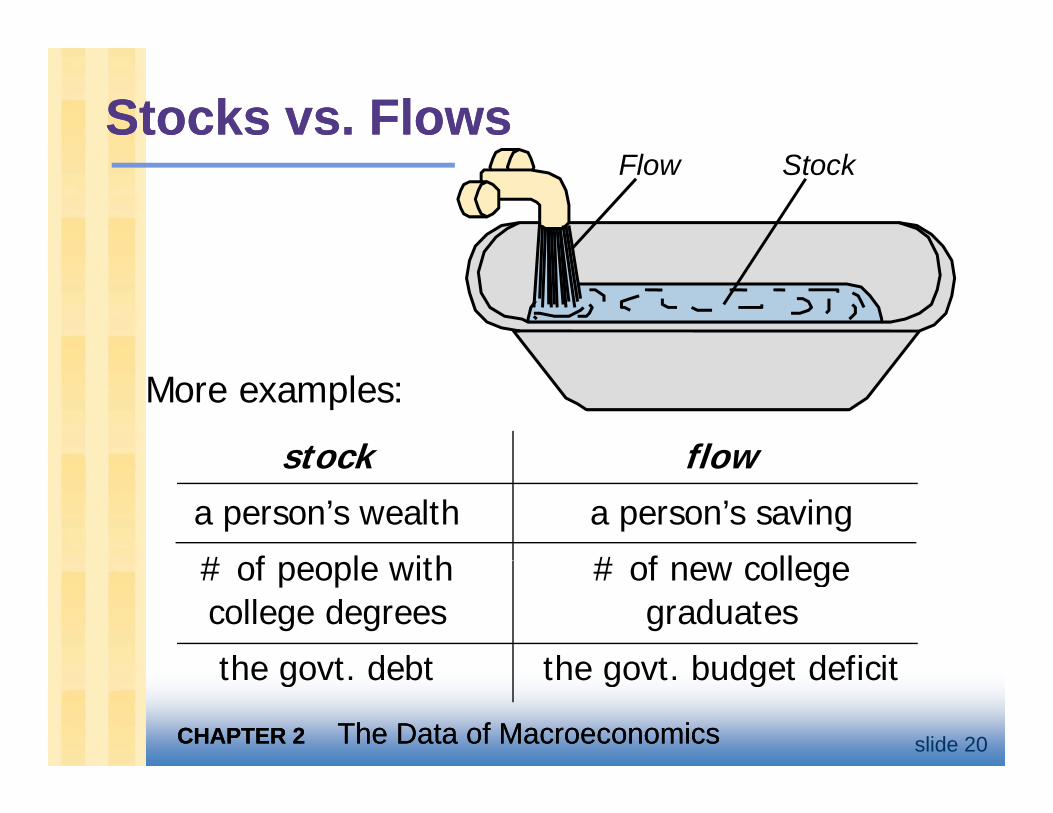
Stocks vs. FlowsStocks vs. FlowsFlow Stock
stock flow
More examples:
stock flowa person’s wealth a person’s saving
# f l ith # f ll# of people with # of new collegecollege degrees graduates
the govt debt the govt budget deficit
CHAPTER 2CHAPTER 2 The Data of MacroeconomicsThe Data of Macroeconomics slide 20
the govt. debt the govt. budget deficit
Government spending (Government spending (GG))
G includes all government spending on d d igoods and services.
G excludes transfer payments (e.g. unemployment insurance payments), because they do not represent spending on
d d igoods and services.
CHAPTER 2CHAPTER 2 The Data of MacroeconomicsThe Data of Macroeconomics slide 21
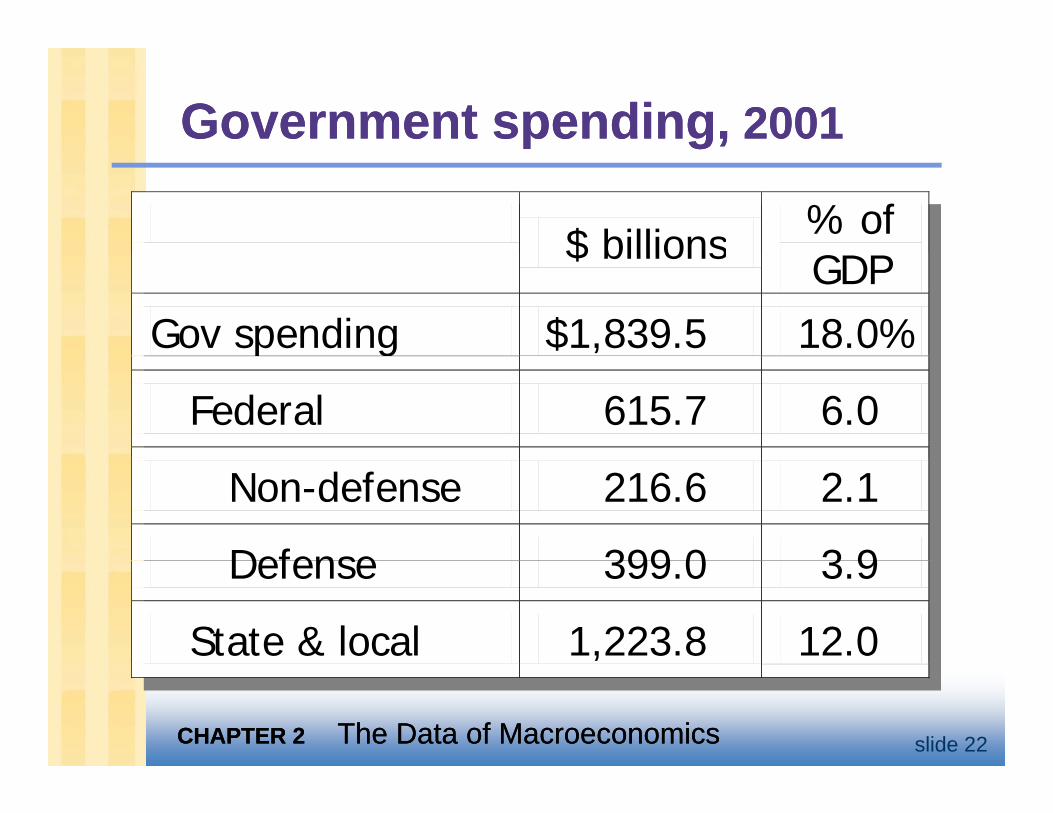
Government spending,Government spending, 20012001
$ billions % of $ billions GDPGov spending $1,839.5 18.0%p g
Federal 615.7 6.0
Non-defense 216.6 2.1
Defense 399 0 3 9 Defense 399.0 3.9
State & local 1,223.8 12.0
CHAPTER 2CHAPTER 2 The Data of MacroeconomicsThe Data of Macroeconomics slide 22
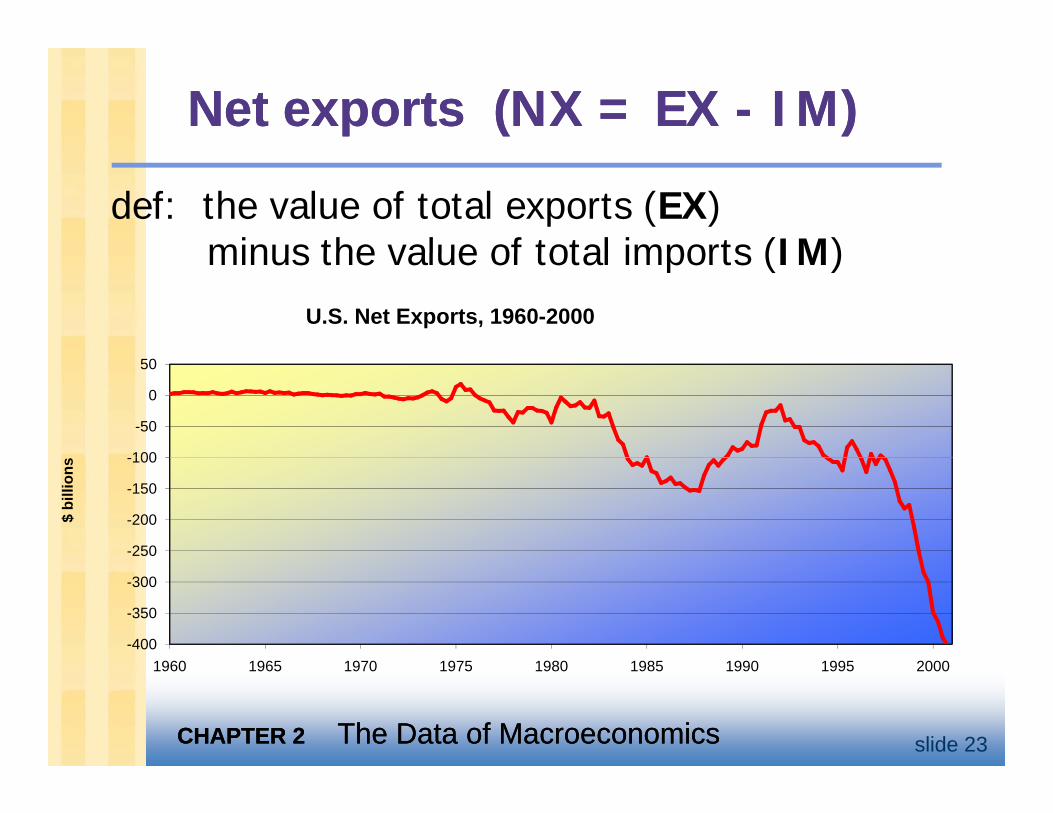
Net exports (Net exports (NX = EX NX = EX -- IMIM))
def: the value of total exports (EX) minus the value of total imports (IM)minus the value of total imports (IM)
U.S. Net Exports, 1960-2000
-100
-50
0
50
-250
-200
-150
-100
$ bi
llion
s
-400
-350
-300
1960 1965 1970 1975 1980 1985 1990 1995 2000
CHAPTER 2CHAPTER 2 The Data of MacroeconomicsThe Data of Macroeconomics slide 23
1960 1965 1970 1975 1980 1985 1990 1995 2000
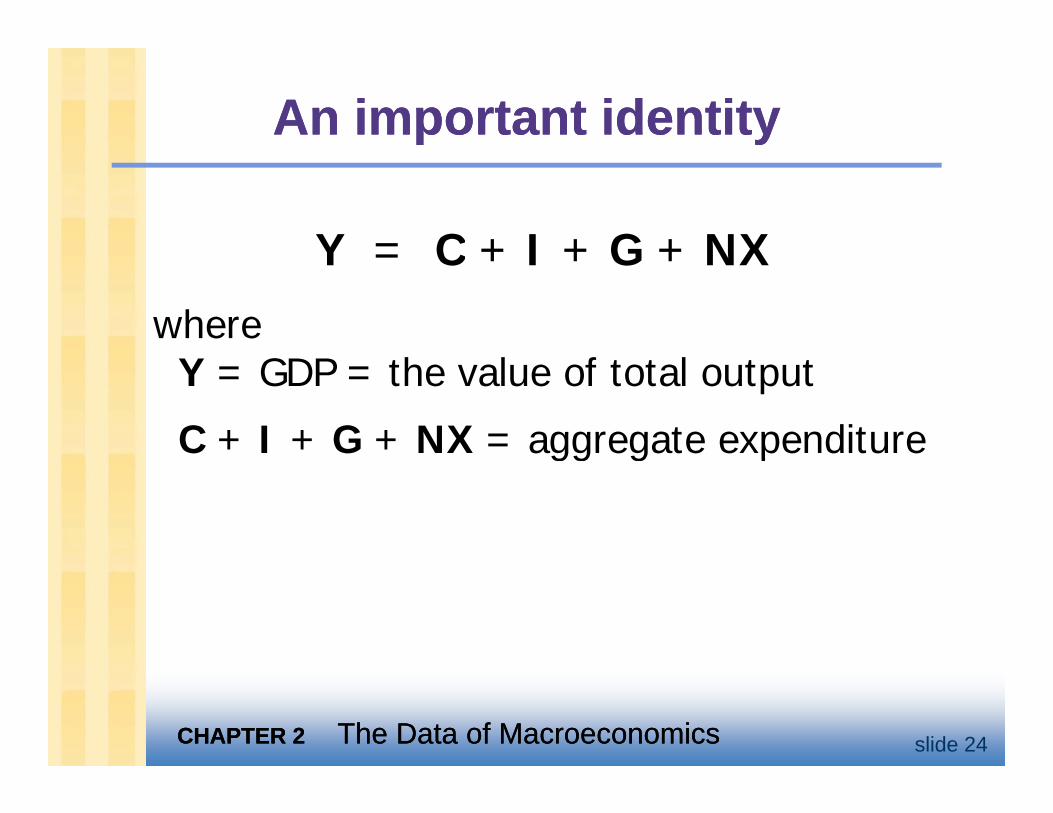
An important identityAn important identity
Y = C + I + G + NXY = C + I + G + NX
where fY = GDP = the value of total output
C + I + G + NX = aggregate expendituregg g p
CHAPTER 2CHAPTER 2 The Data of MacroeconomicsThe Data of Macroeconomics slide 24
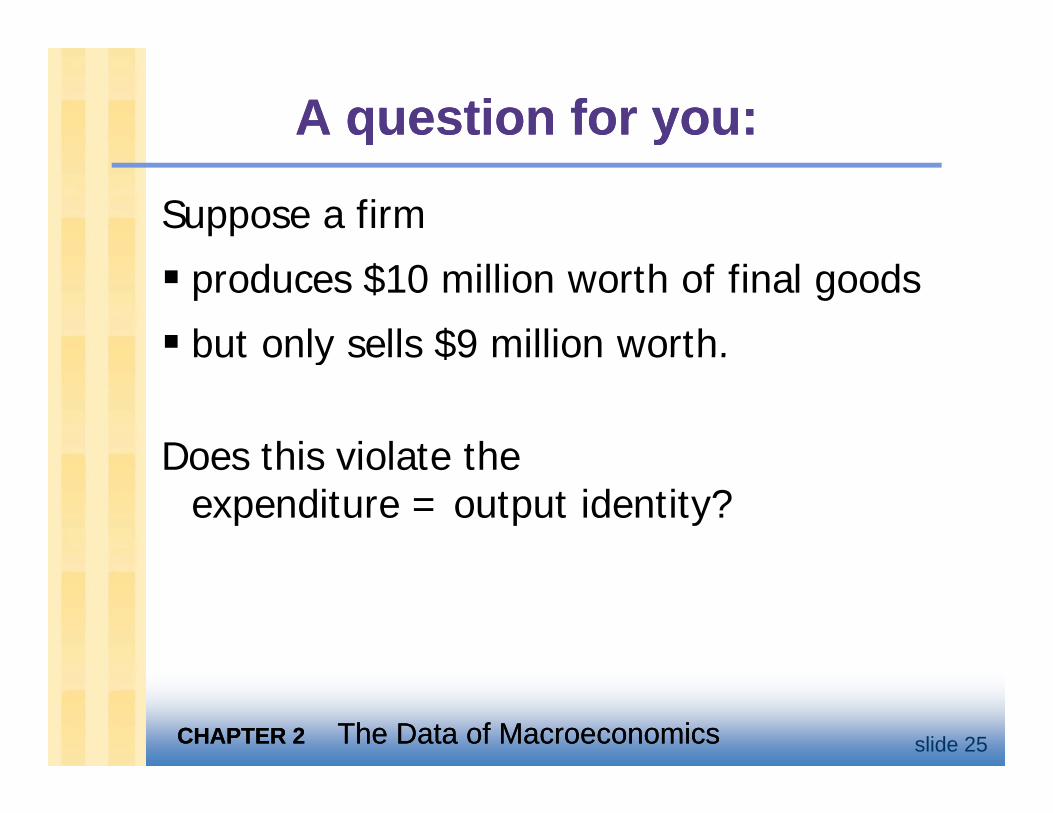
A question for you:A question for you:
Suppose a firm
produces $10 million worth of final goods
but only sells $9 million worth.but only sells $9 million worth.
Does this violate theDoes this violate the expenditure = output identity?
CHAPTER 2CHAPTER 2 The Data of MacroeconomicsThe Data of Macroeconomics slide 25
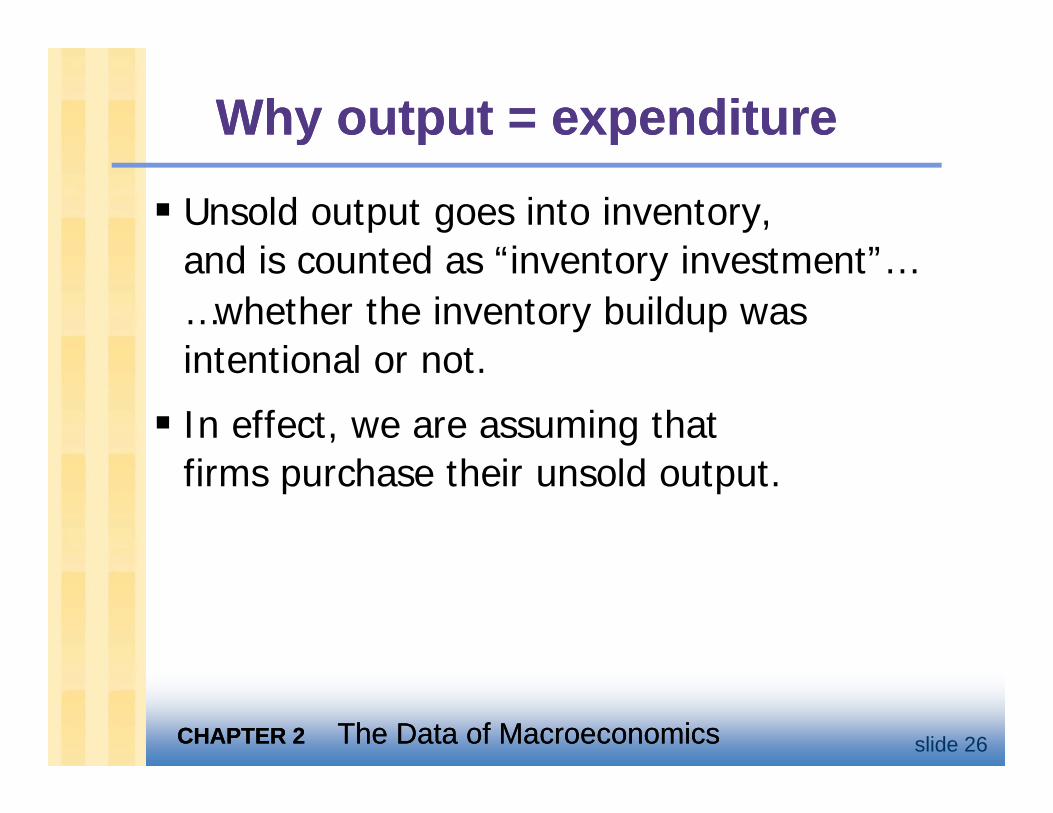
Why output = expenditureWhy output = expenditure
Unsold output goes into inventory, and is counted as “inventory investment”and is counted as “inventory investment”……whether the inventory buildup was intentional or notintentional or not.
In effect, we are assuming that f h h ldfirms purchase their unsold output.
CHAPTER 2CHAPTER 2 The Data of MacroeconomicsThe Data of Macroeconomics slide 26
GDP: GDP: An important and versatile conceptAn important and versatile conceptAn important and versatile conceptAn important and versatile concept
We have now seen that GDP measurest t l itotal incometotal outputtotal expenditurethe sum of value-added at all stages
h d f f l din the production of final goods
CHAPTER 2CHAPTER 2 The Data of MacroeconomicsThe Data of Macroeconomics slide 27
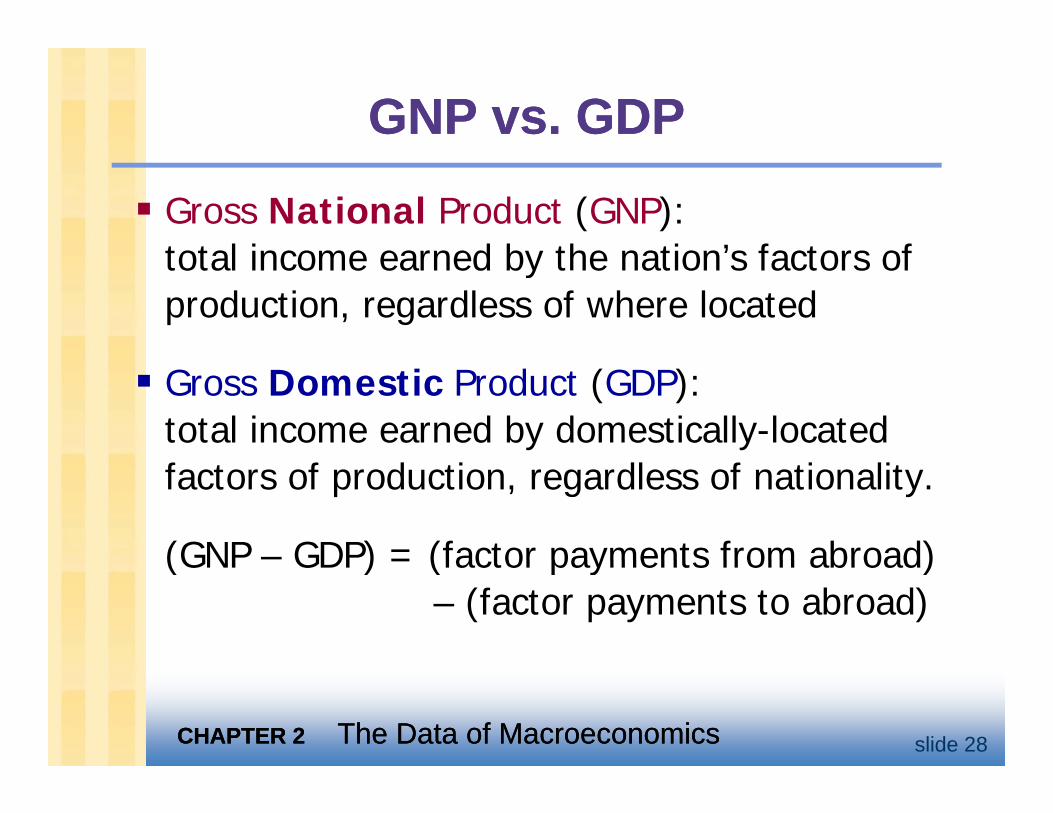
GNP vs. GDPGNP vs. GDP
Gross National Product (GNP):total income earned by the nation’s factors oftotal income earned by the nation s factors of production, regardless of where located
Gross Domestic Product (GDP):total income earned by domestically-located factors of production, regardless of nationality.
(GNP – GDP) = (factor payments from abroad)(GNP GDP) = (factor payments from abroad) – (factor payments to abroad)
CHAPTER 2CHAPTER 2 The Data of MacroeconomicsThe Data of Macroeconomics slide 28

(GNP (GNP –– GDP) as a percentage of GDP GDP) as a percentage of GDP for selected countries, 1997.for selected countries, 1997.for selected countries, 1997.for selected countries, 1997.
U.S.A. 0.1%Bangladesh 3 3Bangladesh 3.3Brazil -2.0 Canada -3 2Canada -3.2Chile -8.8 Ireland -16 2Ireland 16.2Kuwait 20.8 Mexico -3 2Mexico 3.2Saudi Arabia 3.3 Singapore 4.2
CHAPTER 2CHAPTER 2 The Data of MacroeconomicsThe Data of Macroeconomics slide 29
Singapore 4.2
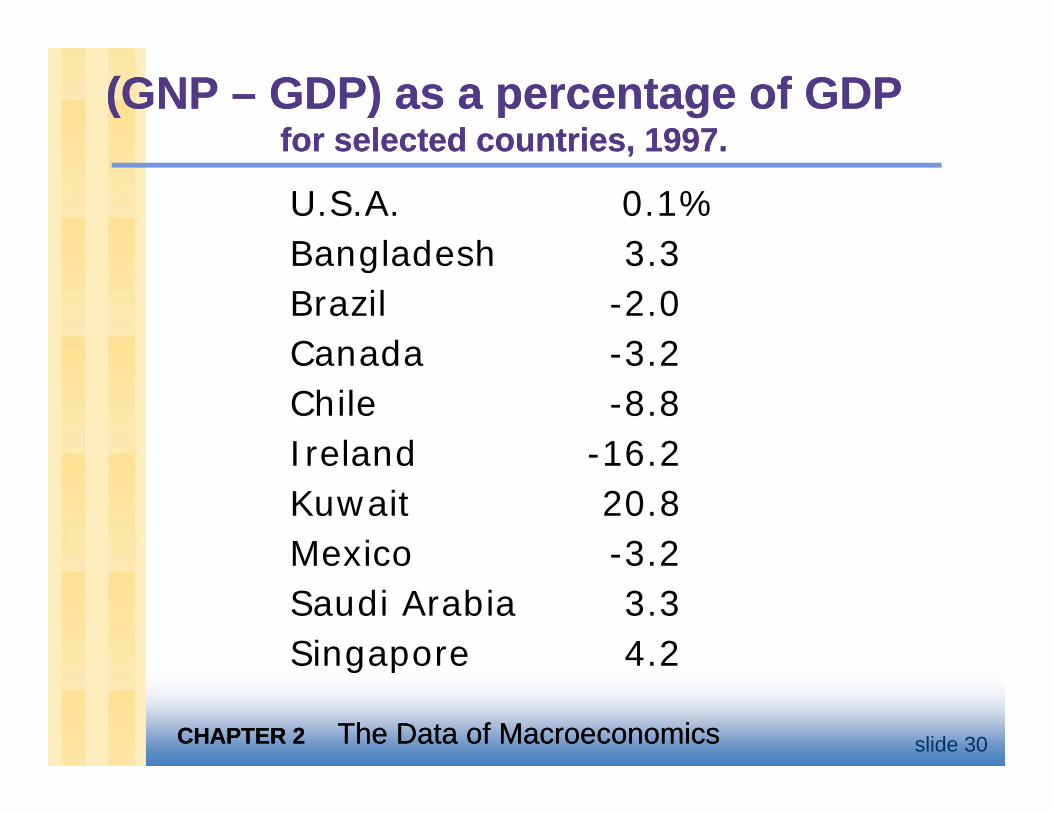
(GNP (GNP –– GDP) as a percentage of GDP GDP) as a percentage of GDP for selected countries, 1997.for selected countries, 1997.for selected countries, 1997.for selected countries, 1997.
U.S.A. 0.1%Bangladesh 3 3Bangladesh 3.3Brazil -2.0 Canada -3 2Canada -3.2Chile -8.8 Ireland -16 2Ireland 16.2Kuwait 20.8 Mexico -3 2Mexico 3.2Saudi Arabia 3.3 Singapore 4.2
CHAPTER 2CHAPTER 2 The Data of MacroeconomicsThe Data of Macroeconomics slide 30
Singapore 4.2
Real vs. Nominal GDPReal vs. Nominal GDPGDP is the value of all final goods and services producedservices produced.
Nominal GDP measures these values i t iusing current prices.
Real GDP measure these values using the prices of a base year.
CHAPTER 2CHAPTER 2 The Data of MacroeconomicsThe Data of Macroeconomics slide 31
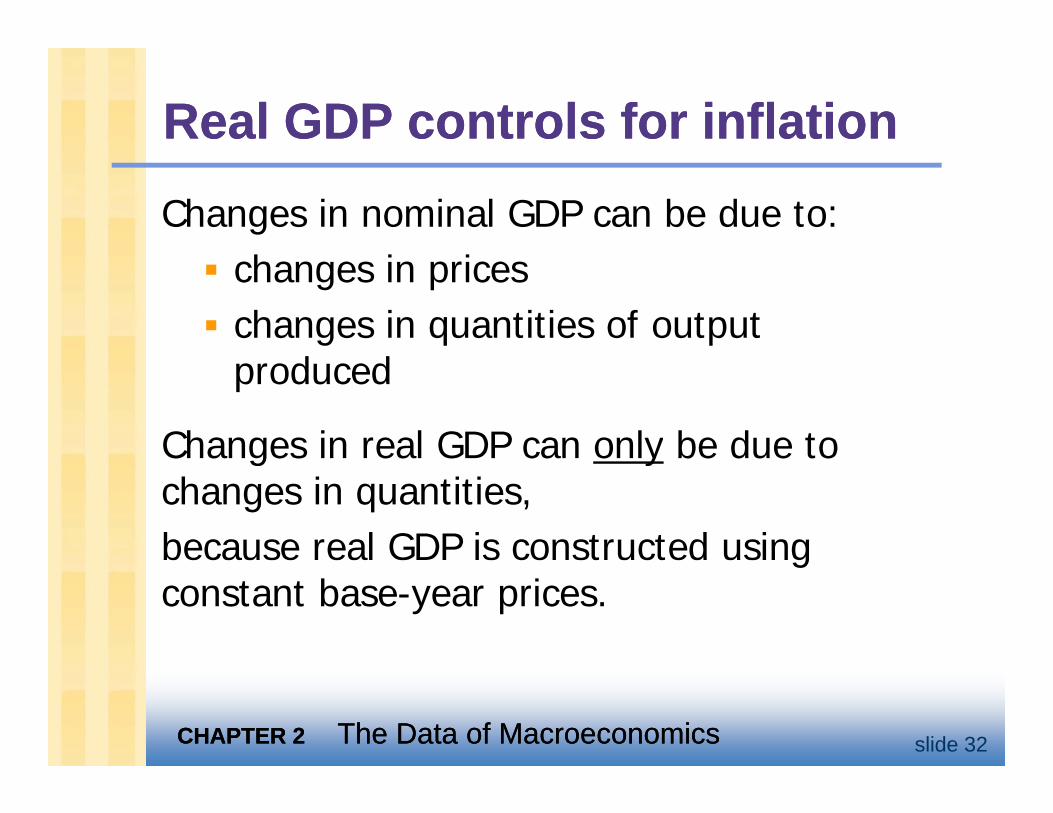
Real GDP controls for inflationReal GDP controls for inflation
Changes in nominal GDP can be due to:changes in prices changes in quantities of output
d dproduced
Changes in real GDP can only be due toChanges in real GDP can only be due to changes in quantities,because real GDP is constructed using gconstant base-year prices.
CHAPTER 2CHAPTER 2 The Data of MacroeconomicsThe Data of Macroeconomics slide 32
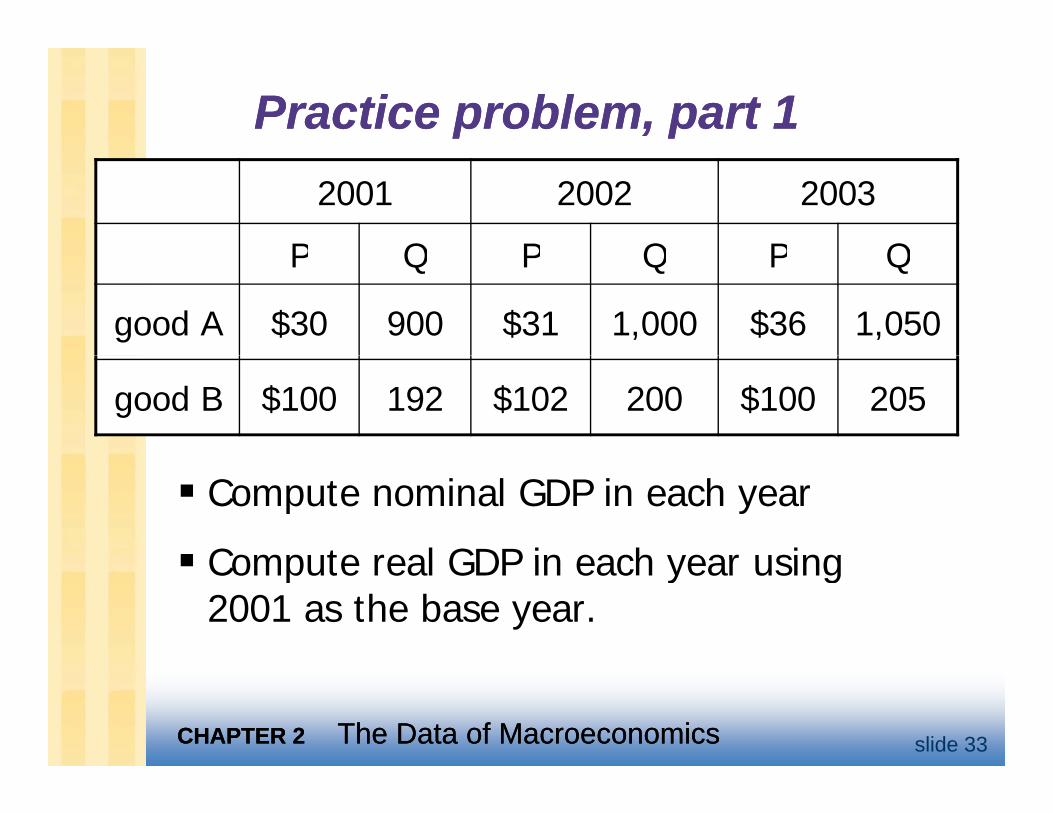
Practice problem, part 1Practice problem, part 12001 2002 2003
P Q P Q P QP Q P Q P Q
good A $30 900 $31 1,000 $36 1,050
good B $100 192 $102 200 $100 205
Compute nominal GDP in each year
Compute real GDP in each year usingCompute real GDP in each year using 2001 as the base year.
CHAPTER 2CHAPTER 2 The Data of MacroeconomicsThe Data of Macroeconomics slide 33
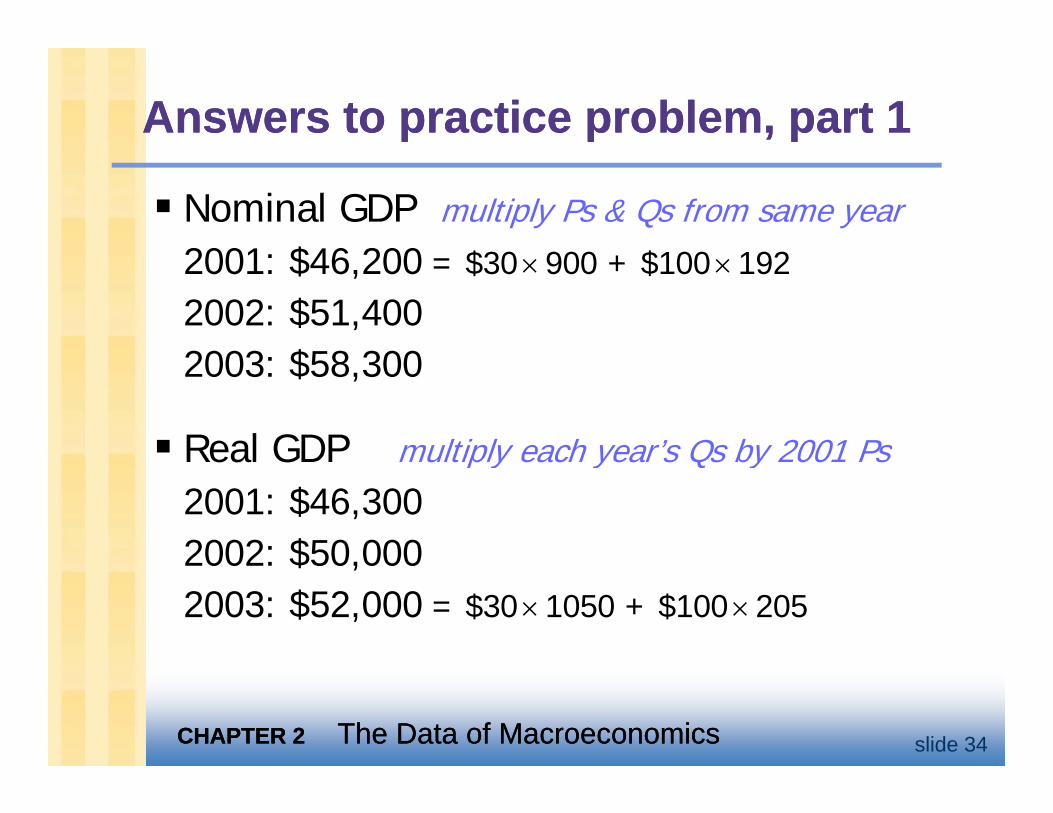
Answers to practice problem, part 1Answers to practice problem, part 1
Nominal GDP multiply Ps & Qs from same year2001 $46 200 $30 900 $100 1922001: $46,200 = $30×900 + $100×192
2002: $51,400 2003 $58 3002003: $58,300
Real GDP multiply each year’s Qs by 2001 PsReal GDP multiply each year s Qs by 2001 Ps2001: $46,3002002: $50,0002002: $50,000 2003: $52,000 = $30×1050 + $100×205
CHAPTER 2CHAPTER 2 The Data of MacroeconomicsThe Data of Macroeconomics slide 34
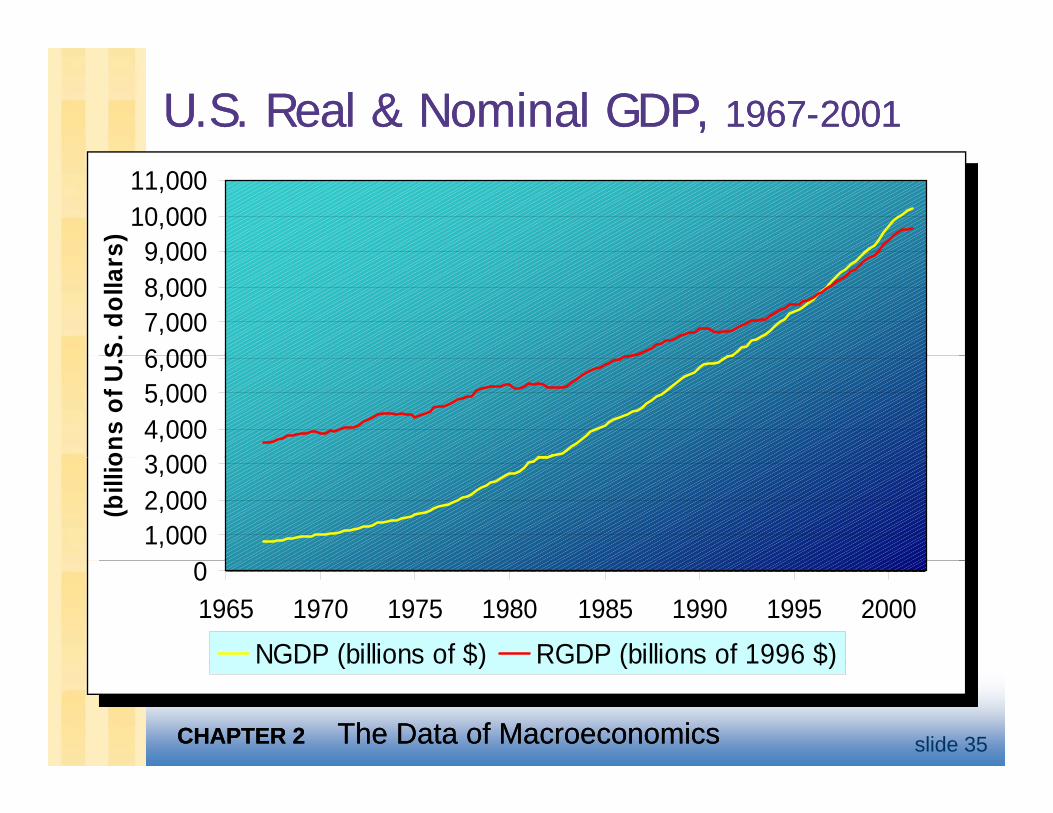
U.S. Real & Nominal GDP, U.S. Real & Nominal GDP, 19671967--20012001
9 00010,00011,000
s)
6 0007,0008,0009,000
S. d
olla
rs
3 0004,0005,0006,000
ons
of U
.S
1,0002,0003,000
(bill
io
01965 1970 1975 1980 1985 1990 1995 2000
NGDP (billions of $) RGDP (billions of 1996 $)
CHAPTER 2CHAPTER 2 The Data of MacroeconomicsThe Data of Macroeconomics slide 35
NGDP (billions of $) RGDP (billions of 1996 $)
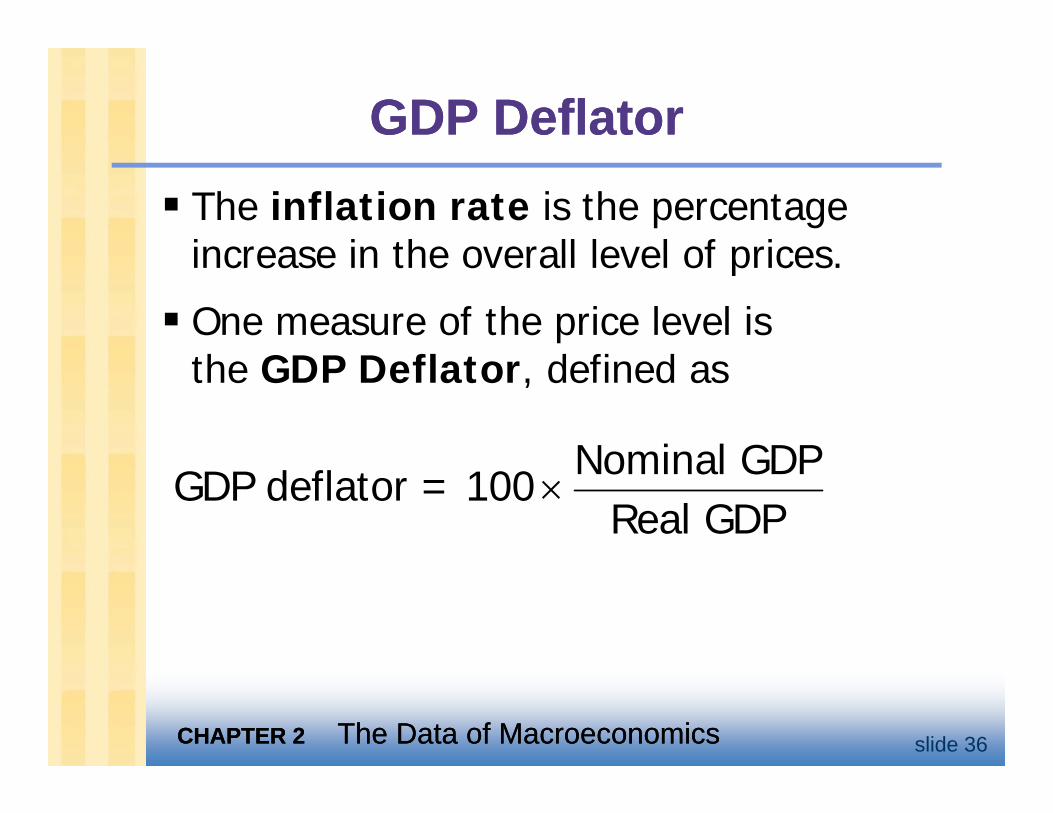
GDP DeflatorGDP DeflatorThe inflation rate is the percentage increase in the overall level of pricesincrease in the overall level of prices.
One measure of the price level is th GDP D fl t d fi dthe GDP Deflator, defined as
Nominal GDPNominal GDPGDP deflator = 100
Real GDP×
CHAPTER 2CHAPTER 2 The Data of MacroeconomicsThe Data of Macroeconomics slide 36
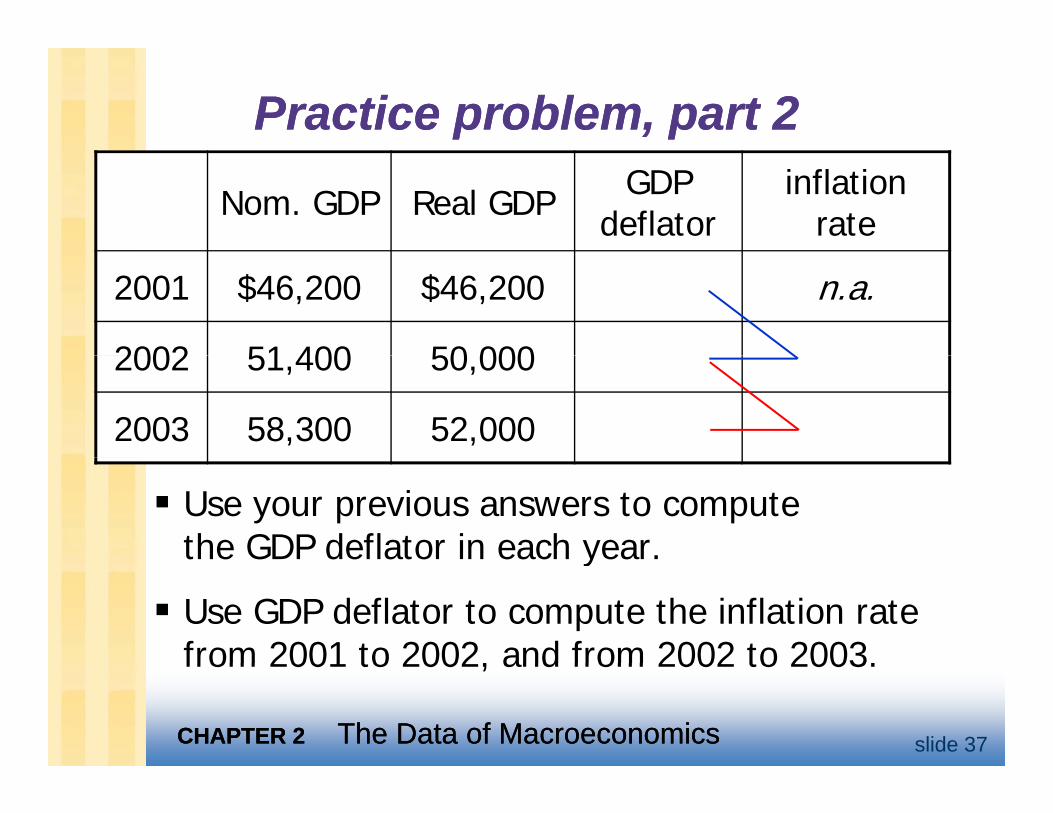
Practice problem, part 2Practice problem, part 2
Nom. GDP Real GDP GDP deflator
inflationrate
2001 $46,200 $46,200 n.a.
2002 51 400 50 0002002 51,400 50,000
2003 58,300 52,000
Use your previous answers to compute the GDP deflator in each year. y
Use GDP deflator to compute the inflation rate from 2001 to 2002, and from 2002 to 2003.
CHAPTER 2CHAPTER 2 The Data of MacroeconomicsThe Data of Macroeconomics slide 37
from 2001 to 2002, and from 2002 to 2003.
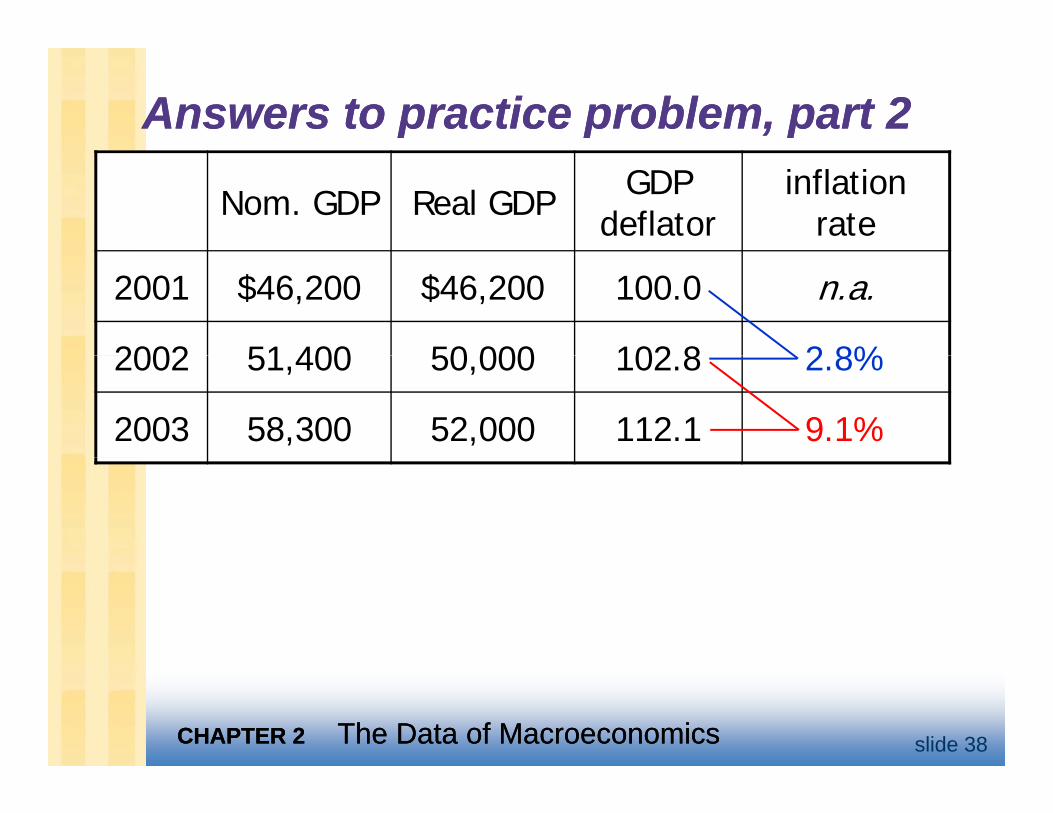
Answers to practice problem, part 2Answers to practice problem, part 2
Nom. GDP Real GDP GDP deflator
inflationrate
2001 $46,200 $46,200 100.0 n.a.
2002 51 400 50 000 102 8 2 8%2002 51,400 50,000 102.8 2.8%
2003 58,300 52,000 112.1 9.1%
CHAPTER 2CHAPTER 2 The Data of MacroeconomicsThe Data of Macroeconomics slide 38
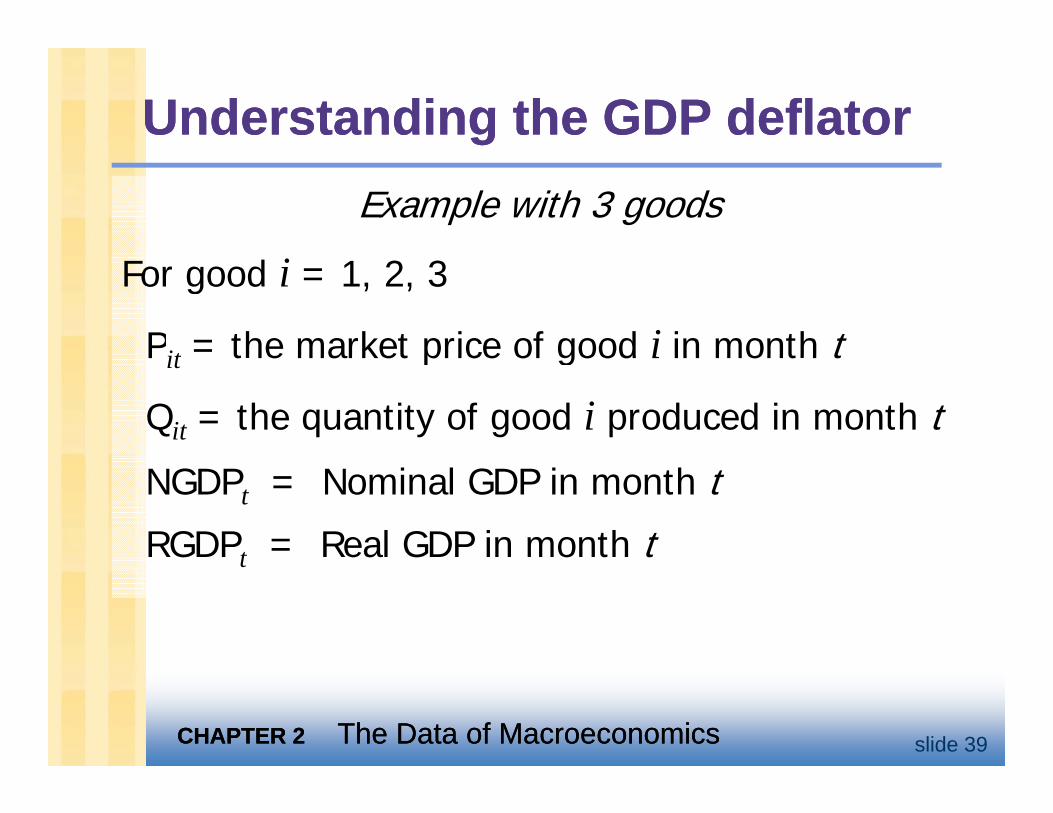
Understanding the GDP deflatorUnderstanding the GDP deflatorExample with 3 goods
For good i = 1, 2, 3
Pit = the market price of good i in month tPit the market price of good i in month t
Qit = the quantity of good i produced in month t
NGDPt = Nominal GDP in month t
RGDPt = Real GDP in month tt
CHAPTER 2CHAPTER 2 The Data of MacroeconomicsThe Data of Macroeconomics slide 39
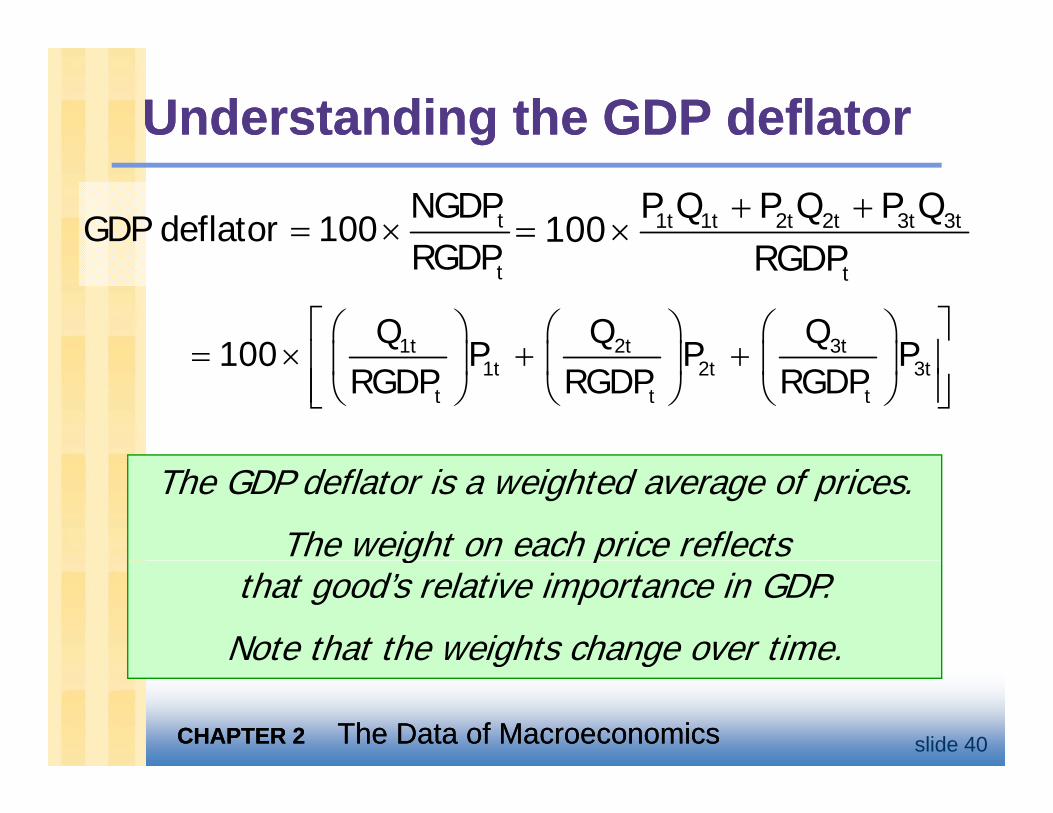
Understanding the GDP deflatorUnderstanding the GDP deflator
tNGDPGDP deflator
RGDP= ×100 1t 1t 2t 2t 3t 3tP Q P Q P Q
RGDP+ +
= ×100tRGDP tRGDP
1t 2t 3tQ Q QP P P
⎡ ⎤⎛ ⎞ ⎛ ⎞ ⎛ ⎞= × + +⎢ ⎥⎜ ⎟ ⎜ ⎟ ⎜ ⎟100 1t 2t 3t
t t t
P P PRGDP RGDP RGDP
= × + +⎢ ⎥⎜ ⎟ ⎜ ⎟ ⎜ ⎟⎢ ⎥⎝ ⎠ ⎝ ⎠ ⎝ ⎠⎣ ⎦
100
The GDP deflator is a weighted average of prices.
The weight on each price reflects g pthat good’s relative importance in GDP.
Note that the weights change over time.
CHAPTER 2CHAPTER 2 The Data of MacroeconomicsThe Data of Macroeconomics slide 40
g g
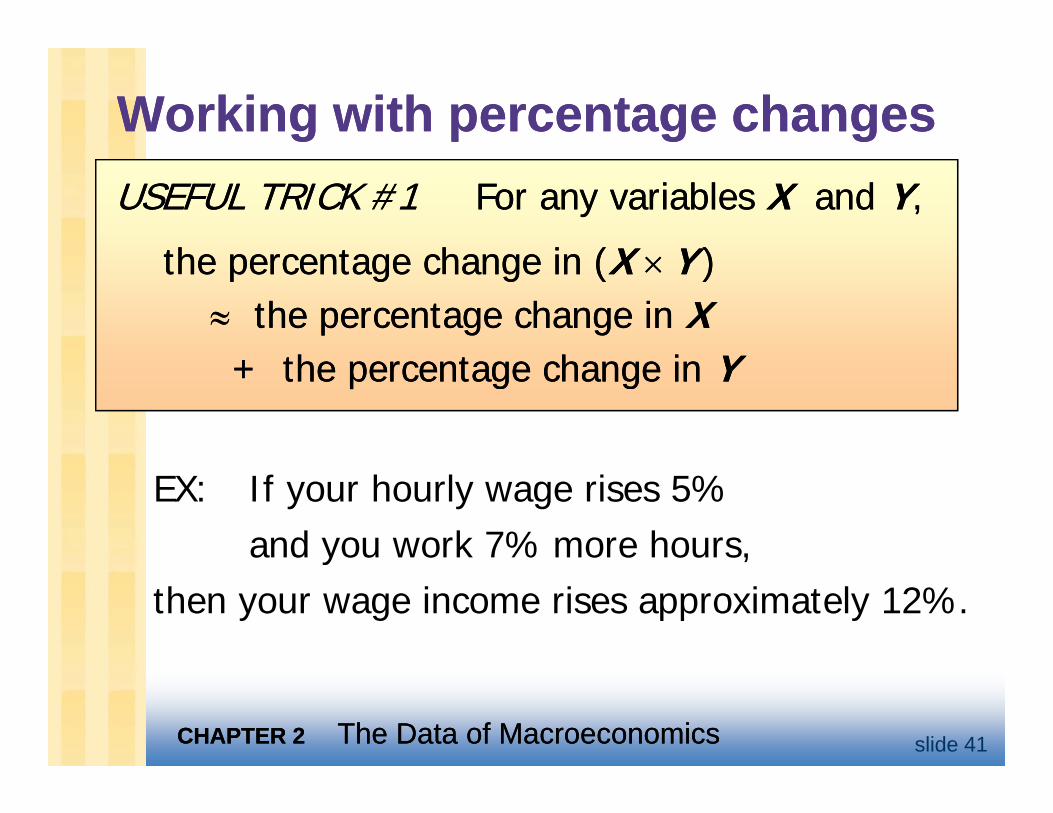
Working with percentage changesWorking with percentage changesUSEFUL TRICK #1 USEFUL TRICK #1 For any variables For any variables XX and and YY, ,
th t h i (th t h i (XX YY ))the percentage change in (the percentage change in (XX ××YY ))≈≈ the percentage change in the percentage change in XX
th t h ith t h i YY+ + the percentage change in the percentage change in YY
EX: If your hourly wage rises 5% and you work 7% more hours, y ,
then your wage income rises approximately 12%.
CHAPTER 2CHAPTER 2 The Data of MacroeconomicsThe Data of Macroeconomics slide 41
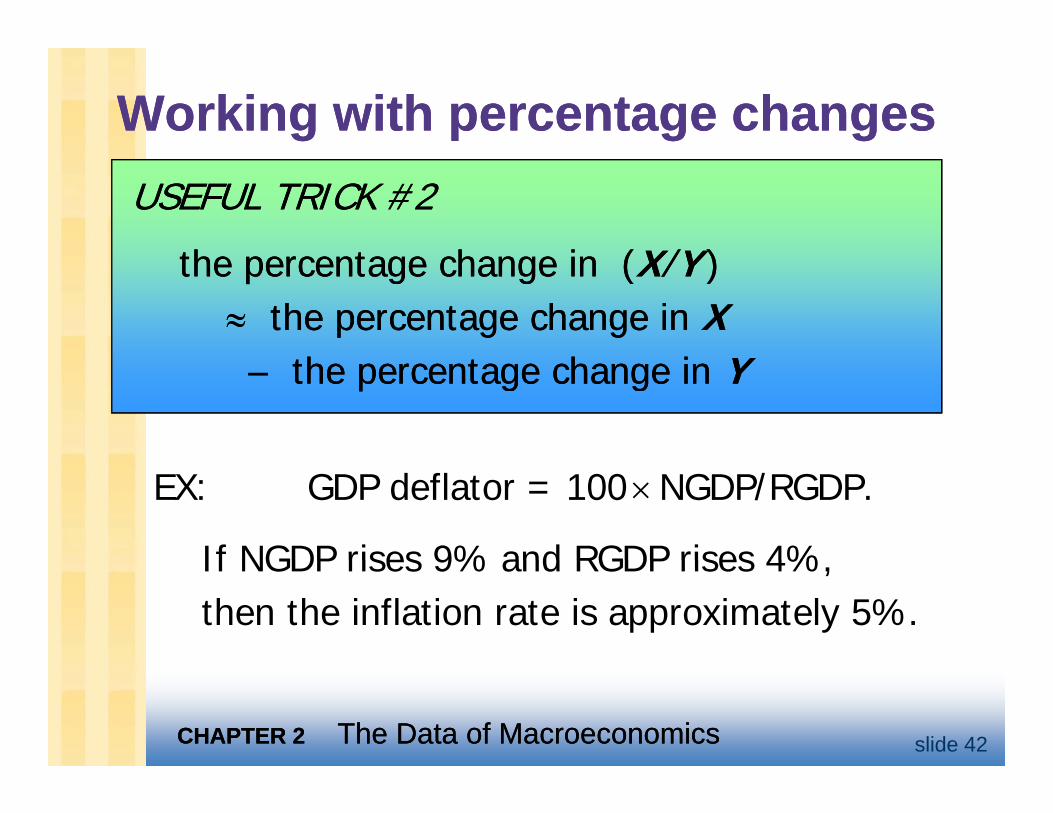
Working with percentage changesWorking with percentage changesUSEFUL TRICK #2USEFUL TRICK #2
th t h i (th t h i (XX//YY ))the percentage change in (the percentage change in (XX//YY ))≈≈ the percentage change in the percentage change in XX
h hh h−− the percentage change in the percentage change in YY
EX: GDP deflator = 100×NGDP/RGDP.
If NGDP rises 9% and RGDP rises 4%If NGDP rises 9% and RGDP rises 4%, then the inflation rate is approximately 5%.
CHAPTER 2CHAPTER 2 The Data of MacroeconomicsThe Data of Macroeconomics slide 42
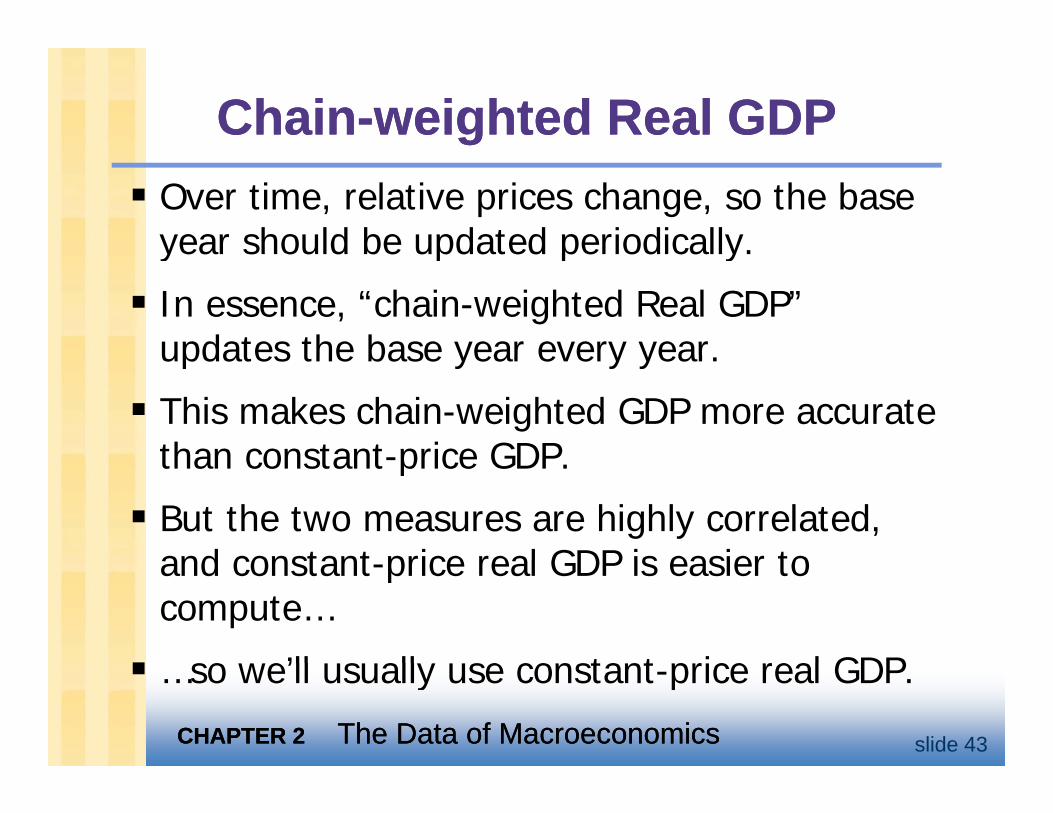
ChainChain--weighted Real GDPweighted Real GDPOver time, relative prices change, so the base year should be updated periodically.year should be updated periodically.
In essence, “chain-weighted Real GDP” updates the base year every yearupdates the base year every year.
This makes chain-weighted GDP more accurate than constant-price GDPthan constant-price GDP.
But the two measures are highly correlated, and constant price real GDP is easier toand constant-price real GDP is easier to compute…
so we’ll usually use constant price real GDP
CHAPTER 2CHAPTER 2 The Data of MacroeconomicsThe Data of Macroeconomics slide 43
…so we’ll usually use constant-price real GDP.
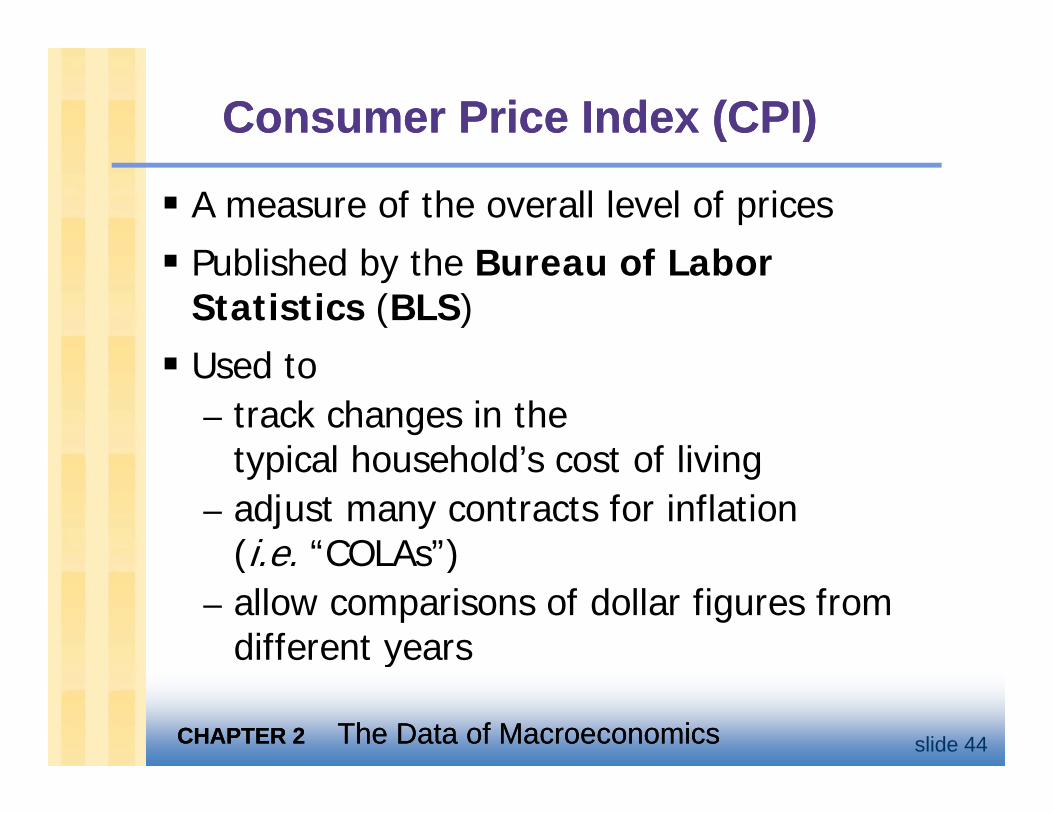
Consumer Price Index (CPI)Consumer Price Index (CPI)
A measure of the overall level of prices
P bli h d b th B f L bPublished by the Bureau of Labor Statistics (BLS)
U d tUsed to – track changes in the
typical household’s cost of livingtypical household s cost of living– adjust many contracts for inflation
(i e “COLAs”)(i.e. COLAs )– allow comparisons of dollar figures from
different years
CHAPTER 2CHAPTER 2 The Data of MacroeconomicsThe Data of Macroeconomics slide 44
y
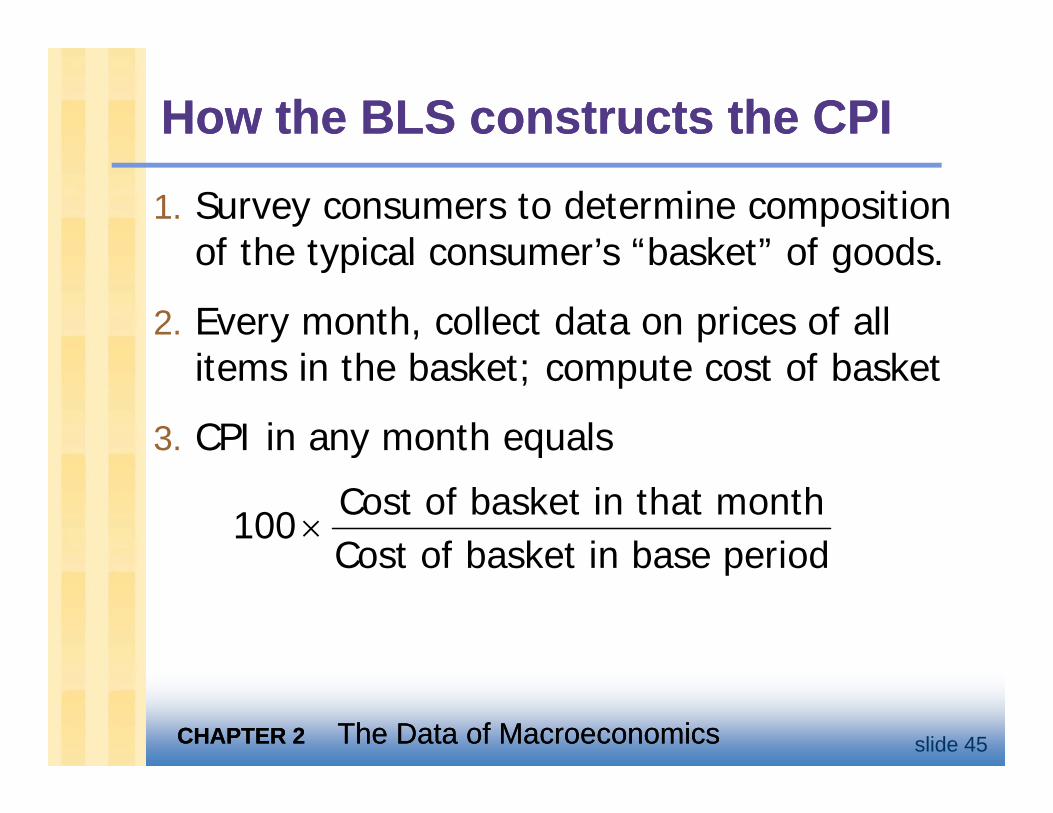
How the BLS constructs the CPIHow the BLS constructs the CPI
1. Survey consumers to determine composition of the typical consumer’s “basket” of goodsof the typical consumer s basket of goods.
2. Every month, collect data on prices of all it i th b k t t t f b k titems in the basket; compute cost of basket
3. CPI in any month equals
Cost of basket in that month100
Cost of basket in base period×
Cost of basket in base period
CHAPTER 2CHAPTER 2 The Data of MacroeconomicsThe Data of Macroeconomics slide 45
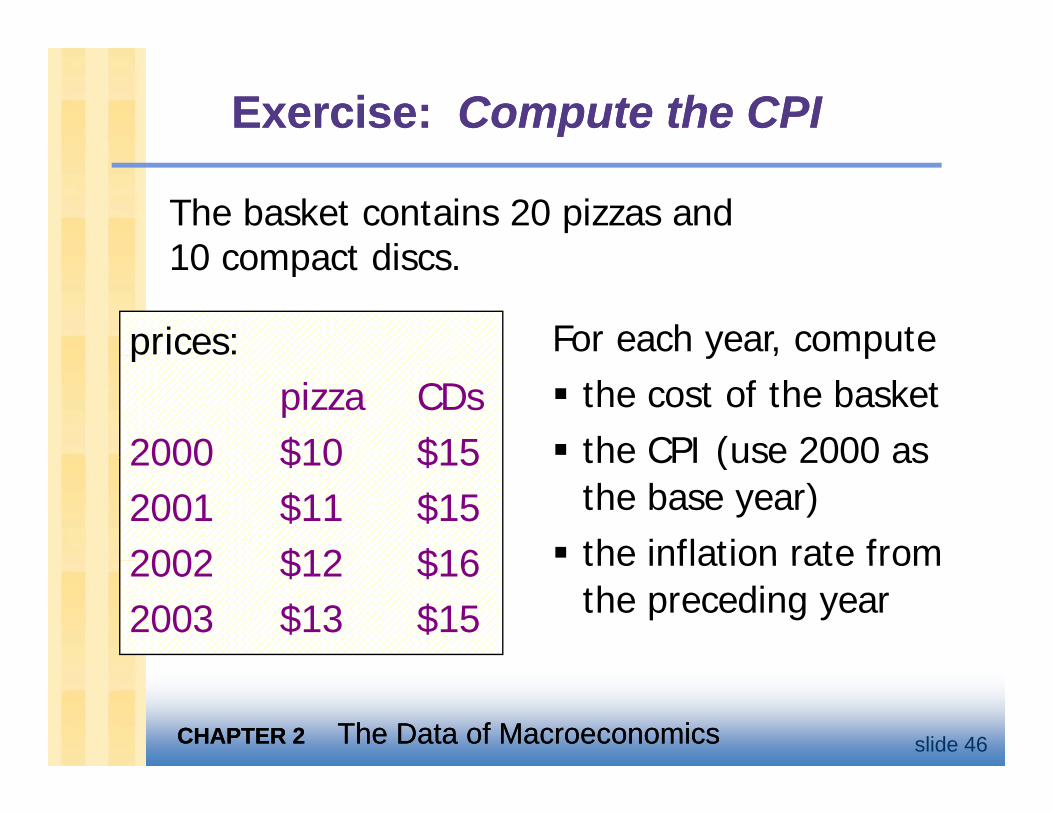
Exercise: Exercise: Compute the CPICompute the CPI
The basket contains 20 pizzas and 10 compact discs10 compact discs.
prices: For each year, computeppizza CDs
2000 $10 $15
y , pthe cost of the basketthe CPI (use 2000 as2000 $10 $15
2001 $11 $152002 $12 $16
the CPI (use 2000 as the base year)the inflation rate from2002 $12 $16
2003 $13 $15
the inflation rate from the preceding year
CHAPTER 2CHAPTER 2 The Data of MacroeconomicsThe Data of Macroeconomics slide 46
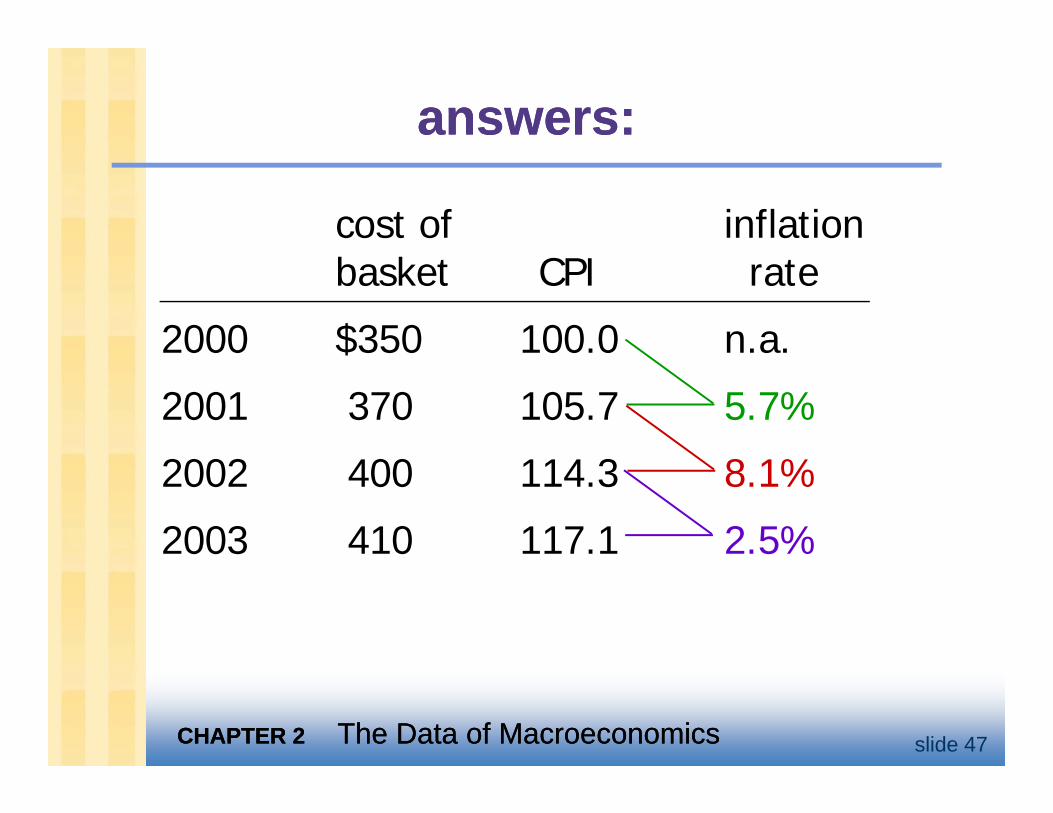
answers:answers:
cost of inflationbasket CPI rate
2000 $350 100.0 n.a.$
2001 370 105.7 5.7%
2002 400 114 3 8 1%2002 400 114.3 8.1%
2003 410 117.1 2.5%
CHAPTER 2CHAPTER 2 The Data of MacroeconomicsThe Data of Macroeconomics slide 47
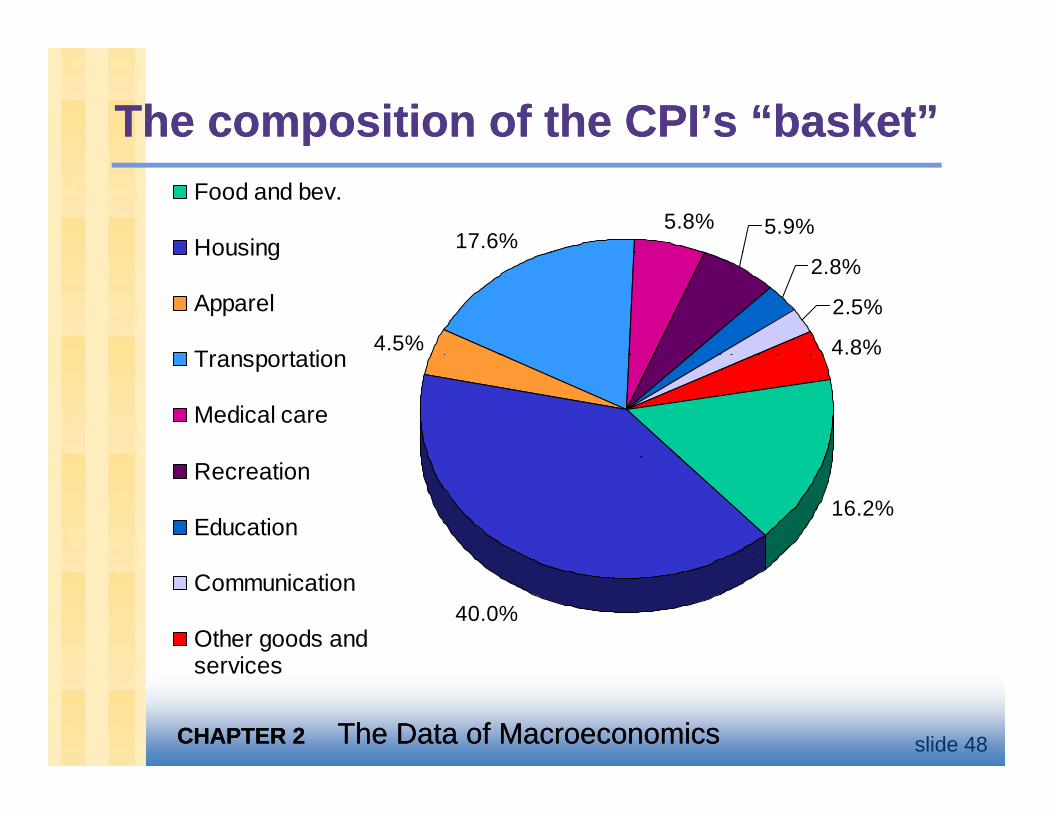
The composition of the CPI’s “basket”The composition of the CPI’s “basket”
17.6%5.8% 5.9%
Food and bev.
Housing
4.5%
2.8%
2.5%
4.8%
Housing
Apparel
TransportationTransportation
Medical care
16.2%
Recreation
Education
40.0%Communication
Other goods andservices
CHAPTER 2CHAPTER 2 The Data of MacroeconomicsThe Data of Macroeconomics slide 48
services
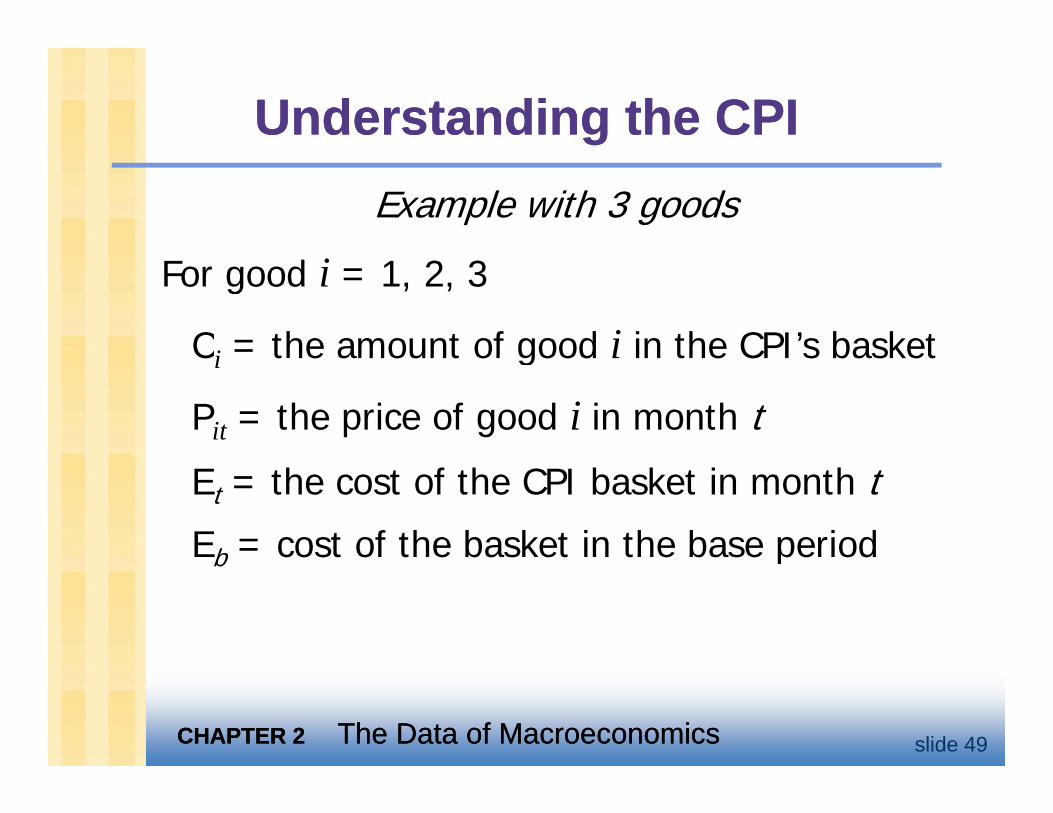
Understanding the CPIUnderstanding the CPIExample with 3 goods
For good i = 1, 2, 3
Ci = the amount of good i in the CPI’s basketCi the amount of good i in the CPI s basket
Pit = the price of good i in month t
Et = the cost of the CPI basket in month t
Eb = cost of the basket in the base periodb p
CHAPTER 2CHAPTER 2 The Data of MacroeconomicsThe Data of Macroeconomics slide 49
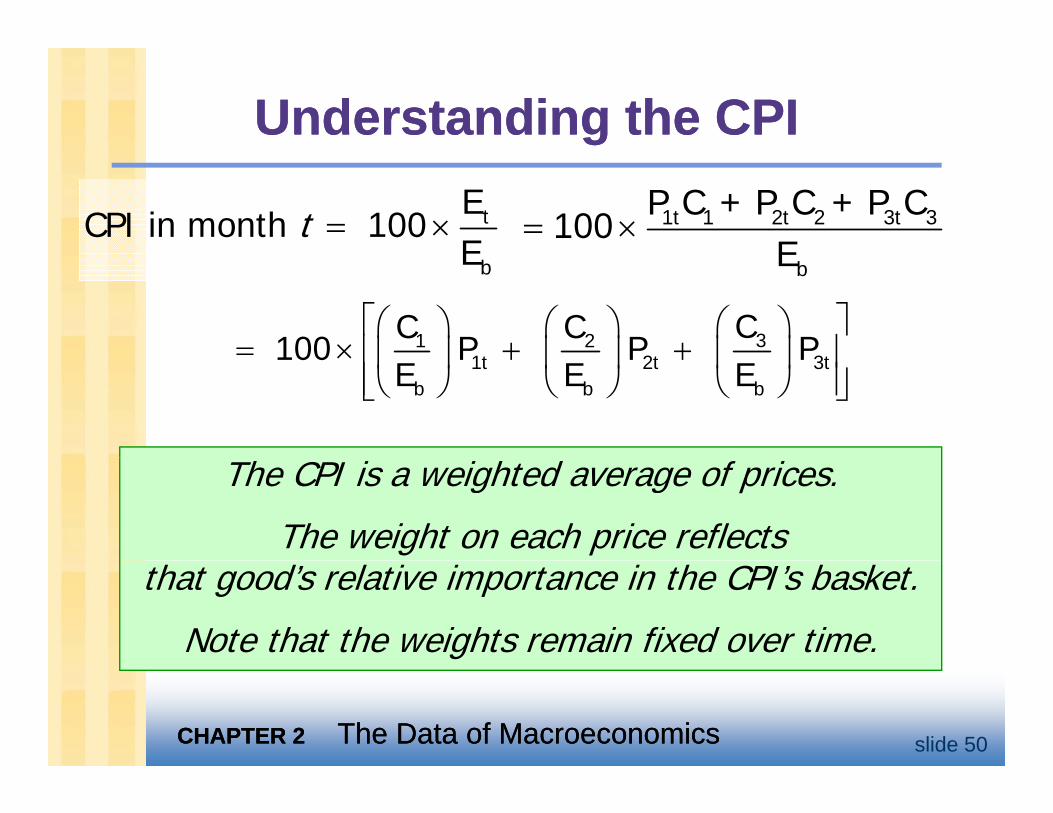
Understanding the CPIUnderstanding the CPI
tECPI in month
E= ×100t 1t 1 2t 2 3t 3P C + P C + P C
E= ×100
bE bE
31 21t 2t 3t
CC CP P P
⎡ ⎤⎛ ⎞ ⎛ ⎞ ⎛ ⎞= × + +⎢ ⎥⎜ ⎟ ⎜ ⎟ ⎜ ⎟100 1t 2t 3t
b b b
P P PE E E
× + +⎢ ⎥⎜ ⎟ ⎜ ⎟ ⎜ ⎟⎢ ⎥⎝ ⎠ ⎝ ⎠ ⎝ ⎠⎣ ⎦
100
The CPI is a weighted average of prices.
The weight on each price reflects that good’s relative importance in the CPI’s basket.
Note that the weights remain fixed over time.
CHAPTER 2CHAPTER 2 The Data of MacroeconomicsThe Data of Macroeconomics slide 50
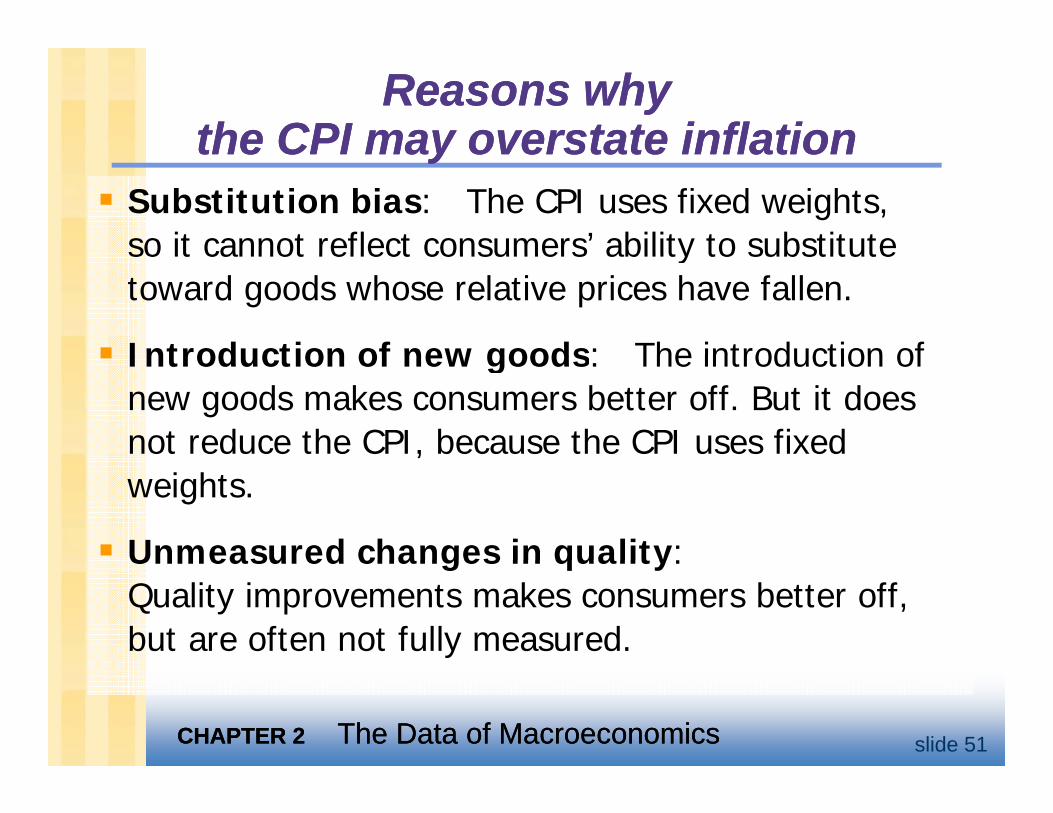
Reasons why Reasons why the CPI may overstate inflationthe CPI may overstate inflationthe CPI may overstate inflationthe CPI may overstate inflation
Substitution bias: The CPI uses fixed weights, so it cannot reflect consumers’ ability to substituteso it cannot reflect consumers ability to substitute toward goods whose relative prices have fallen.
Introduction of new goods: The introduction ofIntroduction of new goods: The introduction of new goods makes consumers better off. But it does not reduce the CPI, because the CPI uses fixed ,weights.
Unmeasured changes in quality:Unmeasured changes in quality: Quality improvements makes consumers better off, but are often not fully measured.
CHAPTER 2CHAPTER 2 The Data of MacroeconomicsThe Data of Macroeconomics slide 51
Discussion topic:Discussion topic:If your grandmother receives Social Security how is she affected by the CPISecurity, how is she affected by the CPI changes?
How does your grandmother’s “basket”How does your grandmother s basket differ from the CPI’s?
CHAPTER 2CHAPTER 2 The Data of MacroeconomicsThe Data of Macroeconomics slide 52
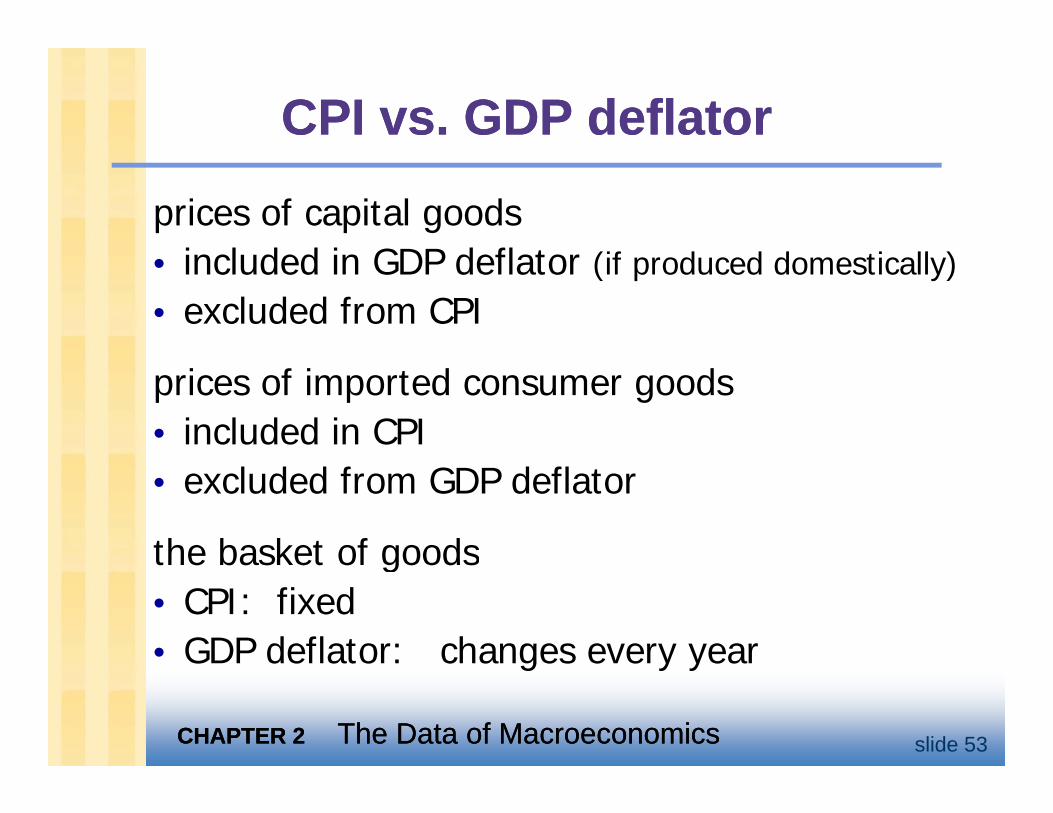
CPI vs. GDP deflatorCPI vs. GDP deflator
prices of capital goodsi l d d i GDP d fl t (if d d d ti ll )• included in GDP deflator (if produced domestically)
• excluded from CPI
prices of imported consumer goods• included in CPI• excluded from GDP deflator
the basket of goodsthe basket of goods• CPI: fixed• GDP deflator: changes every year
CHAPTER 2CHAPTER 2 The Data of MacroeconomicsThe Data of Macroeconomics slide 53
GDP deflator: changes every year
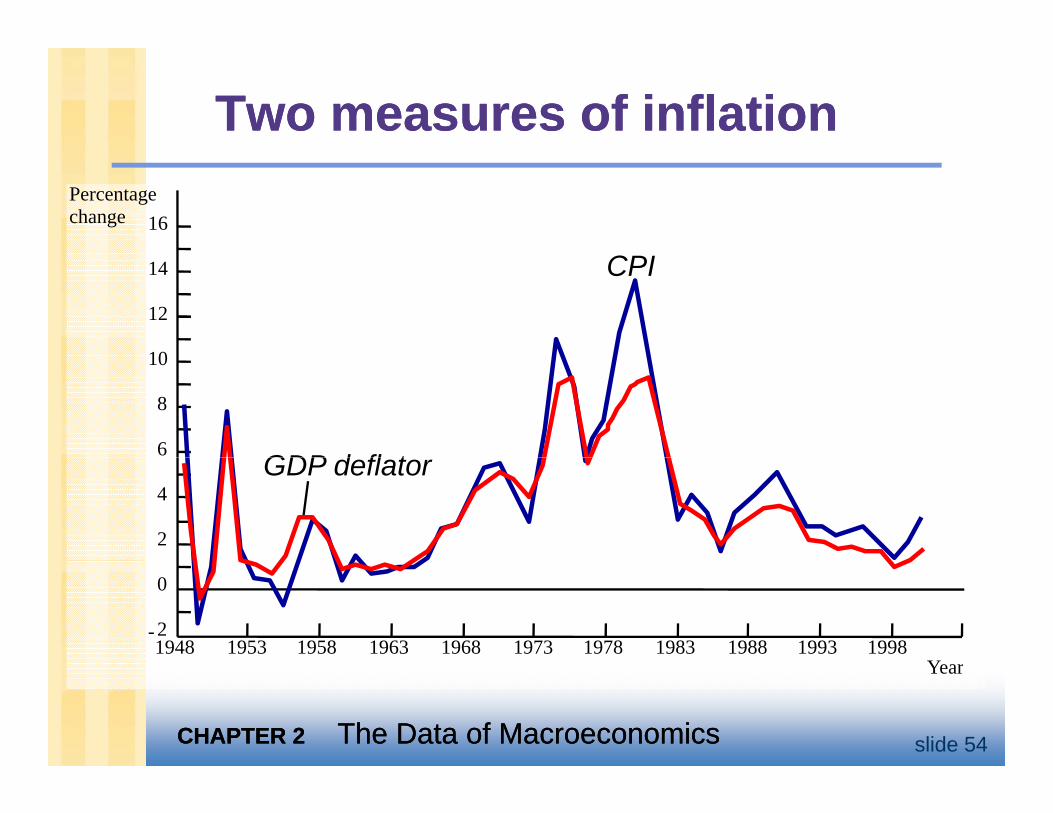
Two measures of inflationTwo measures of inflation
16 Percentagechange
14
12
10
CPI
10
8
6 GDP d fl t
4
2
GDP deflator
0
- 21948 1953 1958 1963 1968 1973
Y1978 1983 1988 1993 1998
CHAPTER 2CHAPTER 2 The Data of MacroeconomicsThe Data of Macroeconomics slide 54
Year
Categories of the populationCategories of the populationemployedworking at a paid jobworking at a paid job
unemployednot employed but looking for a jobnot employed but looking for a job
labor force the amount of labor available for producingthe amount of labor available for producing goods and services; all employed plus unemployed personsunemployed persons
not in the labor forcenot employed, not looking for work.
CHAPTER 2CHAPTER 2 The Data of MacroeconomicsThe Data of Macroeconomics slide 55
not employed, not looking for work.
Two important labor force conceptsTwo important labor force conceptsunemployment rate percentage of the labor force that ispercentage of the labor force that is unemployed
labor force participation rate the fraction of the adult population that ‘participates’ in the labor forcethat ‘participates’ in the labor force
CHAPTER 2CHAPTER 2 The Data of MacroeconomicsThe Data of Macroeconomics slide 56
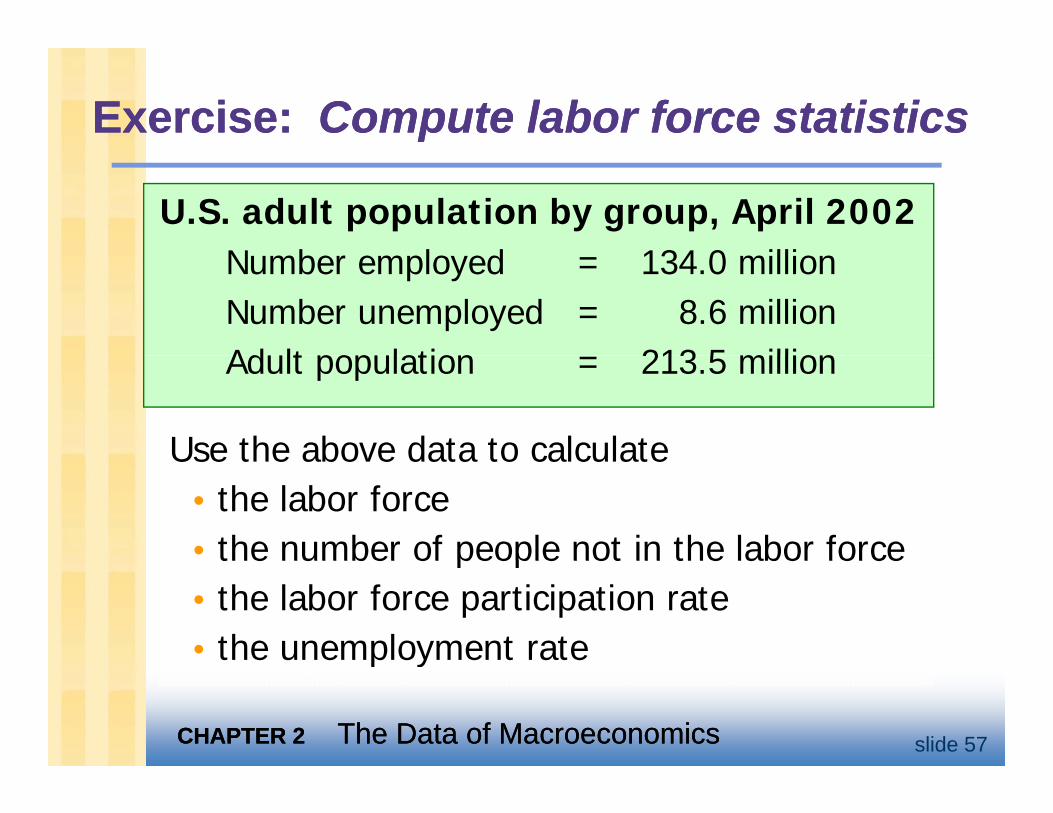
Exercise: Exercise: Compute labor force statisticsCompute labor force statistics
U.S. adult population by group, April 2002N b l d 134 0 illiNumber employed = 134.0 millionNumber unemployed = 8.6 millionAdult population 213 5 millionAdult population = 213.5 million
Use the above data to calculateUse the above data to calculate• the labor force• the number of people not in the labor forcethe number of people not in the labor force• the labor force participation rate• the unemployment rate
CHAPTER 2CHAPTER 2 The Data of MacroeconomicsThe Data of Macroeconomics slide 57
p y
Answers:Answers:
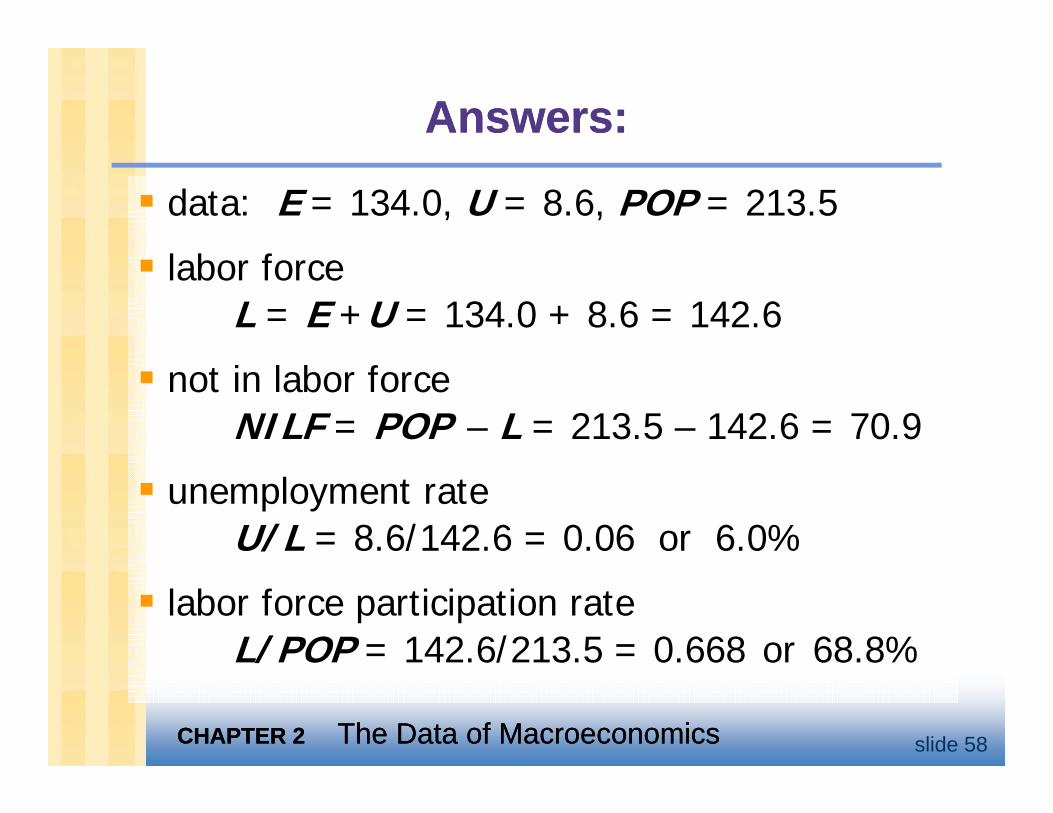
data: E = 134.0, U = 8.6, POP = 213.5
l b flabor forceL = E +U = 134.0 + 8.6 = 142.6
not in labor forceNILF = POP – L = 213.5 – 142.6 = 70.9
unemployment rateU/L = 8.6/142.6 = 0.06 or 6.0%
labor force participation rateL/POP = 142.6/213.5 = 0.668 or 68.8%
CHAPTER 2CHAPTER 2 The Data of MacroeconomicsThe Data of Macroeconomics slide 58
/ /
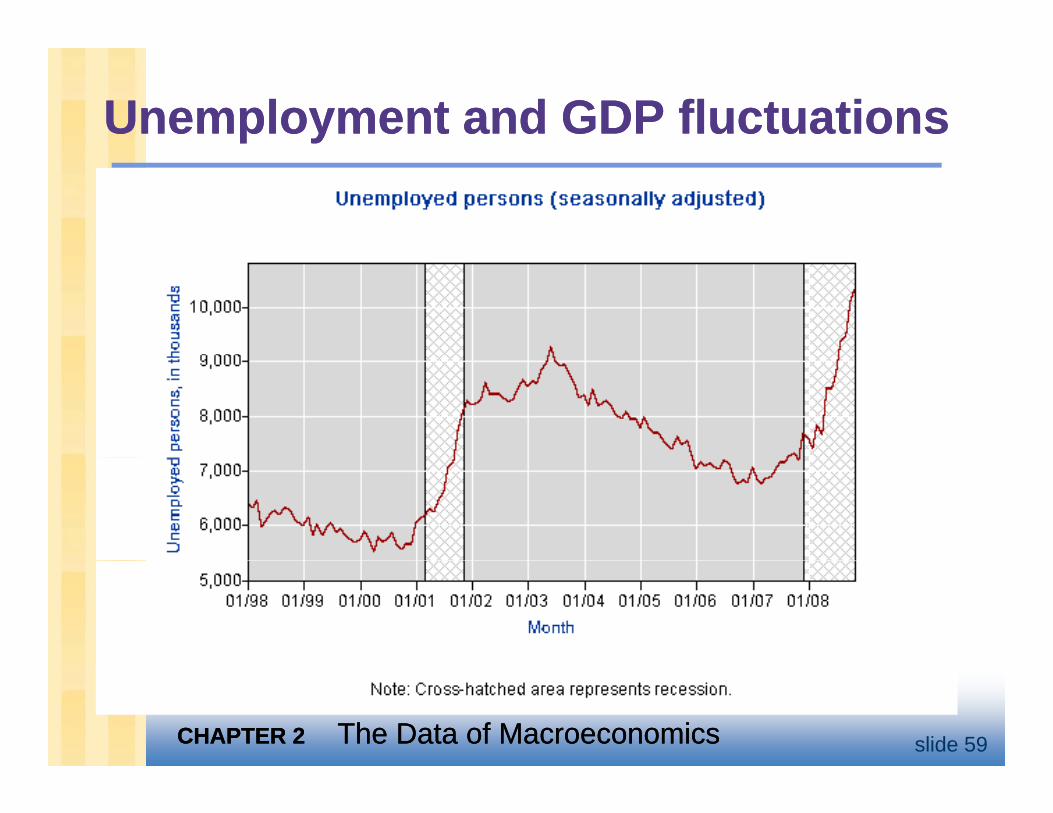
Unemployment and GDP fluctuationsUnemployment and GDP fluctuations
CHAPTER 2CHAPTER 2 The Data of MacroeconomicsThe Data of Macroeconomics slide 59
Okun’s LawOkun’s LawEmployed workers help produce GDP, while unemployed workers do notwhile unemployed workers do not. So one would expect a negative relationship betweena negative relationship between unemployment and real GDP.
This relationship is clear in the dataThis relationship is clear in the data…
CHAPTER 2CHAPTER 2 The Data of MacroeconomicsThe Data of Macroeconomics slide 60
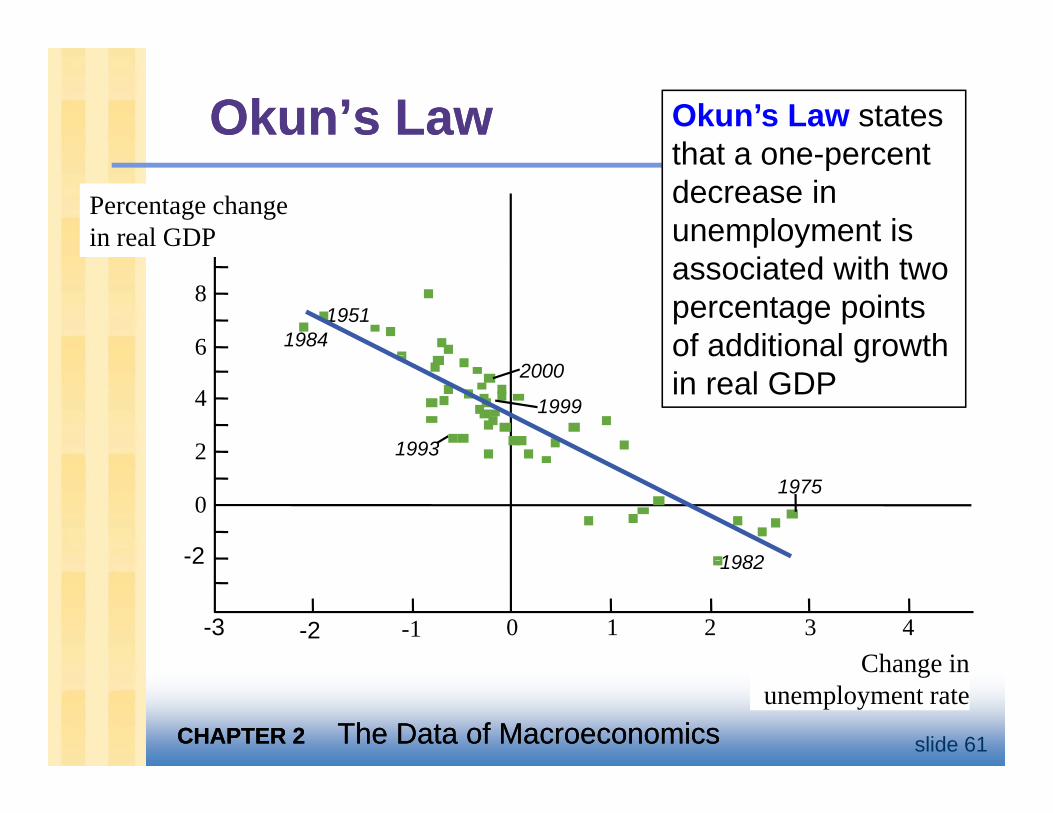
Okun’s LawOkun’s Law Okun’s Law states that a one percent
10 Percentage change in real GDP
that a one-percent decrease in unemployment is
19511984
8
6
associated with two percentage points of additional growth
1999
2000
1993
4
2
of additional growth in real GDP
1982
1975
2
0
-2 1982
Change in-3 -2 -1 0 1 2 43
2
CHAPTER 2CHAPTER 2 The Data of MacroeconomicsThe Data of Macroeconomics slide 61
Change in unemployment rate
Chapter SummaryChapter Summary1. Gross Domestic Product (GDP) measures
both total income and total expenditure onboth total income and total expenditure on the economy’s output of goods & services.
2 N i l GDP l t t t t i2. Nominal GDP values output at current prices; real GDP values output at constant prices. Changes in output affect both measures butChanges in output affect both measures, but changes in prices only affect nominal GDP.
3 GDP i th f3. GDP is the sum of consumption, investment, government purchases and net exports
CHAPTER 2CHAPTER 2 The Data of MacroeconomicsThe Data of Macroeconomics slide 62
purchases, and net exports.
Chapter SummaryChapter Summary4. The overall level of prices can be measured
by eitherythe Consumer Price Index (CPI), the price of a fixed basket of goods purchased by the typical consumerthe GDP deflator, h i f i l l GDPthe ratio of nominal to real GDP
5. The unemployment rate is the fraction of the labor force that is not employed. When unemployment rises, the growth rate of real GDP falls
CHAPTER 2CHAPTER 2 The Data of MacroeconomicsThe Data of Macroeconomics slide 63
of real GDP falls.