Embed Size (px)
Citation preview

PRIVATE BANKING
EDMOND DE ROTHSCHILD | BRUNO JACQUIER, FRANÇOIS LÉONET, LISA TURK 1/11
MACRO HIGHLIGHTS & STRATEGY WEEK OF 6 JUNE 2016
OUR ROUNDUP:
Markets: The next rate hike won’t be in June
US jobs data disappointed, but investors aren’t bothered
United States: The Fed’s focus on financial conditions Long-term interest rates will remain structurally low due in part to surplus liquidity and savings worldwide
Switzerland: Can it surmount the strong franc? Growth is on the verge of accelerating as manufacturing sentiment picks up Lower housing prices could tamp down on consumer spending
MARKETS
THE NEXT RATE HIKE WON’T BE IN JUNE
Last Friday’s US jobs data were uninspiring. Only 38,000 jobs were added in May after a poor showing
in April as well. Strikes in the telecoms sector (idling 35,000 workers) and a decline in temporary help
services (-21,000) weighed heavily. The figures fell short of the 100,000 jobs that have to be added to
absorb new entrants into the labour market.
S&P 500 (2-3 June 2016)

MACRO HIGHLIGHTS & STRATEGY | 6 JUNE 2016
2/11 EDMOND DE ROTHSCHILD | BRUNO JACQUIER, FRANÇOIS LÉONET, LISA TURK
The concomitant dip in the unemployment rate to 4.7% offers only cold comfort, as it was the result of a
decline in the working population.
Before we start worrying, we need to wait and see whether the May figures were a blip or the start of a new
trend. One factor to keep in mind is that, once full employment was reached, we expected job creation to
slow to around 100,000 per month. The markets may be thinking the same thing, since they
rebounded before the day was out (see chart on the first page).
UNITED STATES
THE FED’S FOCUS ON FINANCIAL CONDITIONS
The US Federal Reserve (Fed) has been looking hard at the economy’s financial conditions over the past
few quarters. This catch-all term refers to a number of factors that help determine economic behaviour and
the future course of the economy, such as the state of the markets, yield spreads, the yield curve, the dollar
and surveys of lending standards. Monetary policy affects each of these factors, as can be seen clearly
following the Fed's first rate hike last December when financial conditions tightened markedly (see chart
below).
The Fed responded by dialling down its discourse at the start of the year. And since that time, most of
these factors have reversed course: the dollar has stabilised, markets are up and corporate spreads
have narrowed (see charts below).
MACRO HIGHLIGHTS & STRATEGY | 6 JUNE 2016
EDMOND DE ROTHSCHILD | BRUNO JACQUIER, FRANÇOIS LÉONET, LISA TURK 3/11
But one key variable, the yield curve, continues to flatten (see charts below). Long-term interest rates
generally rise when monetary policy enters a tightening phase, yet that is not happening here. There are
several reasons for this:
- First, long rates trend upward in this scenario because monetary conditions are generally tightened
at the start of an economic cycle. But that is not the case here. The US economy has been growing
faster than its potential GDP rate for the past few years, which means that the Fed started to
raise rates well into the cycle.

MACRO HIGHLIGHTS & STRATEGY | 6 JUNE 2016
4/11 EDMOND DE ROTHSCHILD | BRUNO JACQUIER, FRANÇOIS LÉONET, LISA TURK
- Surplus liquidity channelled into the markets around the world has driven up demand for US
Treasuries and put downward pressure on long-term interest rates in the USA. Two other factors
are at play:
o The Fed reinvests in Treasuries in its portfolio as they mature (and has given no
indication that it would reduce its balance sheet; see left-hand chart below). With the Fed
holding 23% of government debt, these are hefty amounts being reinvested (see right-hand
chart below).
o The European Central Bank and the Bank of Japan’s unorthodox monetary policy is
holding those countries’ interest rates down. This makes US debt more attractive and
encourages international investors to engage in carry trades targeting US Treasuries (see
right-hand chart below).
- Insurance companies, mutual funds and pension funds are another source of demand for
Treasuries (see right-hand chart below). These financial institutions, which are contractually obliged
to achieve a certain return, have to invest in high quality and highly liquid assets that still offer a
positive return. They invest in long-term Treasuries rather than short terms T-bills in pursuit of the
higher payoff.
- The government’s Treasury debt supply has dropped in recent years. The government is issuing
less debt because, with a narrowing budget deficit, its funding needs have declined (see left-hand
chart below). The government also tends to meet its funding needs with short-term T-bills rather
than long-term Treasuries. All these factors tend to pull long-term interest rates downward.

MACRO HIGHLIGHTS & STRATEGY | 6 JUNE 2016
EDMOND DE ROTHSCHILD | BRUNO JACQUIER, FRANÇOIS LÉONET, LISA TURK 5/11
- The global saving glut is a structural cause of declining long-term rates. With the supply of
saving outpacing global investment, the interest rates that link the two have fallen (see right-hand
chart below). Unlike in prior decades, however, the lower interest rates have not boosted investment
demand.
Conclusions:
- Long-term interest rates should remain structurally low given global imbalances and surplus
liquidity and savings that will not be absorbed any time soon.
- The Fed, one of whose missions is to stabilise the financial system, will do what it can to make
financial conditions less sensitive to monetary policy.
- US growth will benefit from easing financial conditions and persistently low long rates. This
will encourage households, which have reduced their debt in recent years, to borrow more and
could give a boost to consumer spending and the property market.
- Several caveats are in order:
o This low interest-rate scenario does not mean interest rates will not rise, but that they will
rise less quickly than in previous cycles.
o A scenario of robust growth and structurally low long rates can lead to financial bubbles and
wide market swings. Something to keep in mind.
Savings in the 1990s
Savings today
Savings and investment
Real interest rates
Investment
r* 1990s
r* today
MACRO HIGHLIGHTS & STRATEGY | 6 JUNE 2016
6/11 EDMOND DE ROTHSCHILD | BRUNO JACQUIER, FRANÇOIS LÉONET, LISA TURK
SWITZERLAND
CAN IT SURMOUNT THE STRONG FRANC?
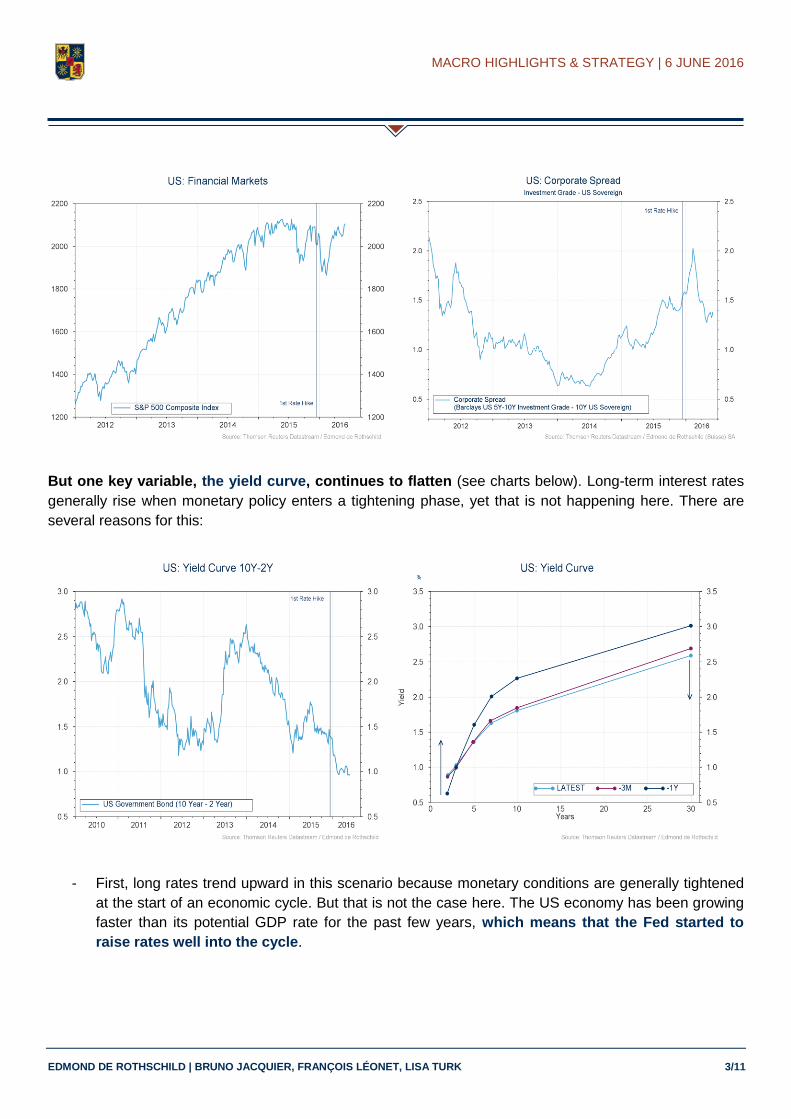
Switzerland has delivered positive growth despite the obstacle posed by the strong franc. Gross
domestic product (GDP) rose by 0.1% in the first quarter of 2016. That equates to a +0.7% year-on-year
rise, in line with our estimates. Economic activity was fuelled by consumer spending and by corporate
spending on both construction and capital goods. The trade balance and public spending, however,
weighed on growth (see right-hand chart).
Economic growth: Switzerland vs Euro Zone (%YoY) Switzerland: Contribution to growth (%GDP, YoY)
-6
-4
-2
0
2
4
6
-6
-4
-2
0
2
4
6
92 94 96 98 00 02 04 06 08 10 12 14 16
Switzerland GDP (%YoY)
Euro Area GDP (%YoY)
-3
-2
-1
0
1
2
3
-3
-2
-1
0
1
2
3
2002 2004 2006 2008 2010 2012 2014 2016
Domestic Demand (Contribution to %YoY)
Trade Balance & Inventories (Contribution to %YoY)
The Swiss economy fared less well than the Euro Zone, which turned in full-year growth of +1.5% (see left-
hand chart above). But the future is bright: growth is on the verge of accelerating as manufacturing
sentiment picks up. The PMI and the KOF economic barometer are sharply up, pointing to an economic
improvement in the coming months. The PMI has climbed 5.8 points in four months to reach its highest
level since February 2014 (see left-hand chart below).
With consumer confidence rising, the employment outlook stable and the franc weakening slightly, all
systems are go. We expect the Swiss economy to grow by +1.1% in 2016. Estimates from the main
economic institutes range from +0.8% to +1.4%.
MACRO HIGHLIGHTS & STRATEGY | 6 JUNE 2016
EDMOND DE ROTHSCHILD | BRUNO JACQUIER, FRANÇOIS LÉONET, LISA TURK 7/11
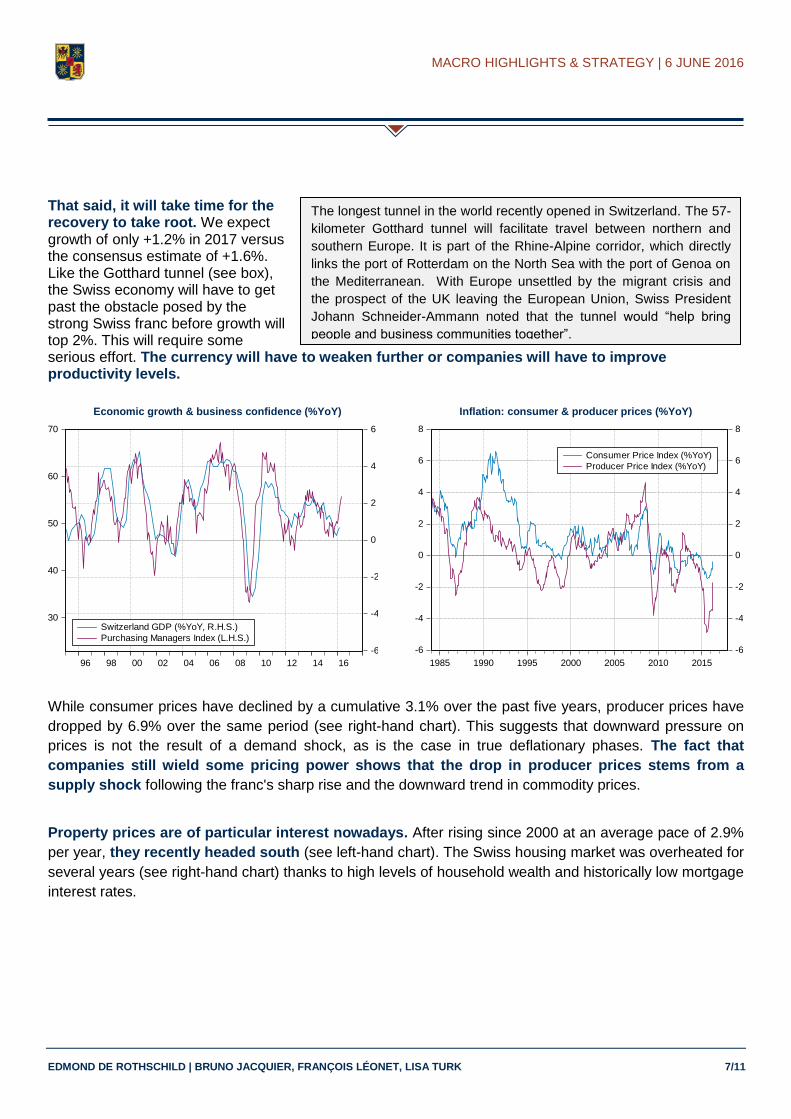
That said, it will take time for the recovery to take root. We expect growth of only +1.2% in 2017 versus the consensus estimate of +1.6%. Like the Gotthard tunnel (see box), the Swiss economy will have to get past the obstacle posed by the strong Swiss franc before growth will top 2%. This will require some serious effort. The currency will have to weaken further or companies will have to improve productivity levels.
Economic growth & business confidence (%YoY) Inflation: consumer & producer prices (%YoY)
30
40
50
60
70
-6
-4
-2
0
2
4
6
96 98 00 02 04 06 08 10 12 14 16
Switzerland GDP (%YoY, R.H.S.)
Purchasing Managers Index (L.H.S.)
-6
-4
-2
0
2
4
6
8
-6
-4
-2
0
2
4
6
8
1985 1990 1995 2000 2005 2010 2015
Consumer Price Index (%YoY)
Producer Price Index (%YoY)
While consumer prices have declined by a cumulative 3.1% over the past five years, producer prices have
dropped by 6.9% over the same period (see right-hand chart). This suggests that downward pressure on
prices is not the result of a demand shock, as is the case in true deflationary phases. The fact that
companies still wield some pricing power shows that the drop in producer prices stems from a
supply shock following the franc's sharp rise and the downward trend in commodity prices.
Property prices are of particular interest nowadays. After rising since 2000 at an average pace of 2.9%
per year, they recently headed south (see left-hand chart). The Swiss housing market was overheated for
several years (see right-hand chart) thanks to high levels of household wealth and historically low mortgage
interest rates.
The longest tunnel in the world recently opened in Switzerland. The 57-
kilometer Gotthard tunnel will facilitate travel between northern and
southern Europe. It is part of the Rhine-Alpine corridor, which directly
links the port of Rotterdam on the North Sea with the port of Genoa on
the Mediterranean. With Europe unsettled by the migrant crisis and
the prospect of the UK leaving the European Union, Swiss President
Johann Schneider-Ammann noted that the tunnel would “help bring
people and business communities together”.

MACRO HIGHLIGHTS & STRATEGY | 6 JUNE 2016
8/11 EDMOND DE ROTHSCHILD | BRUNO JACQUIER, FRANÇOIS LÉONET, LISA TURK
House Prices (Index & %YoY) Real Estate Bubble (Index)
-10
0
10
20
500
400
300
200
75 80 85 90 95 00 05 10 15
House Price Inflation (%YoY, L.H.S.)
House Price Index (R.H.Log.S.)
-2
-1
0
1
2
3
-2
-1
0
1
2
3
1985 1990 1995 2000 2005 2010 2015
UBS Swiss Real Estate Bubble Index
The Swiss National Bank, with the help of the Swiss government, has sought to address this situation in the
past few years. It has, for example, adjusted the required down payment, accelerated amortisation
schedules, and increased the counter-cyclical capital buffer applied to lending banks. Housing prices
have now stopped rising.
This will go a long way towards avoiding a bubble and achieving long-term economic growth. What
is not clear is the extent to which consumer spending in Switzerland will decline as a result.

MACRO HIGHLIGHTS & STRATEGY | 6 JUNE 2016
EDMOND DE ROTHSCHILD | BRUNO JACQUIER, FRANÇOIS LÉONET, LISA TURK 9/11
ECONOMIC FORECASTS
Contributions to global GDP growth
Comments The GDP growth rates shown above are actual for 2015 and projections for 2016 and 2017. Each country’s weighting is based on its GDP in US dollars as calculated by the World Bank. Contributions to global expansion are calculated by multiplying the GDP growth of each country by its weight. The sum of the
contributions works out to 3.2% for 2016, a good estimate of this year’s global GDP growth.
Economic Activity GDP 2015GDP 2016
Economist Estimates
GDP 2017Economist Estimates
Country
Weights
Contribution
2016
United States 2.4% 1.8% 2.3% 23.6% 13.4%
Canada 1.2% 1.5% 2.1% 1.9% 0.9%
Euro Area 1.5% 1.5% 1.6% 14.5% 6.9%
Germany 1.5% 1.6% 1.6% 4.2% 2.1%
France 1.1% 1.4% 1.5% 2.9% 1.3%
United Kingdom 2.2% 1.9% 2.1% 3.5% 2.1%
Switzerland 0.8% 1.2% 1.6% 0.7% 0.3%
Russia -3.7% -1.0% 1.1% 1.6% -0.5%
Japan 0.6% 0.5% 0.5% 5.1% 0.8%
China 6.9% 6.5% 6.3% 18.4% 37.9%
India 7.4% 7.5% 7.6% 3.4% 8.2%
Brazil -3.7% -3.8% 0.8% 1.9% -2.3%
Mexico 2.5% 2.5% 2.8% 1.5% 1.2%
Others 3.8% 5.2% 6.1% 16.7% 27.7%
WORLD 3.1% 3.2% 3.5% 100% 100%
Source : Bloomberg Momentum (vs Last Estimates) Performance (Over \ Under)

MACRO HIGHLIGHTS & STRATEGY | 6 JUNE 2016
10/11 EDMOND DE ROTHSCHILD | BRUNO JACQUIER, FRANÇOIS LÉONET, LISA TURK
RETURNS ON FINANCIAL ASSETS
Major benchmarks and currencies
Markets Performances
(local currencies)
Last
Price1-Week (%) 1-Month (%) Year-to-Date (%) Last Year (%)
Equities
World (MSCI) 404 0.3% 1.4% 2.5% -1.8%
United States (S&P 500) 2'099 0.0% 2.0% 3.7% 1.4%
Euro Area (DJ EuroStoxx) 322 -1.9% 2.4% -4.4% 11.2%
United Kingdom (FTSE 100) 6'277 -0.9% 1.0% 1.6% -1.4%
Switzerland (SMI) 8'168 -1.7% 4.3% -4.5% 1.1%
Japan (NIKKEI) 16'580 -1.1% 3.1% -11.8% 11.0%
Emerging (MSCI) 816 1.1% -0.4% 3.5% -14.6%
Bonds (Bloomberg/EFFAS)
United States (7-10 Yr) 1.72% 1.3% 0.8% 5.6% 2.1%
Euro Area (7-10 Yr) 1.15% 0.4% 1.0% 4.7% 1.0%
Germany (7-10 Yr) 0.08% 0.6% 1.2% 5.7% 0.9%
United Kingdom (7-10 Yr) 1.28% 1.2% 1.8% 5.8% 0.7%
Switzerland (7-10 Yr) -0.40% 0.8% 1.1% 3.2% 3.7%
Japan (7-10 Yr) -0.11% 0.0% 0.0% 3.3% 1.4%
Emerging (5-10 Yr) 4.82% 0.9% 1.0% 7.2% 1.6%
United States (IG Corp.) 3.02% 0.9% 0.5% 6.1% -0.8%
Euro Area (IG Corp.) 0.77% 0.4% 0.5% 3.5% -0.5%
Emerging (IG Corp.) 3.95% 0.6% 0.5% 6.6% -2.3%
United States (HY Corp.) 7.37% 0.2% 0.9% 8.5% -3.5%
Euro Area (HY Corp.) 4.13% 0.3% 0.6% 4.1% 0.3%
Emerging (HY Corp.) 8.50% 0.8% 1.3% 10.0% 3.6%
United States (Convert. Barclays) 44 0.5% 1.6% 2.5% -0.8%
Euro Area (Convert. Exane) 7'246 -0.9% 1.2% -3.4% 7.6%
Real Estate
World (MSCI) 199 1.0% 0.9% 6.1% 1.0%
United States (MSCI) 209 0.6% 1.4% 5.5% 4.6%
Euro Area (MSCI) 222 -0.6% 4.2% 8.5% 16.1%
United Kingdom (FTSE) 6'615 -0.2% -0.9% 0.3% 9.4%
Switzerland (DBRB) 3'781 -0.1% -1.0% 5.2% 4.6%
Japan (MSCI) 254 -1.0% 0.0% -5.1% 0.9%
Emerging (MSCI) 97 1.2% -1.3% -1.2% -6.8%
Hedge Funds (Dow Jones)
Hedge Funds Industry 540 n.a. 0.3% -1.9% -0.7%
Distressed 724 n.a. 1.6% -0.4% -5.3%
Event Driven 575 n.a. 1.7% -2.9% -6.3%
Fixed Income 303 n.a. 1.4% 0.2% 0.6%
Global Macro 867 n.a. 0.3% -2.0% 0.2%
Long/Short 647 n.a. -0.7% -4.5% 3.6%
Managed Futures (CTA's) 320 n.a. -3.0% 1.2% -0.9%
Market Neutral 266 n.a. -0.9% -1.2% 1.7%
Multi-Strategy 520 n.a. 0.4% -0.2% 3.8%
Short Bias 29 n.a. -4.3% -5.2% 2.4%
Commodities
Commodities (CRB) 426 2.4% 3.9% 11.0% -15.2%
Gold (Troy Ounce) 1'244 3.3% -3.9% 17.2% -10.6%
Oil (Brent, Barrel) 50 0.2% 10.1% 37.2% -35.9%
Currencies
USD 94.1 -1.4% 0.3% -4.6% 9.3%
EUR 1.14 1.9% -0.5% 4.5% -10.2%
GBP 1.44 -1.5% -0.1% -2.2% -5.4%
CHF 0.97 2.0% 0.0% 3.0% -0.8%
JPY 107.1 3.8% 0.0% 12.3% -0.4%
Source : Bloomberg Momentum (1-week / 1-month / 3-month) Performance (Negative \ Positive)

MACRO HIGHLIGHTS & STRATEGY | 6 JUNE 2016
EDMOND DE ROTHSCHILD | BRUNO JACQUIER, FRANÇOIS LÉONET, LISA TURK 11/11
EDMOND DE ROTHSCHILD (SUISSE) S.A.
Rue de Hesse 18 – 1204 Geneva - T. +41 58 818 91 91 Avenue Agassiz 2 – 1003 Lausanne - T. +41 21 318 88 88 Rue de Morat 11 – 1700 Fribourg - T. +41 26 347 24 24 Beethovenstrasse 9, 8002 Zurich - T. +41 44 818 81 11
www.edmond-de-rothschild.ch
Disclaimer
This brochure was prepared by Edmond de Rothschild (Suisse) S.A., 18 rue de Hesse, 1204 Geneva, Switzerland. Edmond de
Rothschild (Europe), located at 20 boulevard Emmanuel Servais, 2535 Luxembourg, Grand Duchy of Luxembourg, and subject
to the supervision of the Luxembourg Commission de Surveillance du Secteur Financier (CSSF), and Edmond de Rothschild
(France), a société anonyme (public limited company) governed by an executive board and a supervisory board with capital of
EUR 83,075,820 and with its registered office at 47 rue du Faubourg Saint Honoré, 75008 Paris, subject to the supervision of
the French Autorité de Contrôle Prudentielle et de Résolution (ACPR), limit themselves to making this brochure available to
clients at their offices and branch offices.
The figures, comments, analyses and investment research contained in this brochure reflect the opinion of Edmond de
Rothschild (Suisse) S.A. on market trends, formed on the basis of its own expertise and the economic analyses and the
information in its possession at this time. The figures, comments, analyses and investment research contained in this brochure
may no longer be current or relevant when the investor reads this brochure owing to its date of publication or changes in the
markets.
Each analyst mentioned in this document certifies that the views expressed about the evaluated companies and securities
reflect the analyst's personal opinion. Their remuneration is not tied directly or indirectly to the specific recommendations and
opinions expressed in this document. Details on the rating methodology used by Edmond de Rothschild (Suisse) S.A. are
available free of charge on request.
Neither Edmond de Rothschild (Suisse) S.A., Edmond de Rothschild (Europe) nor Edmond de Rothschild (France) may be held
liable for a decision to buy, sell or hold based on the aforementioned commentaries and analyses under any circumstances.
Furthermore, neither Edmond de Rothschild (Suisse) S.A., Edmond de Rothschild (Europe) nor Edmond de Rothschild
(France) may be held liable for harm incurred by an investor as a result of the contents or availability of this brochure.
This brochure is intended solely to provide general, preliminary information for the investors consulting it and should not be
used as a basis for any decision to buy, sell or hold.
Edmond de Rothschild (Suisse) S.A. recommends that each investor obtain the different regulatory descriptions of each
financial product before any investment in order to analyse the risk and form his or her own independent opinion, with the
assistance of advisers specialising in these matters if necessary, so as to ensure that the investment is appropriate to his or her
financial and tax situation.
Past performance and volatility are not a reliable guide to future performance and volatility, and may vary over time.
This information may not be used or reproduced in whole or in part.
Copyright © EDMOND DE ROTHSCHILD (Suisse) S.A. – All rights reserved.
![[On the R.H.S] - Sharjah Indian School · P20ceDope:- tonnect (6 e O st/fve 6Q//e Te IA OCC eo h Qua/ csîÆve Q ave cud h 220 k' u ey h de d' O /tce Re ce/4 Chock Ad /tte dîuc RQOOCU](https://img.pdfslide.us/doc/110x75/5b9f838109d3f2083f8d454a/on-the-rhs-sharjah-indian-p20cedope-tonnect-6-e-o-stfve-6qe-te-ia.jpg)