Embed Size (px)
Citation preview

l 1 j l
l I
Report Date: 2/22/2019
General Operating Fund
1. Cash
2. Investments
3. AccountsReceivable :
a. Michigan Transportation Fund
b. State Trunkline Maintenance
Macomb
Year Ended - 2018
Start: 10/01/2017 End: 09/30/2018
BALANCE SHEET
Assets
c. State Transportation Department - Other
d. Due on County Road Agreement
e. Due on Special Assessement
f. Sundry Accounts Receivable
Inventories/Pre-Paid Insurance/Other
4. Deferred Expense State Aid
5. Road Materials
6. Equipment Materials and Parts
7. Prepaid Insurance
8. Deferred Expense - Federal Aid
9. Other
10. TOTAL ASSETS
$14,920,635.80
73,606,399.96
9,998,081.57
384,346.44
253,447.54
0.00
0.00
1,945,773.63
0.00
2,323 ,445 .54
710,559.63
1,019,643.77
1,295,787.00
610,059.41
Page 1of23
$107,068,180.29

I ' I j
1
I l
Report Date: 2/22/2019 Macomb
Year Ended - 2018
Start: 10/01/2017 End: 09/30/2018
Liabilities and Fund Balances
Liabilities
11. Accounts Payable
12. Notes Payable (Short Term)
13. Accrued Liability
14. Advances
15. Deferred Revenue - Special Assessment District
16. Deferred Revenue - EDF Forest Rd.(E)
17. Deferred Revenue
18. Other
Fund Balances
19. Primary Road Fund
20. Local Road Fund
21. County Road Commission Fund
22. Total Fund Balances
23. TOTAL LIABIUTIES AND FUND BALANCES
Page 2 of 23
$7,150,731.62
0.00
437,160.28
13,431,457.63
0.00
0.00
1,204,563.20
23,357,905.56
6,819,889.73
51,942,926.75
82,120,722.04
$107,068,180.29

! 1 I
l i
l I
Report Date: 2/22/2019
Assets
Equities
24. Land
25. Land Improvements
25 a.Less: Accumulated Depreciation
26. Depletable Assets
26 a.Less: Accumulated Depreciation
27. Buildings
27 a.Less: Accumulated Depreciation
28. Equipment - Road
28 a.Less: Accumulated Depreciation
29. Equipment - Shop
29 a.Less: Accumulated Depreciation
30. Equipment - Engineers
30 a.Less: Accumulated Depreciation
31. Equipment - Yard and Storage
31 a.Less: Accumulated Depreciation
32. Equipment and Furniture - Office
32 a.Less: Accumulated Depreciation
33. Infrastructure
33 a.Less: Accumulated Depreciation
34. Vehicles
34 a.Less: Accumulated Depreciation
35. Construction Work in Progress
37. Plant and Equipment Equity
Long Term Debt
39. Bonds Payable (Act 51)
40. Notes Payable (Act 143)
41. Vested Vacation and Sick Leave Payable
42. Installment/Lease Purchase Payable
43. Other
Fiduciary Fund
45. Deferred Compensation (Pension) Plan
Macomb
Year Ended - 2018
Start: 10/01/2017 End: 09/30/2018
CAPITAL ASSETS ACCOUNT GROUP
(A)
$1,401,222.54
(1,296,972.25)
0.00
0.00
29,040,269.80
(11,381,442.75)
8,150,487.04
(7,043,904.09)
963,545.91
(585,031.47)
225,123.93
(120,188.99)
1,186,125.42
(686,005.08)
3,931,105.60
(3,697,939.59)
1,327,782,377.00
(785,212,012.00)
27,513,764.25
(20,121,919.37)
36. Total Assets
37 a.Primary
37 b.Local
37 c.Co. Road Comm.
37 d.Infrastructure
38. Total Equities
44. Total Liabilities
(B)
$240,030,786.00
104,250.29
0.00
17,658,827.05
1,106,582.95
378,514.44
104,934.94
500,120.34
233,166.01
542,570,365.00
7,391,844.88
235,282.11
13,716,550.05
11,310,928.16
242,716,830.80
542,570,365.00
0.00
977,498.71
0.00
0.00
0.00
Page 3 of 23
$810,314,674.01
$810,314,674.01
$977,498.71
$0.00

2/22/2019 Macomb Page 4 of 23 Report Date:
Year Ended - 2018
Start: 10/01/2017 End: 09/30/2018
STATEMENT OF REVENUES
Primary Road Local Road Co.Road
Fund Fund Comm.Fund Total
(P) (L) (C) (T)
Taxes
46. County Wide Millage $0.00 $0.00 $0.00 $0.00
47.0ther 0.00 0.00 0.00 0.00
48. Total Taxes 0.00 0.00 0.00 0.00
Licenses and Permits
49. Specify 500,657.05 100,201.95 13,644.90 614,503.90
Federal Sources
50. Surface Tran. Program (STP) 8,440,899.26 0.00 0.00 8,440,899.26
51. C Funds - Federal 0.00 0.00 0.00 0.00
52. D Funds - Federal 0.00 0.00 0.00 0.00
53. Bridge 0.00 0.00 0.00 0.00
54. High Priority 0.00 0.00 4,548.08 4,548.08
55. Other 5,468,159.64 0.00 0.00 5,468,159.64
56. Total Federal Sources 13,909,058.90 0.00 4,548.08 13,913,606.98
STATE SOURCES
Michigan Transportation Fund
57. Engineering 8,251.80 1,748.20 10,000.00 58. Snow Removal 0.00 0.00 0.00 59. Urban Road 4,491,654. 71 2,255,927.81 6,747,582.52 60. Allocation 44,132,317.84 9,349,743.66 53,482,061.50 61. Total MTF 48,632,224.35 11,607,419.67 60,239,644.02
Other
62. Local Bridge 0.00 0.00 0.00 63. Other 10,000.00 5,836,688.62 82,031.86 5,928,720.48 64. Total Other 10,000.00 5,836,688.62 82,031.86 5,928,720.48
Economic Development Fund
65. Target Industries (A) 0.00 0.00 0.00 66. Urban Congestion (C) 0.00 0.00 0.00 67. Rural Primary (D) 0.00 0.00 0.00 68. Forest Road (E) 0.00 0.00 0.00 69. Urban Area (F) 0.00 0.00 0.00 70. Other 19,901.91 0.00 19,901.91 71. Total EDF 19,901.91 0.00 19,901.91
72. Total State Sources $48,662,126.26 $17,444,108.29 $82,031.86 $66,188,266.41

Report Date: 2/22/2019
Contributions From Local Units
73. City and Village 74. Township Contr. 75. Other 76. Total Contributions
Charges for Service
77. Trunkline Maintenance 78. Trunkline Non-maintenance 79. Salvage Sales 80. Other 81. Total Charges
Interest and Rents
82. Interest Earned 83. Property Rentals 84. Total Interest/Rents
Other
85. Special Assessments 86. Land and Bldg. Sales 87. Sundry Refunds 88. Gain (Loss) Equip. Disp. 89. Contributions from Private Sources 90. Other 91. Total Other
Other Financing Sources
92. County Appropriation 93. Bond Proceeds 94. Note Proceeds 95. Inst. Purch./Leases 96. Total Other Fin. Sources
97. TOTAL REVENUE AND OTHER FINANCING SOURCES
Macomb
Year Ended - 2018
Start: 10/01/2017 End: 09/30/2018
STATEMENT OF REVENUES
Primary Road Fund {P)
$2,772,742.72 777,282.74
2,076.72 3,552,102.18
0.00 0.00 0.00 0.00 0.00
234,667.71 0.00
234,667.71
0.00 0.00 0.00
8,383.20 0.00
298,746.16 307,129.36
0.00 0.00 0.00 0.00 0.00
$67,165,741.46
Local Road Fund {L)
$347,668.76 3,676,403.84
18,748.07 4,042,820.67
0.00 0.00 0.00
120,836.35 0.00
120,836.35
0.00 0.00 0.00
6,996.03 0.00
350,170.25 357,166.28
0.00 0.00 0.00 0.00 0.00
$22,065,133.54
Co.Road Comm. Fund
{C)
$0.00 162,839.23
75.32 162,914.55
6,588,523.37 674,675.99
32,135.88 0.00
7,295,335.24
863,356.77 0.00
863,356.77
0.00 0.00 0.00
169,948.28 0.00
1,880,429.67 2,050,377.95
0.00 0.00 0.00 0.00 0.00
$10,472,209.35
Page 5 of 23
Total {T)
$3,120,411.48 4,616,525.81
20,900.11 7,757,837.40
6,588,523.37 674,675.99
32,135.88 0.00
7,295,335.24
1,218,860.83 0.00
1,218,860.83
0.00 0.00 0.00
185,327.51 0.00
2,529,346.08 2,714,673.59
0.00 0.00 0.00 0.00 0.00
$99,703,084.35
I I f
l ~· l
I
I
I f ~
I I

Report Date: 2/22/2019 Macomb Page 6 of 23
Year Ended - 2018
Start: 10/01/2017 End: 09/30/2018
STATEMENT OF EXPENDITURES
Primary Road Local Road Co.Road Fund Fund Comm.Fund Total (P) (L) (C) (T)
Construction/Capacity Improvement
98. Roads $1,698,979.21 $1,852,961.14 $3,551,940.35
99. Structures 0.00 0.00 0.00
100. Roadside Parks 0.00 0.00 0.00
101. Special Assessments 0.00 0.00 0.00
102. Other 0.00 0.00 0.00
103. Total Construction/Cap. Imp. 1,698,979.21 1,852,961.14 3,551,940.35
Preservation - Structural Improvements
104. Roads 26,023,776.89 9,875,944.44 35,899,721.33 105. Structures 1,987,887.96 4,034,216.77 6,022, 104. 73 106. Safety Projects 0.00 0.00 0.00 107. Roadside Parks 0.00 0.00 0.00 108. Special Assessments 7,105.83 79,774.62 86,880.45 109. Other 0.00 0.00 0.00 110. Total Preservation - Struct. Imp. 28,018, 770.68 13,989,935.83 42,008,706.51
Maintenence
111. Roads 8,266,653.20 6,774,482.61 15,041,135.81 112. Structures 0.00 0.00 0.00 113. Roadside Parks 0.00 0.00 0.00 114. Winter Maintenance 4,108,572.86 1,888,425.28 5,996,998.14 115. Traffic Control 5,407,331.82 511,225.96 5,918,557.78 116. Total Maintenance 17 ,782,557.88 9,174,133.85 26,956,691.73 117. Total Construction, Preservation And
47,500,307.77 25,017,030.82 72,517,338.59 Maintenance
Other
118. Trunkline Maintenance 0.00 6,406,871.03 6,406,871.03 119. Trunkline Non-maintenance 0.00 761,696.60 761,696.60 120. Administrative Expense 707,880.06 372,819.84 1,080,699.90 121. Equipment - Net (12,519.63) (9,582.56) (7,565.17) (29,667.36) 122. Capital Outlay - Net 1,795,723.45 1,362,650.71 (2,272,632.25) 885,741.91 123. Debt Principal Payment 0.00 0.00 0.00 0.00 124. Interest Expense 24,917.25 0.00 0.00 24,917.25 125. Drain Assessment 0.00 0.00 0.00 0.00 126. Other 1,311,121.41 478,516.16 987,257.97 2,776,895.54 127. Total Other 3,827,122.54 2,204,404.15 5,875,628.18 11,907,154.87
128. Total Expenditures $51,327,430.31 $27,221,434.97 $5,875,628.18 $84,424,493.46
I 1
t I

Report Date: 2/22/2019
129. Total Revenues And Other Financing Sources
130. Total Expenditures
131. Excess of Revenues Over (Under) Expenditures
132. Optional Transfers 132 a. Primary to Local (50%) 132 b. Local to Primary (15%)
133. Emergency Transfers (Local to Primary)
134. Total Optional Transfers
135. Excess of Revenues and Other Sources Over (Under) Expenditures and Other Uses
136. Beginning Fund
137. Adjustment
138. Beginning Fund
Balance Restated
139. Interfund Transfer(County to Primary and/or Local)
140. Ending Fund Balance
Macomb
Year Ended - 2018
Start: 10/01/2017 End: 09/30/2018
STATEMENT OF CHANGES 'IN FUND BALANCES
Primary Road Fund (P)
$67,165,741.46
51,327,430.31
15,838,311.15
(5,349,545.00)
0.00
0.00
(5,349,545.00)
10,488,766.15
12,869,139.41
0.00
12,869,139.41
0.00
$23,357,905.56
Local Road Fund (L)
$22,065,133.54
27,221,434. 97
(5, 156,301.43)
5,349,545.00
0.00
0.00
5,349,545.00
193,243.57
6,626,646.16
0.00
6,626,646.16
0.00
$6,819,889. 73
Co.Road Comm. Fund
(C)
$10,472,209.35
5,875,628.18
4,596,581.17
4,596,581.17
47,346,345.58
0.00
47,346,345.58
0.00
$51,942,926.75
Page 7 of 23
Total (T)
$99,703,084.35
84,424,493.46
15,278,590.89
0.00 0.00
0.00
0.00
15,278,590.89
66,842,131.15
0.00
66,842,131.15
0.00
$82,120,722.04

Report Date: 2/22/2019
Direct Equipment Expense
141. Labor and Fringe Benefits 142. Depreciation 143. Other
145. Indirect Equipment Expense
Operating Equipment Expense
146. Labor and Fringe Benefits 147. Operating Expenses
Equipment Rental Credits:
150. Construction/Capacity Improvement 151. Preservation - Structural Improvement 152. Maintenance 153. Inventory Operations 154. MOOT 155. Other Reimbursable Charges 156. All Other Charges 157. Total Equipment Rental Credits
158. (Gain) or Loss on Usage of Equipment
159. Equipment Rental Credits
160. Percent of Total 161. Prorated Total Equipment Expense 162. Prorated Gain/Loss On Usage
(Net Equipment Expense)
Macomb
Year Ended - 2018
Start: 10/01/2017 End: 09/30/2018
EQUIPMENT EXPENSE
144. Total Direct
148. Total Operating
$1,548,411.19 2,847,049.20 1,055,814.91
0.00 831,692.64
5,451,275.30
2,081,022.93
$831,692.64
Page 8 of 23
149. TOTAL EQUIPMENT EXPENSE $8,363,990.87
Primary Local
6,101.44 9,781.55 180,916.41 202,785.49
3,355,004.82 2,499,021.88 0.00 0.00 0.00 0.00 0.00
101.10 (437.31) 3,542,123.77 2,711,151.61
(A) (B)
PRORATION OF EQUIPMENT USAGE GAIN OR LOSS
(Net Equipment Expense)
~3,542,123. 77 p2,711,151.61
(A) (B) 42.20 % 32.30 %
3,529,604.14 2,701,569.05 (12,519.63) (9,582.56)
County Total
419,949.88 1,487,399.76
187,526.17 45,507.04
2,140,382.85
(C)
p,140,382.85
(C) 25.50 %
2,132,817.68 (7,565.17)
15,882.99 383,701.90
5,854,026.70 419,949.88
1,487,399.76 187,526.17
45,170.83 8,393,658.23
(D)
(29,667.36)
~8,393,658.23
(D) 100.00 %
8,363,990.87 (29,667.36)
Report Date: 2/22/2019
163. Primary Construction/cap. Imp.
164. Primary Preservation - Struct. Imp.
165. Primary Maintenance
166. Local Construction/Cap. Imp.
167. Local Preservation - Struct. Imp.
168. Local Maintenance
169. Inventory
170. Equipment Expense - Direct
171. Equipment Expense - Indirect
172. Equipment Expense - Operating
173. Administration
174. State Trunkline Maintenance
175. Sundry Account Rec.
176. Capital Outlay
177. Other
178. Total Payroll
179. Less Applicable Payroll
180. Total Applicable Labor Cost
709-714 Vacation Holiday
Sick Leave Longevity
181. Total Fringe Benefits $2,395,037.97
182. Less: Benefits Recovered (321,938.34)
183. Less: Refunds (1,861.87)
184. Benefits to be Distributed 2,071,237.76
185. Applicable Labor Cost 10,941,956.31
186. Factor 0.189293
Macomb
Vear Ended - 2018
Start: 10/01/2017 End: 09/30/2018
DISTRIBUTIVE EXPENSE - FRINGE BENEFITS
719
Total Labor Charge
$98,183.01
1,172,540.93
2,424,740.32
48,029.12
798,040.37
1,429,097.36
0.00
628,124.85
230,081.85
0.00 878,582.19
1,162,461.27
576,982.71
1,118.54
5,632,776.06
$15,080,758.58
0.00
$15,080,758.58
Workers 715- 718 Comp. Soc. Sec.
Insurance Retirement
$311,137.25 $6,275,344.60 (41,822.71) (843,524.84)
0.00 0.00
269,314.54 5,431,819.76
10,941,956.31 10,941,956.31
0.024613 0.496421
716 Health
Insurance
$9,529,891.81
(1,280,997.46)
(116,464.60)
8,132,429.75
10,941,956.31
0.743234
Page 9 of 23
Distributive Cale.
$143,853.57
1,717,929.51
3,552,569.77
70,369.11
1,169,236.07
2,093,819.00
0.00
920,286.34
337,100.74
0.00
1,287,240.65
0.00
4,739,029.18
Total Distributive $16,031,433.94
717 Life and
Disability 720 - 725 Distributive Insurance Other Total Cale.
$82,542.14 $64,801.49 $18,658,755.26 (11,095.23) (8,710.54) (2,508,089.12)
(882.77) (22.96) (119,232.20; 70,564.14 56,067.99 16,031,433.94
10,941,956.31 10,941,956.31
0.006449 0.005124 1.465134
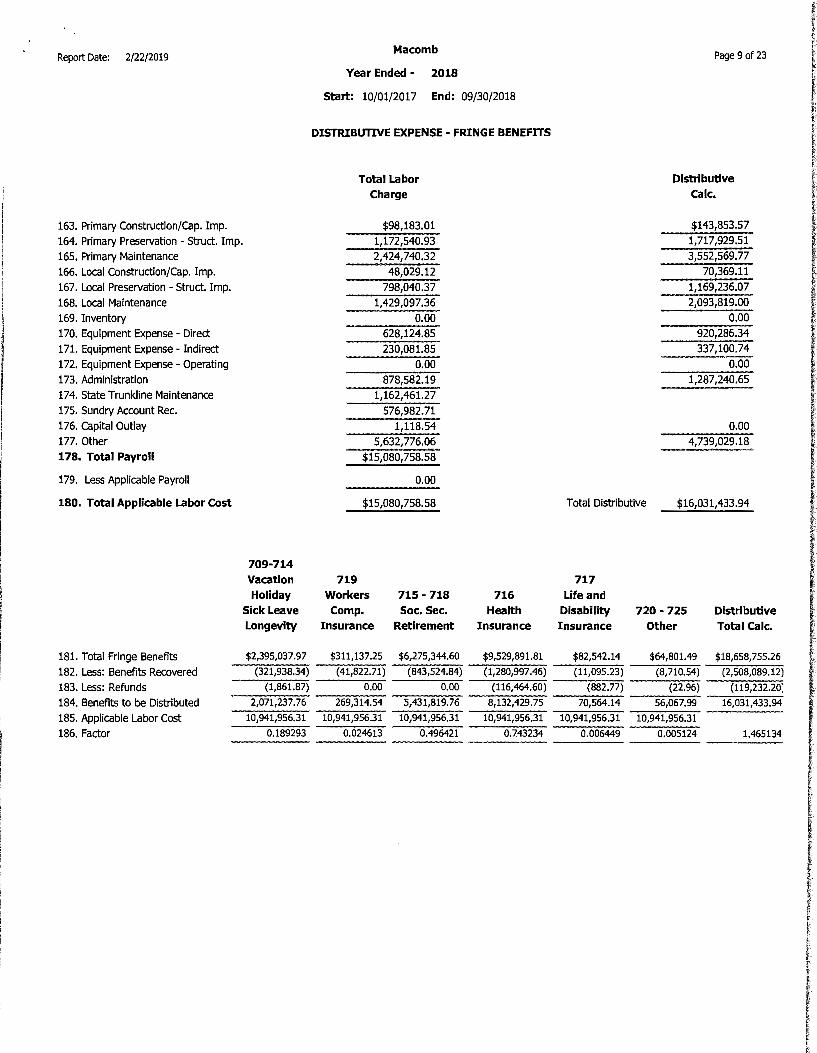
Report Date: 2/22/2019
187. Primary Construction/cap. Imp. 188. Primary Preservation - Struct Imp. 189. Primary Maintenance 190. Local Construction/Cap. Imp. 191. Local Preservation - Struct. Imp. 192. Local Maintenance 193. Other
194. TOTAL
790 Small
Road Tools
195. Expenses Distributed 68,480.78 196. Applicable Operation Cost 74,496,205.21 197. Factor 0.000919
Macomb
Year Ended - 2018
Start: 10/01/2017 End: 09/30/2018
DISTRIBUTIVE EXPENSE - OVERHEAD Account No. 705 - 957
Cost of Operations
$1,698,979.21 28,018,770.68 17,782,557.88
1,852,961.14 13,989,935.83
9,174,133.85 1,978,866.62
$74,496,205.21
791 Inventory
Adjustment
(101,652.40) 74,496,205.21
(0.001365)
882 Liability
0.00 74,496,205.21
0.000000
716 Health
Insurance
0.00 74,496,205.21
0.000000
Other
Page 10 of 23
Distributed Total
$104,856.80 2,904,840.55 1,761,753.78
186,363.91 1,410,434.20
921,946.79 199,859.58
$7,490,055.61
Total
7,523,227 .23 $7,490,055.61 74,496,205.21
0.100988 $0.100542

Report Date: 2/22/2019 Macomb Page 11of23
Year Ended - 2018
Start: 10/01/2017 End: 09/30/2018
ANALYSIS OF CONSTRUCTION AND MAINTENANCE
Optional for noncontract counties I . Performed by County Performed by Contractor Totals
Primary Local Primary Local Primary Local
198. Constr/Cap. Imp. $1,141,450.82 $315,059.54 $557,528.39 $1,537,901.60 $1,698,979.21 $1,852,961.14
199. Preser - Struct. Imp. 6,276,793.57 5,025,513.16 21,734,871.28 8,884,648.05 28,011,664.85 13,910,161.21
200. Special Assessment 714.68 8,023.44 6,391.15 71,751.18 7,105.83 79,774.62
201. Maintenance 14,042,155.85 8,399,153.07 3,740,402.03 774,980.78 17,782,557.88 9,174,133.85
202. Total $21,461,114.92 $13,747,749.21 $26,039,192.85 $11,269,281.61 $47,500,307.77 $25,017,030.82
I l ~
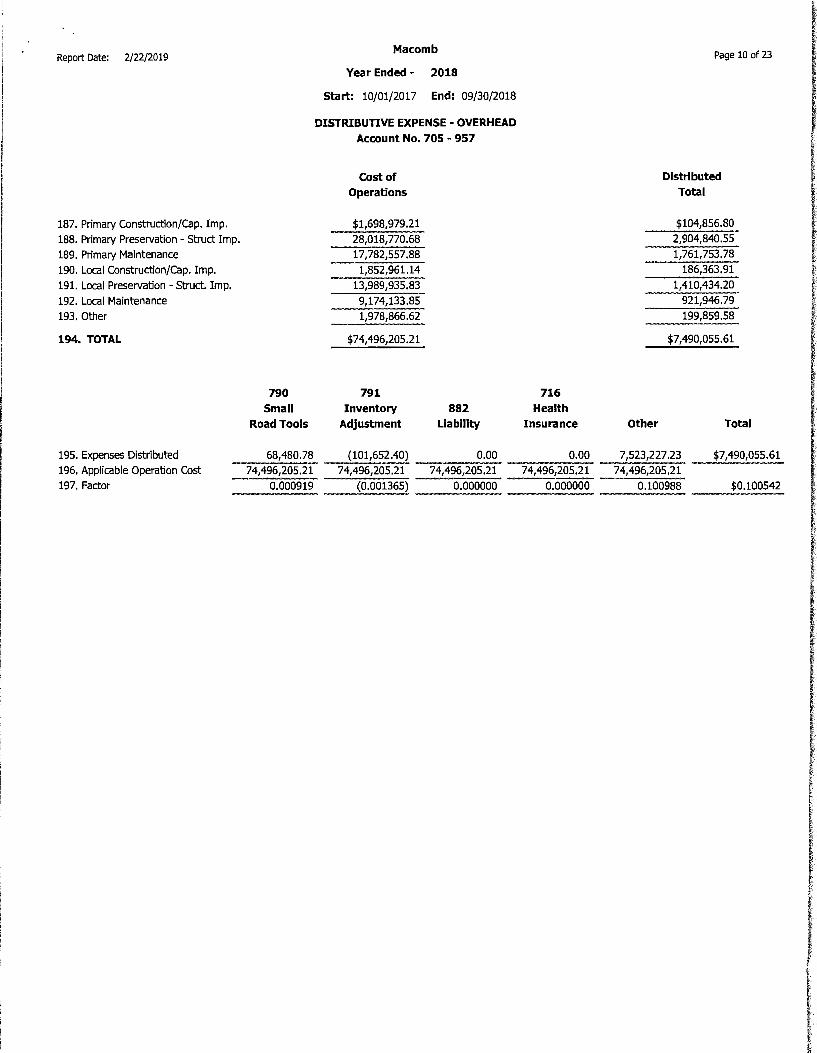
Report Date: 2/22/2019
203, Labor
204. Fringe Benefits 205. Equipment Rental 206. Materials 207. Handling Charges
208. Overhead 209. Other 210. Total Charges for Current Year
211. Beginning Balance
212. Sub-Total 213. Less Credits
214. Ending Balance
Macomb
Year Ended - 2018
Start: 10/01/2017 End: 09/30/2018
ANALYSIS OF ACCOUNTS RECEIVABLE
Optional for noncontract counties
Trunkline
Maintenance
$1,001,137.79 1,439,916.00
1,309,133.62 1,667 ,663.45
0.00 1,216,162.41
0.00 $6,634,013.27
289,028.23
6,923,041.50 (6,538,695.06)
$384,346.44
MOOT Other
$161,323.48 232,237.66 178,266.14
45,471.09
0.00 144,398.23
0.00 $761,696.60
505,106.07
1,266,802.67 (1,013,355.13)
$253,447.54
Page 12 of 23

Report Date: 2/22/2019
215. Land and Improvements (971 - 974)
216. Buildings (975) 217. Equipment Road (976, 981) 218. Equipment Shop (977)
219. Equipment Engineers (978) 220. Equipment - Yard and Storage (979) 221. Equipment Office (980) 222. Depletable Assets (987)
223. Total Capital Outlay:
224. Total Capital Outlay: 225. Less: Equipment Retirements 689
226. Sub-total
227. Less: Depreciation and Depletion 968 228. Net Capital Outlay Expenditure
229. Beginning Capital Asset Balance Prior Year's Report (Pg. 3)
230. Percentage of Total
231. Gain or (loss) on disposal of assets 693
Macomb
Year Ended - 2018
Start: 10/01/2017 End: 09/30/2018
SCHEDULE OF CAPITAL OUTLAY
$0.00 230,472.11
4,190,871.35 148,818.00
10,988.00 0.00
78,665.50
0.00 $4,659,814.96
Primary
1,966,441.91 (650.46)
1,965,791.45 (170,068.00)
$1,795,723.45
Local
1,505,120.23 (542.82)
1,504,577.41 (141,926. 70)
$1,362,650.71
County
1,188,252.82 (13,186.37)
1,175,066.45 (3,447,698.70)
$(2,272,632.25)
Page 13 of 23
Total
4,659,814.96 (14,379.65)
4,645,435.31
(3,759,693.40)
$885,741.91
DISTRIBUTION OF GAIN OR LOSS ON DISPOSAL OF ASSETS
Primary
11,920,826.60 4.52 %
8,383.20
Local
9,948,277.45 3.77 %
6,996.03
County
241,664,619.05 91.70 %
169,948.28
Total
263,533,723.10 100.00 %
185,327.51
I

Report Date: 2/22/2019 Macomb
Year Ended - 2018
Start: 10/01/2017 End: 09/30/2018
PRESERVATION EXPENDITURES - 900/o OF MTF RETURNS
(For Compliance with Section 12(16) of Act 51)
232. Michigan Transportation Fund (MTF) Returns
DEDUCTIONS
233. Administrative Expense (from Page 6 Expenditures)
234. Total capital Outlay (from Page 13)
235. Debt Principal Payment (from Page 6 Expenditures)
236. Interest Expense (from Page 6 Expenditures)
236 a. Total Deductions 236 b. Adjusted MTF Returns
237. Preser - Struct Imp (from Page 6 Expenditures)
238. Routine Maintenance (from Page 6 Expenditures)
239. Less Federal Aid for Preser - Struct Imp
240. TOTAL RD EXPENSE (Excluding Fed Aid)
241. 90% of Adjusted MTF Returns
Primary Road Fund
$28,018, 770.68
17,782,557.88
(2,598, 775.37)
43,202,553.19
Local
Road Fund
$13,989,935.83
9,174,133.85
0.00
23,164,069.68
Page 14 of 23
Total
$60,239,644.02
1,080,699.90
4,659,814.96
0.00
24,917.25
5,765,432.11 54,474,211.91
42,008,706.51
26,956,691.73
(2,598,775.37)
66,366,622.87
49,026, 790. 72

Report Date: 2/22/2019
Fiscal Year
Expenditures ($)
Fiscal Year
Expenditures ($)
2009
2,061,970.27
2014
367,364.91
Macomb
Year Ended • 2018
Start: 10/01/2017 End: 09/30/2018
TEN YEARS OF QUAUFIED EXPENDITURES FOR NON MOTORIZED IMPROVEMENTS (for Compliance with Section lOK of Act 51)
2010 2011 2012
775,461.81 3,027,530.94 2,787,434.26
2015 2016 2017
2,991,565.88 1,856,876.47 1,280,690.60
242. TOTAL
2013
927,077.53
2018
24,774.72
$16,100,747.39
Total must equal or exceed 1 % of your Fiscal Year MTF returns multiplied by 10
0,239,644.02 x .10 = 5,023,964.40
Page 15 of 23

I \ I i
Report Date: 2/22/2019
Account Number
707 712-724
721 728 731 733 734 736 737 791 801 805 806 807 810
850-859 861 862 875 876 878 883
921-923 931 932 933 934 941
944-947 956 968 968 968 968 707
Macomb
Year Ended - 2018
Start: 10/01/2017 End: 09/30/2018
INDIRECT EQUIPMENT AND STORAGE EXPENSE Activity 511
Account Name
Wages - Shop and Garage Fringe Benefits - Shop Employees Drug Testing Office Supplies - Shop Janitor Supplies - Shop Welding Supplies Safety Supplies - Shop nre Shop Supplies Shop Supplies Equipment Material/Parts Inventory Adjustment Contractual Services - Shop Health Services Laundry Services Data Processing - Shop Education Expense - Shop Communications - Shop Travel and Mileage - Shop Employees Freight Costs Insurance - Shop Buildings Insurance - Boiler and Machine Insurance - Fleet Insurance - Underground Tank Utilities - Shop and Storage Buildings Buildings Repairs and Maintenance Yard and Storage Repairs and Maintenance Shop Equipment Repairs and Maintenance Office Equipment Repairs and Maintenance Equipment Rental - Shop Pickup/Wrecker Underground Storage Tank Expense Safety Expense - Shop Depreciation - Shop Building Depreciation - Storage Building Depreciation - Shop Equipment Depreciation - Stockroom Expense Other:
243. TOTAL
Page 16 of 23
Amount Recorded
$230,081.85 337,100.74
0.00 1,353.68
0.00 0.00
8,537.48
I 0.00 100,126.28
0.00 0.00 0.00
6,822.22 3,518.39
352.06 50,775.32
0.00 0.00
8,489.48 0.00
384,352.56 9,668.58
279,254.43 89,835.19 3,609.70 7,920.11 2,200.00
10,819.44 400.00
0.00 352,635.81 45,827.60 51,286.16 34,671.70 61,384.15
$2,081,022. 93

Report Date: 2/22/2019
Account Number
703-708 709-714
724 727 728
730 801 803 804 807 810
850-853 861 862 873 874 875 876 877 880 881 882
920-923 931 934 942
955-956 966-967
968 968 968
Macomb
Year Ended - 2018
Start: 10/01/2017 End: 09/30/2018
ADMINISTRATIVE EXPENSE SCHEDULE AND ALLOCATION (for Compliance with Section 14(4) of Act 51)
Account Name
Salaries and Wages Administrative Leave Fringe Benefits Postage Office Supplies Dues and Subscriptions Contractual Services Legal Services Auditing and Accounting Services Data Processing Education Communications Travel and Mileage Freight Public Relations Advertising Insurance - Building and Contents Insurance - Boiler and Machinery Insurance - Bonds Insurance - Umbrella Insurance - Errors and Omissions Insurance - General Liability Utilities Building Repair/Maintenance Office Equipment Repair/Maintenance Building Rental Miscellaneous Overhead Depreciation - Buildings Depreciation - Engineering Equipment Depreciation - Office Equipment and Furniture Other:
244.TOTAL
Less: Credits to Administrative Expense
646 629 691
Handling Charges on Materials Sold Overhead - State Trunkline Maintenance Purchase Discounts other:
Total Credits to Administrative Expense
245. Net Administrative Expense
Page 17 of 23
Amount Recorded
$878,582.19 0.00
1,287,240.65 7,054.34
14,458.63 35,461.15 18,000.00
0.00 20,000.00
138,896.48 9,662.50
60,478.99 1,687.85
0.00 0.00 0.00 0.00 0.00
5,550.96 0.00
12,668.00 0.00
144,575.16 44,056.36
875.14 0.00
1,677.09 0.00
126,896.36 442.27
82,749.83 7,071.63
$2,898,085.58
(66,635.51) (1,749,141.48)
0.00 (1,608.69)
$(1,817,385.68)
$1,080,699.90
r
I

Report Date: 2/22/2019 Macomb Page 18 of 23
Year Ended - 2018
Start: 10/01/2017 End: 09/30/2018
Forest Road Report
This information is required by Act 231, P.A. of 1987, as amended.
Road Name Location Amount Spent($) Project Type
246. Total
Report Date: 2/22/2019 Macomb
Year Ended - 2018
Start: 10/01/2017 End: 09/30/2018
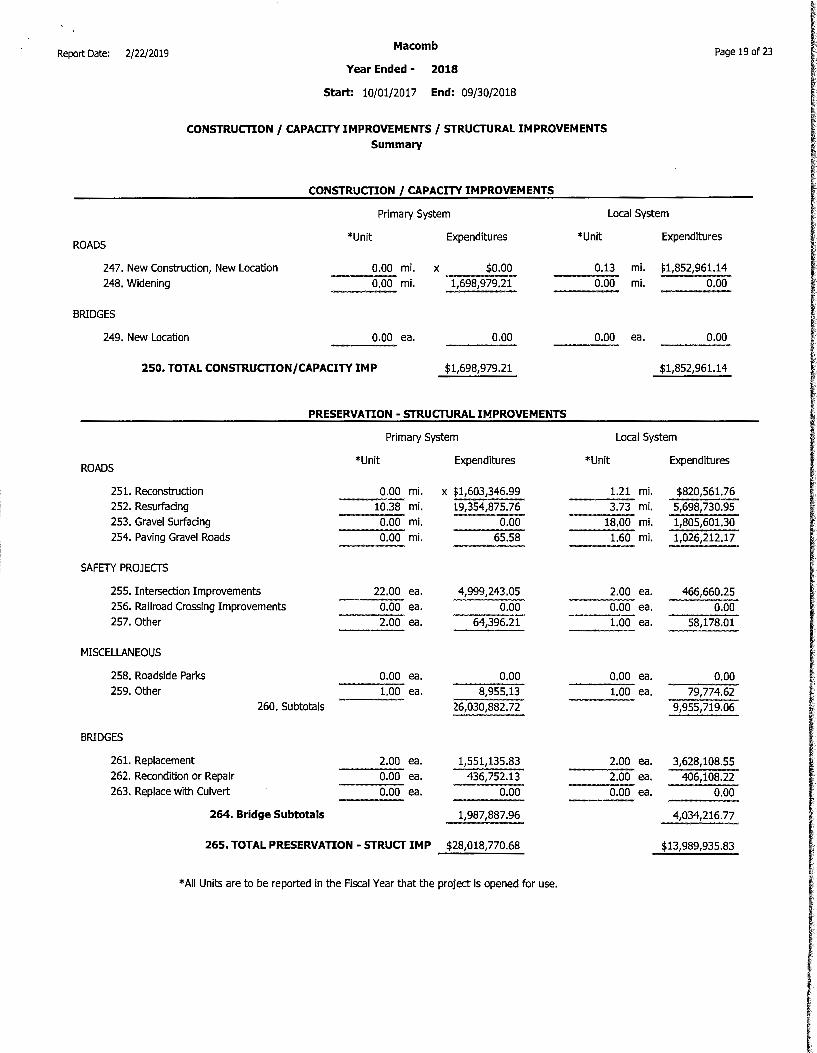
CONSTRUCTION / CAPACITY IMPROVEMENTS / STRUCTURAL IMPROVEMENTS Summary
CONSTRUCTION / CAPACITY IMPROVEMENTS
Page 19 of 23
Primary System Local System
ROADS *Unit
247. New Construction, New Location 248. Widening
BRIDGES
249. New Location
0.00 mi. 0.00 mi.
0.00 ea.
Expenditures
x $0.00 1,698,979.21
0.00
*Unit
0.13 mi. 0.00 mi.
0.00 ea.
Expenditures
~1,852,961.14
0.00
0.00 ----250. TOTAL CONSTRUCTION/CAPACITY IMP $1,698,979.21 $1,852,961.14
PRESERVATION - STRUCTURAL IMPROVEMENTS
Primary System Local System
ROADS *Unit Expenditures *Unit Expenditures
251. Reconstruction 0.00 mi. x ~1,603,346.99 1.21 mi. $820,561.76 252. Resurfacing 10.38 mi. 19,354,875.76 3.73 mi. 5,698,730.95 253. Gravel Surfacing 0.00 mi. 0.00 18.00 mi. 1,805,601.30 254. Paving Gravel Roads 0.00 mi. 65.58 1.60 mi. 1,026,212.17
SAFETY PROJECTS
255. Intersection Improvements 22.00 ea. 4,999,243.05 2.00 ea. 466,660.25 256. Railroad Crossing Improvements 0.00 ea. 0.00 0.00 ea. 0.00 257. Other 2.00 ea. 64,396.21 1.00 ea. 58,178.01
MISCELLANEOUS
258. Roadside Parks 0.00 ea. 0.00 0.00 ea. 0.00 259. Other 1.00 ea. 8,955.13 1.00 ea. 79,774.62
260. Subtotals 26,030,882. 72 9,955,719.06
BRIDGES
261. Replacement 2.00 ea. 1,551,135.83 2.00 ea. 3,628,108.55 262. Recondition or Repair 0.00 ea. 436,752.13 2.00 ea. 406,108.22 263. Replace with Culvert 0.00 ea. 0.00 0.00 ea. 0.00
264. Bridge Subtotals 1,987,887.96 4,034,216.77
265. TOTAL PRESERVATION - STRUCT IMP $28,018,770.68 $13,989,935.83
*All Units are to be reported in the Fiscal Year that the project is opened for use.
I

Report Date: 2/22/2019 Macomb Page 20 of 23 I Year Ended - 2018
Start: 10/01/2017 End: 09/30/2018
SCHEDULE OF TOWNSHIP MILEAGE AND POPULATION
Local Roads Primary Roads
Miles Outside Miles Outside Municipalities Municipalities
Total Local Funds Total Primary Funds Population Funds Local Urban Received Primary Urban Received Outside Received
Township (mi) (mi) ($) (mi) (mi) ($) Municipalities ($) Armada 48.63 3.64 124,764.55 28.19 2.48 92,980.30 5,379 92,088.48
Bruce 60.29 35.28 219,044.37 22.42 13.82 222,671.94 8,700 148,944.00
Chesterfield 131.46 131.46 591,701.49 22.03 22.03 324,876.42 43,381 742,682.72
Clinton 218.04 218.04 981,398.01 56.22 56.22 829,076.36 96,796 1,657,147.52
Harrison 67.86 67.86 305,437.86 21.90 21.90 322,959.29 24,587 420,929.44
Lenox 55.56 14.03 163,194.80 19.03 8.61 149,833.15 10,470 179,246.40
Macomb 256.82 256.82 1,155,946.85 33.37 33.37 492,107.37 79,580 1,362,409.60
Ray 49.52 9.98 140,171.84 24.85 9.55 174,402.05 3,739 64,011.68
Richmond 66.44 9.12 179,133.01 19.03 3.57 86,566.03 3,665 62,744.80
Shelby 232.27 232.27 1,045,447.29 45.66 45.66 673,348.02 73,804 1,263,524.48
Washington 99.16 99.16 446,319.18 37.20 37.20 548,588.41 25,139 430,379.68
266. Totals 1,286.05 1,077.66 $5,352,559.25 329.90 254.41 $3,917,409.34 375,240 $6,424,108.80
Local Road Rate Per Mile 2409 Primary Road Rate Per Mile 2194
Local Urban Road Rate Per Mile 2092 Primary Urban Road Rate Per Mile 12553
Population Rate Per Capita 17.12

Report Date: 2/22/2019 Macomb
Year Ended - - 2018
Start: 10/01/2017 End: 09/30/2018
SCHEDULE OF TOWNSHIP EXPENDITURES AND CONTRIBUTIONS Expenditures
Construction/ Preservation -Capacity Struct
Township Improvement{$) Improvement{$) Total($)
Armada 0.00 665,306.30 665,306.30
Bruce 1,852,961.14 604,945.41 2,457,906.55
Chesterfield 0.00 789,740.76 789,740.76
Clinton 212.85 4,840,577.46 4,840,790.31
Harrison 0.00 487,409.13 487,409.13
Lenox 0.00 733,524.95 733,524.95
Macomb 1,106,011.49 3,928,514.52 5,034,526.01
Ray 0.00 4,937,208.31 4,937,208.31
Richmond 0.00 495,595.68 495,595.68
Shelby 6,345.78 2,573,326.73 2,579,672.51
Washington 0.00 2,928,044.75 2,928,044.75
267. Totals $2,965,531.26 $22,984,194.00 $25,949,725.26
*The Township Contributions Totals and the Funds expended for Construction and Preservation amount may not balance. The Township Contributions list all funds contributed by each township and will balance back to the amount reported on the Statement of Revenues, Line 74, Township Contributions.
The total funds expended are for Construction and Preservation only. They do not contain funds expended for Routine Preventative Maintenance.
I Page 21of23
l i I ~ ·-
I Township
Contributions* ($)
23,655.00
210,789.01
38,361.13
1,284,303.88
4,775.74
22,005.00
2,097,129.43
23,655.00
22,875.00
278,084.38
610,892.24
$4,616,525.81

Report Date: 2/22/2019
Work Type: Crush & Shape & Resurf
Project ID/Name
Santa Ana Street and Santa Barbara Street
Macomb
Year Ended - 2018
Start: 10/01/2017 End: 09/30/2018
ASSET MANAGEMENT Projects Completed During the County Fiscal Year
Total Project Cost Date Open to Traffic
1,469,689.00 06/29/2018
Work Type: Hot Mixed Asphalt Resurfacing (One Course)
Project ID/Name
North Avenue from 32 Mile Road to southern boundary of Village of Armada New Haven Road from North Avenue to 28 Mile excluding culvert
Total Project Cost
226,051.00
676,289.00
Work Type: Mill/Repair Subbase/HMA Overlay
Project ID/Name
26 Mile Road from HCMA Bridge to Dickens St
Work Type: New Construction
Project ID/Name
0000112017
Work Type: Overband Crack Fill
Project ID/Name
12 Mile Road from Mound to Ryan 14 Mile Road from Mound to Ryan 12 Mile Road from Mound to Van D ke M53
Total Project Cost
313,246.00
Total Project Cost
1, 700,000.00
Total Project Cost
24,952.00
24,952.00
24,952.00
Date Open to Traffic
08/17/2018
07/20/2018
Date Open to Traffic
08/31/2018
Date Open to Traffic
10/27/2017
Date Open to Traffic
07/27/2018
07/27/2018
08/08/2018
Page 22 of 23
Pavement Type
Asphalt
Pavement Type
Asphalt
Asphalt
Pavement Type
Asphalt
Pavement Type
Concrete
Pavement Type
Asphalt
Composite
Composite

Report Date: 2/22/2019
Dalcoma Drive between M59 south to 19 Mile Raad 19 Mile Road from Hayes to Romeo Plank Utica Road from 14 Mile Road north to 15 Mile Road 10 Mile Road from Hayes Road to Groesbeck Hwy M97
Macomb
Year Ended - 2018
Start: 10/01/2017 End:
9,360.00
10,000.00
31,390.00
14,600.00
Page 23 of 23
09/30/2018
08/15/2018 Asphalt
08/21/2018 Composite
06/27/2018 Composite
09/20/2018 Composite
' '
[