Embed Size (px)
Citation preview
ECMWF-ESA Workshop on Machine Learning for Earth System Observation and Prediction October 6, 2020
NCAR is sponsored by the National Science Foundation under CA # 1852977.
Machine Learning for
Applied Weather Prediction
Sue Ellen Haupt
National Center for Atmospheric Research
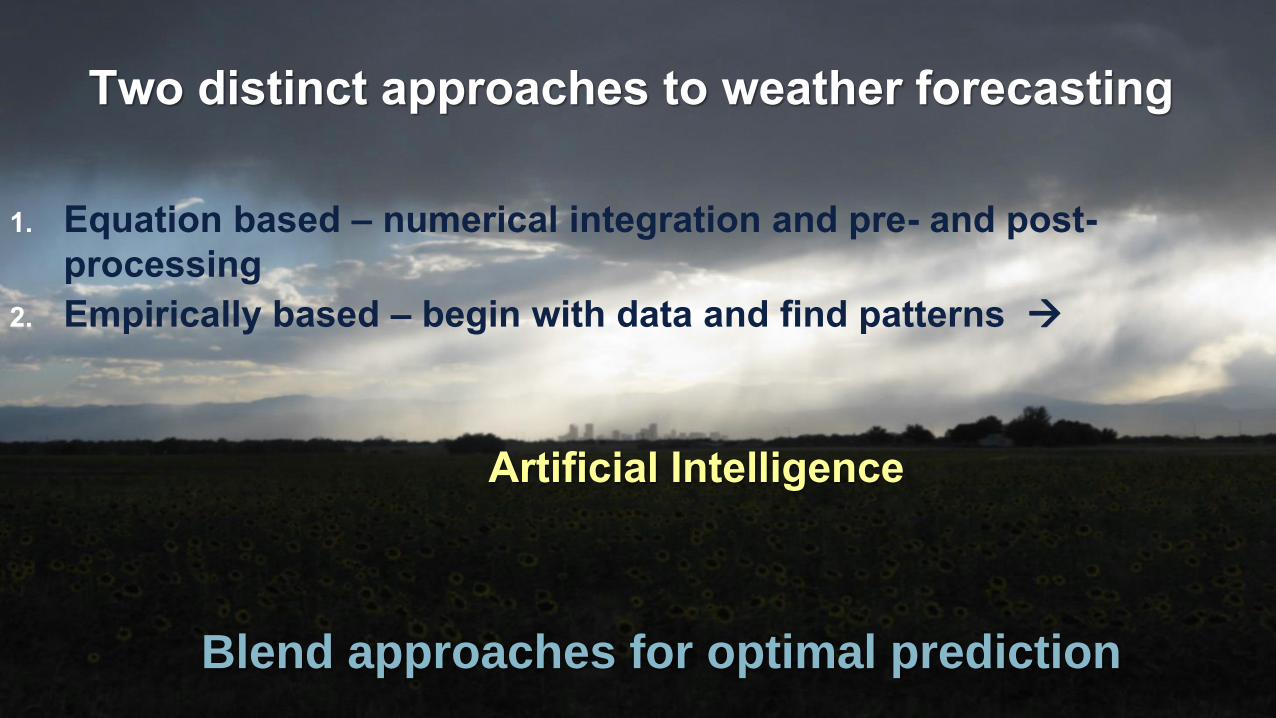
Two distinct approaches to weather forecasting
1. Equation based – numerical integration and pre- and post-
processing
2. Empirically based – begin with data and find patterns →
Artificial Intelligence
Blend approaches for optimal prediction
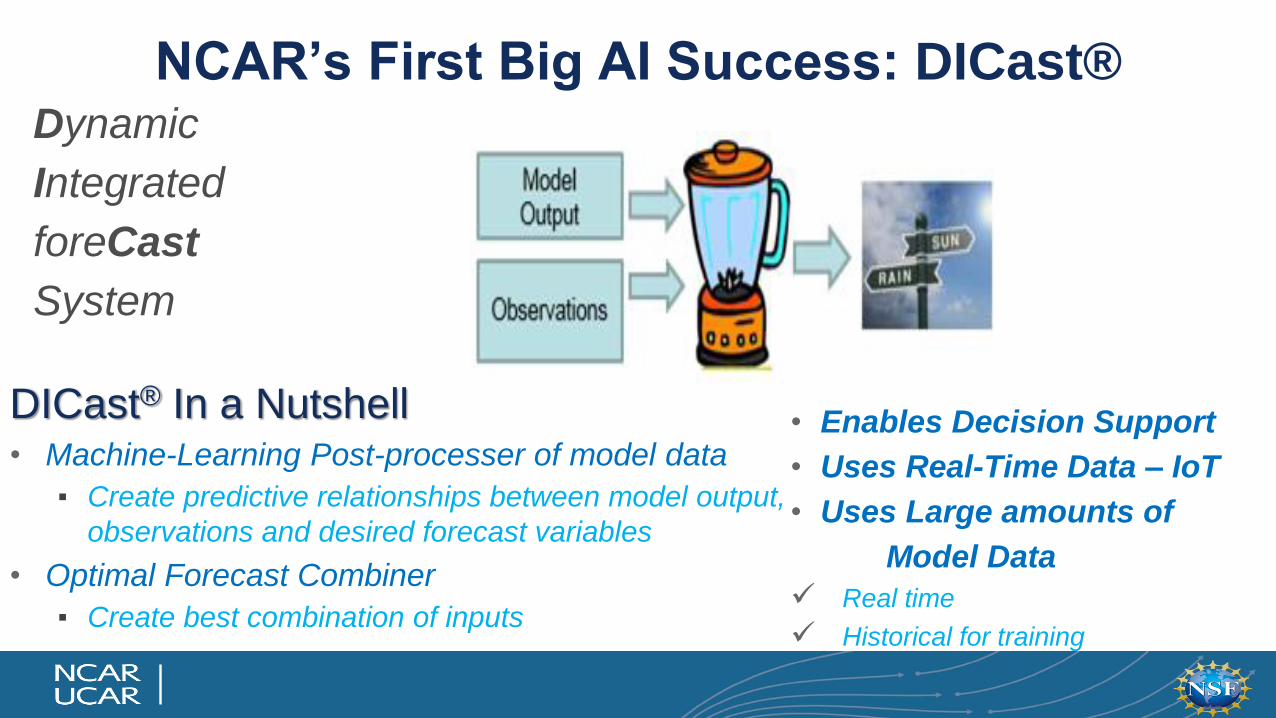
NCAR’s First Big AI Success: DICast®Dynamic
Integrated
foreCast
System
DICast® In a Nutshell• Machine-Learning Post-processer of model data
▪ Create predictive relationships between model output,
observations and desired forecast variables
• Optimal Forecast Combiner
▪ Create best combination of inputs
• Enables Decision Support
• Uses Real-Time Data – IoT
• Uses Large amounts of
Model Data
✓ Real time
✓ Historical for training
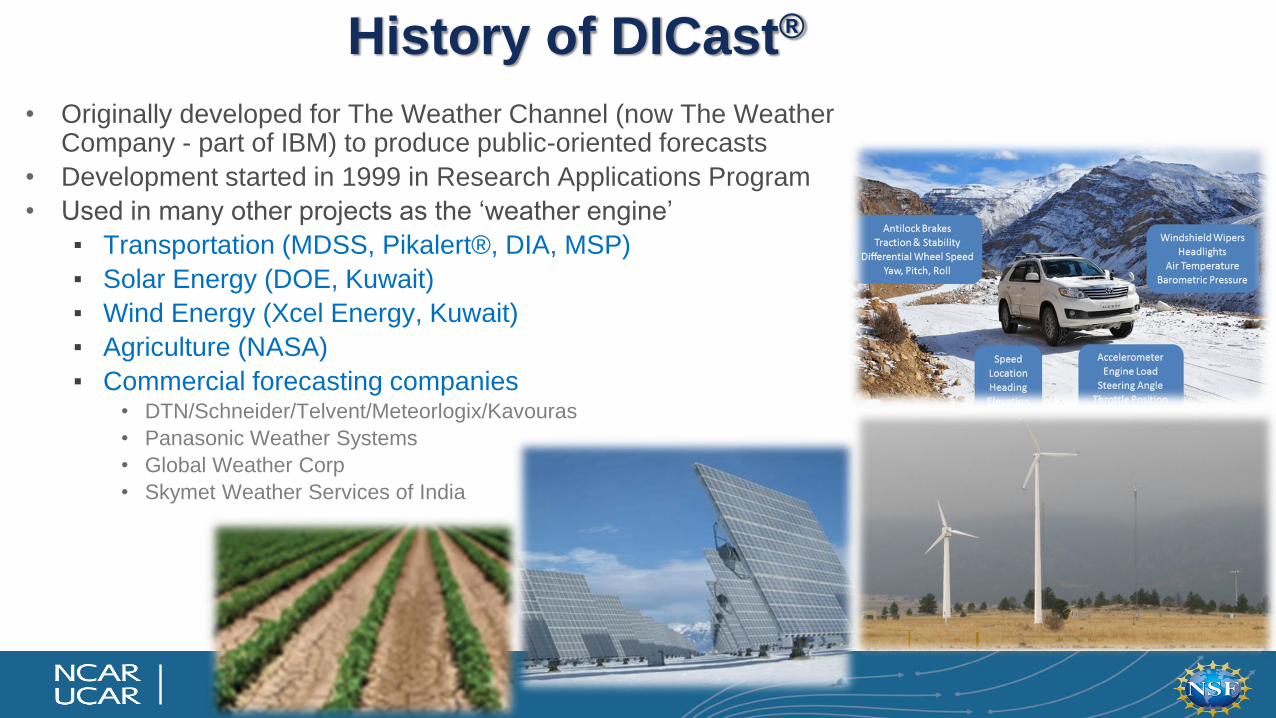
• Originally developed for The Weather Channel (now The Weather Company - part of IBM) to produce public-oriented forecasts
• Development started in 1999 in Research Applications Program
• Used in many other projects as the ‘weather engine’
▪ Transportation (MDSS, Pikalert®, DIA, MSP)
▪ Solar Energy (DOE, Kuwait)
▪ Wind Energy (Xcel Energy, Kuwait)
▪ Agriculture (NASA)
▪ Commercial forecasting companies• DTN/Schneider/Telvent/Meteorlogix/Kavouras
• Panasonic Weather Systems
• Global Weather Corp
• Skymet Weather Services of India
History of DICast®
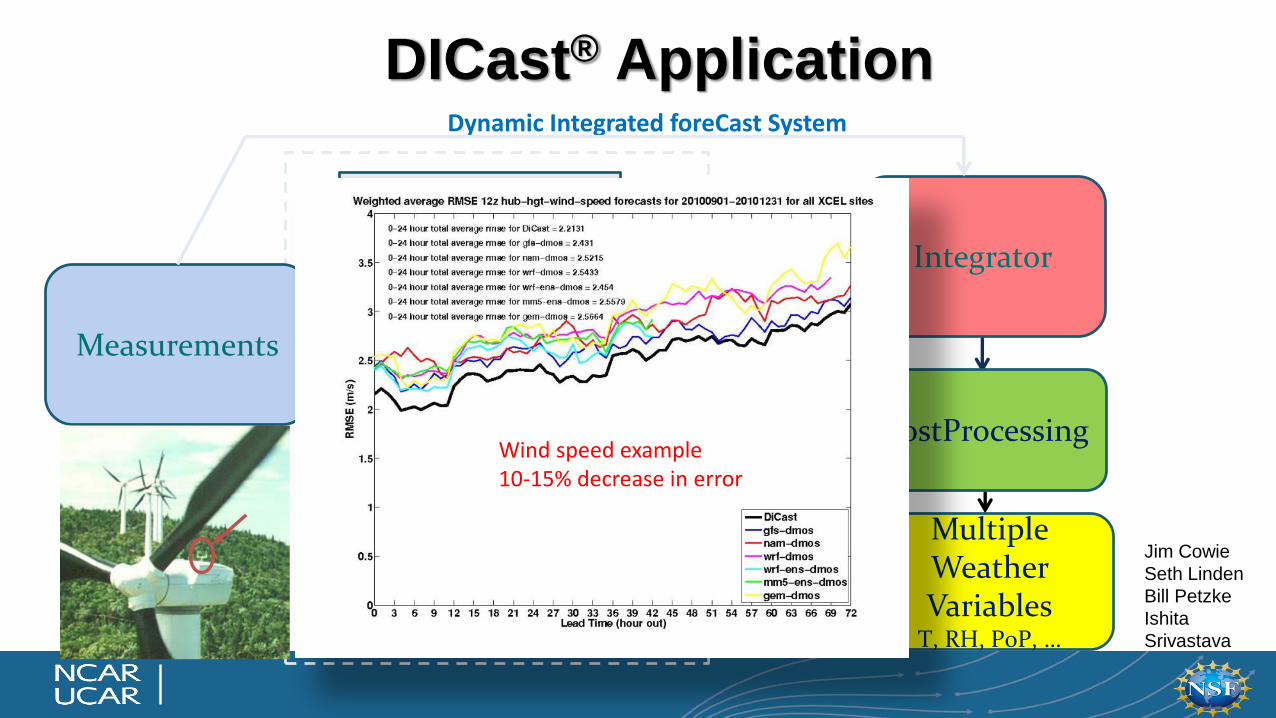
Dynamic Integrated foreCast System
GFS
Machine Learning Models
Customized WRF
HRRR
ECMWF
GEM
.
.
.
Integrator
PostProcessing
Measurements
Other Model Input
DICast® Application
Jim Cowie
Seth Linden
Bill Petzke
Ishita
Srivastava
Multiple Weather Variables
T, RH, PoP, …
Wind speed example10-15% decrease in error
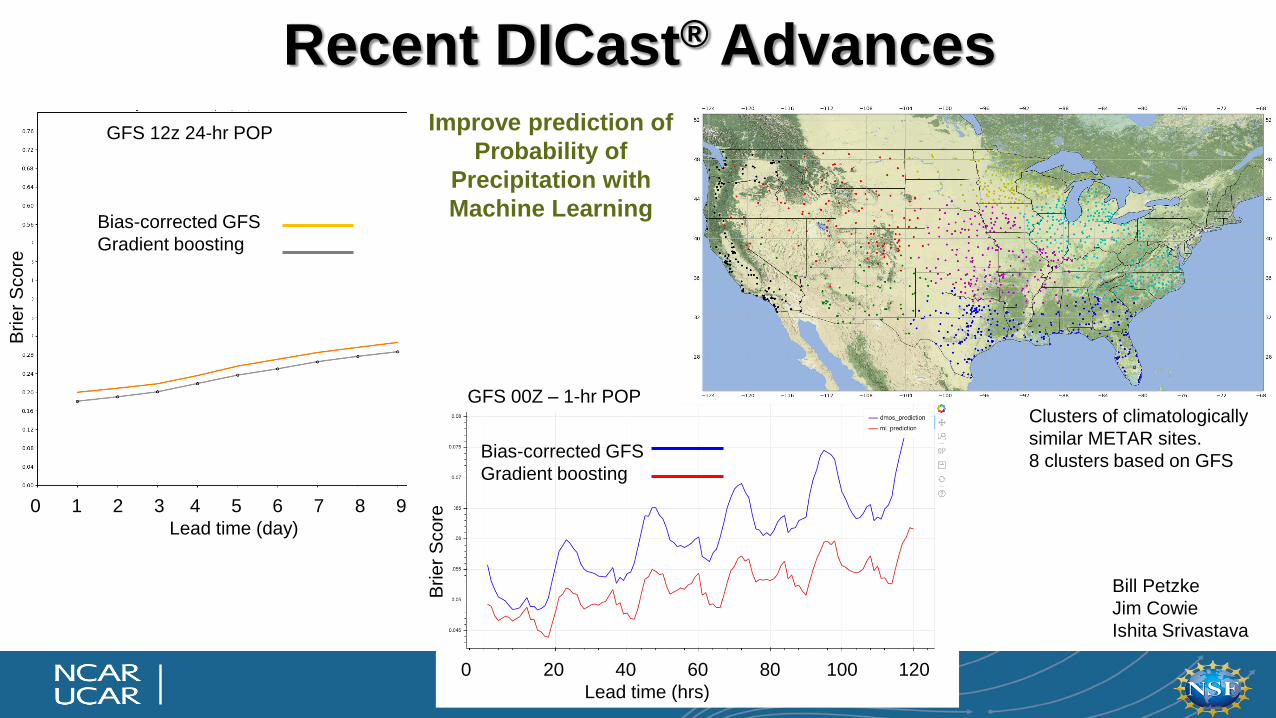
Recent DICast® Advances
Bill Petzke
Jim Cowie
Ishita Srivastava
Improve prediction of
Probability of
Precipitation with
Machine LearningBias-corrected GFS
Gradient boosting
Brie
r S
co
re
0 1 2 3 4 5 6 7 8 9
Lead time (day)
GFS 12z 24-hr POP
GFS 00Z – 1-hr POP
Bias-corrected GFS
Gradient boosting
0 20 40 60 80 100 120
Lead time (hrs)
Brie
r S
co
reClusters of climatologically
similar METAR sites.
8 clusters based on GFS
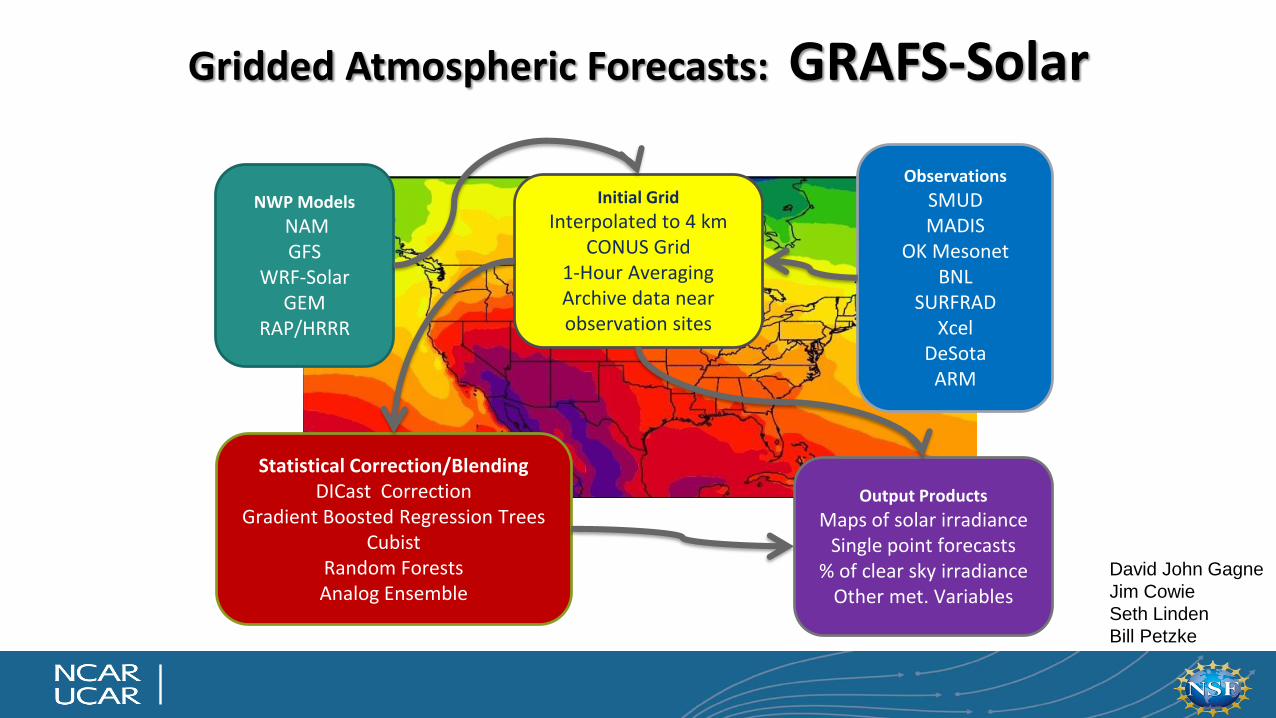
NWP Models
NAMGFS
WRF-SolarGEM
RAP/HRRR
Initial Grid
Interpolated to 4 km CONUS Grid
1-Hour Averaging Archive data near observation sites
Observations
SMUDMADIS
OK MesonetBNL
SURFRADXcel
DeSotaARM
Statistical Correction/BlendingDICast Correction
Gradient Boosted Regression TreesCubist
Random ForestsAnalog Ensemble
Output Products
Maps of solar irradianceSingle point forecasts
% of clear sky irradianceOther met. Variables
Gridded Atmospheric Forecasts: GRAFS-Solar
David John Gagne
Jim Cowie
Seth Linden
Bill Petzke
8
AI/ML Post-processing for Renewable Energy
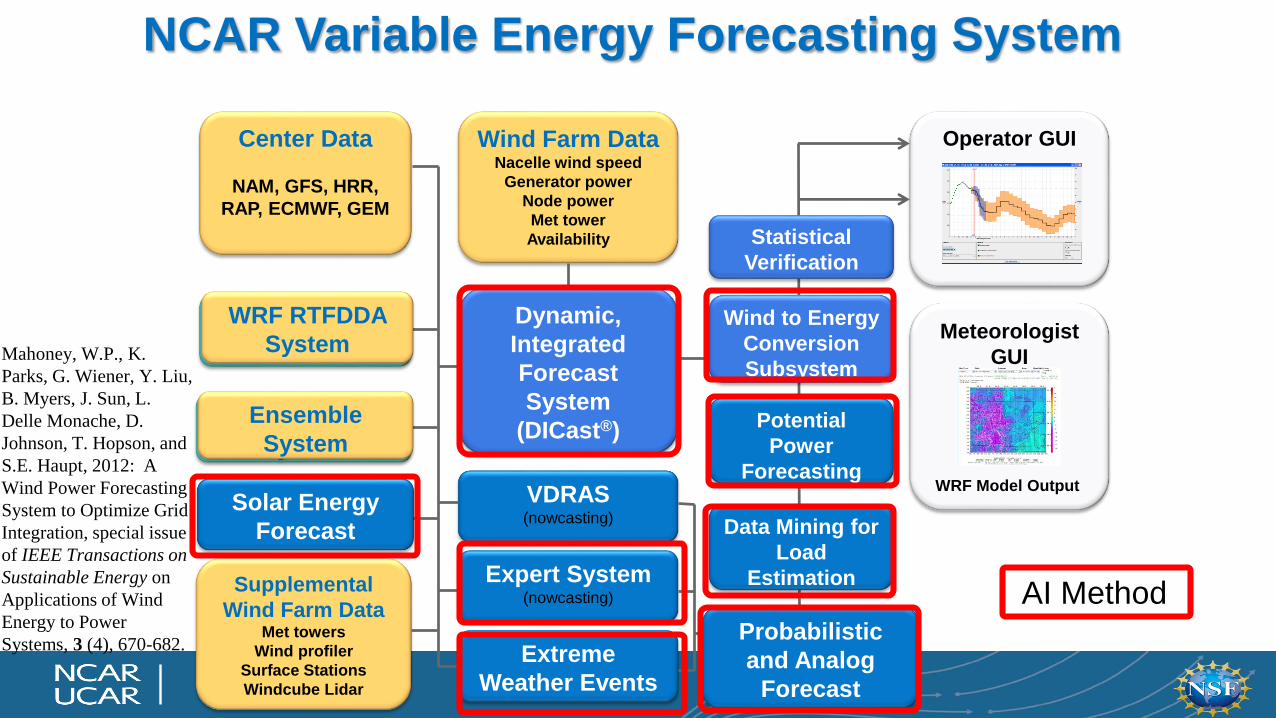
WRF RTFDDA
System
Center Data
NAM, GFS, HRR,
RAP, ECMWF, GEM
Wind Farm DataNacelle wind speed
Generator power
Node power
Met tower
Availability
VDRAS(nowcasting)
Supplemental
Wind Farm DataMet towers
Wind profiler
Surface Stations
Windcube Lidar
Operator GUI
Meteorologist
GUI
WRF Model Output
Wind to Energy
Conversion
Subsystem
Dynamic,
Integrated
Forecast
System
(DICast®)
CSV Data
Statistical
Verification
Expert System(nowcasting)
Ensemble
System
Extreme
Weather Events
Potential
Power
Forecasting
Data Mining for
Load
Estimation
Probabilistic
and Analog
Forecast
Solar Energy
Forecast
NCAR Variable Energy Forecasting System
WRF RTFDDA
System
Ensemble
System
AI Method
Mahoney, W.P., K.
Parks, G. Wiener, Y. Liu,
B. Myers, J. Sun, L.
Delle Monache, D.
Johnson, T. Hopson, and
S.E. Haupt, 2012: A
Wind Power Forecasting
System to Optimize Grid
Integration, special issue
of IEEE Transactions on
Sustainable Energy on
Applications of Wind
Energy to Power
Systems, 3 (4), 670-682.
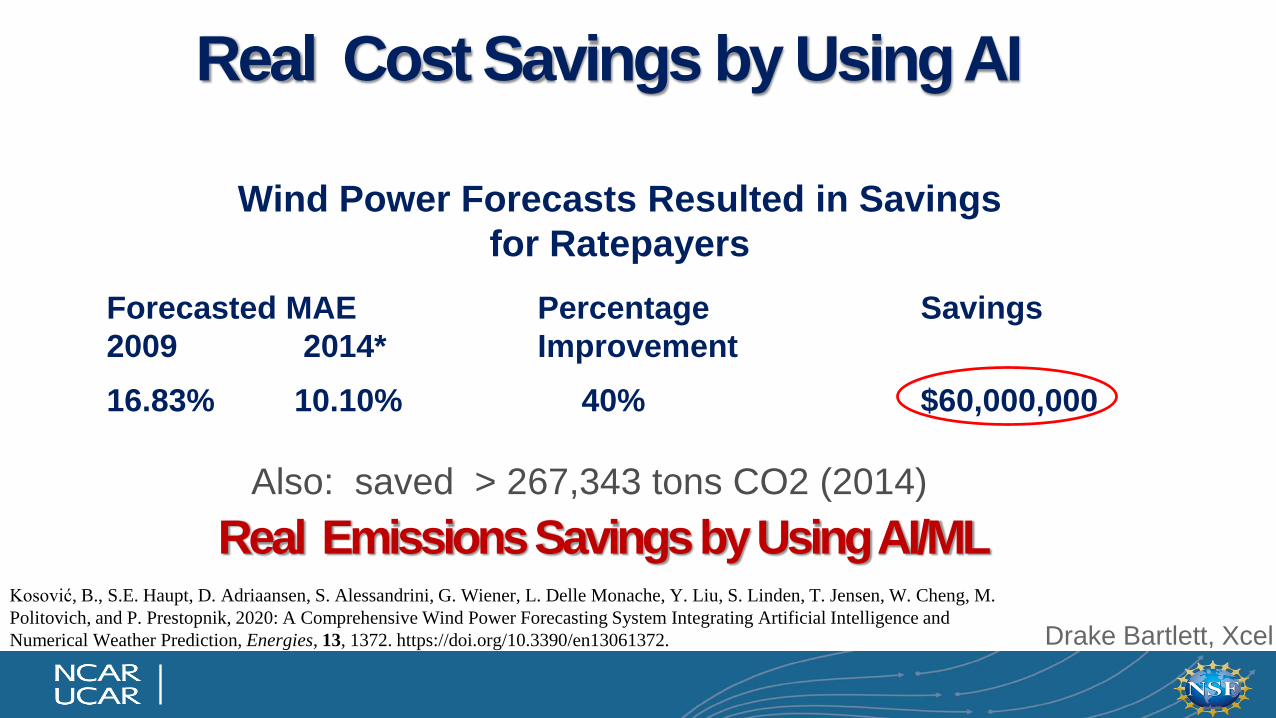
Wind Power Forecasts Resulted in Savings
for Ratepayers
Drake Bartlett, Xcel
Also: saved > 267,343 tons CO2 (2014)
Forecasted MAE Percentage Savings
2009 2014* Improvement
16.83% 10.10% 40% $60,000,000
Real Cost Savings by Using AI
Real Emissions Savings by Using AI/MLKosović, B., S.E. Haupt, D. Adriaansen, S. Alessandrini, G. Wiener, L. Delle Monache, Y. Liu, S. Linden, T. Jensen, W. Cheng, M.
Politovich, and P. Prestopnik, 2020: A Comprehensive Wind Power Forecasting System Integrating Artificial Intelligence and
Numerical Weather Prediction, Energies, 13, 1372. https://doi.org/10.3390/en13061372.
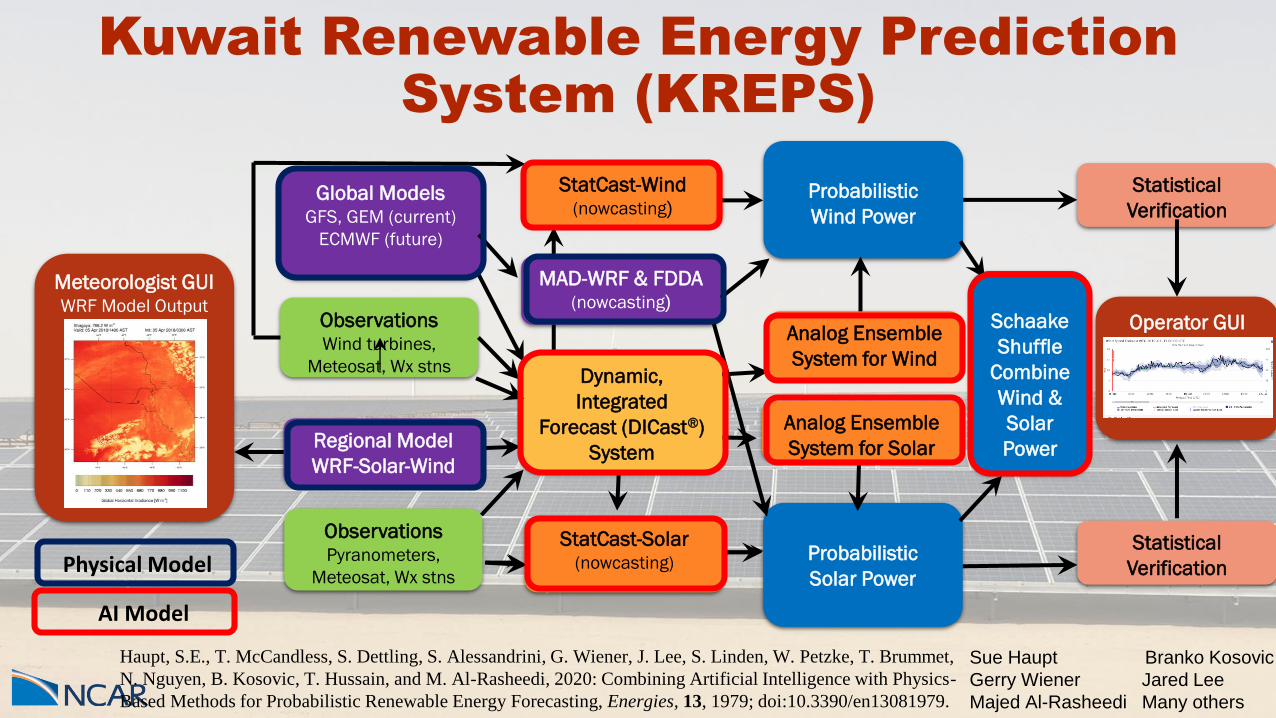
Kuwait Renewable Energy Prediction System (KREPS)
Regional Model
WRF-Solar-Wind
Global ModelsGFS, GEM (current)
ECMWF (future)
ObservationsWind turbines,
Meteosat, Wx stns
Operator GUI
Meteorologist GUIWRF Model Output
Probabilistic
Wind Power
Dynamic,
Integrated
Forecast (DICast®)
System
Statistical
Verification
StatCast-Wind(nowcasting)
Analog Ensemble
System for Wind
Probabilistic
Solar Power
Observations Pyranometers,
Meteosat, Wx stns
StatCast-Solar(nowcasting)
MAD-WRF & FDDA(nowcasting)
Analog Ensemble
System for Solar
Statistical
Verification
Schaake
Shuffle
Combine
Wind &
Solar
Power
Physical Model
AI Model
Sue Haupt Branko Kosovic
Gerry Wiener Jared Lee
Majed Al-Rasheedi Many others
Haupt, S.E., T. McCandless, S. Dettling, S. Alessandrini, G. Wiener, J. Lee, S. Linden, W. Petzke, T. Brummet,
N. Nguyen, B. Kosovic, T. Hussain, and M. Al-Rasheedi, 2020: Combining Artificial Intelligence with Physics-
Based Methods for Probabilistic Renewable Energy Forecasting, Energies, 13, 1979; doi:10.3390/en13081979.
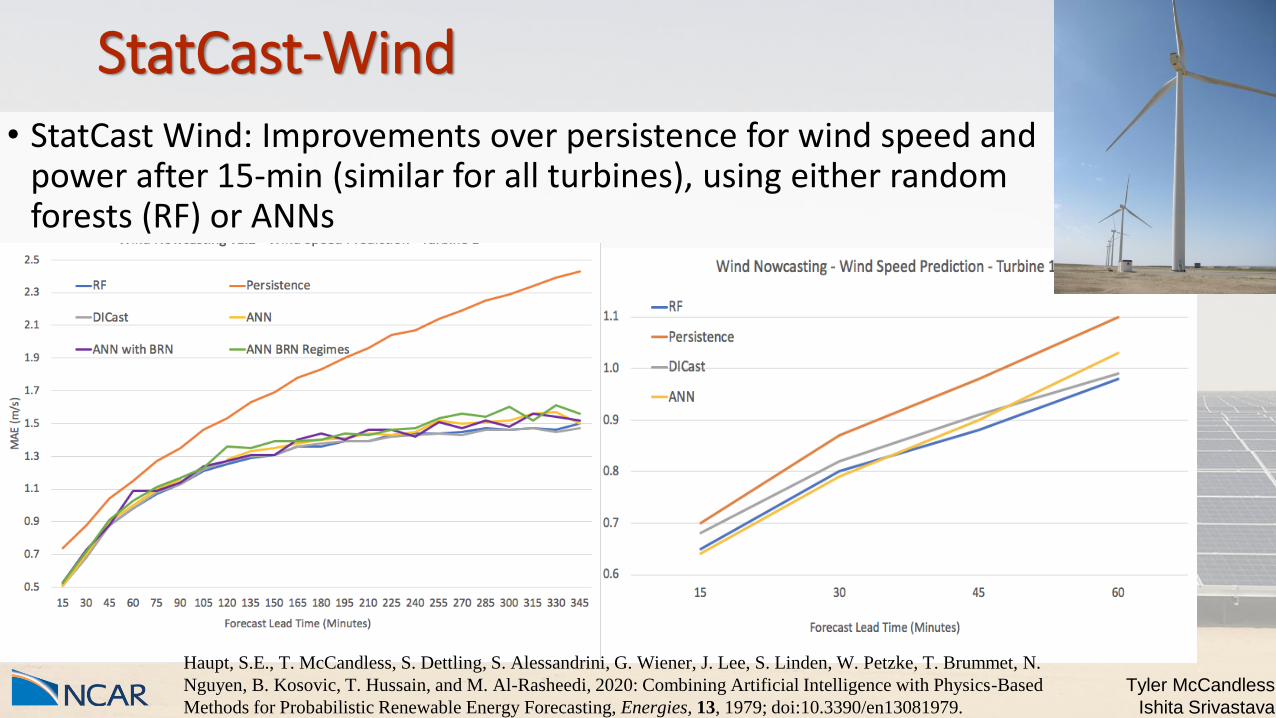
StatCast-Wind• StatCast Wind: Improvements over persistence for wind speed and
power after 15-min (similar for all turbines), using either random forests (RF) or ANNs
Tyler McCandless
Ishita Srivastava
Haupt, S.E., T. McCandless, S. Dettling, S. Alessandrini, G. Wiener, J. Lee, S. Linden, W. Petzke, T. Brummet, N.
Nguyen, B. Kosovic, T. Hussain, and M. Al-Rasheedi, 2020: Combining Artificial Intelligence with Physics-Based
Methods for Probabilistic Renewable Energy Forecasting, Energies, 13, 1979; doi:10.3390/en13081979.
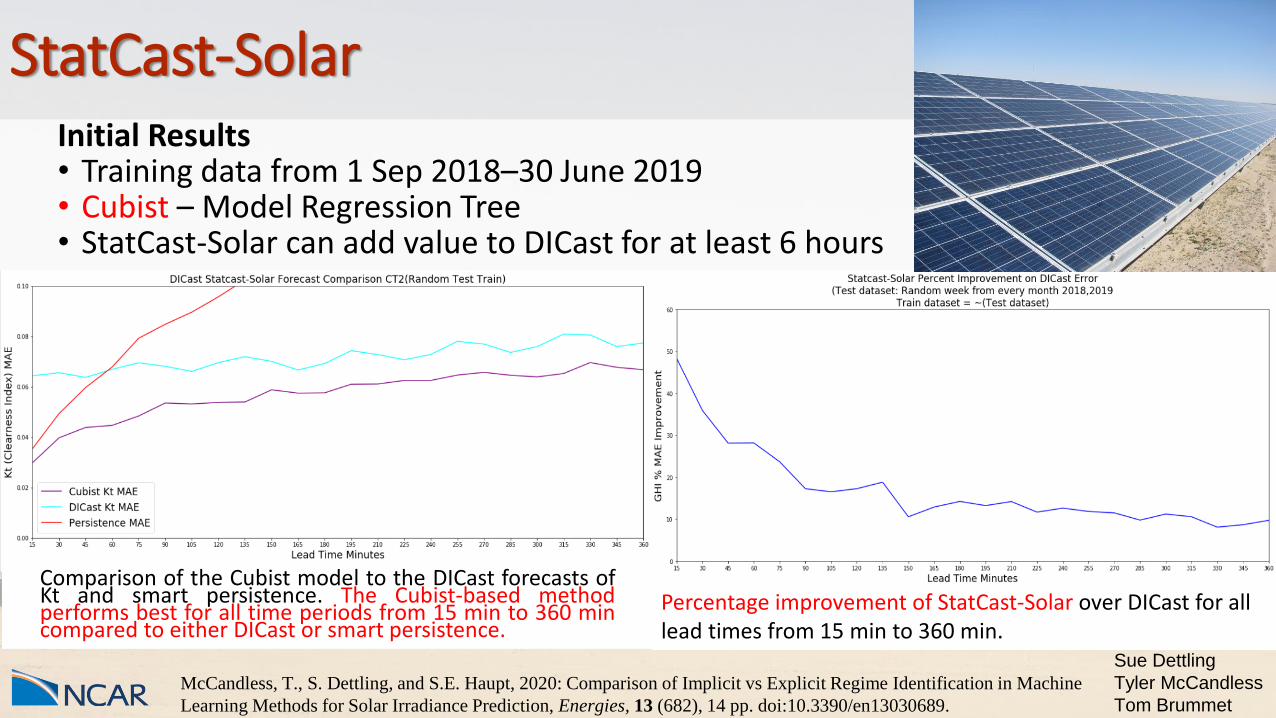
StatCast-SolarInitial Results • Training data from 1 Sep 2018–30 June 2019• Cubist – Model Regression Tree• StatCast-Solar can add value to DICast for at least 6 hours
Comparison of the Cubist model to the DICast forecasts ofKt and smart persistence. The Cubist-based methodperforms best for all time periods from 15 min to 360 mincompared to either DICast or smart persistence.
Percentage improvement of StatCast-Solar over DICast for all lead times from 15 min to 360 min.
Sue Dettling
Tyler McCandless
Tom Brummet
McCandless, T., S. Dettling, and S.E. Haupt, 2020: Comparison of Implicit vs Explicit Regime Identification in Machine
Learning Methods for Solar Irradiance Prediction, Energies, 13 (682), 14 pp. doi:10.3390/en13030689.
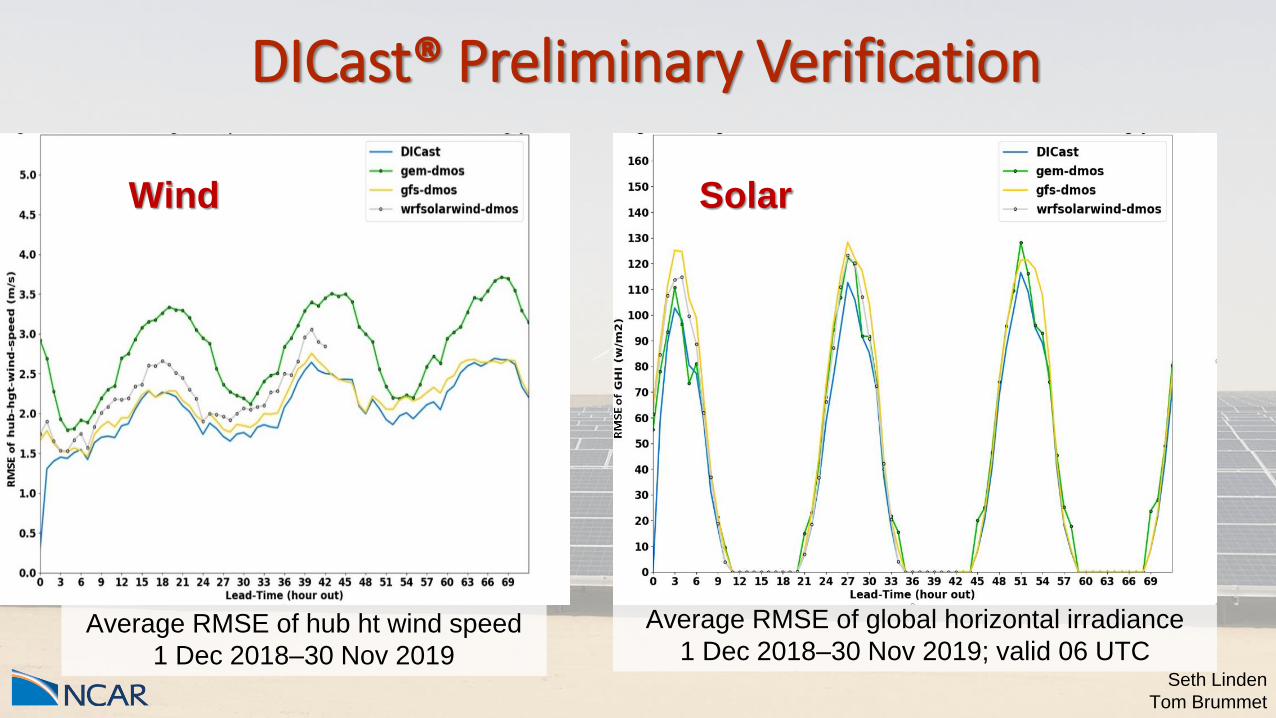
DICast® Preliminary Verification
Seth Linden
Tom Brummet
Average RMSE of global horizontal irradiance
1 Dec 2018–30 Nov 2019; valid 06 UTCAverage RMSE of hub ht wind speed
1 Dec 2018–30 Nov 2019
Wind Solar
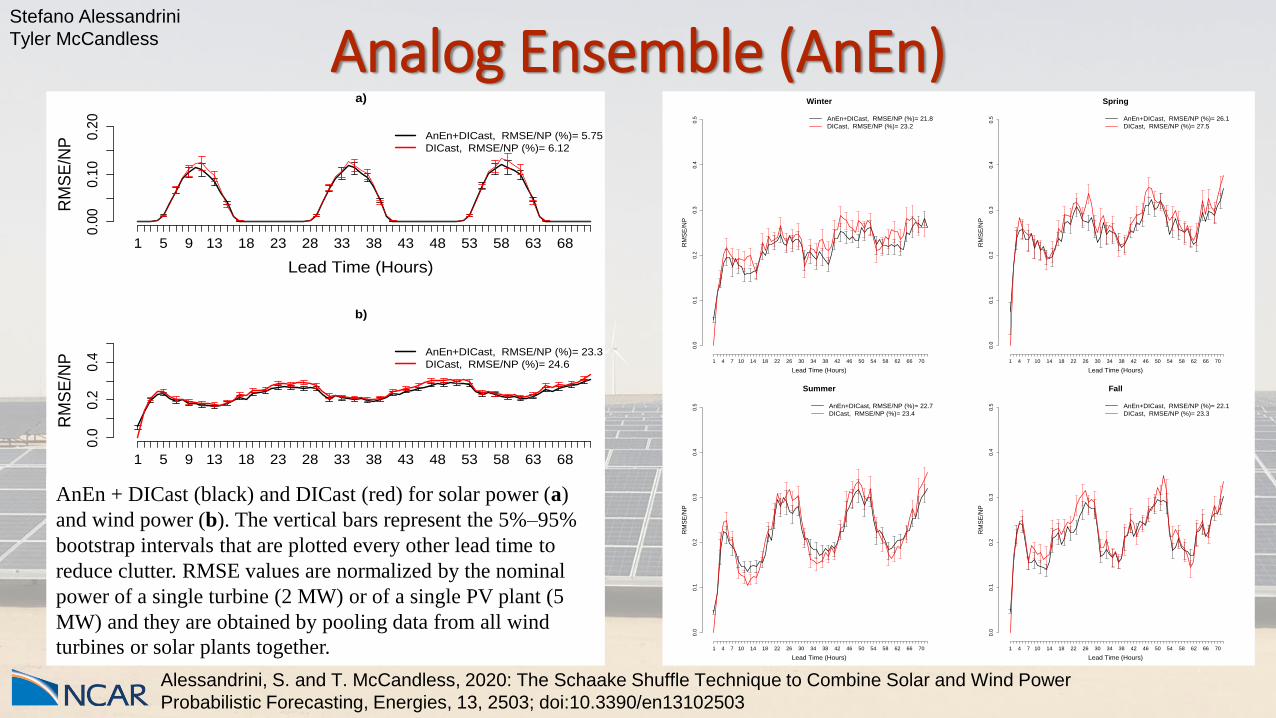
Analog Ensemble (AnEn)
Lead Time (Hours)
RM
SE
/NP
1 5 9 13 18 23 28 33 38 43 48 53 58 63 68
0.0
00
.10
0.2
0
AnEn+DICast, RMSE/NP (%)= 5.75
DICast, RMSE/NP (%)= 6.12
a)
Lead Time (Hours)
RM
SE
/NP
1 5 9 13 18 23 28 33 38 43 48 53 58 63 68
0.0
0.2
0.4
b)
AnEn+DICast, RMSE/NP (%)= 23.3
DICast, RMSE/NP (%)= 24.6
AnEn + DICast (black) and DICast (red) for solar power (a)
and wind power (b). The vertical bars represent the 5%–95%
bootstrap intervals that are plotted every other lead time to
reduce clutter. RMSE values are normalized by the nominal
power of a single turbine (2 MW) or of a single PV plant (5
MW) and they are obtained by pooling data from all wind
turbines or solar plants together.
Lead Time (Hours)
RM
SE
/NP
1 4 7 10 14 18 22 26 30 34 38 42 46 50 54 58 62 66 70
0.0
0.1
0.2
0.3
0.4
0.5 AnEn+DICast, RMSE/NP (%)= 21.8
DICast, RMSE/NP (%)= 23.2
Winter
Lead Time (Hours)
RM
SE
/NP
1 4 7 10 14 18 22 26 30 34 38 42 46 50 54 58 62 66 70
0.0
0.1
0.2
0.3
0.4
0.5 AnEn+DICast, RMSE/NP (%)= 26.1
DICast, RMSE/NP (%)= 27.5
Spring
Lead Time (Hours)
RM
SE
/NP
1 4 7 10 14 18 22 26 30 34 38 42 46 50 54 58 62 66 70
0.0
0.1
0.2
0.3
0.4
0.5 AnEn+DICast, RMSE/NP (%)= 22.7
DICast, RMSE/NP (%)= 23.4
Summer
Lead Time (Hours)
RM
SE
/NP
1 4 7 10 14 18 22 26 30 34 38 42 46 50 54 58 62 66 70
0.0
0.1
0.2
0.3
0.4
0.5 AnEn+DICast, RMSE/NP (%)= 22.1
DICast, RMSE/NP (%)= 23.3
Fall
Stefano Alessandrini
Tyler McCandless
Alessandrini, S. and T. McCandless, 2020: The Schaake Shuffle Technique to Combine Solar and Wind Power
Probabilistic Forecasting, Energies, 13, 2503; doi:10.3390/en13102503
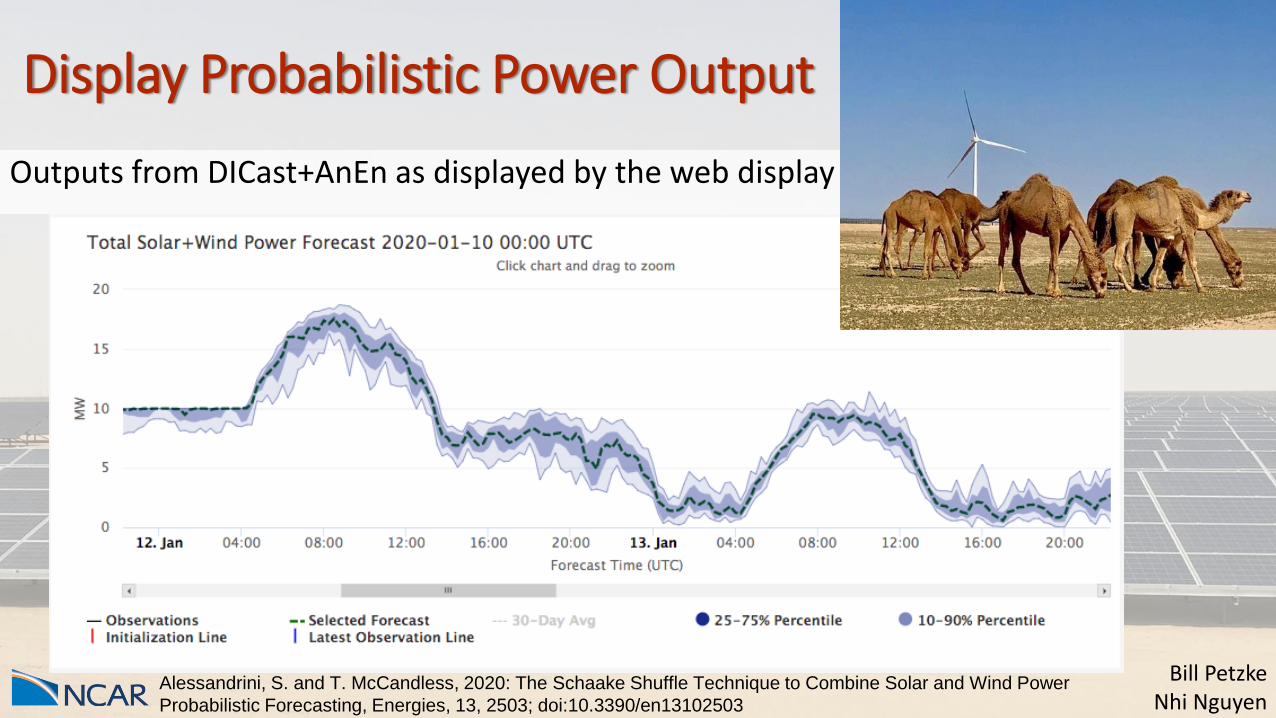
Display Probabilistic Power Output
Outputs from DICast+AnEn as displayed by the web display
Bill PetzkeNhi Nguyen
Alessandrini, S. and T. McCandless, 2020: The Schaake Shuffle Technique to Combine Solar and Wind Power
Probabilistic Forecasting, Energies, 13, 2503; doi:10.3390/en13102503
17
Test Data for AI/ML Methods for Post-processing
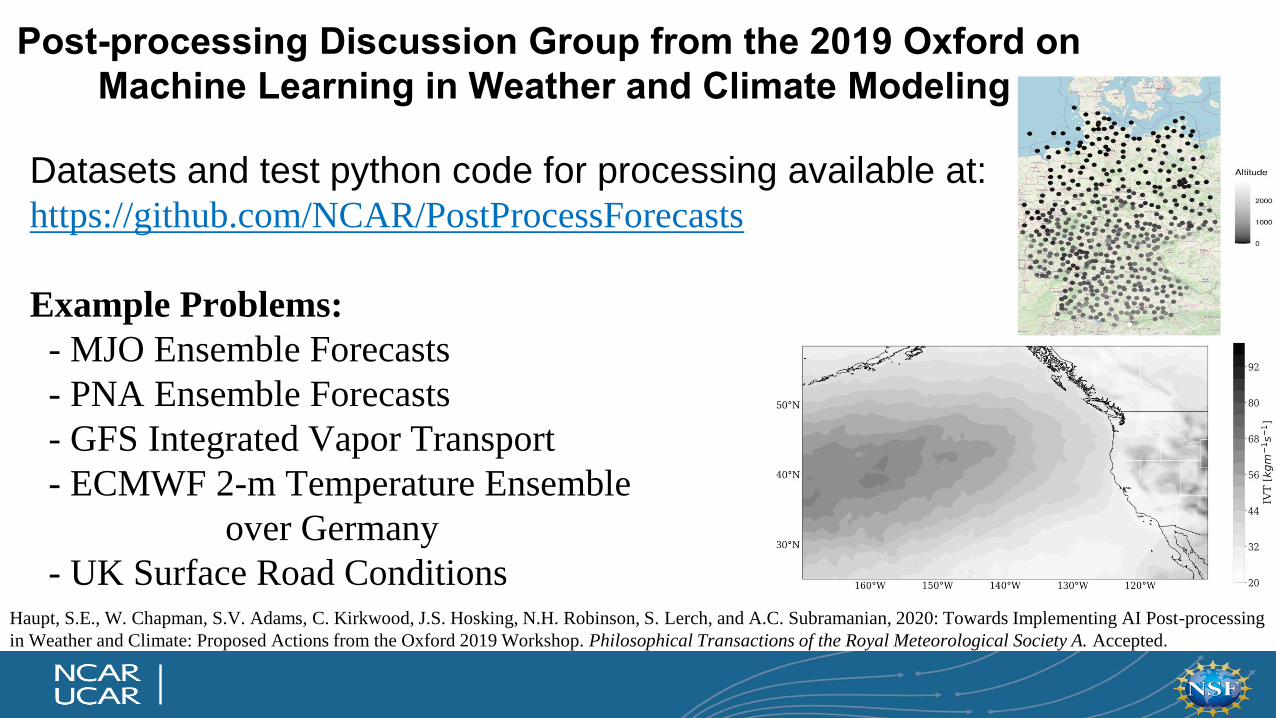
Post-processing Discussion Group from the 2019 Oxford on
Machine Learning in Weather and Climate Modeling
Datasets and test python code for processing available at:
https://github.com/NCAR/PostProcessForecasts
Example Problems:
- MJO Ensemble Forecasts
- PNA Ensemble Forecasts
- GFS Integrated Vapor Transport
- ECMWF 2-m Temperature Ensemble
over Germany
- UK Surface Road ConditionsHaupt, S.E., W. Chapman, S.V. Adams, C. Kirkwood, J.S. Hosking, N.H. Robinson, S. Lerch, and A.C. Subramanian, 2020: Towards Implementing AI Post-processing
in Weather and Climate: Proposed Actions from the Oxford 2019 Workshop. Philosophical Transactions of the Royal Meteorological Society A. Accepted.
19
AI/ML for Model Parameterization
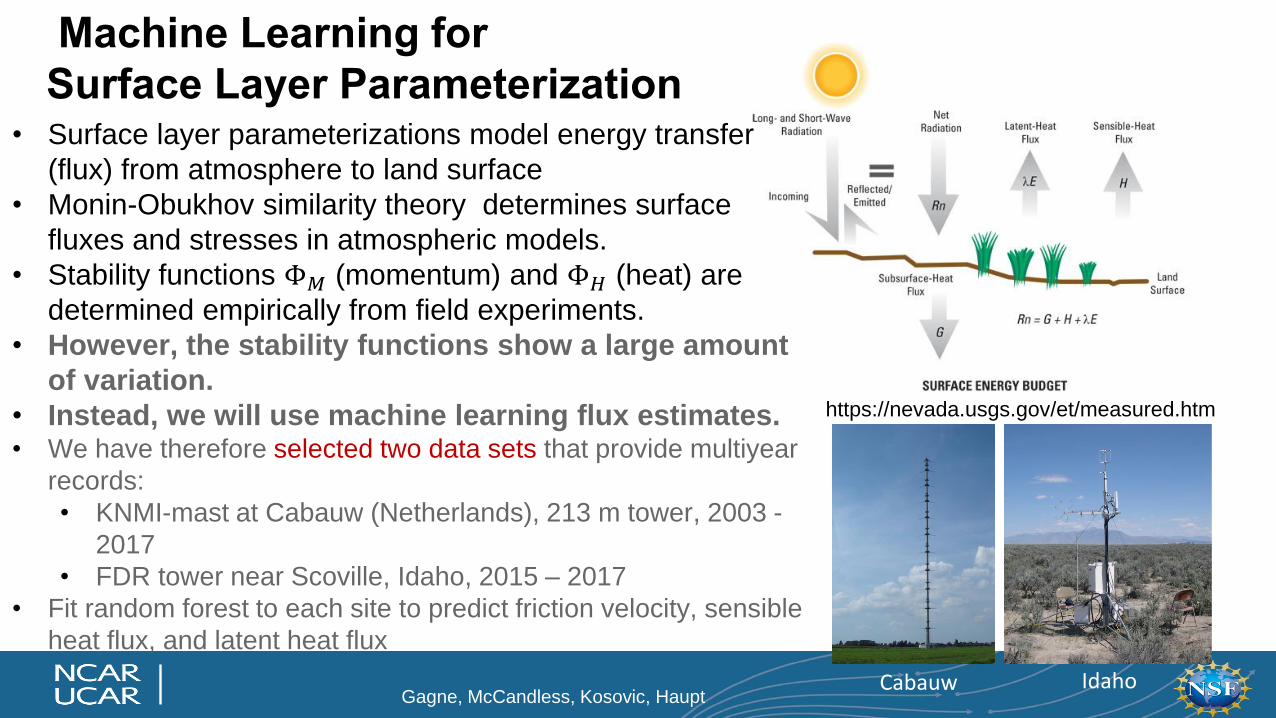
Machine Learning for
Surface Layer Parameterization• Surface layer parameterizations model energy transfer
(flux) from atmosphere to land surface
• Monin-Obukhov similarity theory determines surface
fluxes and stresses in atmospheric models.
• Stability functions Φ𝑀 (momentum) and Φ𝐻 (heat) are
determined empirically from field experiments.
• However, the stability functions show a large amount
of variation.
• Instead, we will use machine learning flux estimates.• We have therefore selected two data sets that provide multiyear
records:
• KNMI-mast at Cabauw (Netherlands), 213 m tower, 2003 -
2017
• FDR tower near Scoville, Idaho, 2015 – 2017
• Fit random forest to each site to predict friction velocity, sensible
heat flux, and latent heat flux
https://nevada.usgs.gov/et/measured.htm
Cabauw IdahoGagne, McCandless, Kosovic, Haupt
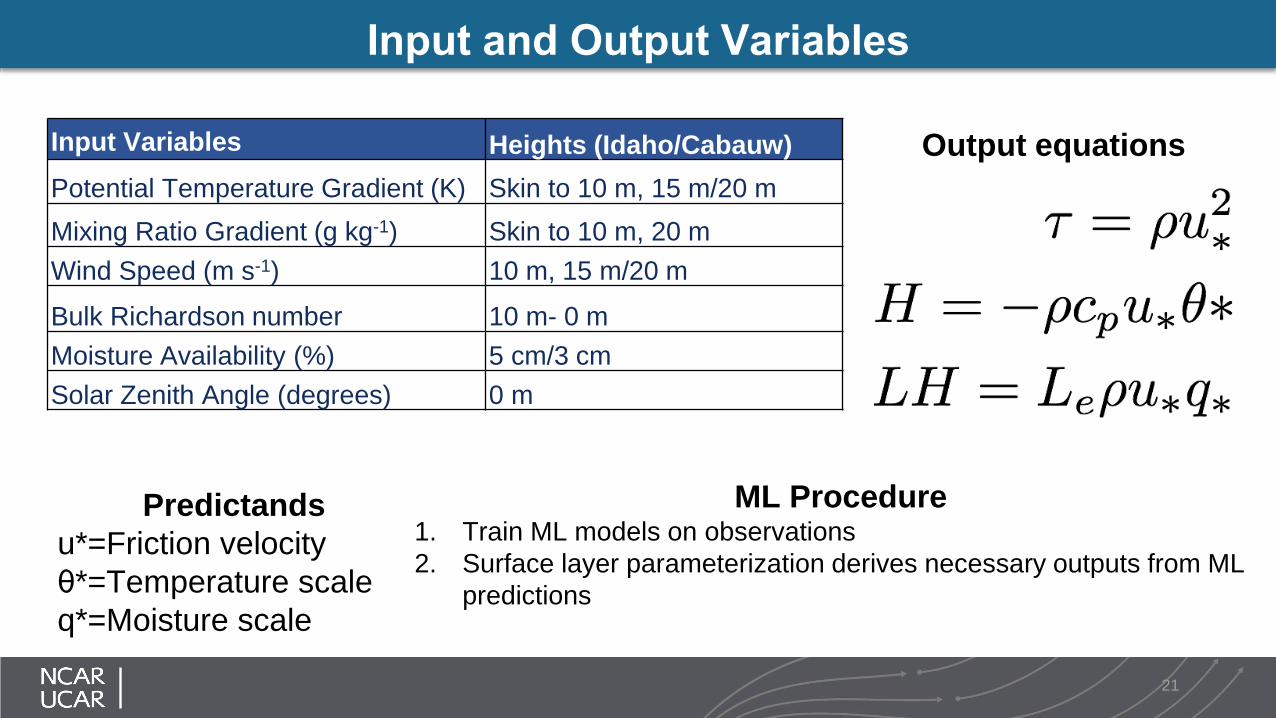
Input and Output Variables
Input Variables Heights (Idaho/Cabauw)
Potential Temperature Gradient (K) Skin to 10 m, 15 m/20 m
Mixing Ratio Gradient (g kg-1) Skin to 10 m, 20 m
Wind Speed (m s-1) 10 m, 15 m/20 m
Bulk Richardson number 10 m- 0 m
Moisture Availability (%) 5 cm/3 cm
Solar Zenith Angle (degrees) 0 m
Output equations
Predictands
u*=Friction velocity
θ*=Temperature scale
q*=Moisture scale
21
ML Procedure1. Train ML models on observations
2. Surface layer parameterization derives necessary outputs from ML
predictions
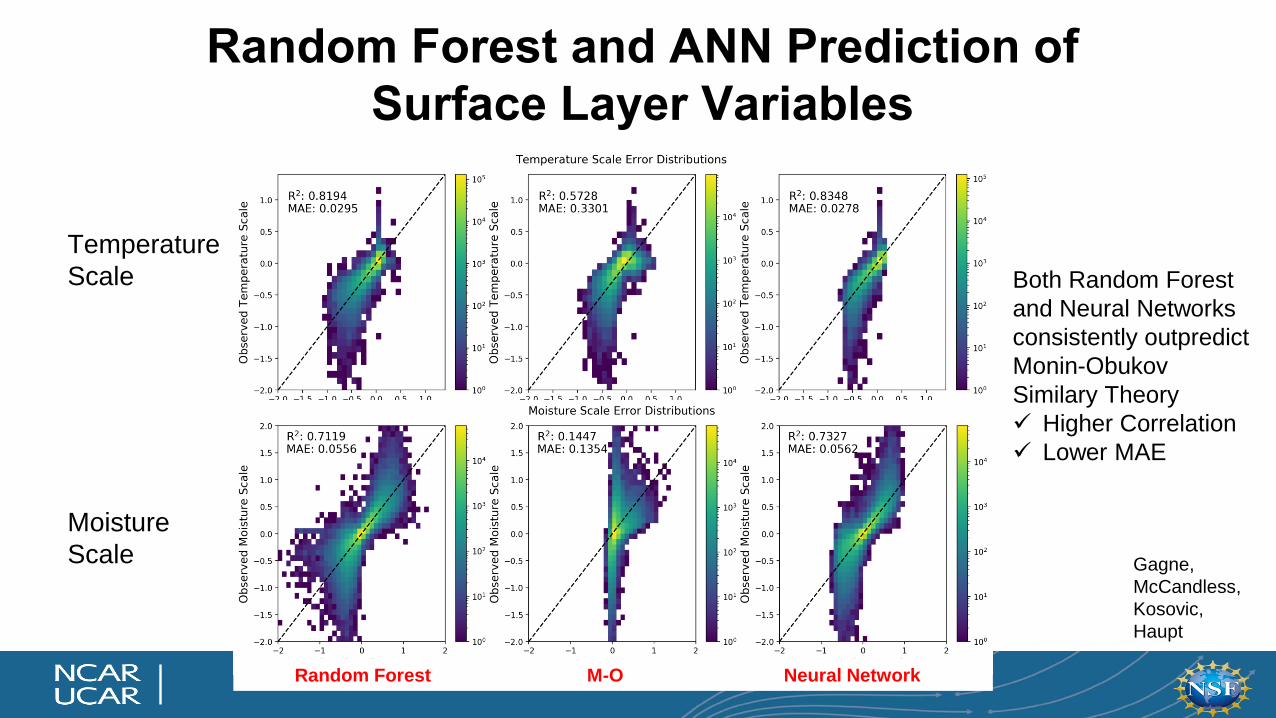
Random Forest and ANN Prediction of
Surface Layer Variables
Random Forest M-O Neural Network
Gagne,
McCandless,
Kosovic,
Haupt
Temperature
Scale
Moisture
Scale
Both Random Forest
and Neural Networks
consistently outpredict
Monin-Obukov
Similary Theory
✓ Higher Correlation
✓ Lower MAE
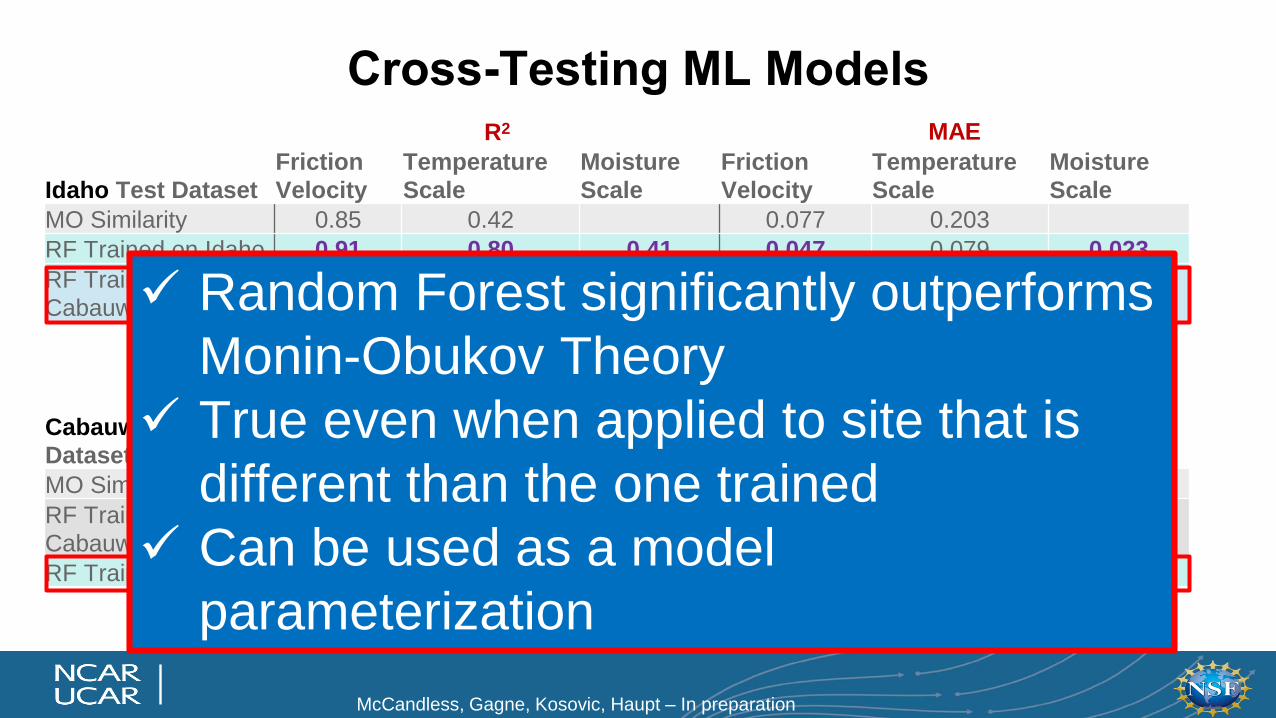
Cross-Testing ML ModelsR2 MAE
Idaho Test Dataset
Friction
Velocity
Temperature
Scale
Moisture
Scale
Friction
Velocity
Temperature
Scale
Moisture
Scale
MO Similarity 0.85 0.42 0.077 0.203
RF Trained on Idaho 0.91 0.80 0.41 0.047 0.079 0.023
RF Trained on
Cabauw 0.88 0.76 0.22 0.094 0.139 0.284
R2 MAE
Cabauw Test
Dataset
Friction
Velocity
Temperature
Scale
Moisture
Scale
Friction
Velocity
Temperature
Scale
Moisture
Scale
MO Similarity 0.90 0.44 0.14 0.115 0.062 0.135
RF Trained on
Cabauw 0.93 0.82 0.73 0.031 0.030 0.055
RF Trained on Idaho 0.90 0.77 0.49 0.074 0.049 0.112
✓ Random Forest significantly outperforms
Monin-Obukov Theory
✓ True even when applied to site that is
different than the one trained
✓ Can be used as a model
parameterization
McCandless, Gagne, Kosovic, Haupt – In preparation
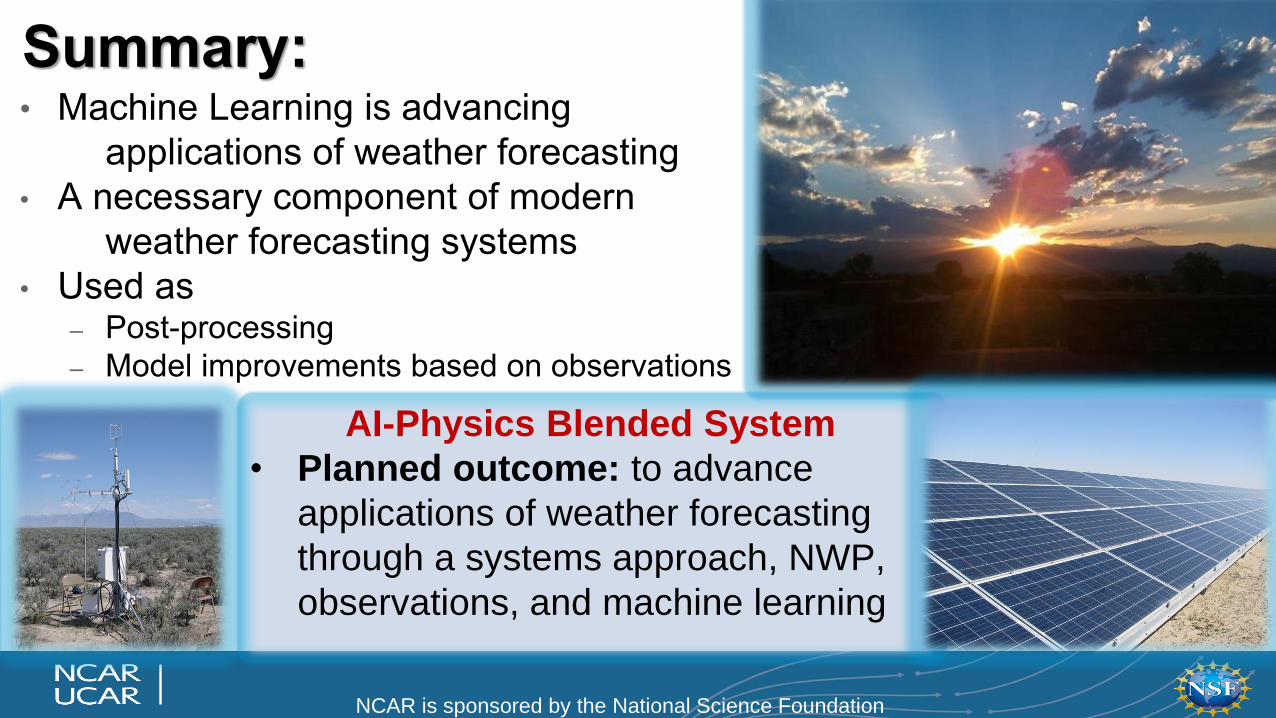
Summary:• Machine Learning is advancing
applications of weather forecasting
• A necessary component of modern
weather forecasting systems
• Used as – Post-processing
– Model improvements based on observations
NCAR is sponsored by the National Science Foundation
AI-Physics Blended System
• Planned outcome: to advance
applications of weather forecasting
through a systems approach, NWP,
observations, and machine learning
![Data Assimilation for Numerical Weather Prediction - [NWP ......Data Assimilation for Numerical Weather Prediction [NWP] Project Ahmed Attia Statistical and Applied Mathematical Science](https://img.pdfslide.us/doc/110x75/6039cba9995b992a170c4a78/data-assimilation-for-numerical-weather-prediction-nwp-data-assimilation.jpg)


![Ensemble of Radial Basis Neural Networks With K-means ... · successfully applied to time series prediction [10], weather forecasting [11], load prediction in a power system [12]](https://img.pdfslide.us/doc/110x75/5e6d08cb0d877243851af278/ensemble-of-radial-basis-neural-networks-with-k-means-successfully-applied-to.jpg)