Embed Size (px)
Citation preview

Machine LearningCISC 5800
Dr Daniel Leeds

2
What is machine learning
• Finding patterns in data• Adapting program behavior
• Advertise a customer’s favorite products• Search the web to find pictures of dogs• Change radio channel when user says “change channel”

3
Advertise a customer’s favorite products
This summer, I had two meetings, one in Portland and one in Baltimore
Today I get an e-mail from Priceline:

4
Search the web to find pictures of dogs
Filenames:- Dog.jpg- Puppy.bmp
Caption text
Pixel patterns

5
• Distinguish user’s voice from music• Understand what user has said
Change radio channel when user says “change channel”

6
What’s covered in this class
• Theory: describing patterns in data• Probability• Linear algebra• Calculus/optimization
• Implementation: programming to find and react to patterns in data• Matlab• Data sets of text, speech, pictures, user actions, neural data…

7
Outline of topics
• Groundwork: probability, slopes, and programming• Classification overview: Training, testing, and overfitting
• Discriminative and generative methods: Regression vs Naïve Bayes
• Classifier theory: Separability, information criteria• Support vector machines: Slack variables and kernels
• Expectation-Maximization: Gaussian mixture models
• Dimensionality reduction: Principle Component Analysis
• Graphical models: Bayes nets, Hidden Markov model

8
What you need to do in this class
• Class attendance• Assignments: homeworks (4) and final project• Exams: midterm and final

9
Resources
• Office hours: Wednesday 3-4pm and by appointment• Course web site: http://storm.cis.fordham.edu/leeds/cisc5800• Fellow students• Textbooks/online notes
•Matlab

10
Outline of topics
• Groundwork: probability, slopes, and programming• Classification overview: Training, testing, and overfitting
• Discriminative and generative methods: Regression vs Naïve Bayes
• Classifier theory: Separability, information criteria• Support vector machines: Slack variables and kernels
• Expectation-Maximization: Gaussian mixture models
• Dimensionality reduction: Principle Component Analysis
• Graphical models: Bayes nets, Hidden Markov model

11
ProbabilityWhat is the probability that a child likes chocolate?
The “frequentist” approach:• Ask 100 children• Count who likes chocolate• Divide by number of children asked
P(“child likes chocolate”) = In short: P(C)=0.85 C=“child likes chocolate”
Name Chocolate?Sarah YesMelissa YesDarren NoStacy YesBrian No

12
General probability properties
P(A) means “Probability that statement A is true”
•0≤Prob(A) ≤1•Prob(True)=1•Prob(False)=0

13
Random variables
A variable can take on a value from a given set of values:• {True, False}• {Cat, Dog, Horse, Cow}• {0,1,2,3,4,5,6,7}
A random variable holds each value with a given probabilityTo start, let us consider a binary variable• P(LikesChocolate) = P(LikesChocolate=True) = 0.85

14
ComplementsWhat is the probability that a child DOES NOT like chocolate?
Complement: C’ = “child doesn’t like chocolate”P(C’) =
In general: P(A’) =
C=“child likes chocolate”
All children (the full “sample space”)
C
C’
P(“child likes chocolate”) =

15
Addition rule
Prob(A or B) = ???
Name Chocolate? Ice cream?Sarah Yes NoMelissa Yes YesDarren No NoStacy Yes YesBrian No Yes
All children
C I
C=“child likes chocolate”I=“child likes ice cream”

16
Joint and marginal probabilitiesAcross 100 children:• 55 like chocolate AND ice cream• 30 like chocolate but not ice cream• 5 like ice cream but not chocolate• 10 don’t like chocolate nor ice cream
Prob(I) = Prob(C) = Prob(I,C)
Corrected slide

17
Conditional probabilityAcross 100 children:• 55 like chocolate AND ice cream P(C,I)• 30 like chocolate but not ice cream P(C,I’)• 5 like ice cream but not chocolate P(C’,I)• 10 don’t like chocolate nor ice cream P(C’,I’)
• Prob(C|I) : Probability child likes chocolate given s/he likes ice cream
P(C|I) =
Also, Multiplication Rule:
P(A,B) = P(A|B) P(B)P(A,B):Probability A and B
are both true
Corrected slide

18
Independence
If the truth value of B does not affect the truth value of A:• P(A|B) = P(A)
Equivalently• P(A,B) = P(A) P(B)

19
Multi-valued random variables
A random variable can hold more than two values, each with a given probability• P(Animal=Cat)=0.5• P(Animal=Dog)=0.3• P(Animal=Horse)=0.1• P(Animal=Cow)=0.1

20
Probability rules: multi-valued variablesFor a given variable A:
• P( and ) = 0 if
•
•
cat dog
horse cow
animal

21
Bayes rule
Terminology:• P(A|B) is the “posterior probability”• P(B|A) is the “likelihood”• P(A) is the “prior probability”
We will spend (much) more time with Bayes rule in following lectures

22
Continuous random variablesA random variable can take on a continuous range of values• From 0 to 1• From 0 to • From to
Probability expressed through a “probability density function” f(x)
“Probability A has value between i and j isarea under the curve of f between i and j
x
f(x)
-2 -1 0 1 2
230 0.2 0.4 0.6 0.8 1
0.10.080.060.040.02
0
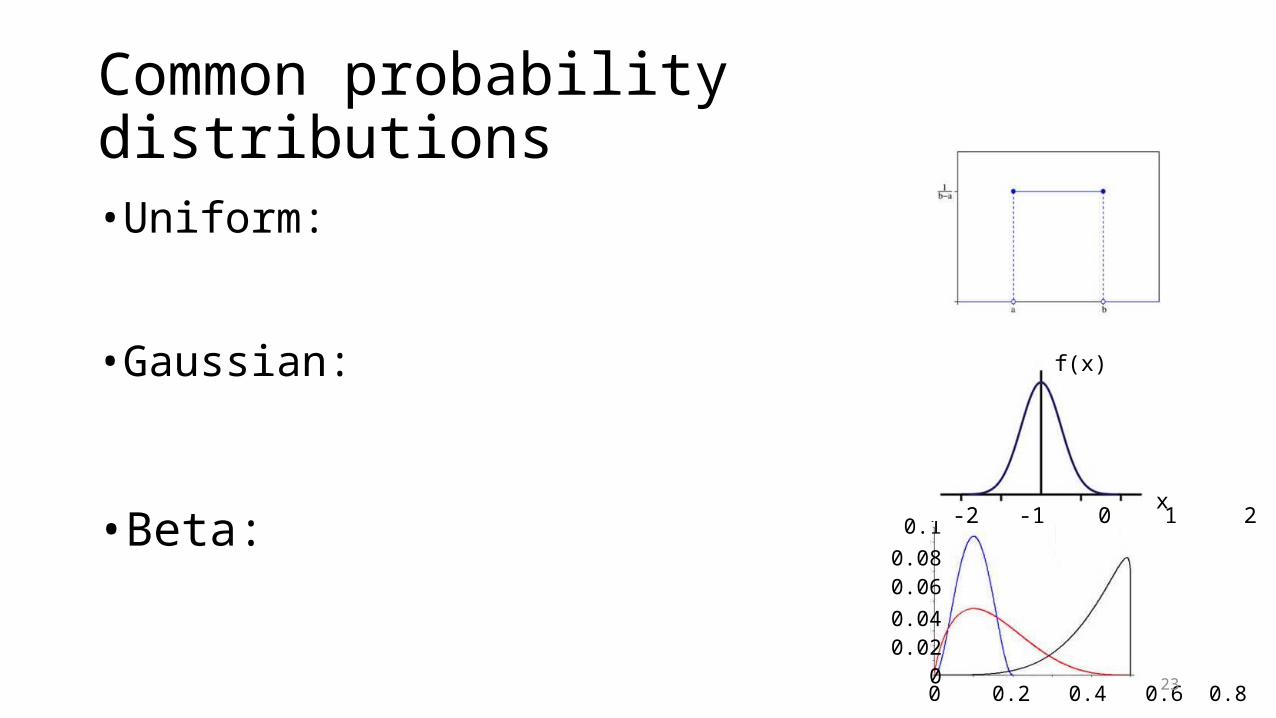
Common probability distributions
• Uniform:
• Gaussian:
• Beta: x
f(x)
-2 -1 0 1 2

24
The Gaussian function
•Mean – center of distribution• Standard deviation – width of distribution
•Which color is =-2, =0.5? Which color is =0, =0.2?
-5 -4 -3 -2 -1 0 1 2 3 4 5
1
0.8
0.6
0.4
0.2
0
𝝁=𝟎 ,𝝈𝟐=𝟏 .𝟎

25
Calculus: finding the slope of a functionWhat is the minimum value of: f(x)=x2-5x+6
Find value of x where slope is 0
General rules: slope of f(x):

26
Calculus: finding the slope of a functionWhat is the minimum value of: f(x)=x2-5x+6
• f'(x)=•What is the slope at x=5?•What is the slope at x=-5?
•What value of x gives slope of 0?

27
More on derivatives:
• -- w is not related to x, so derivative is 0• =

28
Programming in Matlab: Data types
• Numbers: -8.5, 0, 94
• Characters: 'j', '#', 'K' - always surrounded by single quotes
• Groups of numbers/characters – placed in between [ ]• [5 10 12; 3 -4 12; -6 0 0] - spaces/commas separate columns,
semi-colons separate rows• 'hi robot', ['h' 'i' ' ' 'robot'] - a collection of characters can be grouped
inside a set of single quotes

29
Matrix indexing• Start counting at 1matrix1=[4 8 12; 6 3 0; -2 -7 -12];matrix1(2,3) -> 0
• Last row/column can also be designated by keyword “end”matrix1(1,end) -> 12
• Colon indicates counting up by increment• [2:10] -> [2 3 4 5 6 7 8 9 10]• [3:4:19] -> [3 7 11 15 19]
matrix1(2,1:3) -> [6 3 0]

30
Vector/matrix functions
vec1=[9, 3, 5, 7]; matrix2=[4.5 -3.2; 2.2 0; -4.4 -3];• mean mean(vec1) -> 6• min min(vec1) -> 3• max max(vec1) -> ?• std std(vec1) -> 2.58• lengthlength(vec1) -> ?• size size(matrix2) -> [3 2];

31
Extra syntax notes
• Semicolons suppress output of computations:> a=4+5
a =
9
> b=6+7;
>
• % starts a comment for the line (like // in C++)• .* , ./ , .^ performs element-wise arithmetic
>c=[2 3 4]./[2 1 2]
>c =
[1 3 1]
>
32
Variables
• who, whos – list variables in environment• Comparisons:• Like C++: ==, <, >, <=, >=• Not like C++: not ~, and &, or |
• Conditions:• if(...), end;
• Loops:• while(...), end;• for x=a:b, end;

33
Data: .mat files
• save filename variableNames
• load filename
• Confirm correct directories:• pwd – show directory (print working directory)• cd – change directory• ls – list files in directory

34
Define new functions: .m files
• Begin file with function header:function output = function_name(input)
statement1;statement2;
• Can allow multiple inputs/outputsfunction [output1, output2] = function_name(input1, input2, input3)

35
Linear algebra: data features
• Vector – list of numbers:each number describesa data feature
•Matrix – list of lists of numbers:features for each datapoint
Wolf 12
Lion 16
Monkey 14
Broker 0
Analyst 1
Dividend 1
⁞ d ⁞
# of word occurrences
Document 1
8
10
11
1
0
1
⁞
Document 2
0
2
1
14
10
12
⁞
Document 3

36
Feature space
• Each data feature defines a dimension in space
Wolf 12Lion 16
Monkey 14Broker 0
Analyst 1Dividend 1
⁞ d ⁞
Document18
1011101⁞
Document2021
141012⁞
Document3
wolflio
n doc1
doc2
doc30 10 20
20
10
0

37
The dot product
The dot product compares two vectors:• ,
0 10 20
20
10
0

38
The dot product, continuedMagnitude of a vector is the sum of the squares of the elements
If has unit magnitude, is the “projection” of onto
0 1 2
2
1
0
𝒂 ∙𝒃=∑𝑖=1
𝑛
𝑎𝑖𝑏𝑖

39
Multiplication
• Scalar matrix: Multiply each element of the matrix by the scalar value
• Matrix column vector: dot product of each row with vector
“scalar” means single numeric value (not a multi-element matrix)
𝒃
[−𝒂1−⋮−𝒂𝑛−]

40
Multiplication
•Matrix matrix: Compute dot product of each left row and right column
NB: Matrix dimensions need to be compatible for valid multiplication – number of rows of left matrix (A) = number of columns of right matrix (B)