Embed Size (px)
Citation preview

Company Confidential - For Internal Use Only
Copyright © 2013, SAS Insti tute Inc. Al l r ights reserved.
MACHINE LEARNING AND
BREAST CANCER PREDICTION
1
USING SEER DATA 1973-2012
ISF 2015 - JUNE 24, 2015
Tae Yoon Lee - [email protected]
Youngme Seo - [email protected]
Company Confidential - For Internal Use Only
Copyright © 2013, SAS Insti tute Inc. Al l r ights reserved.
AGENDAMACHINE LEARNING AND
BREAST CANCER PREDICTION
1. Machine Learning – Data Mining – Big Data Analytics – Data Scientist
2. Breast Cancer Prediction and Prognosis
3. Machine Learning Methods
4. Comparison of Machine Learning methods
5. Summary and Future Research
2

Company Confidential - For Internal Use Only
Copyright © 2013, SAS Insti tute Inc. Al l r ights reserved.
WHAT IS MACHINE
LEARNING ?AUTOMATION OF DATA MINING ….
3
Machine learning is
• a branch of artificial intelligence
• employs a variety of statistical, probabilistic and optimization
techniques
• allows computers to “learn” from past examples
• detect hard-to-discern pattern from large, noisy or complex data
sets.”
Cruz and Whishart (2006), “Application of Machine Learning in Cancer
Prediction and Prognosis
Company Confidential - For Internal Use Only
Copyright © 2013, SAS Insti tute Inc. Al l r ights reserved.
WHAT IS MACHINE
LEARNING ?DATA MINING, BIG DATA ANALYTICS, DATA SCIENTISTS
4
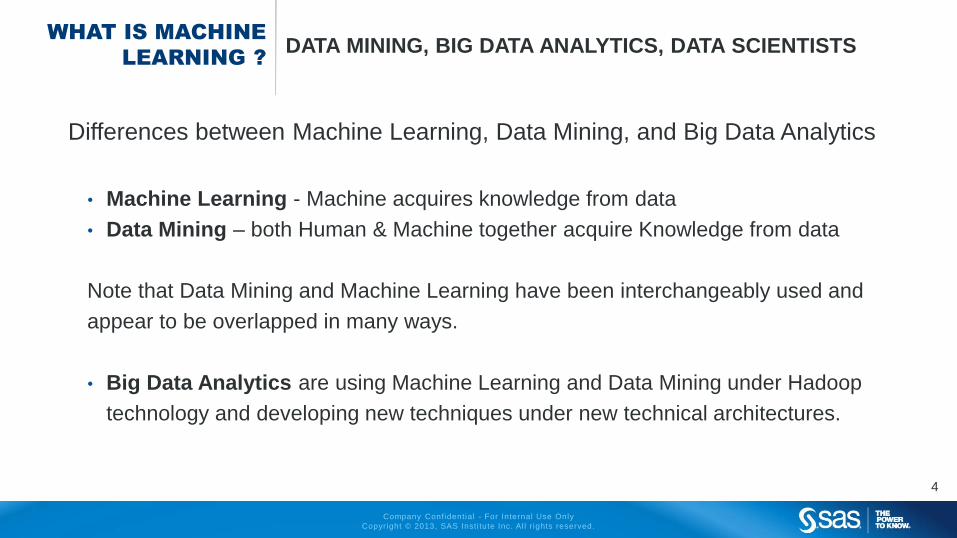
Differences between Machine Learning, Data Mining, and Big Data Analytics
• Machine Learning - Machine acquires knowledge from data
• Data Mining – both Human & Machine together acquire Knowledge from data
Note that Data Mining and Machine Learning have been interchangeably used and
appear to be overlapped in many ways.
• Big Data Analytics are using Machine Learning and Data Mining under Hadoop
technology and developing new techniques under new technical architectures.
Company Confidential - For Internal Use Only
Copyright © 2013, SAS Insti tute Inc. Al l r ights reserved.
WHAT IS MACHINE
LEARNING ?DATA MINING, BIG DATA ANALYTICS, DATA SCIENTISTS
5
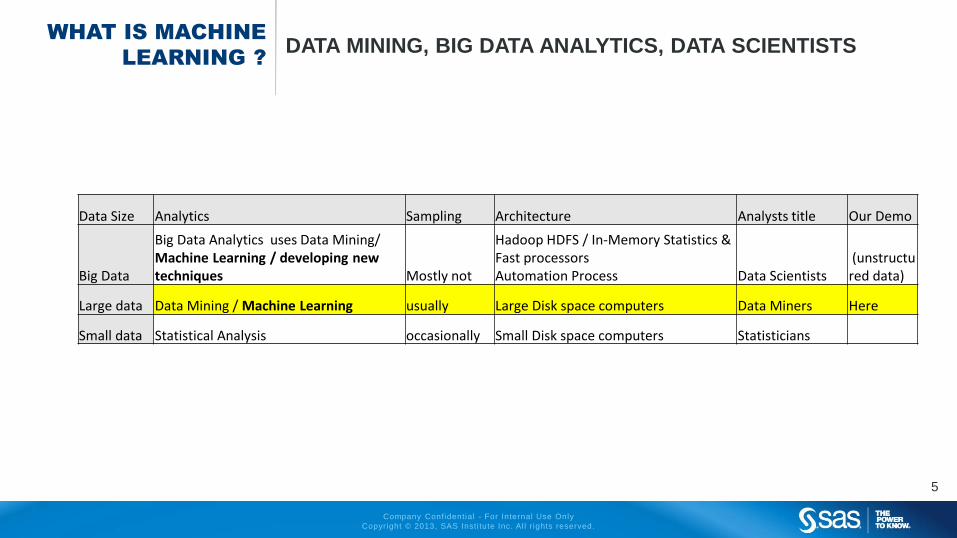
Data Size Analytics Sampling Architecture Analysts title Our Demo
Big Data
Big Data Analytics uses Data Mining/ Machine Learning / developing new techniques Mostly not
Hadoop HDFS / In-Memory Statistics & Fast processorsAutomation Process Data Scientists
(unstructured data)
Large data Data Mining / Machine Learning usually Large Disk space computers Data Miners Here
Small data Statistical Analysis occasionally Small Disk space computers Statisticians
Company Confidential - For Internal Use Only
Copyright © 2013, SAS Insti tute Inc. Al l r ights reserved.
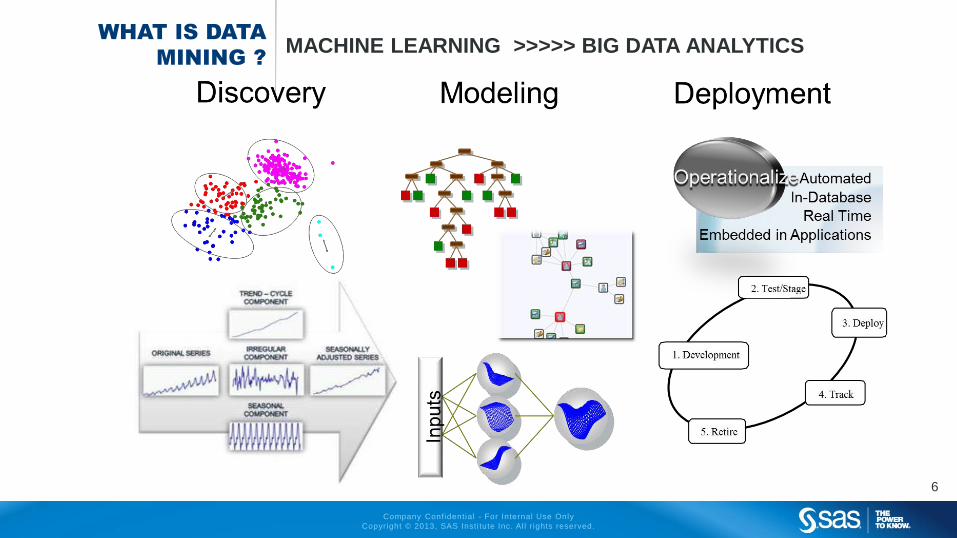
WHAT IS DATA
MINING ?MACHINE LEARNING >>>>> BIG DATA ANALYTICS
6

Company Confidential - For Internal Use Only
Copyright © 2013, SAS Insti tute Inc. Al l r ights reserved.
DATA MINING: MODEL DEVELOPMENT PROCESS
Sample Explore Modify Model Assess
Utility
Company Confidential - For Internal Use Only
Copyright © 2013, SAS Insti tute Inc. Al l r ights reserved.
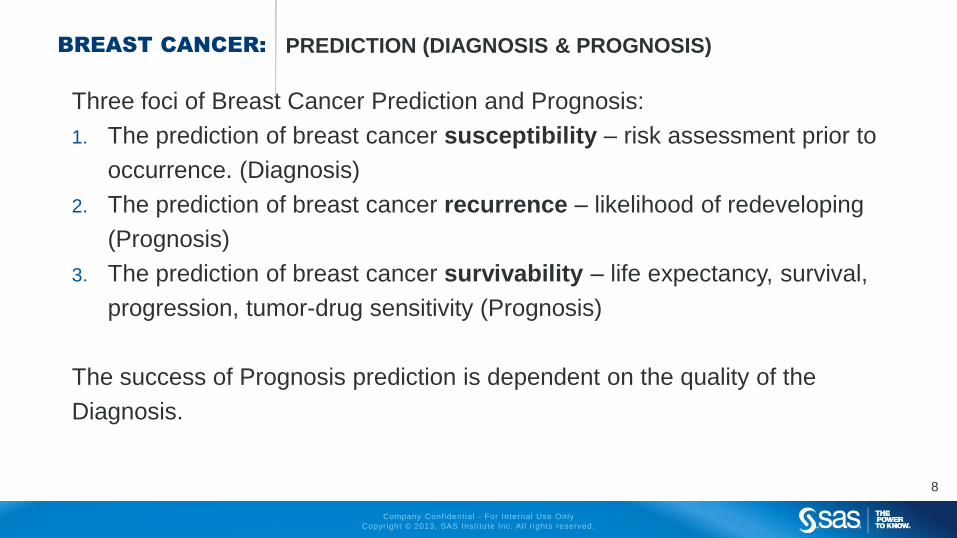
BREAST CANCER: PREDICTION (DIAGNOSIS & PROGNOSIS)
Three foci of Breast Cancer Prediction and Prognosis:
1. The prediction of breast cancer susceptibility – risk assessment prior to
occurrence. (Diagnosis)
2. The prediction of breast cancer recurrence – likelihood of redeveloping
(Prognosis)
3. The prediction of breast cancer survivability – life expectancy, survival,
progression, tumor-drug sensitivity (Prognosis)
The success of Prognosis prediction is dependent on the quality of the
Diagnosis.
8
Company Confidential - For Internal Use Only
Copyright © 2013, SAS Insti tute Inc. Al l r ights reserved.
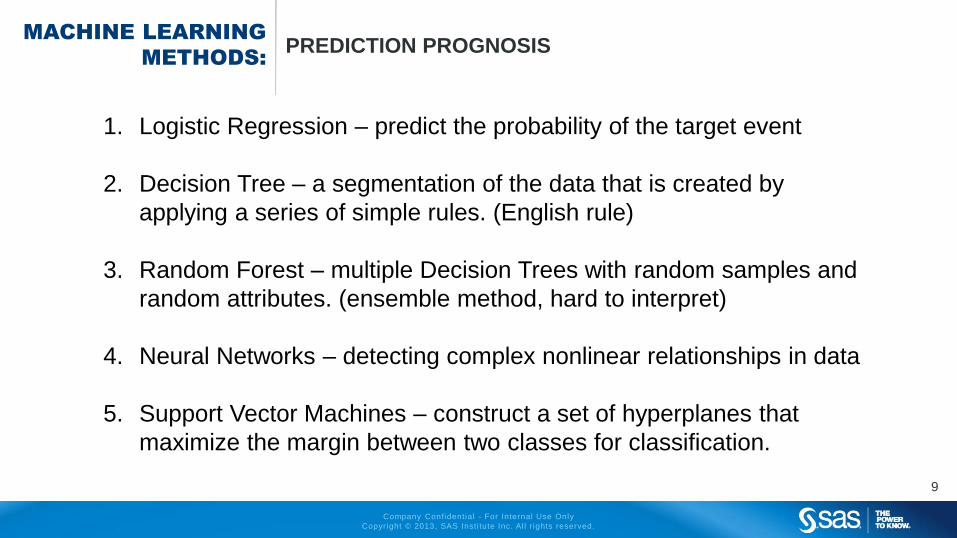
MACHINE LEARNING
METHODS:PREDICTION PROGNOSIS
9
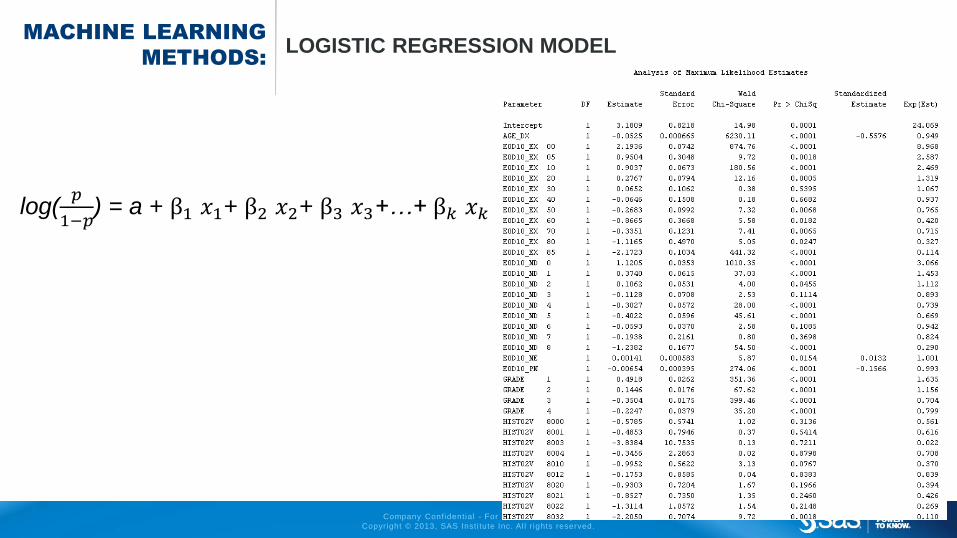
1. Logistic Regression – predict the probability of the target event
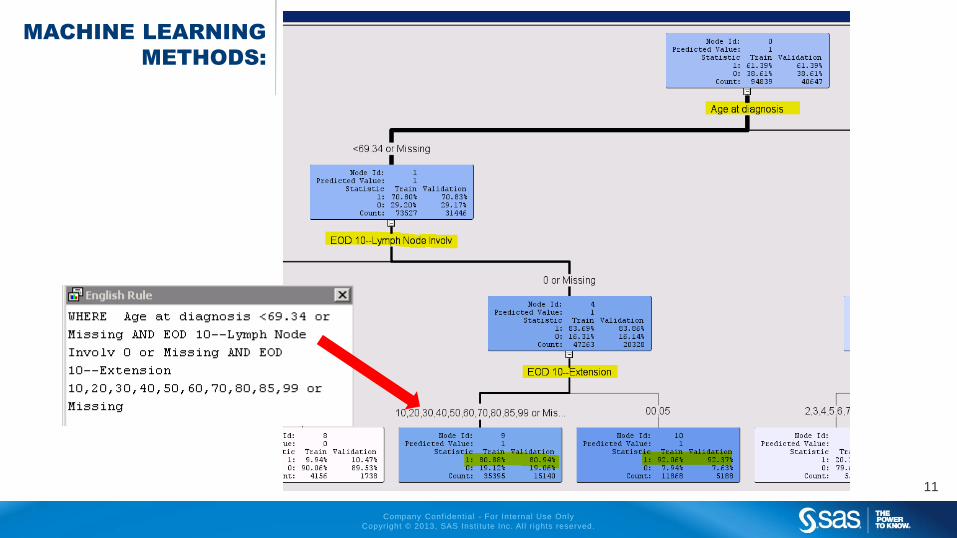
2. Decision Tree – a segmentation of the data that is created by
applying a series of simple rules. (English rule)
3. Random Forest – multiple Decision Trees with random samples and
random attributes. (ensemble method, hard to interpret)
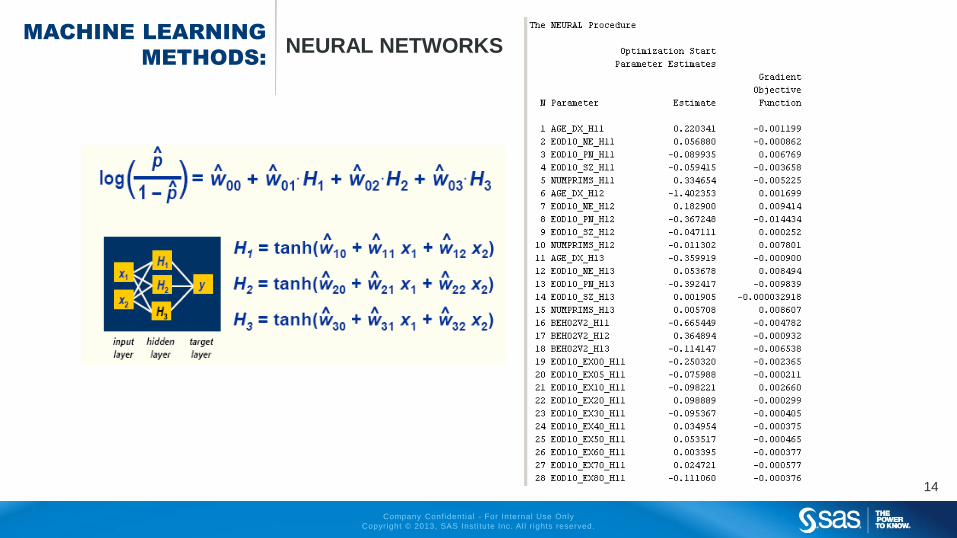
4. Neural Networks – detecting complex nonlinear relationships in data
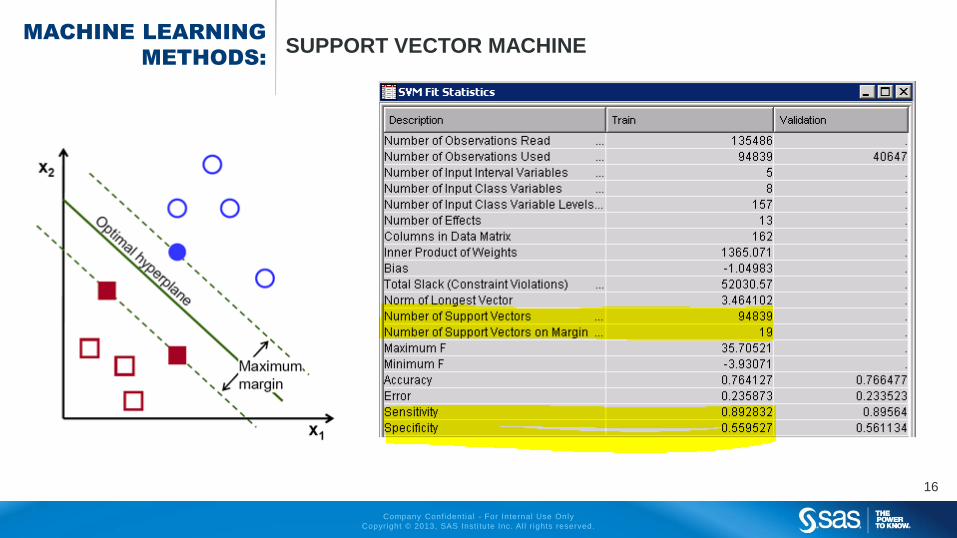
5. Support Vector Machines – construct a set of hyperplanes that
maximize the margin between two classes for classification.
Company Confidential - For Internal Use Only
Copyright © 2013, SAS Insti tute Inc. Al l r ights reserved.
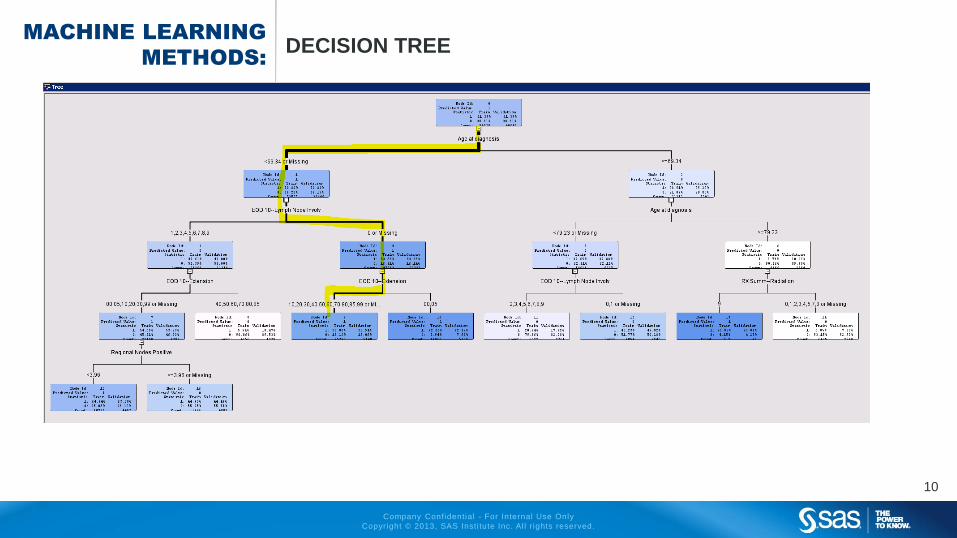
MACHINE LEARNING
METHODS:DECISION TREE
10
Company Confidential - For Internal Use Only
Copyright © 2013, SAS Insti tute Inc. Al l r ights reserved.
MACHINE LEARNING
METHODS:DECISION TREE
11

Company Confidential - For Internal Use Only
Copyright © 2013, SAS Insti tute Inc. Al l r ights reserved.
MACHINE LEARNING
METHODS: RANDOM FOREST
12
Company Confidential - For Internal Use Only
Copyright © 2013, SAS Insti tute Inc. Al l r ights reserved.
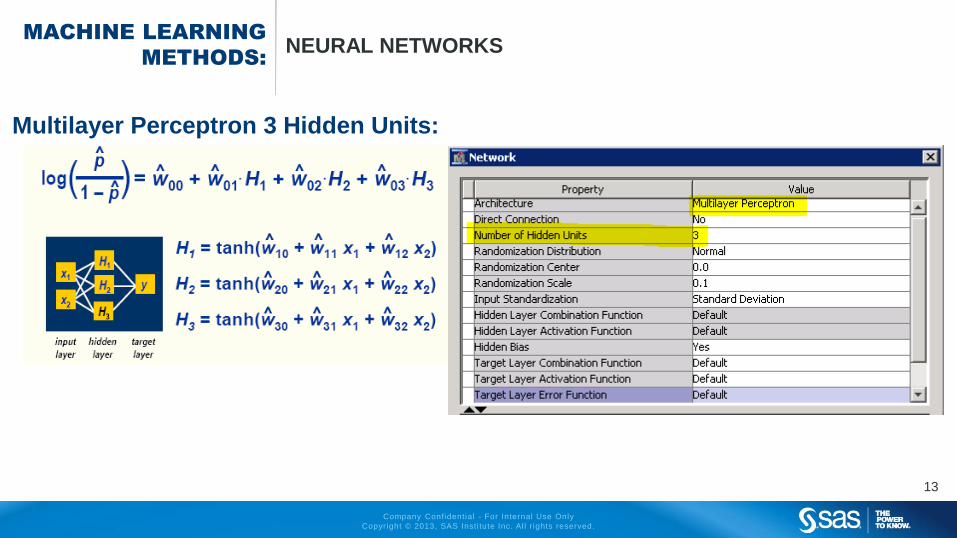
MACHINE LEARNING
METHODS:NEURAL NETWORKS
Multilayer Perceptron 3 Hidden Units:
13
Company Confidential - For Internal Use Only
Copyright © 2013, SAS Insti tute Inc. Al l r ights reserved.
MACHINE LEARNING
METHODS:NEURAL NETWORKS
14
Company Confidential - For Internal Use Only
Copyright © 2013, SAS Insti tute Inc. Al l r ights reserved.
MACHINE LEARNING
METHODS:LOGISTIC REGRESSION MODEL
15
log(𝑝
1−𝑝) = a + β1 𝑥1+ β2 𝑥2+ β3 𝑥3+…+ β𝑘 𝑥𝑘
Company Confidential - For Internal Use Only
Copyright © 2013, SAS Insti tute Inc. Al l r ights reserved.
MACHINE LEARNING
METHODS:SUPPORT VECTOR MACHINE
16
Company Confidential - For Internal Use Only
Copyright © 2013, SAS Insti tute Inc. Al l r ights reserved.
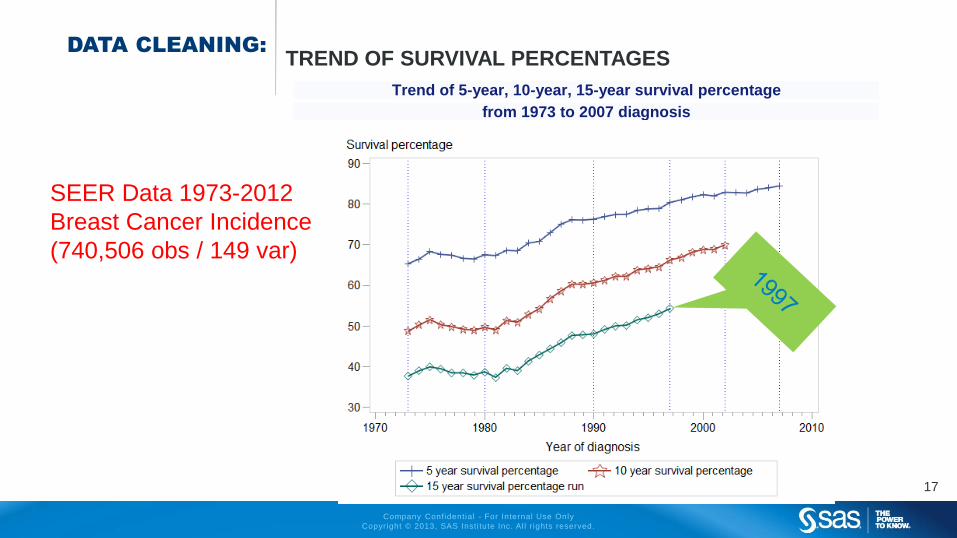
Trend of 5-year, 10-year, 15-year survival percentage
from 1973 to 2007 diagnosis
DATA CLEANING:
TREND OF SURVIVAL PERCENTAGES
17
SEER Data 1973-2012
Breast Cancer Incidence
(740,506 obs / 149 var)
Company Confidential - For Internal Use Only
Copyright © 2013, SAS Insti tute Inc. Al l r ights reserved.
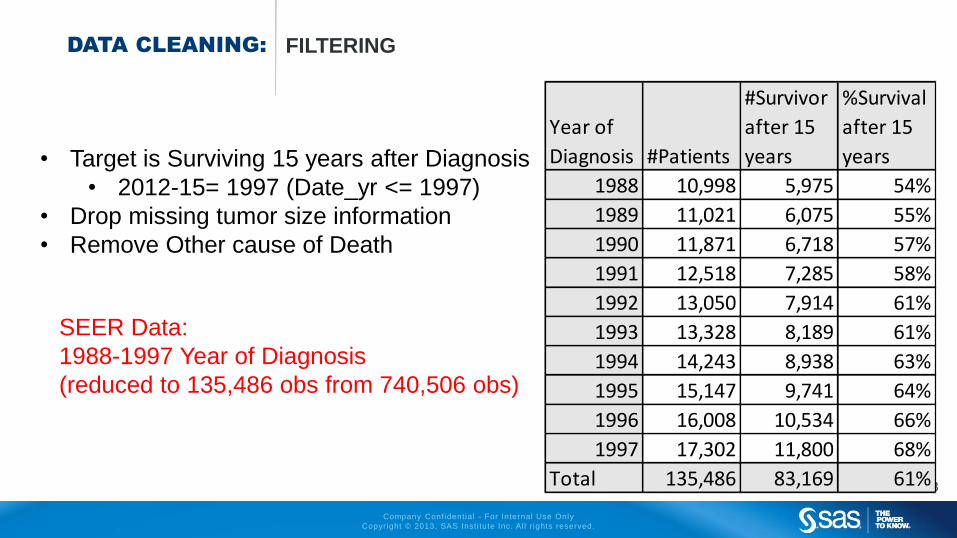
DATA CLEANING: FILTERING
18
• Target is Surviving 15 years after Diagnosis
• 2012-15= 1997 (Date_yr <= 1997)
• Drop missing tumor size information
• Remove Other cause of Death
Year of
Diagnosis #Patients
#Survivor
after 15
years
%Survival
after 15
years
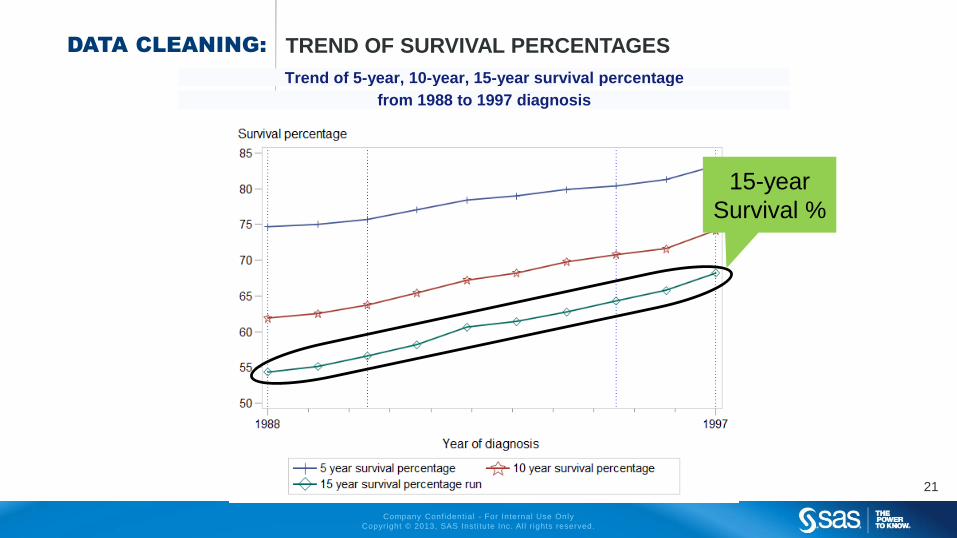
1988 10,998 5,975 54%
1989 11,021 6,075 55%
1990 11,871 6,718 57%
1991 12,518 7,285 58%
1992 13,050 7,914 61%
1993 13,328 8,189 61%
1994 14,243 8,938 63%
1995 15,147 9,741 64%
1996 16,008 10,534 66%
1997 17,302 11,800 68%
Total 135,486 83,169 61%
SEER Data:
1988-1997 Year of Diagnosis
(reduced to 135,486 obs from 740,506 obs)
Company Confidential - For Internal Use Only
Copyright © 2013, SAS Insti tute Inc. Al l r ights reserved.
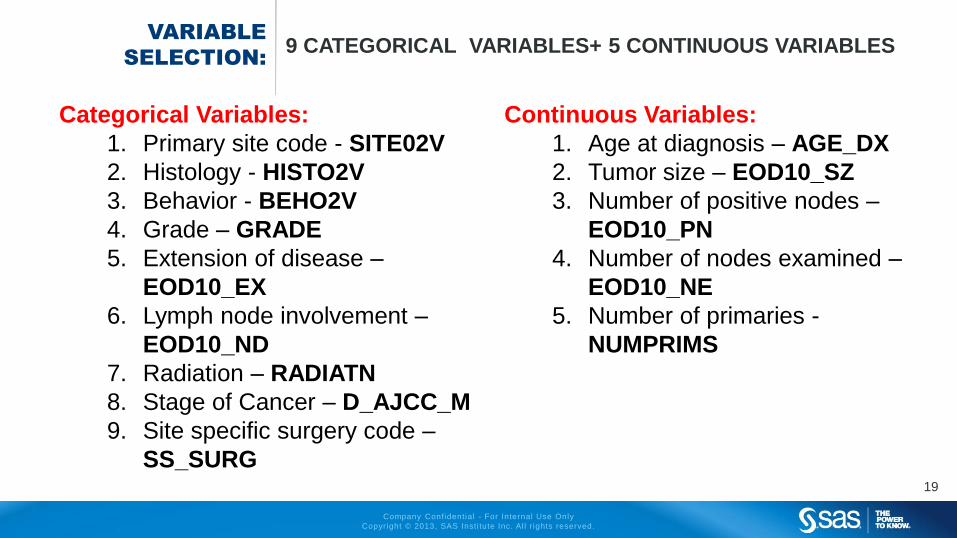
VARIABLE
SELECTION:9 CATEGORICAL VARIABLES+ 5 CONTINUOUS VARIABLES
19
Categorical Variables:
1. Primary site code - SITE02V
2. Histology - HISTO2V
3. Behavior - BEHO2V
4. Grade – GRADE
5. Extension of disease –
EOD10_EX
6. Lymph node involvement –
EOD10_ND
7. Radiation – RADIATN
8. Stage of Cancer – D_AJCC_M
9. Site specific surgery code –
SS_SURG
Continuous Variables:
1. Age at diagnosis – AGE_DX
2. Tumor size – EOD10_SZ
3. Number of positive nodes –
EOD10_PN
4. Number of nodes examined –
EOD10_NE
5. Number of primaries -
NUMPRIMS

Company Confidential - For Internal Use Only
Copyright © 2013, SAS Insti tute Inc. Al l r ights reserved.
Trend of 5-year, 10-year, 15-year survival percentage
from 1973 to 2007 diagnosis
DATA CLEANING: TREND OF SURVIVAL PERCENTAGES
20
Company Confidential - For Internal Use Only
Copyright © 2013, SAS Insti tute Inc. Al l r ights reserved.
DATA CLEANING: TREND OF SURVIVAL PERCENTAGES
21
Trend of 5-year, 10-year, 15-year survival percentage
from 1988 to 1997 diagnosis
15-year
Survival %

Company Confidential - For Internal Use Only
Copyright © 2013, SAS Insti tute Inc. Al l r ights reserved.
MACHINE LEARNING
DATA MINING:MODELING PROCESS
22
Data Partitioned
40% Training data
30% Validation data
30% Test dataModel selection Criteria:
Validation ROC Index
Company Confidential - For Internal Use Only
Copyright © 2013, SAS Insti tute Inc. Al l r ights reserved.
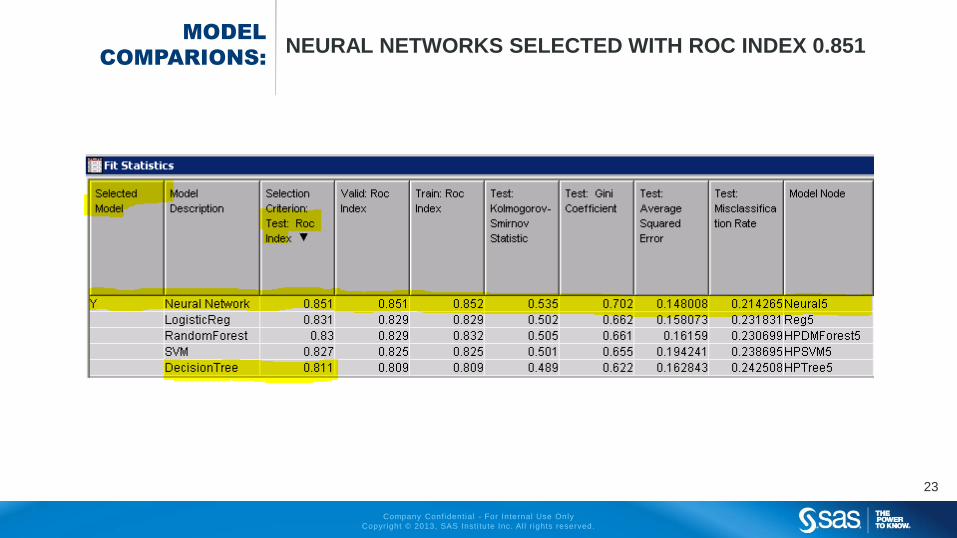
MODEL
COMPARIONS:NEURAL NETWORKS SELECTED WITH ROC INDEX 0.851
23
Company Confidential - For Internal Use Only
Copyright © 2013, SAS Insti tute Inc. Al l r ights reserved.
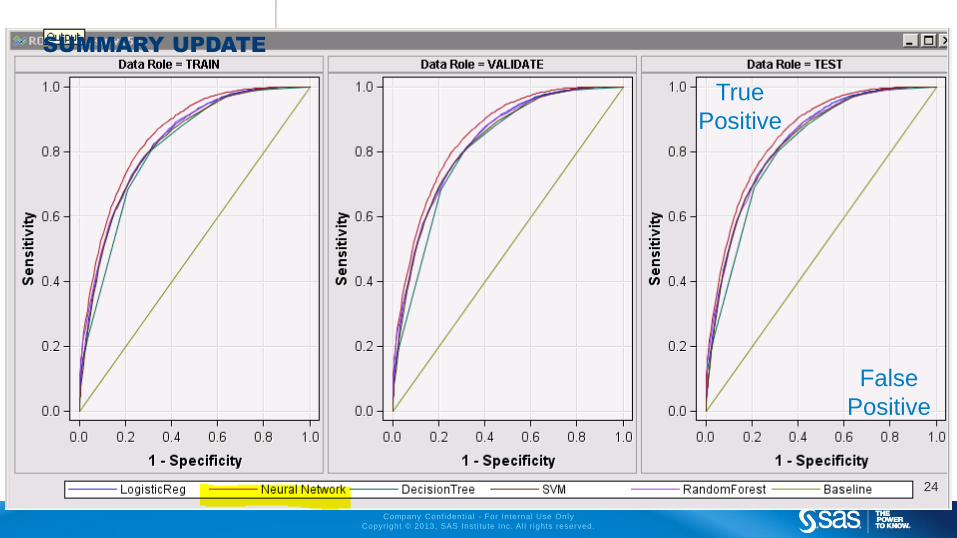
SUMMARY UPDATE
24
True
Positive
False
Positive

Company Confidential - For Internal Use Only
Copyright © 2013, SAS Insti tute Inc. Al l r ights reserved.
FALSE POSITIVE: INCORRECTLY PREDICTED SURVIVALS
25
target output
1= survival 1=survival true positive
0=die 1=survival false postive
1=survival 0=die false negative
0=die 0=die true negative
Decision Tree
has the smallest
False Positive.
Neural Network TRAIN 3955 13349 7578 29313
Neural Network VALIDATE 2980 9918 5777 21970 0.851
LogisticReg TRAIN 4073 12384 8543 29195
LogisticReg VALIDATE 3066 9290 6405 21884 0.831
RandomForest TRAIN 3664 12163 8764 29604
RandomForest VALIDATE 2783 9095 6600 22167 0.83
SVM TRAIN 3523 11436 9491 29745
SVM VALIDATE 2640 8514 7181 22310 0.827
DecisionTree TRAIN 6548 14344 6583 26720
DecisionTree VALIDATE 4899 10757 4938 20051 0.811
TRUE
Positive ROC Index
Model Selection based on Validation data: ROC Index
Event Classification Table
Model Data Role
FALSE
Negative
TRUE
Negative
FALSE
Positive
Company Confidential - For Internal Use Only
Copyright © 2013, SAS Insti tute Inc. Al l r ights reserved.
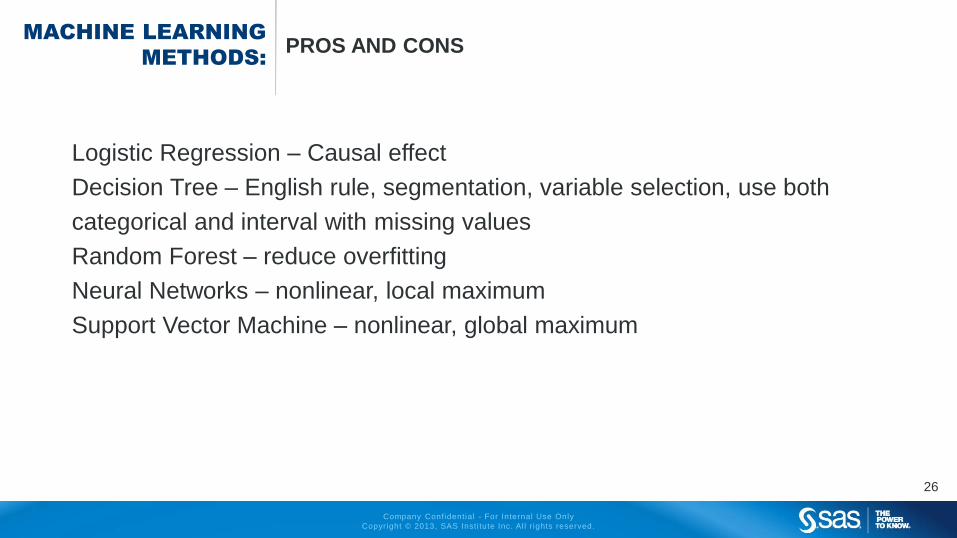
MACHINE LEARNING
METHODS:PROS AND CONS
Logistic Regression – Causal effect
Decision Tree – English rule, segmentation, variable selection, use both
categorical and interval with missing values
Random Forest – reduce overfitting
Neural Networks – nonlinear, local maximum
Support Vector Machine – nonlinear, global maximum
26
Company Confidential - For Internal Use Only
Copyright © 2013, SAS Insti tute Inc. Al l r ights reserved.
SUMMARY AND
FUTURE RESEARCH:
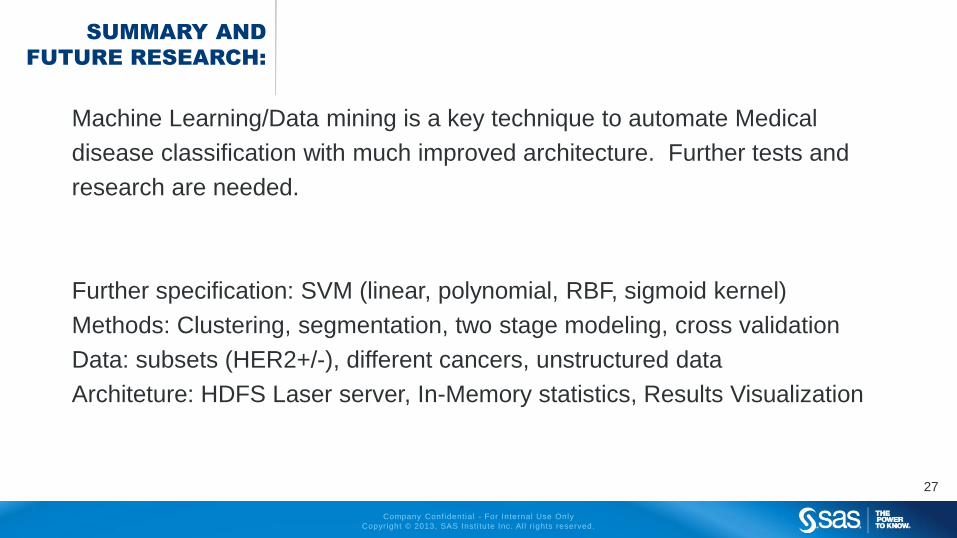
Machine Learning/Data mining is a key technique to automate Medical
disease classification with much improved architecture. Further tests and
research are needed.
Further specification: SVM (linear, polynomial, RBF, sigmoid kernel)
Methods: Clustering, segmentation, two stage modeling, cross validation
Data: subsets (HER2+/-), different cancers, unstructured data
Architeture: HDFS Laser server, In-Memory statistics, Results Visualization
27

Company Confidential - For Internal Use Only
Copyright © 2013, SAS Insti tute Inc. Al l r ights reserved.
THANK YOU!
ISF 2015 – 24 JUNE 2014
Tae Yoon Lee & Youngme Seo
Company Confidential - For Internal Use Only
Copyright © 2013, SAS Insti tute Inc. Al l r ights reserved.
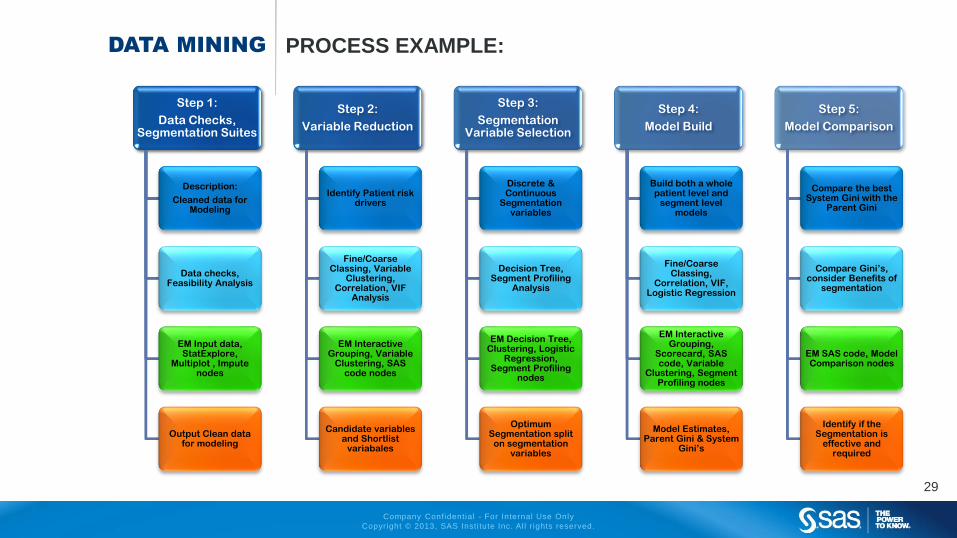
DATA MINING PROCESS EXAMPLE:
29
Step 1:
Data Checks, Segmentation Suites
Description:
Cleaned data for Modeling
Data checks, Feasibility Analysis
EM Input data, StatExplore,
Multiplot , Impute nodes
Output Clean data for modeling
Step 2:
Variable Reduction
Identify Patient risk drivers
Fine/Coarse Classing, Variable
Clustering, Correlation, VIF
Analysis
EM Interactive Grouping, Variable
Clustering, SAS code nodes
Candidate variables and Shortlist
variabales
Step 3:
Segmentation Variable Selection
Discrete & Continuous
Segmentation variables
Decision Tree, Segment Profiling
Analysis
EM Decision Tree, Clustering, Logistic
Regression, Segment Profiling
nodes
Optimum Segmentation split
on segmentation variables
Step 4:
Model Build
Build both a whole patient level and
segment level models
Fine/Coarse Classing,
Correlation, VIF, Logistic Regression
EM Interactive Grouping,
Scorecard, SAS code, Variable
Clustering, Segment Profiling nodes
Model Estimates, Parent Gini & System
Gini’s
Step 5:
Model Comparison
Compare the best System Gini with the
Parent Gini
Compare Gini’s, consider Benefits of
segmentation
EM SAS code, Model Comparison nodes
Identify if the Segmentation is
effective and required

Company Confidential - For Internal Use Only
Copyright © 2013, SAS Insti tute Inc. Al l r ights reserved.
MACHINE LEARNING
METHODS:DECISION TREE
Decision Tree
30

Company Confidential - For Internal Use Only
Copyright © 2013, SAS Insti tute Inc. Al l r ights reserved.
VARIABLE
SELECTION:9 CATEGORICAL VARIABLES+ 5 CONTINUOUS VARIABLES
31
Categorical Variables:
1. Primary site code - SITE02V
2. Histology - HISTO2V
3. Behavior - BEHO2V
4. Grade – GRADE
5. Extension of disease –
EOD10_EX
6. Lymph node involvement –
EOD10_ND
7. Radiation – RADIATN
8. Stage of Cancer – D_AJCC_M
9. Site specific surgery code –
SS_SURG
Continuous Variables:
1. Age at diagnosis – AGE_DX
2. Tumor size – EOD10_SZ
3. Number of positive nodes –
EOD10_PN
4. Number of nodes examined –
EOD10_NE
5. Number of primaries -
NUMPRIMS


![JCO, Prediction of Breast and Prostate Cancer Risks … › ... › PSA-Testing-Appeal … · Web view[Exhibits C and D] The American Cancer Society recommends prostate cancer screening](https://img.pdfslide.us/doc/110x75/5f02ddaf7e708231d40665cf/jco-prediction-of-breast-and-prostate-cancer-risks-a-a-psa-testing-appeal.jpg)