Embed Size (px)
Citation preview
1
Supplementary Materials:
Figure S1. Macrophages in culture. Phase contrast (left) and GFP (right) representative images
of mouse macrophages cultured for 10 days with macrophage CSF. Scale bar, 100 um.
Phas
e co
ntra
st
GFP
2
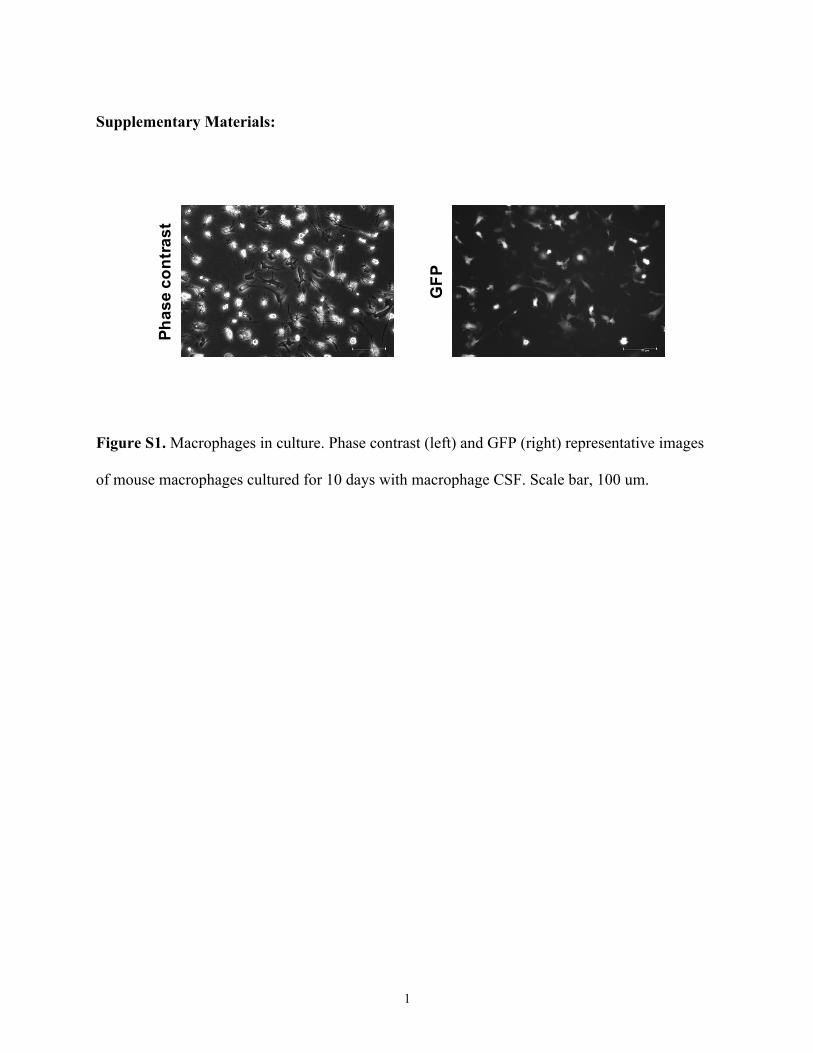
Figure S2. Post-transplantation survival of macrophages in full thickness excisional wounds. (A)
In vivo imaging of macrophage survival in wounds compared to control wounds by luciferase
bioluminescence (*p<0.05 for days 1, 3, and 5; 2 tailed unpaired Student’s t test; n=10 per
group). (B) Histologic analysis of GFP fluorescence in macrophage-treated wounds at days 1, 3,
5, and 7 post-transplantation. Scale bar, 100 um.
A BDay 1 Day 3
Day 5 Day 7
DAPIGFP
3
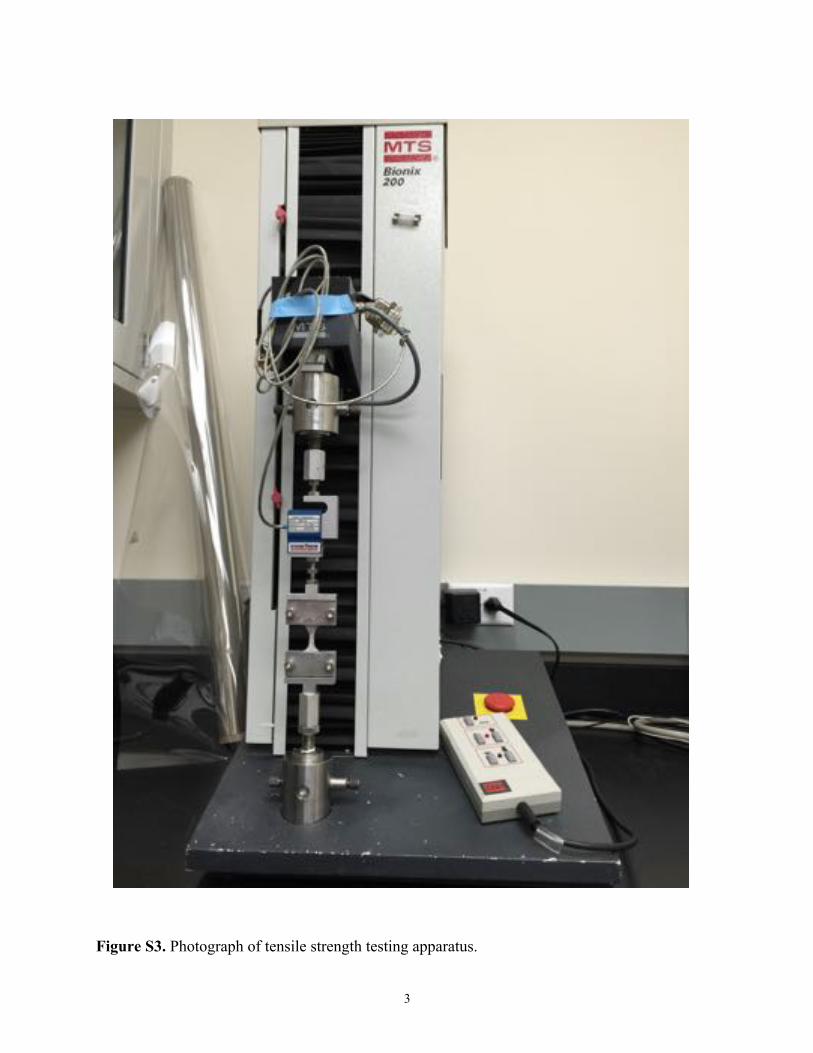
Figure S3. Photograph of tensile strength testing apparatus.
4
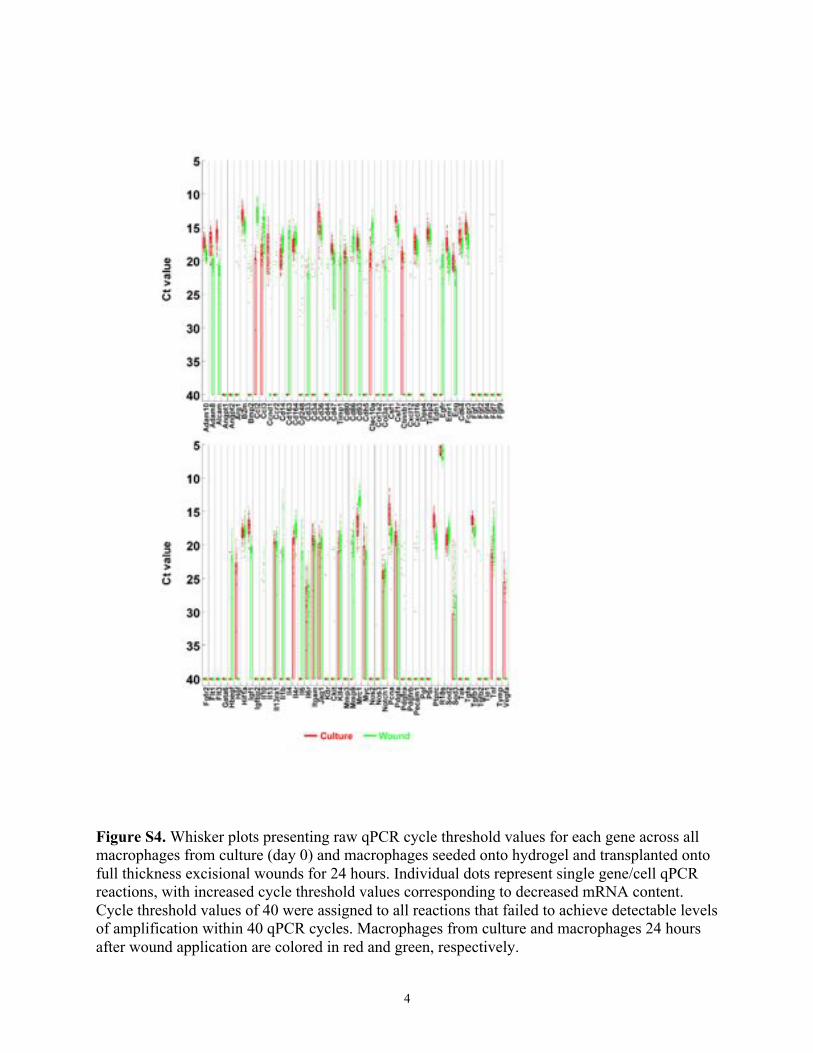
Figure S4. Whisker plots presenting raw qPCR cycle threshold values for each gene across all macrophages from culture (day 0) and macrophages seeded onto hydrogel and transplanted onto full thickness excisional wounds for 24 hours. Individual dots represent single gene/cell qPCR reactions, with increased cycle threshold values corresponding to decreased mRNA content. Cycle threshold values of 40 were assigned to all reactions that failed to achieve detectable levels of amplification within 40 qPCR cycles. Macrophages from culture and macrophages 24 hours after wound application are colored in red and green, respectively.
5
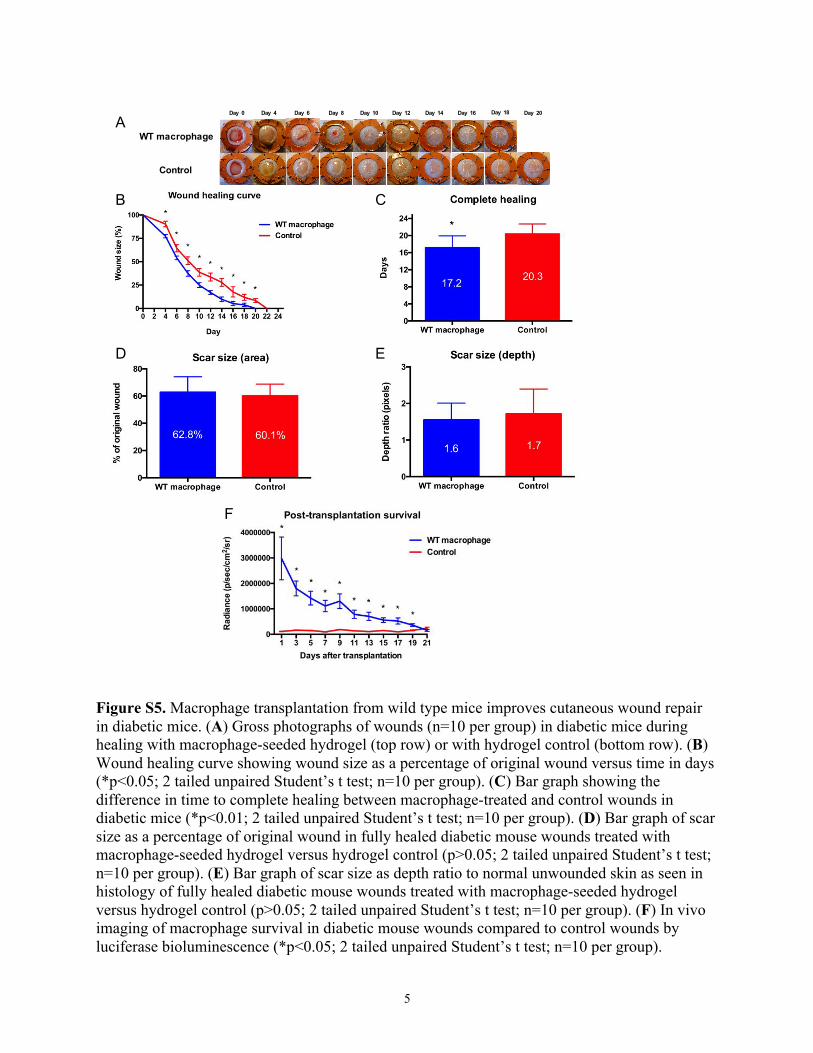
Figure S5. Macrophage transplantation from wild type mice improves cutaneous wound repair in diabetic mice. (A) Gross photographs of wounds (n=10 per group) in diabetic mice during healing with macrophage-seeded hydrogel (top row) or with hydrogel control (bottom row). (B) Wound healing curve showing wound size as a percentage of original wound versus time in days (*p<0.05; 2 tailed unpaired Student’s t test; n=10 per group). (C) Bar graph showing the difference in time to complete healing between macrophage-treated and control wounds in diabetic mice (*p<0.01; 2 tailed unpaired Student’s t test; n=10 per group). (D) Bar graph of scar size as a percentage of original wound in fully healed diabetic mouse wounds treated with macrophage-seeded hydrogel versus hydrogel control (p>0.05; 2 tailed unpaired Student’s t test; n=10 per group). (E) Bar graph of scar size as depth ratio to normal unwounded skin as seen in histology of fully healed diabetic mouse wounds treated with macrophage-seeded hydrogel versus hydrogel control (p>0.05; 2 tailed unpaired Student’s t test; n=10 per group). (F) In vivo imaging of macrophage survival in diabetic mouse wounds compared to control wounds by luciferase bioluminescence (*p<0.05; 2 tailed unpaired Student’s t test; n=10 per group).
A
B C
D E
F
Control
Day 0 Day 4 Day 6 Day 8 Day 10 Day 12 Day 14 Day 16 Day 18 Day 20
WT macrophage
6
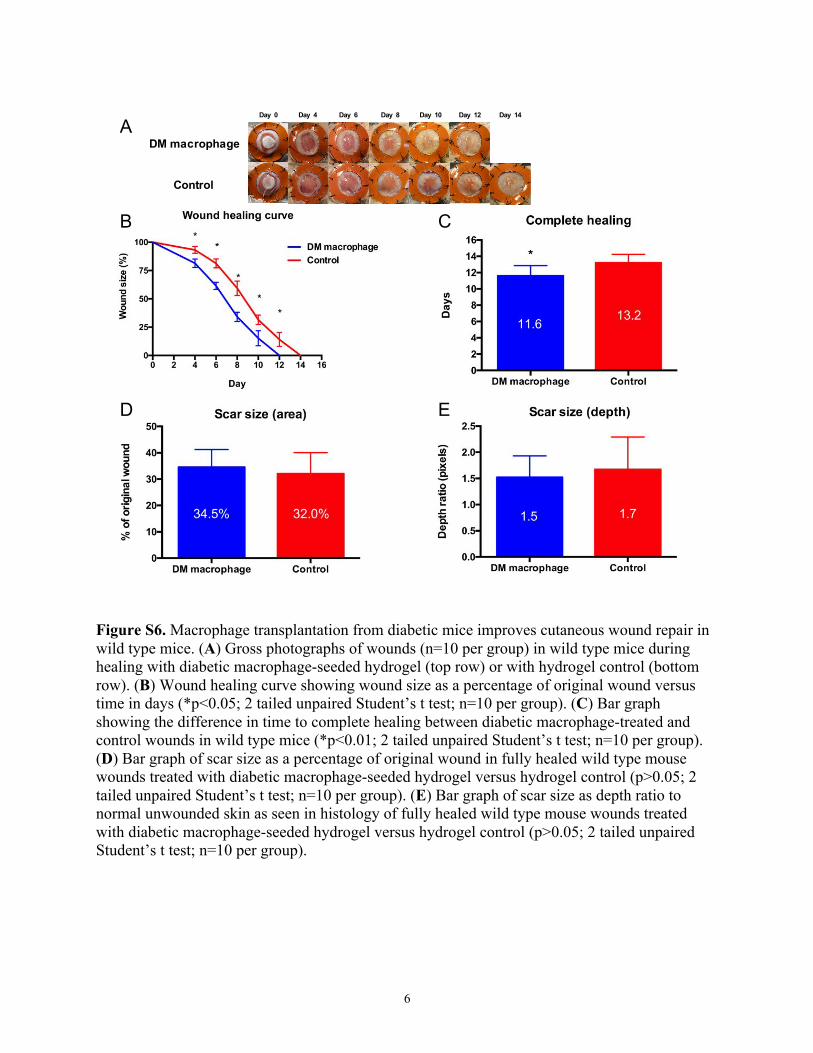
Figure S6. Macrophage transplantation from diabetic mice improves cutaneous wound repair in wild type mice. (A) Gross photographs of wounds (n=10 per group) in wild type mice during healing with diabetic macrophage-seeded hydrogel (top row) or with hydrogel control (bottom row). (B) Wound healing curve showing wound size as a percentage of original wound versus time in days (*p<0.05; 2 tailed unpaired Student’s t test; n=10 per group). (C) Bar graph showing the difference in time to complete healing between diabetic macrophage-treated and control wounds in wild type mice (*p<0.01; 2 tailed unpaired Student’s t test; n=10 per group). (D) Bar graph of scar size as a percentage of original wound in fully healed wild type mouse wounds treated with diabetic macrophage-seeded hydrogel versus hydrogel control (p>0.05; 2 tailed unpaired Student’s t test; n=10 per group). (E) Bar graph of scar size as depth ratio to normal unwounded skin as seen in histology of fully healed wild type mouse wounds treated with diabetic macrophage-seeded hydrogel versus hydrogel control (p>0.05; 2 tailed unpaired Student’s t test; n=10 per group).
A
B C
D E
DM macrophage
Control
Day 0 Day 4 Day 6 Day 8 Day 10 Day 12 Day 14
7
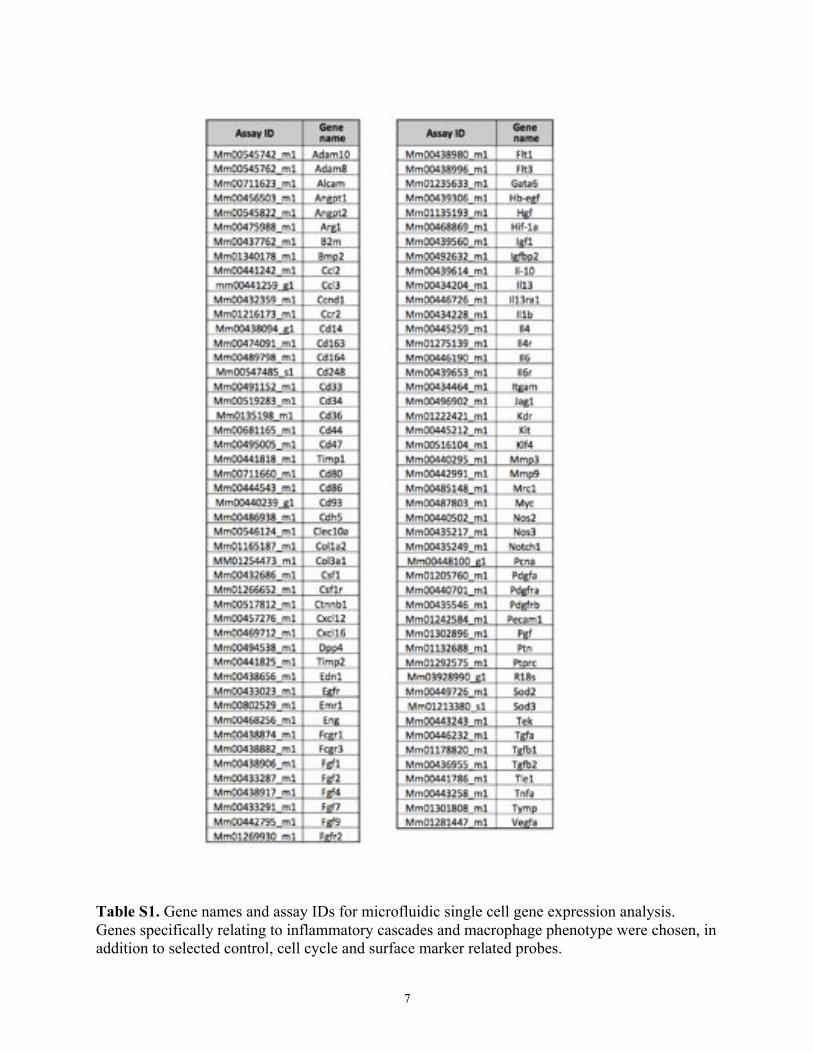
Table S1. Gene names and assay IDs for microfluidic single cell gene expression analysis. Genes specifically relating to inflammatory cascades and macrophage phenotype were chosen, in addition to selected control, cell cycle and surface marker related probes.