Embed Size (px)
Citation preview

DEMOGRAPHIC RESEARCH VOLUME 32, ARTICLE 42, PAGES 1147−1176 PUBLISHED 3 JUNE 2015 http://www.demographic-research.org/Volumes/Vol32/42/ DOI: 10.4054/DemRes.2015.32.42 Research Article
Emerging, transitory or residual? One-person households in Viet Nam
Christophe Z. Guilmoto
Myriam de Loenzien
This publication is part of the Special Collection on “Living alone: One-person households in Asia,” organized by Guest Editors Wei-Jun Jean Yeung and Adam Ka-Lok Cheung. © 2015 Christophe Z. Guilmoto & Myriam de Loenzien. This open-access work is published under the terms of the Creative Commons Attribution NonCommercial License 2.0 Germany, which permits use, reproduction & distribution in any medium for non-commercial purposes, provided the original author(s) and source are given credit. See http://creativecommons.org/licenses/by-nc/2.0/de/

Table of Contents
1 Introduction 1148 2 Data and methodology used for a disaggregated analysis of
household 1148
3 The Vietnamese context 1150 4 Household size in Viet Nam and its evolution 1152 5 Sociodemographic profile of people living in a one-person
household 1154
6 Determinants of living in a one-person household 1158 7 Living alone: Four different profiles 1160 8 Widowhood and isolation 1165 9 Discussion and conclusion 1168 10 Acknowledgements 1169 References 1170 Appendix 1: Census variables 1173 Appendix 2: Educational, regional, and socioeconomic
characteristics of cluster groups 1174

Demographic Research: Volume 32, Article 42 Research Article
http://www.demographic-research.org 1147
Emerging, transitory or residual? One-person households in Viet Nam
Christophe Z. Guilmoto1
Myriam de Loenzien2
Abstract
BACKGROUND The rise of one-person households in Viet Nam remains poorly documented, in spite of its significant growth since the 1990s and its relevance to the understanding of social and demographic change.
OBJECTIVE We aim to present a systematic analysis of the growing number of one-person households, interpret recent trends and describe the main characteristics of the population living alone.
METHODS Our research is drawn from the 2009 census. Cross-tabulations are followed by regression analysis modelling of the probability of living alone. A cluster analysis identifies the profiles of people in one-person households. Finally an in-depth analysis of the most vulnerable type of one-person households is done.
RESULTS AND CONCLUSIONS Our analysis stresses the heterogeneity of the population living alone, in which we can identify four distinct profiles. The largest cluster is comprised of elderly widows and widowers. It arguably constitutes the most fragile population segment, as illustrated by several health and economic indicators. The second cluster comprises a more heterogeneous population, but only composed of persons who have not moved during the last five years. The third and fourth clusters are made up of migrants. Along with age, marital status tends to be the primary factor explaining the probability of a person living alone in Viet Nam. However, the rise in one-person households may be as much related to the gradual changes in marital status, illustrated by delayed marriage, as to the increase in mobility and the relative weakening of traditional family patterns.
1 Institut de recherche pour le développement (IRD), France. E-Mail: [email protected]. 2 Institut de recherche pour le développement (IRD), France.

Guilmoto & de Loenzien: Emerging, transitory or residual? One-person households in Viet Nam
1148 http://www.demographic-research.org
1. Introduction
Viet Nam has experienced rapid demographic changes over the last three decades, illustrated by the now almost completed fertility transition and the intensification of migration across the country. In contrast with these phenomena, accompanying changes in household structures are poorly documented even when they reflect crucial transformations in the social and demographic fabric of contemporary Vietnamese society. In particular, there is no research devoted to the trends affecting the population living alone, in spite of its significant growth since the 1990s.
This paper presents a systematic analysis of the growing number of one-person households observable in the country. We will begin with a presentation of the data used and an overview of the Vietnamese context and of household structures to highlight the variety of family arrangements during the last census. The subsequent part of the paper focuses on people living in one-member households, and their specific demographic and social characteristics, highlighting their extreme diversity. In particular, we will use a logistic regression model to describe the probability of belonging to a one-member household, in order to distinguish the relative effects of age, sex, marital status, economic situation and residence. We will also employ a cluster analysis of our sample of households to identify some of the main categories of people living as one-member households in Viet Nam. This cluster analysis leads to a preliminary analysis of a specific subgroup of people living alone in Viet Nam that is composed of widows and widowers. In the conclusion, we sum up our findings and discuss some of their implications.
2. Data and methodology used for a disaggregated analysis of household
Our analysis is based on the micro-data drawn from the 2009 census of Viet Nam. Compared with other data sources, such as the sample surveys recently conducted in the country, this source presents several advantages as well as limitations.
The major asset of using the census dataset is its size, and this is the first reason why we are using it for our analysis. Census micro-data are based on the long-form questionnaire that was used for 15% of the population in 2009. As such, it covers 14.2 million individuals and 3.7 million households.3 In comparison, the regular Household Viet Nam Living Standards Survey (VLSS) (conducted since the early 1990s) is much smaller. The most recent VLSS round covered 69,360 households in 2010 and is
3 The entire dataset can be downloaded through the IPUMS website.
Demographic Research: Volume 32, Article 42
http://www.demographic-research.org 1149
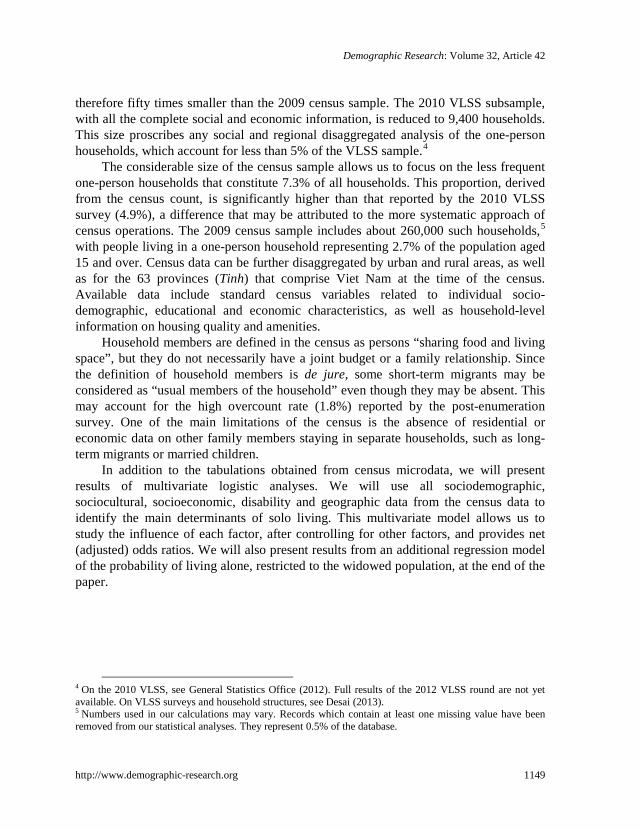
therefore fifty times smaller than the 2009 census sample. The 2010 VLSS subsample, with all the complete social and economic information, is reduced to 9,400 households. This size proscribes any social and regional disaggregated analysis of the one-person households, which account for less than 5% of the VLSS sample.4
The considerable size of the census sample allows us to focus on the less frequent one-person households that constitute 7.3% of all households. This proportion, derived from the census count, is significantly higher than that reported by the 2010 VLSS survey (4.9%), a difference that may be attributed to the more systematic approach of census operations. The 2009 census sample includes about 260,000 such households,5 with people living in a one-person household representing 2.7% of the population aged 15 and over. Census data can be further disaggregated by urban and rural areas, as well as for the 63 provinces (Tinh) that comprise Viet Nam at the time of the census. Available data include standard census variables related to individual socio-demographic, educational and economic characteristics, as well as household-level information on housing quality and amenities.
Household members are defined in the census as persons “sharing food and living space”, but they do not necessarily have a joint budget or a family relationship. Since the definition of household members is de jure, some short-term migrants may be considered as “usual members of the household” even though they may be absent. This may account for the high overcount rate (1.8%) reported by the post-enumeration survey. One of the main limitations of the census is the absence of residential or economic data on other family members staying in separate households, such as long-term migrants or married children.
In addition to the tabulations obtained from census microdata, we will present results of multivariate logistic analyses. We will use all sociodemographic, sociocultural, socioeconomic, disability and geographic data from the census data to identify the main determinants of solo living. This multivariate model allows us to study the influence of each factor, after controlling for other factors, and provides net (adjusted) odds ratios. We will also present results from an additional regression model of the probability of living alone, restricted to the widowed population, at the end of the paper.
4 On the 2010 VLSS, see General Statistics Office (2012). Full results of the 2012 VLSS round are not yet available. On VLSS surveys and household structures, see Desai (2013). 5 Numbers used in our calculations may vary. Records which contain at least one missing value have been removed from our statistical analyses. They represent 0.5% of the database.

Guilmoto & de Loenzien: Emerging, transitory or residual? One-person households in Viet Nam
1150 http://www.demographic-research.org
3. The Vietnamese context
The recent trends over the last 20 years suggest that the reduction in the average size of the households in Viet Nam has accelerated during the last intercensal decade, from 4.5 persons per household in 1999 to 3.8 in 2009. Given that fertility has only declined from 2.2 children per woman to 1.9 during the same period this diminution seems rather rapid. In fact, the decrease in average household size is not only due to the reduction in the average number of children per couple, but also to a change in household composition. A gradual process of household fragmentation is taking place in the country. For instance, larger, more complex households are becoming less frequent, while the share of smaller households is rising. Another facet of these changes is the rapid increase in the number of one-person households observed in Viet Nam, a type of household that used to be rare in the past. In 1989, these households accounted for 5% of all households declining to 4.4% in 1999. But in 2009, this share surged to 7.3%, a sudden change that contributed to the overall decline in the average household size.6 According to the recent data from the Intercensal Population Survey of 2014, one-person households even account for 8% of all households in 2014 (preliminary estimation by the authors).
This level is already above the level encountered in South Asia (Dommaraju 2013), while slightly below what is observed in neighboring China with which Viet Nam shares many common socioeconomic, political and cultural characteristics (Cheung and Yeung 2013; Feng et al. 2013). Compared to Viet Nam, the proportion of one-person households is, however, far higher in richer countries such as South Korea or Japan, which are closer to western countries where more than a quarter of the households include only one person (Klinenberg 2012; Jamieson and Simpson 2013; Gram-Hanssen, Scherg, and Christensen 2009; Hall, Ogden, and Hill 1997). These disparities point to several important dimensions of demographic change, such as ageing, migration and new living arrangements, even if it remains difficult to sort out factors contributing to the probability to live alone in relation to various socio-cultural, economic and demographic contexts. Part of the explanation of this complex situation lies in the diversity of the population living on their own, a feature emphasized by various authors (Klinenberg 2012; Jamieson and Simpson 2013).
This recent increase in share of one-person households in Viet Nam points to several important dimensions of demographic change, such as rapid ageing, intensifying mobility and the emergence of new living arrangements. Traditionally, living alone is rather uncommon in Viet Nam and rural monographs confirm that it rarely occurred in the past, even though the number of unmarried women increased during the years immediately after the Second Indochina War (Williams 2009; UNICEF 2008).
6 Household structures in 2009 are also described in General Statistics Office (2011a).

Demographic Research: Volume 32, Article 42
http://www.demographic-research.org 1151
This rapid change should be understood in relation to the specific context of Viet Nam. One of its most obvious features is of course the regular decline of fertility over the last thirty years since it reduced automatically the size of families (Table 1). Another important dimension is the changing nature of the family itself and the gradual emergence of the nuclear family as the standard family norm even if demographic data show that extended households are still very common in the country. But beyond these overall trends, Viet Nam's distinctiveness draws also from its unique geography and history. The war period till 1975 had important consequences on family formation and the large number of war widows – especially among women above 60 in 2009 – is the most visible impact of a period during which the large number of male casualties disrupted the traditional patterns of family building. Ever since the late 1980s, the economic reforms (Doi Moi) launched in the country represent the main source of transformations in the country. Their specific impact on demographic behavior is considerable, especially on migration within Viet Nam, as the analysis will illustrate. But they also affected fertility behavior and family structures in many ways, notably by reducing the power of the State vis-à-vis resurgent traditional institutions and emerging market forces (Barbieri and Bélanger 2009; Werner 2009).
In addition, these processes of changes did not take place in a uniform manner across Viet Nam. The country inherited from its long history a complex social geography, which places it somewhere at the crossroads between East and Southeast Asia (Bryant 1996; Guilmoto 2012). Northern provinces were under Chinese rule for centuries and borrowed many Confucian traditions from China. Patrilineal family patterns in this part of the country bear the mark of this historical influence. On the contrary, ethnic Kinhs from North Viet Nam occupied South Viet Nam only after the demise of the Khmer and Cham empires. As a result, family patterns in the South are more similar to patterns encountered in Southeast Asia and the process of family nuclearization has been slower than in the North. In addition, mountainous regions, long inhabited predominantly by ethnic minorities, constitute another dimension of the country's complex cultural geography.
The major events of the last fifty years – the American war and the Doi Moi – did not impact these large regions in a similar way. For instance, the North had a communist regime early on, with significant implications of its social development in terms of gender equity and educational expansion since the 1950s. Northern plains were also far more affected by the war than the rest of the country. For its part, economic development has been directed towards a few metropolitan subregions and they have generated new spatial inequalities that fuel interregional labor migration.

Guilmoto & de Loenzien: Emerging, transitory or residual? One-person households in Viet Nam
1152 http://www.demographic-research.org
4. Household size in Viet Nam and its evolution
The primary aggregate information on household structure is the average size of the household. It was 3.8 people in 2009, down from 4.8 in 1989, and 4.5 in 1999 (Table 1). While differences in the size of households appear modest between rural and urban areas, it is at the provincial level that they are most pronounced. For instance, the province with the smallest household size (3.2 persons on average) is Binh Duong in the South. This extremely low household size is directly related to the high number of migrant households further described below, but the low fertility level in this part of Viet Nam is an additional factor. Interestingly, a similarly low household size can also be observed in a cluster of rural provinces in the Red River region – Thai Binh, Ha Nam, Nam Dinh and contiguous provinces in the North of the country – as well as Ben Tre in the Mekong Delta region in the South. These provinces are, in contrast, characterized by heavy out-migration and very low or negative demographic growth. These small households are often predominantly comprised of sedentary, older, rural people, with a demographic profile diametrically differing from migrant households observed in cities. We can therefore conclude that smaller households are associated with lower fertility, but may be found in both in- and out-migration areas.
Table 1: Average household size and fertility, Viet Nam, 1989–2009 census
Census year Average household size Fertility
Vietnam Urban areas Children/woman 1989 4.8 4.8 3.6 1999 4.5 4.4 2.1 2009 3.8 3.7 1.9
The largest household size – above 4.5 members – is found in some of the least
developed provinces of the countries, both in the Northwest and in the Central Highlands, with their sizeable minority population. The link between higher household size and high fertility is unmistakable, as the average number of children per woman in these mainly rural provinces is often close or above three in these areas, compared to two children in the country as a whole. But the average household size also lies above 4 people in most provinces of the Mekong River Delta, a region that has both witnessed important out-migration towards the Ho Chi Minh City metropolitan area and abroad, as well as a rapid decline in birth rates. In this region of Viet Nam, the higher frequency of extended household structures probably explains why households are larger than elsewhere.
In summary, this brief review of regional variations suggests the complex interplay of fertility decline (size of the offspring), migration streams (smaller households in

Demographic Research: Volume 32, Article 42
http://www.demographic-research.org 1153
migration-affected areas) and household structure (prevalence of more complex family structures) in determining the shape and average size of households in Viet Nam. These factors will also play a role in the distribution of one-person households across the country. We can also explore the role of household structure in determining the average household size in detail.
Here, we can use the household classification originally developed by Peter Laslett, a standard tool to describe the diversity of household structures.7 The simplified version, based on five different household categories, is given below:
♦ Solitaries: one-person households ♦ Unrelated: households constituted of persons with no family link ♦ Nuclear family: includes couples or lone parents and their children with no
other relatives, such as daughters-in-law or grandchildren. ♦ Extended families: Nuclear families with other individuals that do not form a
couple, such as lone parents, siblings, grandchildren, etc. ♦ Multiple families: Households that include more than one couple, such as
couples with a child and his/her spouse, couples with both of the wife’s parents, brothers with their wives, etc.
The analysis in family formation usually focuses on the last three “family
households” categories, as they represent a vast majority of all Vietnamese households. However, here we will focus on the first category, which has never previously been studied for Viet Nam. Households consisting of unrelated members (mostly composed of fellow migrants) are also of interest to us, as they share many common features with one-person households. The distribution of households by type is displayed in Table 2. We have added the average number of members per household type, as well as the distribution of the population by household type.
As expected, complex household structures have more members than average, and the actual share of the population living in extended households is therefore larger than the proportion of these households. In fact, household type is the prime determinant of the average household size previously examined. A more formal analysis of the variance in household size (not reproduced here) demonstrates that the five household types defined above determine no less than 47% of the variations in household size, as observed across the 3.7 million households in the census sample. The 63 provinces and the 5 socioeconomic quintiles account for an additional 4% of the same variation.
7 The nomenclature is described in Hammel and Laslett (1974). See Bélanger (2000) for a similar analysis of household data from the 1990s. See Dommaraju and JooEan (2014) for a broader regional perspective.

Guilmoto & de Loenzien: Emerging, transitory or residual? One-person households in Viet Nam
1154 http://www.demographic-research.org
Table 2: Distribution of household characteristics in percentages by household type, Viet Nam, 2009 census (%)
Household type
Total
Solitaries Unrelated Nuclear Extended Multiple Distribution and average size Households 7.3 3.5 66.1 14.8 8.2 100.0 Population 2.0 2.9 63.0 18.6 13.4 100.0 Average household size 1.0 3.0 3.6 4.8 6.4 3.8 Note: The distribution by region and socioeconomic variable is based on all heads of household .
As Table 2 indicates, the two non-family groups (solitaries and unrelated) are less
common across the population. In the following review of household types, we will contrast one-person households with family-based households (nuclear, extended, multiple).
5. Sociodemographic profile of people living in a one-person household
We examine now the various demographic, cultural, socioeconomic, disability and geographical profile of the population living in a one-person household. We compare them with the population living in family households as well as with the entire population. We also compare them with heads of household of the family households, as solitaries are themselves heads of household.
Table 3 provides the main characteristics of these different populations and highlights several features typical of the population living alone. Especially noteworthy is the number of women in the solitary households, as they account for 66.0% of this population. This proportion is particularly high compared to the other heads of household (23.7%). The age distribution of the population living alone is also very distinct, as the data in Table 3 show. In particular, one person households include a rather low proportion of adults aged 30–49 years. In contrast, people aged 60 and above appear numerous among people living in one-person households.

Demographic Research: Volume 32, Article 42
http://www.demographic-research.org 1155
Table 3: Sociodemographic characteristics of household members and heads of household in percentages by household type, Viet Nam 2009 census
Domains Variables Solitaries Family households Total All Head
Demographic Sex Female 66.0 50.2 23.7 50.5 Age 0–14 0.7 15.3 0.1 15.2 15–19 3.8 10.3 0.7 10.2 20–29 16.8 18.0 11.4 18.0 30–39 8.9 15.7 24.9 15.5 40–49 12.4 15.8 26.8 15.2 50–59 15.8 8.7 18.8 8.9 60–69 13.6 4.0 9.0 4.2 70–79 16.4 2.9 6.1 3.1 80+ 11.7 1.4 2.3 1.6 Marital status Married, in union 15.3 49.7 84.0 49.0 Single, never married 33.0 45.4 3.9 45.1 Separated, divorced, spouse absent 8.6 0.9 2.0 1.1 Widowed 43.0 4.0 10.1 4.8 Health Disability At least one disability 27.8 6.6 12.0 7.1 Socio-cultural Ethnicity Minority ethnic group 5.7 14.4 12.5 14.2 Education Less than primary 36.7 32.5 21.9 32.6 Primary completed 42.3 52.5 60.3 52.3 Secondary completed 12.8 10.5 11.4 10.6 University completed 8.2 4.5 6.5 4.5 Studies Currently studying 8.0 23.0 1.7 22.7 Socio-economic Activity Employed 56.3 55.6 81.7 55.7 Unemployed 0.8 1.0 0.7 1.0 Inactive 42.9 43.4 17.6 43.4 Sector Active in the primary sector 24.1 30.2 44.6 30.1 Place Active in one’s pers./family enterprise 39.7 44.7 66.8 44.6 Geography Residence Urban 34.3 29.5 30.3 30.7 Region North central 12.3 11.6 11.6 11.7 Red River Delta 27.1 19.0 20.6 19.1 Northeast 11.7 13.5 13.6 13.4 Northwest 1.6 3.2 2.9 3.2 Central Coast 8.9 8.2 8.1 8.2 Central Highlands 2.6 4.6 4.2 4.6 Southeast 20.3 19.8 19.6 19.8 Mekong River Delta 15.4 20.1 19.4 20.1 Migration Status Non- migrant 82.6 94.2 93.7 94.0 Migrant between districts 5.5 1.9 2.1 2.0 Migrant between provinces 11.9 3.8 4.2 4.0 Migrant abroad 0.1 0.0 0.0 0.0 Note: Percentages refer to proportion of people in different household type (e.g. 66.0% of the people living in one-person households
are females).

Guilmoto & de Loenzien: Emerging, transitory or residual? One-person households in Viet Nam
1156 http://www.demographic-research.org
Figure 1 underscores the atypical age distribution of solitaries in contrast with the population living in family households.8 On the left side, we can observe the familiar age distribution of Viet Nam’s population, which has a shrinking base due to sustained fertility decline. The age pyramid of the “family population” is, in fact, hardly distinguishable from that of the entire population in 2009 (General Statistics Office 2011a). On the right, the distribution corresponds to the population living alone. This is a very distinct age distribution, with, for instance, almost no child below 15 years. The age distribution of people living alone has also several modes. The first concentration occurs among young adults of around ages 20–24. This peak among young adults parallels the distribution of persons living in unrelated households (not shown here) and corresponds mainly to the presence of young migrants living in family households. We also distinguish two other peaks, at ages 50–54 and at ages 75–79, among older adults.
Similarly, the marital status of the population living alone appears completely different from the household members of “family households”. There are many more divorced and widowed persons than among other household members. The proportion of the population living alone that are currently married is minimal, and three times less frequent than in the rest of the population. Indeed, living alone appears closely related to both singlehood and to union dissolution. The gap in marital rates is especially large between solitaries and other heads of household: singlehood is almost ten times more frequent among people living alone.
The high level of people with at least one disability among the population living alone (28% vs. 7%) is consistent with their older age distribution, but the proportion of inactive people is the same among all types of households (43%). People living in one-person households are also less present in the primary sector (24% vs. 30%). This result is affected by the high proportion of inactive people among the one-person households. Indeed, disaggregated results show that among workers, the share of the secondary and tertiary sectors is almost the same among people living on their own and among members of family households. Likewise, the low proportion of people working on their own or in a family enterprise among solitaries (40% vs. 45%) is also affected by the age and employment composition of the population living alone.9
8 The remaining household category (unrelated) has been left out from this analysis because of its peculiarity: it mostly includes young adult migrants. 9 Some aspects of the relationship between family arrangements and female self-employment are discussed in Poon, Diep, and Naybor (2012).

Demographic Research: Volume 32, Article 42
http://www.demographic-research.org 1157
Figure 1: Age distribution in percentages of the population by type of household, Viet Nam, 2009 census
The relationship between household structures and education is two-fold. People
living in one-person households are more numerous at the two ends of the spectrum with regard to the level of education. On one hand, they include a high proportion of those with a low level of education (37% have a level lower than primary vs. 33% in the family households). On the other hand, a relatively high percentage of them have completed a university degree (8% vs. 5%). A distinctive feature of one-person households is the share of migrants, since they are 3 times more common than among other households’ members. This is noticeable for both inter-provincial migration and within-province migration. This is an additional sign of the heterogeneity of this population, with older, sedentary and disabled people on one hand, and younger migrants on the other. This population tends to be slightly more common in urban areas than among family household members, but the difference is modest (34% vs. 30 %). These households are also more common in the Red River Delta, and less frequent in less developed rural areas such as Northern Mountainous and Midlands Areas, as well as in the Central Highlands. In addition, the percentage of people from ethnic minorities is almost divided by three when we move from families to solo households.
-10 -5 0 5 10
05
101520253035404550556065707580859095
Percentage of the population
Family households Solitaries

Guilmoto & de Loenzien: Emerging, transitory or residual? One-person households in Viet Nam
1158 http://www.demographic-research.org
The linkage between several demographic, sociocultural, socioeconomic, spatial, sanitary phenomena, and characteristics such as the correlation between marriage and age, the concentration of ethnic groups in some areas, the higher level of disability among older people and their lower level of economic activity, highlights the need for a more detailed analysis of the contribution of these determinants to household arrangements. This will be done in the next section.
6. Determinants of living in a one-person household
The objective of this analysis is to identify the main sociodemographic, sociocultural, socioeconomic, spatial and health correlates of living in a one-person household and their relative importance. We used a logistic regression model, in which we analyze the odds ratios derived from a multivariate analysis.10 Results are shown in Table 4.
The first result of this analysis is the major positive influence exerted by singlehood and divorce or separation on the risk of living alone. The influence of widowhood decreases in the multinomial regression, but remains very strong. Another striking effect is the positive effect of migration. Being a migrant – either between provinces or between districts – is associated with a higher probability of living in a one-person household.
Conversely, the introduction of all variables in the multivariate model also has the effect of inverting apparent correlations, a good example being the case of gender. Whereas the proportion of females is higher among people living in a one-person household, the trend is reversed once all the other factors are controlled. The apparent high prevalence of women in one-person households appears to be due to other factors, such as widowhood and older age. In fact, men turn out to be slightly more at risk of living in a one-person household than women in the multivariate model.
The same reversal applies to the place of residence. While living in an urban area is associated with one-person households, this is no longer the case once the other variables are factored in. Living alone becomes more typical of rural areas than urban areas.
10 The complete multivariate model, which includes all the factors simultaneously, predicts 97.3% of the observed results, which can be considered as a relatively high level of validity.

Demographic Research: Volume 32, Article 42
http://www.demographic-research.org 1159
Table 4: Proportion of people aged 15 and older living in a one-person household and results of logistic modeling, Viet Nam 2009 census
Crude Multivariate Logistic regression Domains Variables
odds ratio Net odds ratios Significance level
Demographic Sex Male (ref.) – – – Female 1.9 0.9 ** Age 40–49 (ref.) – – – 15–19 0.4 0.0 ** 20–29 1.0 0.1 ** 30–39 0.6 0.4 ** 50–59 2.0 1.9 ** 60–69 3.7 2.9 ** 70–79 6.3 3.5 ** 80+ 9.0 3.0 ** Marital status Married, in union (ref.) – – – Single, never married 5.3 24.5 ** Separated, divorced, spouse absent 29.6 34.2 ** Widowed 34.5 18.8 ** Health Disability No disability (ref.) – – – At least one disability 4.1 1.2 ** Socio-cultural Ethnicity Kinh ethnic group (ref.) – – – Minority ethnic group 0.4 0.5 ** Education Primary completed (ref.) – – – Less than primary 2.7 1.0 ** Secondary completed 1.3 1.2 ** University completed 1.9 1.4 ** Studies Not studying (ref.) – – – Studying 0.8 1.8 ** Socio-economic status Employed (ref.) – – – Unemployed 0.9 0.5 ** Inactive 2.3 0.4 ** Sector Active in the primary sector (ref.) – – – Not active in the primary sector 2.3 1.3 ** Place Active in one’s pers./family enterprise – – – Not active in one’s pers/fam. enterprise 2.3 1.4 ** Geography Place of Residence Rural (ref.) – – – Urban 1.2 0.8 ** Region North central (ref.) – – – Red River Delta 1.3 1.2 ** Northeast 0.8 1.0 ** Northwest 0.5 1.0 ** Central Coast 1.0 0.9 ** Central Highlands 0.6 0.9 ** Southeast 0.9 0.7 ** Mekong River Delta 0.7 0.7 ** Migration Status Non-migrant (ref.) – – – Migrant between districts 2.6 4.7 ** Migrant between provinces 2.8 5.0 ** Migrant abroad 1.6 1.6 ** Notes: n = 10 375 676; -2 log likelihood = 1,701,000.
Crude odds ratios are unadjusted odd ratios from bivariate logistic regression models, whereas net odds ratios are adjusted for all the factors by a multivariate analysis. Significance level ** : 1%, * : 5%, – : non applicable

Guilmoto & de Loenzien: Emerging, transitory or residual? One-person households in Viet Nam
1160 http://www.demographic-research.org
The regional influence also changes. Living in the Northeast and Northwest regions is not linked to specific household arrangements anymore. To a lesser extent, the same trend applies to the Central Highlands region. There, the regional factor almost vanishes, once ethnicity is taken into account. One-person households are in fact especially rare among ethnic minorities, and this negative association remains strong even after factoring in all other variables. The difference between Kinh and minority ethnic groups primarily relates to the nature of household structures and the strength of family norms. It is interesting to note the clear contrast between the Mekong Delta region and the Red River Delta, in terms of household arrangements. These two leading regions of the country are marked by opposite situations regarding the probability of living solo. The Southeast region is associated in the multivariate model with a lower risk of living in solitary households, as is the case in the Mekong River Delta.
The multivariate model also changes the direction of other observed correlations. For instance, once the age factor is controlled for, the effect of studying becomes positively linked to the likelihood of living in a one-person household. Indeed, students are mostly members of family households, but studying is a strong factor of living solo. This explains why the probability of living alone also increases with the level of education, and the effect is at its strongest for people who have a college or university degree. Activity is another instance of reversed association, as being inactive decreases the risk of living in a one-person household in the multivariate model. The initial positive link between inactivity and solo households was, in fact, caused by the high proportion of widowed and old people – as well as by sedentary people. Similarly, the higher risk of living in a one-person household among people with at least one impairment is reduced when other variables are added to the model.
Some associations noted above are obviously complex. First, several apparent bivariate links proved to be spurious when tested with a multivariate analysis. Second, existing correlations point to the presence of rather heterogeneous subpopulations living on their own. We will now re-examine some of these associations, after breaking up our sample of one-person households into different subgroups. For the most vulnerable of these subgroups, we will run a further regression analysis to test its main determinants. However, the next challenge consists precisely in trying to identify sociologically meaningful subgroups within the overall population living alone.
7. Living alone: Four different profiles
Our objective is now to subdivide our sample in order to better understand the inner composition and diversity of these solitary households. Rather than using preconceived categories such as age, sex, or residence, we have performed a number of classification

Demographic Research: Volume 32, Article 42
http://www.demographic-research.org 1161
analyses in order to determine the best division of this heterogeneous population. The advantage of statistical classification is that observations (one-person households) can be clustered through a combination of factors. Different methods were used, but, after several trials, we discarded the usual k-means method as being arbitrary and unstable. We instead opted for a more traditional hierarchical analysis, in which all the samples are gradually divided into subgroups of decreasing size.11 While more systematic, this method is, however, computationally demanding and cannot be performed on large samples. We therefore used a 5% subsample of our original sample, encompassing 12,845 households. The same cluster analysis was repeated on different 5% subsamples and led to similar results.
An important decision in our statistical analysis relates to the choice of original variables retained in the cluster analysis. We decided to restrict the classification to basic demographic variables (viz. sex, age in decennial categories, marital status and migration status). These variables provide crucial social characteristics, even though migration status tends to underestimate real lifetime mobility. Other social or economic variables are excluded from the initial cluster analysis to avoid groupings based on socioeconomic dimensions, but unrelated to demographic features. Using a hierarchical model, we can fix the number of classes on the basis of their respective size and dissimilarity levels. The classification is limited to four clusters after taking into account the Calinski-Harabasz criterion and the size of the resulting clusters (no cluster representing less than 1% of the sample).12
Table 5 describes the demographic characteristics of each class of one-member households. More detailed socioeconomic information on the composition of these four cluster groups can be found in Table A-1 in the Appendix. We will synthetize these characteristics through a brief summary profile of these four classes.
The first cluster covers almost half of our sample. It is the most gender-specific group of all, comprising more than 85% of women. It is composed almost exclusively of widows (with a few widowers) and is the oldest population segment of our sample. More than half of these people are 70 years old and above, while fewer than 7% are less than fifty. The average age of this cluster is 70 years. Another typical feature relates to sedentariness, since there are almost no migrants (less than 1%) in this cluster, including for short-distance migrants who stayed within the province.
This group of older widows and widowers is the most rural group of our sample (81%). Its regional distribution covers the entire country, but there is a higher concentration found in the Red River Delta and in Central Coastal areas than
11 The method used is the average linkage cluster analysis – which gives an equal weight to all variables – implemented by Stata 12. 12 The partitioning method using the Calinski-Harabasz stopping rule is described in Everitt et al. (2011).

Guilmoto & de Loenzien: Emerging, transitory or residual? One-person households in Viet Nam
1162 http://www.demographic-research.org
elsewhere.13 This cluster is also characterized by rather mediocre housing quality, as measured by various amenity and equipment variables. Most of the members of this cluster are inactive, and the few who, in spite of their age, are still employed work in the agricultural sector. Indirectly, this suggests that this group is economically the most vulnerable of all. This impression is strengthened by the high level of illiteracy and primary level education found in this group, a feature also obviously linked to its age composition. Similarly, this group reports an extremely high level of disability: close to 50%, a situation partially due to the old age of this population.
Table 5: Distribution and characteristics of cluster groups of the population
living alone (%), Viet Nam 2009 census Cluster groups Total 1 2 3 4 Distribution 45.4 43.1 10.4 1.1 100.0 Demography Female 85.4 53.7 52.3 37.6 67.7 Age Less than 20 years 0.0 2.7 19.8 1.3 3.2 20–29 years 0.1 17.4 70.6 4.1 15.0 30–39 years 0.8 16.7 6.3 36.3 8.6 40–49 years 5.3 24.1 2.2 27.4 13.3 50–59 years 13.9 23.0 0.6 23.2 16.5 60–69 years 22.1 9.9 0.3 7.5 14.4 70 years and more 57.5 5.9 0.0 0.0 28.6 Marital status Single 0.0 43.6 100.0 0.0 29.2 Currently married 0.0 34.9 0.0 78.0 15.9 Separated, divorced 0.0 21.4 0.0 21.9 9.4 Widowed 100.0 0.0 0.0 0.0 45.3 Migration Non -migrant 99.1 95.3 0.0 0.0 86.0 Inter-district migrant 0.3 3.2 35.2 0.6 5.2 Inter-province migrant 0.5 1.3 64.7 99.3 8.7 International migrant 0.0 0.0 0.0 0.0 0.0
Notes: Total refers to the entire subsample of population living alone used in the cluster analysis. Characteristics are given in
percentages among each cluster group (e.g. 85.4% of people in the first cluster are women). These variables have been used in the cluster analysis. For details regarding the distribution of the other characteristics, see Table A-1 in appendix.
13 This widowed population accounts for 70% of the population living alone in several agricultural provinces such as Binh Dinh or Nam Binh. These high values are most notably due to the impact of the war on female marriage. Conversely, widows represent less than 15% of one-person households in the richest provinces of the Southeast and in the poorest minority-dominated provinces.

Demographic Research: Volume 32, Article 42
http://www.demographic-research.org 1163
This cluster chiefly represents a residual population, resulting from unions broken by the death of the spouse. This accounts both for the age and sex composition. 14 Simultaneously, what this cluster demonstrates is that many women find themselves on their own after becoming widows, and do not co-reside with any of their children. The situation of many widows is often unfavorable for want of assets and of regular income, with disability being another factor of vulnerability that often affects this population. This isolation is a major source of concern, since these households correspond to people who are extremely vulnerable from both a physical and an economic perspective. The literature on women and the elderly in Viet Nam has already identified this subgroup as one of the most vulnerable populations in the country (UNICEF 2008; Bélanger and Li 2009; Giang and Pfau 2009)
The second cluster is also of large size (43%), but is far more diverse than the previous one. First, it is composed of a more balanced number of men and women (respectively 46% and 54%). It is also younger, extending from adults in their twenties to people above 60. The average age is 45 years, though higher among women than among men. This cluster includes a more diverse population by marital status, with a small majority of people never married (44%), but a large number of other people who are either married (35%) or divorced (21%). Another distinctive feature of this cluster is that most of them are sedentary, with inter-province and international migrants accounting for less than 2% of this group.
The regional distribution of this cluster presents no singularity, while the share of urban residents is only slightly higher than average. In fact, because of the demographically more diverse composition of this group, many social, educational, and economic characteristics are very close to the average values observed across the population living alone. The strong number of adults aged 20–50 years can explain the high participation rate, but the distribution across employment categories and sectors reflects that of the entire population of Viet Nam. Yet, the reason why this population resides alone is not as straightforward as for the first cluster. Why are younger single people living apart when they have not migrated to a different district? Why are currently married people living on their own and not with the rest of their family? In the absence of reported migration, these solitary living arrangements appear somewhat startling, with the exception of people who are divorced or separated from their spouse (21% of this cluster). A possibility is that census data do not faithfully reflect mobility because it ignores long-term migrants (migration longer than five years) or simply by underreporting migration.
14 Men marry at a later age than women do, their life expectancy is lower and their average age is higher than their wives’, they are therefore less frequently affected by widowhood. Moreover, higher remarriage rates among men further reduce the proportion among them living alone after widowhood.
Guilmoto & de Loenzien: Emerging, transitory or residual? One-person households in Viet Nam
1164 http://www.demographic-research.org
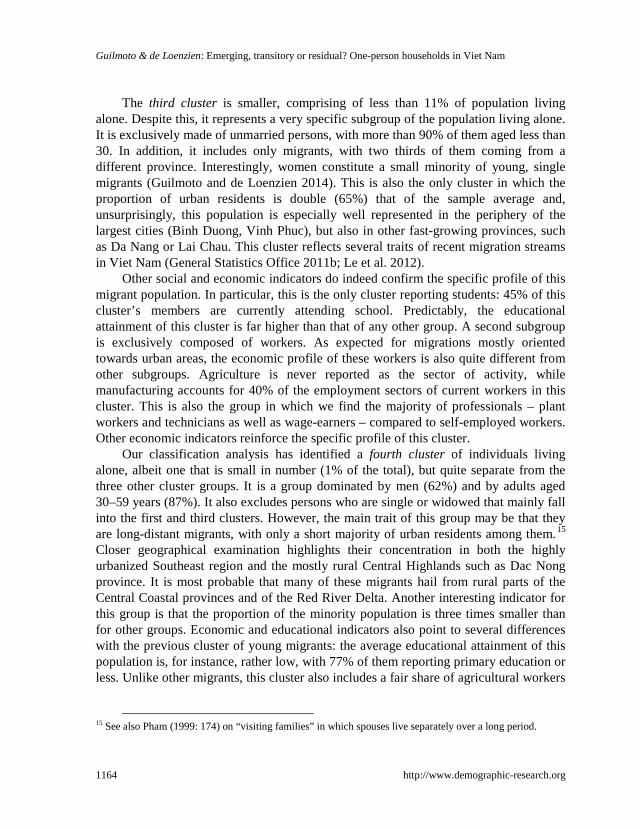
The third cluster is smaller, comprising of less than 11% of population living alone. Despite this, it represents a very specific subgroup of the population living alone. It is exclusively made of unmarried persons, with more than 90% of them aged less than 30. In addition, it includes only migrants, with two thirds of them coming from a different province. Interestingly, women constitute a small minority of young, single migrants (Guilmoto and de Loenzien 2014). This is also the only cluster in which the proportion of urban residents is double (65%) that of the sample average and, unsurprisingly, this population is especially well represented in the periphery of the largest cities (Binh Duong, Vinh Phuc), but also in other fast-growing provinces, such as Da Nang or Lai Chau. This cluster reflects several traits of recent migration streams in Viet Nam (General Statistics Office 2011b; Le et al. 2012).
Other social and economic indicators do indeed confirm the specific profile of this migrant population. In particular, this is the only cluster reporting students: 45% of this cluster’s members are currently attending school. Predictably, the educational attainment of this cluster is far higher than that of any other group. A second subgroup is exclusively composed of workers. As expected for migrations mostly oriented towards urban areas, the economic profile of these workers is also quite different from other subgroups. Agriculture is never reported as the sector of activity, while manufacturing accounts for 40% of the employment sectors of current workers in this cluster. This is also the group in which we find the majority of professionals – plant workers and technicians as well as wage-earners – compared to self-employed workers. Other economic indicators reinforce the specific profile of this cluster.
Our classification analysis has identified a fourth cluster of individuals living alone, albeit one that is small in number (1% of the total), but quite separate from the three other cluster groups. It is a group dominated by men (62%) and by adults aged 30–59 years (87%). It also excludes persons who are single or widowed that mainly fall into the first and third clusters. However, the main trait of this group may be that they are long-distant migrants, with only a short majority of urban residents among them.15 Closer geographical examination highlights their concentration in both the highly urbanized Southeast region and the mostly rural Central Highlands such as Dac Nong province. It is most probable that many of these migrants hail from rural parts of the Central Coastal provinces and of the Red River Delta. Another interesting indicator for this group is that the proportion of the minority population is three times smaller than for other groups. Economic and educational indicators also point to several differences with the previous cluster of young migrants: the average educational attainment of this population is, for instance, rather low, with 77% of them reporting primary education or less. Unlike other migrants, this cluster also includes a fair share of agricultural workers
15 See also Pham (1999: 174) on “visiting families” in which spouses live separately over a long period.

Demographic Research: Volume 32, Article 42
http://www.demographic-research.org 1165
as well as service workers, clerks and craftspeople. Most of them are wage-earners, but they tend to work in family enterprises rather than in private or public firms.
8. Widowhood and isolation
The previous analysis has conclusively illustrated the social diversity of the population living alone in Viet Nam, and the four main groups that can be identified among them. Solo living is often a matter of choice, and it follows strategic decisions made by individuals who want to improve their living conditions through spatial or marital mobility. While this includes a large number of persons falling into the one-person households examined here, this situation hardly applies to the large widowed population found in our classification analysis. For them, living alone may correspond to degradation in the quality of life, from both socioeconomic and emotional standpoint.
Before going further, it should be stressed that co-residence is used here as an indirect indicator of family support, which is perfectly understandable in the context of Viet Nam, where family cohabitation is the norm.16 Hoang et al. (2010) document, for instance, how living alone may jeopardize both the physical and the psychological situations of the elderly after controlling for the effect of other socioeconomic and demographic factors. Poverty is indeed more frequent among elder women living alone (World Bank 2011). Yet, the elderly may reside after widowhood in the same locality as their close kin without necessarily forming a single household, but solidarity across family members through visits, shared activities, and financial support can also be very strong when they live close-by. Census data do not capture such residential arrangements and the complexity of support channels towards the elderly, which are described in other studies.17 It is therefore important to bear in mind that co-residence is simply taken here as a proxy for the intensity of intergenerational support. It is therefore worth examining whether a statistical analysis can shed light on the factors linked to the isolation of some widows and widowers. To do this, we have again used the 2009 census data and isolated from the 15% sample the widowed population – composed of about 680,000 individuals, irrespective of their household type. The method used is similar to the earlier multivariate logistic analysis of the determinants of living alone, except that it is only applied to the widowed population. The results of this analysis are presented in Table 6.
16 Households tend to follow the stem family pattern, with parents coresiding with one of their married offspring (Pham 1999; Khuat 2009). 17 Survey data used by Hirschman and Vu (1996) and Truong et al. (1997) provide information on the proximity between family members. Knodel et al. (2000) assess the impact of proximity on intergenerational support. Survey-based samples are, however, too small for an analysis of one-person households.

Guilmoto & de Loenzien: Emerging, transitory or residual? One-person households in Viet Nam
1166 http://www.demographic-research.org
Table 6: Proportion of widowed population living in a one-person household and results of multivariate logistic modeling of living alone, Viet Nam 2009 census
Domains Variables % Multivariate logistic regression
Solitaries Odds ratios Significance level
Demographic Sex Male (ref.) 20.6 – – Female 17.7 0.864 ** Age 40–49 (ref.) 8.3 – – 15–19 4.0 0.726 ** 20–29 2.7 0.336 ** 30–39 3.1 0.349 ** 50–59 14.7 2.083 ** 60–69 20.0 3.345 ** 70–79 23.3 4.026 ** 80+ 21.0 3.238 ** Health Disability No disability (ref.) 15.5 – – At least one disability 21.8 1.237 ** Socio-cultural Ethnicity Kinh ethnic group (ref.) 19.7 – – Minority ethnic group 6.5 0.328 ** Education Primary completed (ref.) 16.8 – – Less than primary 19.0 0.934 ** Secondary completed 14.0 1.064 ** University completed 20.1 1.372 ** Studies Not studying (ref.) 18.1 – – Studying 4.3 0.744 ** Socio-economic Activity Employed (ref.) 16.8 – – Unemployed 13.0 0.959 ns Inactive 19.0 0.601 ** Sector Active in the primary sector (ref.) 17.8 – – Not active in the primary sector 18.2 1.209 ** Place Active in one’s pers./family enterprise (ref.) 17.1 – – Not active in one’s pers/fam. enterprise 18.7 0.998 ns Geographic Place of
Residence Rural (ref.) 20.1 – –
Urban 12.7 0.599 ** Region North central (ref.) 22.3 – – Red River Delta 29.0 1.400 ** Northeast 14.6 0.756 ** Northwest 7.6 0.623 ** Central Coast 22.0 1.028 ** Central Highlands 10.6 0.662 ** Southeast 10.8 0.547 ** Mekong River Delta 12.6 0.526 ** Migration Status Non- migrant (ref.) 1.8 – – Migrant between districts 5.6 0.664 ** Migrant between provinces 6.1 0.715 ** Migrant abroad 3.5 0.950 ns Notes: n = 681 801; -2 log likelihood = 3 586 699.497, proportion predicted 81.9%.
Significance level ** : 1%, * : 5%, / : non significant, ns : non significant, – : non applicable

Demographic Research: Volume 32, Article 42
http://www.demographic-research.org 1167
This statistical analysis brings out several significant findings about the factors accounting for the isolation of widows and widowers (Table 6). In particular, it allows us to identify the precise impact of specific factors, such as urbanization, impairment or ethnicity.
To start with, it confirms the aggravating factor of age, as the odds ratios regularly increase with age, reaching 4 among widows and widowers in their seventies. Social isolation therefore tends to coincide strongly with age. This observation is further compounded by the impact of disability: our regression analysis indicates that disability tends to increase isolation and the effect is very significant. Therefore, it appears that older and disabled persons are at much greater risk when living alone. This is a rather unsettling result of our analysis.
Our analysis, however, points to some mitigating factors. For instance, towns and cities tend to facilitate the co-residence of the widowed population with their family, in spite of the growing individualism of urban life and the prevailing housing constraints. This suggests that widows, in contrast, more often live alone in the countryside, a trend that can be partly attributed to the migration of their children elsewhere. Higher educational level – a proxy for socioeconomic status – is also associated with more frequent solo living among the widowed. This suggests that better socioeconomic conditions – including access to pension benefits or other revenues – may allow older people to live independently, while the poorer sections of the populace rely more on family co-residence for support.
In addition, we can also identify several regional and cultural variations. For instance, the widowed population among minority groups very rarely lives on its own, as pointed out earlier with the full sample. Ethnicity is once again a determining factor as the odds ratio associated to minority (.30) corresponds to one of the strongest effects in our regression analysis model. Similarly, the regional variables demonstrate that the Red River Delta emerges as the region with the highest frequency of widows living on their own. Most other regions are characterized by a lower frequency of isolation among widows and widowers. Southern provinces stand out in this comparison, since the odds of living alone are almost half of those in the rest of the country. South Viet Nam includes the highly urbanized and more prosperous areas in the Southeast, but also the entire Mekong region. The rural parts of the latter region are characterized by heavy out-migration and slower economic growth, in ways broadly comparable to what is observed in the Red River Delta. But, obviously, family systems in this region make a difference; they encourage a much larger number of the elderly to live with the rest of their family after widowhood.18
18 Other household data not reviewed here show that intergenerational co-residence is, on the whole, more frequent in South Viet Nam than in Central and Northern coastal provinces.

Guilmoto & de Loenzien: Emerging, transitory or residual? One-person households in Viet Nam
1168 http://www.demographic-research.org
9. Discussion and conclusion
The population living alone in Viet Nam has never been exclusively studied, in spite of its steady increase over the last decades. Its share has jumped from 4.4% of all households in 1999 to 7.3% in 2009 and 8% in 2014. This recent rise corresponds to an important dimension of demographic change in Viet Nam.
Our analysis has stressed this sociodemographic heterogeneity in Viet Nam, and both our tabulations and regressions highlight the different factors that lead people to live on their own, with marital status and migration playing major roles. Specific factors such as old age and disability increase this risk both in the whole population and in the widowed subgroup. Trends identified earlier confirm regional variations in intergenerational cohabitation already identified in previous research (Friedman et al. 2003; Knodel et al. 2000). Overall, cultural dimensions that are indirectly captured by ethnicity and regional variables clearly emerge as some of the most important factors towards explaining the living arrangements among the widowed population once age and disability differentials are factored in.
The final cluster analysis has led us to a more formal identification of four quite distinct profiles among the people living alone. The third and fourth clusters identified in our analysis are made up of migrants living on their own. People have left their original family households because they study in larger towns, seek employment in metropolitan areas or find farm work in the hills. Living alone is, to them, a matter of choice, and probably parallels upward social mobility. Lack of longitudinal data prevents us from drawing firm conclusions about their previous and future household arrangements, but migrants will probably stop living alone after marriage or after returning to their areas of origin.
The second cluster comprises a more heterogeneous population in terms of age and marital status. It represents a somewhat heterogeneous category in which we may find, on the one hand, younger adults who have left the parental home, and adults who have resettled alone after divorce on the other. Another part of this subgroup is both married and non-migrant, and may correspond to a population left behind. This group would probably require a deeper analysis to understand how far solitary arrangements are voluntary.
The largest cluster of all is comprised of aged widows and widowers, and it arguably constitutes the most fragile population segment, as clearly illustrated by several health and economic indicators. Other sources show that widows are, for instance, often discriminated against in terms of access to land and to housing (Gammeltoft 1999; Bélanger and Li 2009). In view of the strength of the family systems and the frequency of intergenerational arrangements across Viet Nam, we find that the overall proportion of widows and widowers living on their own is surprisingly

Demographic Research: Volume 32, Article 42
http://www.demographic-research.org 1169
high, considering that the aged are expected to be taken care of by their children, according to the prevailing Confucian norm of filial piety (Werner 2009). Given the lack of significant state support for the old, families still constitute the major source of resources for them, and co-residence is the best insurance mechanism to protect them from economic insecurity and health difficulties (Knodel et al. 2000, Barbieri 2009). In 2009, 17 % among the widowed population lived on their own, and this proportion tends, in fact, to slightly rise with age, exceeding 20% above age 70 years.
Living in a one-person household may not always involve isolation, as shown by the case of young, active migrants, or even older people in societies were collective housing arrangements are available for the elderly (Klinenberg 2012). But in contrast to the population opting for “going solo” in industrialized countries, the current household situation of widowed people living alone in Viet Nam is largely involuntary, even if some family members may live nearby. Factors such as the smaller number of offspring and their regional mobility may also account for this isolation and the absence of co-residence with younger family members. Underlying cultural factors may also account for the lower frequency of lonely widows among ethnic minority groups and in South Vietnam. There are also influences related to social change and, more precisely, to the gradual nuclearization of Vietnamese families over the recent period ,that would warrant further analysis.
A better understanding of the mechanisms leading to the growing isolation of the elderly population is crucial, since this is an especially fragile population segment in terms of health conditions and economic well-being (Giang and Pfau 2009). Even if living alone does not necessarily mean living in complete isolation, this situation corresponds to an additional layer of social and economic vulnerability. Another reason for our concern derives from basic demographic trends: this population is bound to grow especially fast in Viet Nam because of the rapid ageing process in the future (UNFPA 2011). The lack of health insurance and pension benefits for the elderly will therefore translate into vulnerability for an increasing share of the population in the decades to come.
10. Acknowledgements
We thank Adam Ka-Lok Cheung and Wei-Jun Jean Yeung for their comments on a preliminary version of this paper. We are also grateful to the two anonymous readers for their helpful suggestions.

Guilmoto & de Loenzien: Emerging, transitory or residual? One-person households in Viet Nam
1170 http://www.demographic-research.org
References
Barbieri, M. (2009). Doi Moi and the elderly: intergenerational support under the strain of reforms. In: Barbieri, M. and Bélanger, D. (eds.). Reconfiguring Families in Contemporary Vietnam. Stanford, CA: Stanford University Press: 133–168.
Barbieri, M. and Bélanger, D. (eds.) (2009). Reconfiguring Families in Contemporary Vietnam. Stanford, CA: Stanford University Press.
Bélanger, D. (2000). Regional differences in household composition and family formation patterns in Viet Nam. Journal of Comparative Family Studies 31(2): 171–196.
Bélanger, D. and Li, X.U. (2009). Agricultural land, gender and kinship in rural China and Vietnam: A comparison of two villages. Journal of Agrarian change 9(2): 204–230. doi:10.1111/j.1471-0366.2009.00201.x.
Bryant, J. (1996). Northern Vietnamese households. Journal of the Australian Population Association 13(2): 169–186.
Cheung, A.K.L. and Yeung, W.-J.J. (2013). Temporal-spatial Patterns of One-person Households in China, 1982–2005. Paper presented at the Conference on Living Alone: One-Person Households In Asia, Singapore, Dec 5–6 2013.
Desai, J. (2013). Change and Stability in Vietnamese Households over 15 Years of Rapid Growth. Paper presented at the Conference on Living Alone: One-Person Households In Asia, Singapore, Dec 5–6 2013.
Dommaraju, P. (2013). Single-person households in South Asia. Paper presented at the conference on Living Alone: One-Person Households In Asia, Singapore, Dec 5–6 2013.
Dommaraju, P. and JooEan, T. (2014). Households in Contemporary Southeast Asia. Journal of Comparative Family Studies 45(4): 559–580.
Everitt, B.S., Landau, S., Leese, M., and Stahl, D. (2011). Cluster Analysis. Chichester, UK: John Wiley & Sons. doi:10.1002/9780470977811.
Feng, Q., Zhenglian, W., Yeung, W.-J.J., and Zeng, Y. (2013). Projection of one-person household in China, 2010 to 2050. Paper presented at the Conference on Living Alone: One-Person Households In Asia, Singapore, Dec 5–6 2013.
Friedman, J., Knodel, J.E., Bui, T.C., and Truong, S.A. (2003). Gender dimensions of support for elderly in Vietnam. Research on Aging 25(6): 587–630. doi:10.1177/0164027503256693.

Demographic Research: Volume 32, Article 42
http://www.demographic-research.org 1171
Gammeltoft, T. (1999). Women’s Bodies, Women’s Worries. Health and Family Planning in a Vietnamese Rural Community. Richmond, VA: Curzon Press.
General Statistics Office (2011a). Age-sex Structure and Marital Status of the Population in Viet Nam. Hanoi: Ministry of Planning and Investment.
General Statistics Office (2011b). Migration and Urbanization in Viet Nam: Patterns, Trends and Differentials. Hanoi: Ministry of Planning and Investment.
General Statistics Office (2012). Result of the Vietnam Household Living Standards Survey 2010. Hanoi: General Statistics Office.
Giang, L.T. and Pfau, W.D. (2009). Vulnerability of Vietnamese elderly to poverty: Determinants and policy implications. Asian Economic Journal 23(4): 419–437. doi:10.1111/j.1467-8381.2009.02022.x.
Gram-Hanssen, K., Scherg, R.H., and Christensen, R.S. (2009). One-person households – a growing challenge for sustainability and housing policy. Paper presented at the ENHR-European Housing Research Network Conference 2009, Prague, June 26–July 1 2009.
Guilmoto, C.Z. and de Loenzien, M. (2014). Shifts in vulnerability landscapes. Young women and internal migration in Vietnam. Genus 70(1): 27–56.
Guilmoto, C.Z. (2012). Son preference, sex selection, and kinship in Vietnam. Population and Development Review 38(1): 31–54. doi:10.1111/j.1728-4457.2012.00471.x.
Hall, R., Ogden, P.E., and Hill, C. (1997). The pattern and structure of one‐person households in England and Wales and France. International Journal of Population Geography 3 (2): 161–181. doi:10.1002/(SICI)1099-1220(199706)3:2<161::AID-IJPG64>3.0.CO;2-2.
Hammel, E.A. and Laslett, P. (1974). Comparing household structure over time and between cultures. Comparative studies in society and history 16(1): 73–109. doi:10.1017/S0010417500007362.
Hirschman, C. and Vu, M.L. (1996). Family and Household Structure in Vietnam: Some glimpses from a recent survey. Pacific Affairs 69(92): 229–249. doi:10.2307/2760726.
Hoang, V.M., Dao, L.H., Wall, S., Nguyen T.K.C., and Byass, P. (2010). Multilevel analysis of covariation in socioeconomic predictors of physical functioning and psychological well-being among older people in rural Vietnam. BMC Geriatrics 10(1): 7. doi:10.1186/1471-2318-10-7.

Guilmoto & de Loenzien: Emerging, transitory or residual? One-person households in Viet Nam
1172 http://www.demographic-research.org
Jamieson, L. and Simpson, R. (2013). Living alone. Globalization, identity and belonging. Basingstoke: Palgrave Macmillan. doi:10.1057/9781137318527.
Khuat, T.H. (2009). Stem Family in Viet Nam. In: Fauve-Chamoux, A. and Ochiai, E. (eds.). The Stem Family in Eurasian Perspective: Revisiting House Societies, 17th–20th Centuries. Bern: Peter Lang: 431–459.
Klinenberg, E. (2012). Going solo. The extraordinary rise and surprising appeal of living alone. London: Penguin Books.
Knodel, J.E., Friedman, J., Truong, S.A., and Bui, T.C.P. (2000). Intergenerational exchanges in Vietnam: Family size, sex composition, and the location of children. Population Studies 54(1): 89–104. doi:10.1080/713779067.
Le, T.K.A., Lan, H.V., Bonfoh, B., and Schelling, E. (2012). An analysis of interprovincial migration in Vietnam from 1989 to 2009. Global Health Action 5: 1–12. doi:10.3402/gha.v5i0.9334.
Pham, V.B. (1999). The Vietnamese family in change: The case of the Red River Delta. Richmond, VA: Curzon Press.
Poon, J.P.H., Diep, T.T., and Naybor, D. (2012). Social capital and female entrepreneurship in rural regions: Evidence from Vietnam. Applied Geography 35 (1–2): 308–315. doi:10.1016/j.apgeog.2012.08.002.
Truong, S.A., Bui, T.C., Goodkind, D., and Knodel, J.E. (1997). Living arrangements, patrilineality and sources of support among elderly Vietnamese. Asia-Pacific Population Journal 12(4): 69–88.
UNFPA (2011). The Aging Population in Viet Nam. Current Status, Prognosis and Possible Policy Responses. Hanoi: UNFPA.
UNICEF (2008). Result of Nation-Wide Survey on the Family in Viet Nam 2006. Hanoi: UNICEF.
Werner, J. (2009). Gender, Household and State in Post-Revolutionary Vietnam. London: Routledge.
Williams, L. (2009). Attitudes toward marriage in northern Vietnam: What qualitative data reveal about variations across gender, generation, and geography. Journal of Population Research 26(4): 285–304. doi:10.1007/s12546-010-9024-3.
World Bank (2011). Vietnam – Country gender assessment. Washington, D.C.: World Bank.

Demographic Research: Volume 32, Article 42
http://www.demographic-research.org 1173
Appendix 1: Census variables
Variables derived from the 2009 census microdata are listed below: ♦ Marital status: Divorced and separated populations have been combined. ♦ Region: 8 large regions used (does not precisely coincide with Viet Nam’s six
macro-regions). ♦ Migration: non-migrant, migrant between districts (within a province),
migrant between provinces, international migrant. Since migration is only measured over five years and the place of birth is not collected, long-term migrants are assimilated into non-migrants.
♦ Ethnicity: distinguishes Kinhs from all other minority groups taken together ♦ Disability: at least one disability (physical, sight, hearing or mental capacities) ♦ Activity: when people are inactive, several other economic variables take the
value “does not apply” ♦ Household type: households were then divided into five categories as
described in the text. Apart from 2009 census tabulations published by the General Statistics Office of
Viet Nam, census monographs provide an in-depth discussion of fertility and mortality estimates, educational trends and differentials, age and sex structures, as well as migration trends.

Guilmoto & de Loenzien: Emerging, transitory or residual? One-person households in Viet Nam
1174 http://www.demographic-research.org
Appendix 2: Educational, regional, and socioeconomic characteristics of cluster groups
Table A-1: Geographical distribution and socio-economic characteristics of cluster groups of the population living alone (to be continued), Viet Nam 2009 census
Cluster groups Total
1 2 3 4
Geography Urban 19.3 38.1 65.2 51.3 32.5
Red River Delta 28.4 18.4 23.3 9.5 23.3 Northeast 13.2 18.6 21.7 12.3 16.4 Northwest 1.7 3.9 5.0 1.3 3.0 North Central 17.3 9.7 10.2 6.1 13.0 Central Coast 13.5 8.1 4.9 6.1 10.2 Central Highlands 3.0 3.9 4.0 13.0 3.6 Southeast 9.0 16.9 20.9 38.3 14.0 Mekong River Delta 13.4 20.2 9.7 13.0 16.0
Amenities Telephone 19.7 30.7 10.6 26.0 23.5
Air-conditioner 0.9 4.3 2.6 6.1 2.6 Computer 1.2 9.4 24.3 14.3 7.2
Education Attending school 0.0 3.9 44.8 1.3 6.3
Illiterate 23.3 5.7 0.3 0.6 13.1 Less than primary 64.0 20.1 1.0 9.5 38.2 Primary 31.3 55.0 35.7 67.1 42.4 Secondary 2.4 12.6 42.0 12.3 11.0 University 1.6 12.0 21.0 10.9 8.2
Employment Does not apply 0.0 0.9 0.0 0.0 0.4
Employed 38.3 77.3 55.7 87.0 57.5 Unemployed 0.1 1.2 0.9 0.0 0.7 Inactive 61.3 20.4 43.0 12.3 41.0
Occupation Legislators 0.1 1.9 0.5 0.6 0.9
Professionals 0.2 6.4 9.8 6.8 3.9 Technicians 0.7 7.7 11.4 4.1 4.9 Clerks 0.1 1.2 1.7 0.6 0.8

Demographic Research: Volume 32, Article 42
http://www.demographic-research.org 1175
Table A-1: (Continued)
Cluster groups Total
1 2 3 4
Service 5.8 13.6 7.3 26.0 9.5 Skilled peasant 28.7 30.8 1.6 20.5 26.0 Crafts 1.2 7.6 7.5 10.9 4.7 Plant workers 0.2 3.8 13.3 10.9 3.3 Inactive 61.6 22.6 44.2 12.3 42.4
Class of workers Inactive 61.6 22.6 44.2 12.3 42.4 Self-employed 34.4 46.2 6.0 36.3 36.5 Wage/salary 3.5 29.9 49.4 50.6 20.2 Unpaid 0.3 0.9 0.0 0.0 0.5 Other 0.0 0.0 0.0 0.0 0.0
Employment sector Inactive 61.6 22.6 44.2 12.3 42.4 Public 1.4 16.9 17.7 10.2 9.9 Private 0.3 4.3 15.5 18.4 3.8 Individual/family 36.4 54.3 10.3 52.0 41.6 Foreign 0.0 1.3 12.1 6.1 1.9 Collective 0.0 0.2 0.0 0.0 0.1
Industry Inactive 61.6 22.6 44.2 12.3 42.4 Agriculture 28.5 31.4 2.0 22.6 26.9 Mining 0.1 0.5 0.9 1.4 0.4 Manufacturing 1.5 7.8 23.9 13.7 6.7 Electricity 0.0 0.6 0.6 1.4 0.3 Construction 0.2 3.1 1.7 8.2 1.7 Wholesale 4.3 10.0 4.7 17.8 7.2 Hotels 1.3 3.2 2.7 5.4 2.3 Transportation 0.1 2.7 1.9 4.1 1.5 Financial 0.0 0.6 0.9 0.6 0.4 Other 0.3 2.3 1.9 4.1 1.4 Private 0.1 0.5 0.0 1.3 0.3
Ethnic group Minority ethnic group 7.1 11.5 9.3 3.4 9.2
Disability At least one disability 49.5 16.0 0.9 7.5 29.5
Note: Figures are given in percentages and refer to each cluster group. For instance, the first line indicates that 19.3% of the cluster
1 population live in urban areas. Proportions are computed on the smaller cluster subsample and may differ from proportions computed over the entire sample.

Guilmoto & de Loenzien: Emerging, transitory or residual? One-person households in Viet Nam
1176 http://www.demographic-research.org