Embed Size (px)
Citation preview

8/2/2019 Ma Ppt Final
http://slidepdf.com/reader/full/ma-ppt-final 1/51
SHAIK.SURESH (20085)
SUSHMITA (20087)UTPAL MANE (20088)

8/2/2019 Ma Ppt Final
http://slidepdf.com/reader/full/ma-ppt-final 2/51
Relating to theresponsibilities of
individual managers.
To evaluatemanagers on
controllable items.
An accounting system thatprovides information . . .
WHAT IS RESPONSIBILITY
ACCOUNTING ?

8/2/2019 Ma Ppt Final
http://slidepdf.com/reader/full/ma-ppt-final 3/51
Decision Making is Pushed Down
Supervisor Supervisor
Middle
Management
Supervisor Supervisor
Middle
Management
Top
Management
DECENTRALIZATION

8/2/2019 Ma Ppt Final
http://slidepdf.com/reader/full/ma-ppt-final 4/51
ADVANTAGES OF DECENTRALIZATION
Promotes betterdecision making.
Allows upper-level management toconcentrate on strategic decisions.
Improvesproductivity.
Developslower-levelmanagers.
Improvesperformanceevaluation.
Advantages

8/2/2019 Ma Ppt Final
http://slidepdf.com/reader/full/ma-ppt-final 5/51
DISADVANTAGES OF DECENTRALIZATION
Upper level management loses some control.
Lack of goal setting.
Duplication of effort.

8/2/2019 Ma Ppt Final
http://slidepdf.com/reader/full/ma-ppt-final 6/51
Responsibility Reports
Responsibility
ReportsPrepared for eachindividual who has
control over
revenue or expenseitems

8/2/2019 Ma Ppt Final
http://slidepdf.com/reader/full/ma-ppt-final 7/51
RESPONSIBILITY
REPORTS
Prepare budgets foreach responsibility center.
Prepare timely performance reportscomparing actual amounts with budgeted amounts.
Measure performance ofeach responsibility center.

8/2/2019 Ma Ppt Final
http://slidepdf.com/reader/full/ma-ppt-final 8/51
8/2/2019 Ma Ppt Final
http://slidepdf.com/reader/full/ma-ppt-final 9/51
A responsibility center is the point in an organization where the
control over revenue or expense is located, e.g. division,
department or a single machine.
Examples:
A specific store in a chain of grocery stores.
A work-station in a production line manufacturing automobile
batteries
The payroll data processing center within a firm.

8/2/2019 Ma Ppt Final
http://slidepdf.com/reader/full/ma-ppt-final 10/51
It is like a small business, and its manager is asked to run
that small business and preserve the interests of the largerorganization.
Goals for the center should be specific and measurable, and
should promote the long terms interests of the organization
and should be compatible with other responsibility center
activities.

8/2/2019 Ma Ppt Final
http://slidepdf.com/reader/full/ma-ppt-final 11/51
Example: A courier service (DHL)
Courier operations dispatch trucks to pick up or delivershipments from local terminals.
It could be sent to one or more central terminals andthen sorted and redirected. Success of this service would depend on:
Service commitment to customers (on time, without damage)and controlling costs
Let us suppose that each terminal is treated as aresponsibility center.
How should the company measure the performance ofeach terminal, its mangers, and its employees?

8/2/2019 Ma Ppt Final
http://slidepdf.com/reader/full/ma-ppt-final 12/51
To focus on efficiency: It could measure no. of parcels pickedup, sorted or delivered, per route, per employee, per vehicle, perhour or per shift.
To focus on customer service: It could measure each group’s
contribution to customers proportion of the time the terminal metits deadlines, when terminals are required to sort shipments, whatthe sorting error rate was.
It could also measure customer service : no. of complaintsoperations group receives, average time taken by the operationgroup to respond to complaints, and no. of complaints of poor, orimpolite service.
Measuring the performance of thecourier-terminal responsibility center

8/2/2019 Ma Ppt Final
http://slidepdf.com/reader/full/ma-ppt-final 13/51
TYPES OF RESPONSIBILITY
CENTERS
Responsibility
Centers
CostCenter
ProfitCenter
InvestmentCenter

8/2/2019 Ma Ppt Final
http://slidepdf.com/reader/full/ma-ppt-final 14/51
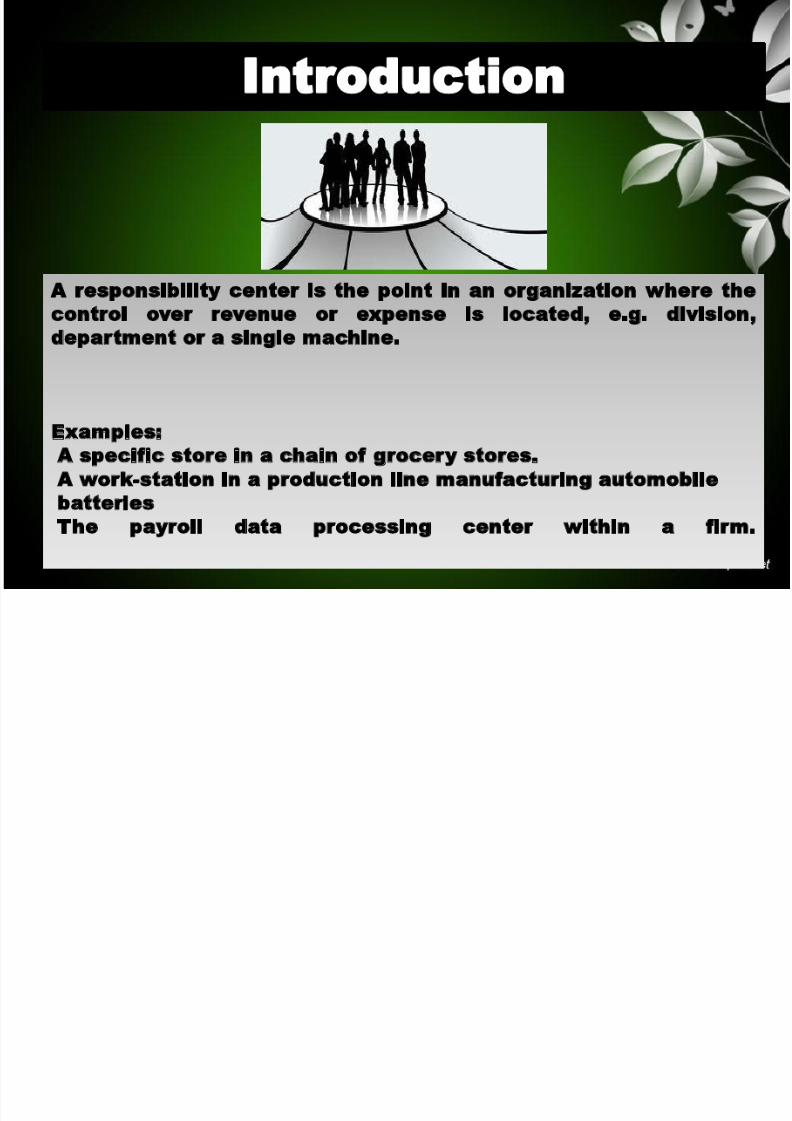
Responsibility centers whose employees control costs,
but do not control their revenues or investment level.
A cost center is evaluated by means of performance
reports (i.e., comparison of actual with standard).
Examples: Production department in a
manufacturing unit,a dry cleaning business
8/2/2019 Ma Ppt Final
http://slidepdf.com/reader/full/ma-ppt-final 15/51
Input OutputProcess
Control only this
8/2/2019 Ma Ppt Final
http://slidepdf.com/reader/full/ma-ppt-final 16/51
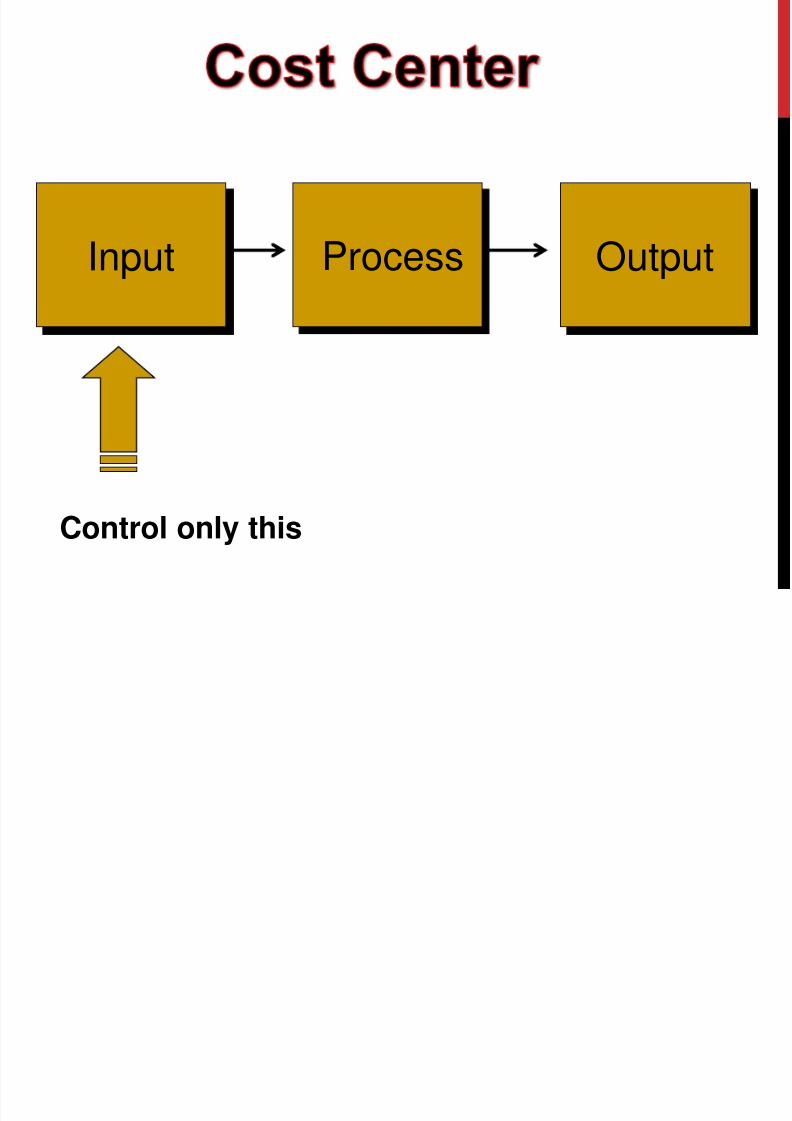
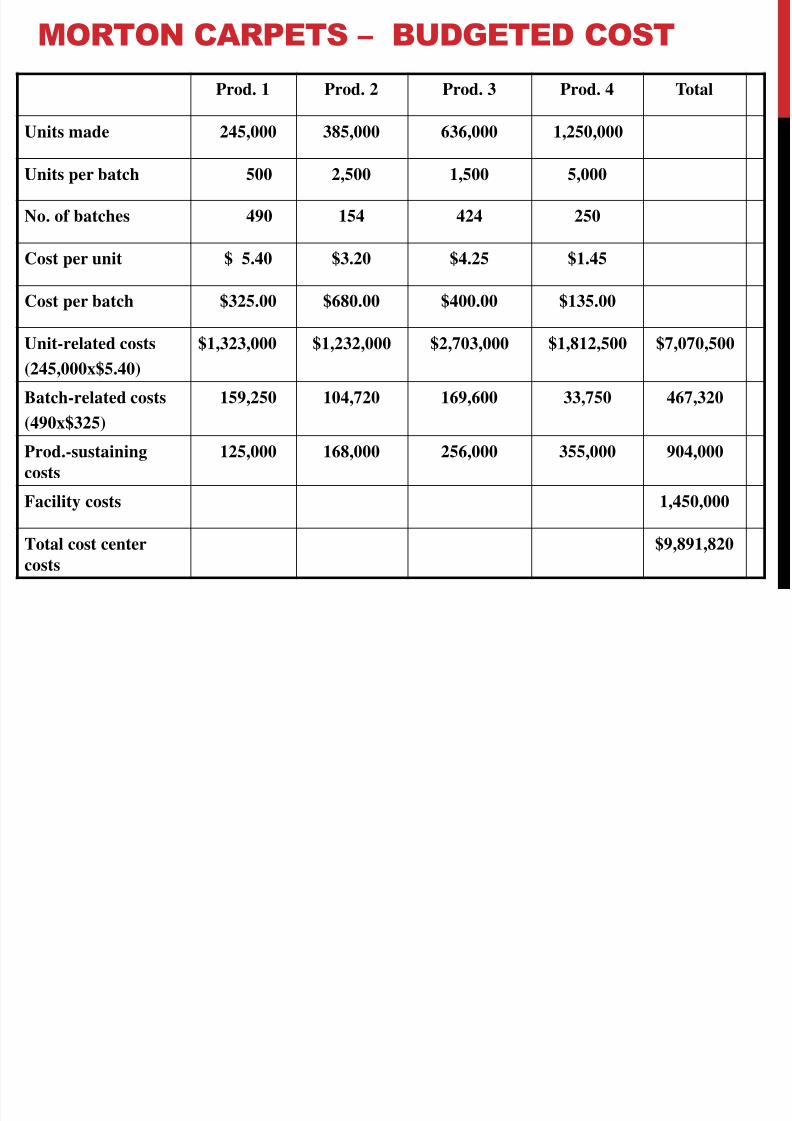
Prod. 1 Prod. 2 Prod. 3 Prod. 4 Total
Units made 245,000 385,000 636,000 1,250,000
Units per batch 500 2,500 1,500 5,000
No. of batches 490 154 424 250
Cost per unit $ 5.40 $3.20 $4.25 $1.45
Cost per batch $325.00 $680.00 $400.00 $135.00
Unit-related costs
(245,000x$5.40)
$1,323,000 $1,232,000 $2,703,000 $1,812,500 $7,070,500
Batch-related costs
(490x$325)
159,250 104,720 169,600 33,750 467,320
Prod.-sustaining
costs
125,000 168,000 256,000 355,000 904,000
Facility costs 1,450,000
Total cost center
costs
$9,891,820
MORTON CARPETS – BUDGETED COST

8/2/2019 Ma Ppt Final
http://slidepdf.com/reader/full/ma-ppt-final 17/51
Prod. 1 Prod. 2 Prod. 3 Prod. 4 Total
Units made2,945,000
345,000 675,000 950,000
Units per batch 600 2,300 1,800 6,000
No. of batches 492 150 375 159
Cost per unit $ 5.43 $3.18 $4.33 $1.40
Cost per batch $335.00 $670.00 $387 $144.00
Unit-related costs $1061,850 $1,097,100 $2,922,750 $1,330,000 $6,951,700
Batch-related costs 164,820 100,500 145,125 22,896 433,341
Prod.-sustaining
costs
133,000 163,000 259,000 362,000 917,,000
Facility costs 1,650,000
Total cost center
costs
$9,952,041

8/2/2019 Ma Ppt Final
http://slidepdf.com/reader/full/ma-ppt-final 18/51
Budget Actual VarianceUnrelated costs
Product 1 1,323,000.00 1,601,850.00 278,850.00
Product 2 1,232,000.00 1,097,100.00 -134,900.00Product 3 2,703,000.00 2,922,750.00 219,750.00Product 4 1,812,500.00 1,330,000.00 -482,500.00
Total 7,070,500.00 6,951,700.00 -118,800.00Batch related costs
Product 1 159,250.00 164,820.00 5,570.00
Product 2 104,720.00 100,500.00 -4,220.00Product 3 169,600.00 145,125.00 -24,475.00Product 4 33,750.00 22,896.00 -10,854.00
Total 467,320.00 433,341.00 -33,979.00Prod. sus. Costs
Product 1 125,000.00 133,000.00 8,000.00
Product 2 168,000.00 163,000.00 -5,000.00Product 3 256,000.00 259,000.00 3,000.00Product 4 355,000.00 362,000.00 7,000.00
Total 904,000.00 917,000.00 13,000.00Fac. Sus. Costs 1,450,000.00 1,650,000.00 200,000.00
Total 9,891,820.00 9,952,041.00 60,221.00
Variance Analysi s

8/2/2019 Ma Ppt Final
http://slidepdf.com/reader/full/ma-ppt-final 19/51
Engineered: Those costs that can be reasonablyassociated with a cost center – direct labor, direct
materials, telephone/electricity consumed, officesupplies.
Discretionary: Where a direct relationship between acost unit and expenses cannot be reasonably made;Management allocates them on a discretionary basis(e.g. depreciation expenses for machines utilized).

8/2/2019 Ma Ppt Final
http://slidepdf.com/reader/full/ma-ppt-final 20/51
Motivation of staff who feel committed to the cost centre
Improved monitoring of cost and expenditure
Improved management information on profit ability
Improved monitoring of investment returns

8/2/2019 Ma Ppt Final
http://slidepdf.com/reader/full/ma-ppt-final 21/51
In practice, it may be difficult to allocate costs to aparticular division / centre
Cost centres may add to pressures and stress on staff
Senior managers may be unable to recognise whethera cost centre is running effectively / ineffectively
8/2/2019 Ma Ppt Final
http://slidepdf.com/reader/full/ma-ppt-final 22/51
PROFIT CENTERS
Responsibility ofgenerating revenue andcontrolling costs.
Profit center evaluation
techniques include:Comparison of current year
income with a target or budget.
Relative performanceevaluation compares the center
with other similar profitcenters.

8/2/2019 Ma Ppt Final
http://slidepdf.com/reader/full/ma-ppt-final 23/51
CONT…
If performance is poor, it may reflect poor conditions
that no one in the organization could control as well aspoor local conditions.
For this reason, organizations should not evaluate
performance only based on costs and profits, but
Perform detailed evaluations that include quality,
material use, labor use, and service measures that the
local unit can control.
8/2/2019 Ma Ppt Final
http://slidepdf.com/reader/full/ma-ppt-final 24/51
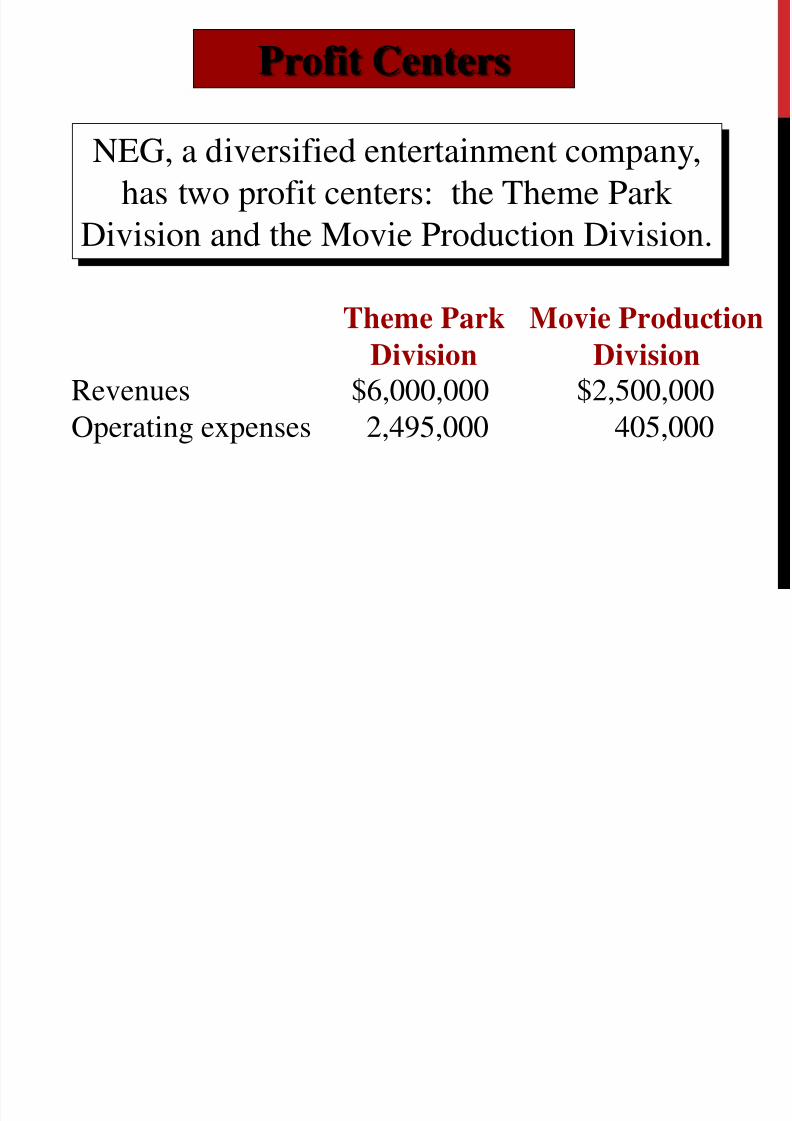
Profit Centers
NEG, a diversified entertainment company,has two profit centers: the Theme Park
Division and the Movie Production Division.
Theme Park
Division
Movie Production
DivisionRevenues $6,000,000 $2,500,000
Operating expenses 2,495,000 405,000

8/2/2019 Ma Ppt Final
http://slidepdf.com/reader/full/ma-ppt-final 25/51
Charging Service Department Coststo Production Divisions
Purchasing Department: $400,000
(Activity base: number of purchase requisitions)Theme Park Division 25,000 purchase requisitions
Movie Production Division: 15,000 purchase requisitions
Total 40,000
$400,000
40,000 purchase requisitions
$10 per purchase
requisition=
Profit Centers

8/2/2019 Ma Ppt Final
http://slidepdf.com/reader/full/ma-ppt-final 26/51
Charging Service Department Coststo Production Divisions
Payroll Accounting: $255,000
(Activity base: number of payroll checks)
$255,000
15,000 payroll checks= $17 per payroll check
Theme Park Division 12,000 payroll checks
Movie Production Division: 3,000 payroll checks
Total 15,000
Profit Centers

8/2/2019 Ma Ppt Final
http://slidepdf.com/reader/full/ma-ppt-final 27/51
Charging Service Department Coststo Production Divisions
Legal Department: $250,000
(Activity base: number of payroll checks)
$250,000
1,000 hours= $250 per hour
Theme Park Division 100 billed hours
Movie Production Division: 900 billed hours
Total 1,000
Profit Centers

8/2/2019 Ma Ppt Final
http://slidepdf.com/reader/full/ma-ppt-final 28/51

8/2/2019 Ma Ppt Final
http://slidepdf.com/reader/full/ma-ppt-final 29/51
Purchasing $250,000 $150,000
Payroll accounting 204,000 51,000
12,000 payroll
checks x $17 per
payroll check
3,000 payroll
checks x $17 per
payroll check
Nova Entertainment Group
Service Department Charges to NEG DivisionsFor the Year Ended December 31, 2006
Theme Movie
Park Production
Service Department Division Division
Profit Centers

8/2/2019 Ma Ppt Final
http://slidepdf.com/reader/full/ma-ppt-final 30/51
Purchasing $250,000 $150,000
Payroll accounting 204,000 51,000
Legal 25,000 225,000
Nova Entertainment Group
Service Department Charges to NEG DivisionsFor the Year Ended December 31, 2006
Theme Movie
Park Production
Service Department Division Division
Profit Centers
100 hours x $250
per hour
900 hours x $250
per hour

8/2/2019 Ma Ppt Final
http://slidepdf.com/reader/full/ma-ppt-final 31/51
Purchasing $250,000 $150,000
Payroll accounting 204,000 51,000
Legal 25,000 225,000
Total service department charges $479,000 $426,000
Nova Entertainment Group
Service Department Charges to NEG DivisionsFor the Year Ended December 31, 2006
Theme Movie
Park Production
Service Department Division Division
Profit Centers

8/2/2019 Ma Ppt Final
http://slidepdf.com/reader/full/ma-ppt-final 32/51
Nova Entertainment Group
Divisional Income StatementsFor the Year Ended December 31, 2006
Theme Park Division Movie Production Division
Income from operations before
service department charges.
Revenues $6,000,000 $2,500,000
Operating expenses 2,495,000 405,000
Income from operations $3,505,000 $2,095,000

8/2/2019 Ma Ppt Final
http://slidepdf.com/reader/full/ma-ppt-final 33/51
Nova Entertainment Group
Divisional Income StatementsFor the Year Ended December 31, 2006
Theme Park Division Movie Production Division
Revenues $6,000,000 $2,500,000
Operating expenses 2,495,000 405,000
Income from operations $3,505,000 $2,095,000Less service dept. charges:
Purchasing $ 250,000 $ 150,000
Payroll accounting 204,000 51,000
Legal 25,000 225,000Total service department
charges $ 479,000 $ 426,000
Income from operations $3,026,000 $1,669,000

8/2/2019 Ma Ppt Final
http://slidepdf.com/reader/full/ma-ppt-final 34/51
PROFIT CENTRE ADVANTAGES
Improves quality of decision Improves speed of decision
Ensures better and safer delegation of authority
Ensures better motivation and evokes commitment
Enhance profit consciousness with every expensemode

8/2/2019 Ma Ppt Final
http://slidepdf.com/reader/full/ma-ppt-final 35/51
Loss of overall control of company
Profit centre could be working towards different or
non- company agendas

8/2/2019 Ma Ppt Final
http://slidepdf.com/reader/full/ma-ppt-final 36/51
USES OF COST AND PROFIT CENTRES
They allow the business to compare performance between departments
/ across products / brands ,etc.
This allows the business to make decisions about underperforming
areas
If a profit centre is identified as doing well businesses may want to
focus on the reasons behind this

8/2/2019 Ma Ppt Final
http://slidepdf.com/reader/full/ma-ppt-final 37/51
CONT….
They allow a more focused study of a firms finances
Benchmarking can take place
Responsibility for a profit / cost centre will motivatethe individual responsible
By placing responsibility with the person involved inthe activity the finances may be run more efficiently
than would be the case if a more remote, senior manager controlled it.

8/2/2019 Ma Ppt Final
http://slidepdf.com/reader/full/ma-ppt-final 38/51
WHY OPERATE COST AND PROFIT CENTRES
Financial reasons – they allow to manage and control money. They
allow the business to identify which areas are most profitable
Organisational reasons – helps with the organisation of departments
and resources
Motivational reasons – motivates managers and workers

8/2/2019 Ma Ppt Final
http://slidepdf.com/reader/full/ma-ppt-final 39/51
WHAT IS AN INVESTMENTS
CENTER?
Investment Center
A segment whose managerhas control over costs,
revenues, and investments in
operating assets.

8/2/2019 Ma Ppt Final
http://slidepdf.com/reader/full/ma-ppt-final 40/51
Investment CenterA Systems Perspective
Input OutputProcess
Control these
Investment Center

8/2/2019 Ma Ppt Final
http://slidepdf.com/reader/full/ma-ppt-final 41/51
EVALUATION OF INVESTMENT
CENTER…:
An investment center isevaluated by means of theReturn on Investment (ROI) orthe Residual Income (RI) it isable to generate.
8/2/2019 Ma Ppt Final
http://slidepdf.com/reader/full/ma-ppt-final 42/51
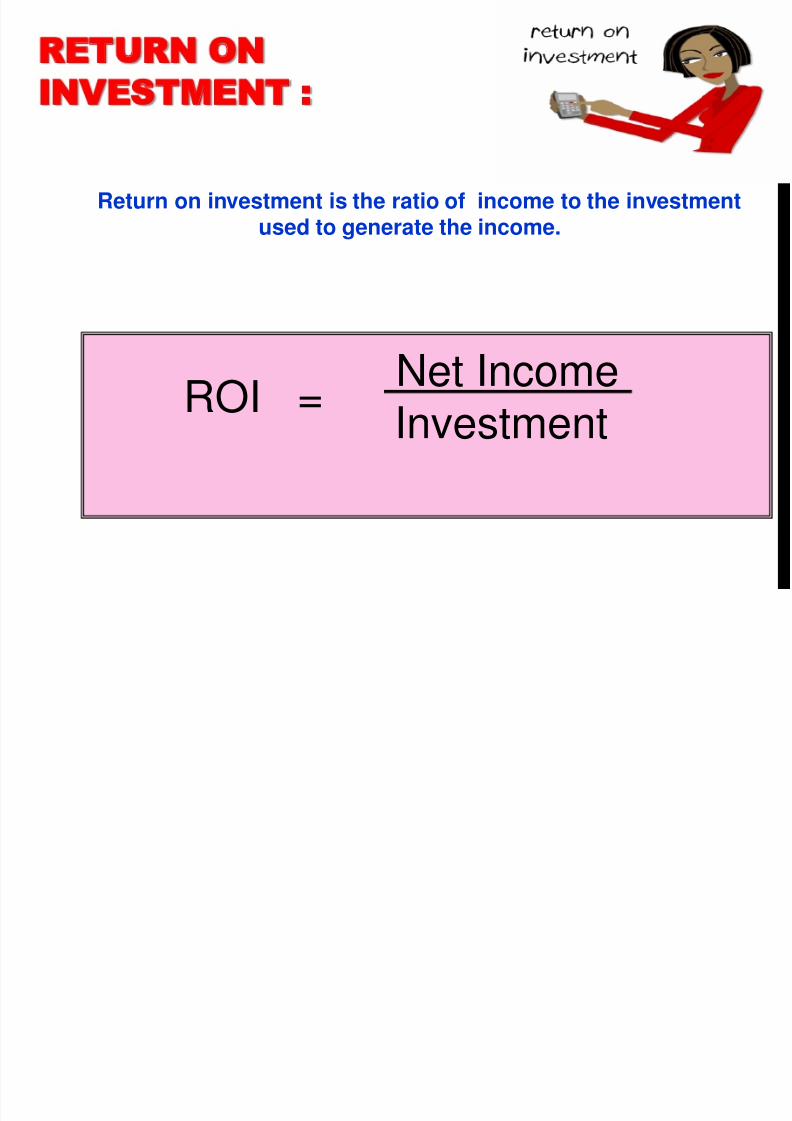
RETURN ON
INVESTMENT :
Return on investment is the ratio of income to the investmentused to generate the income.
ROI =
Net Income
Investment
8/2/2019 Ma Ppt Final
http://slidepdf.com/reader/full/ma-ppt-final 43/51
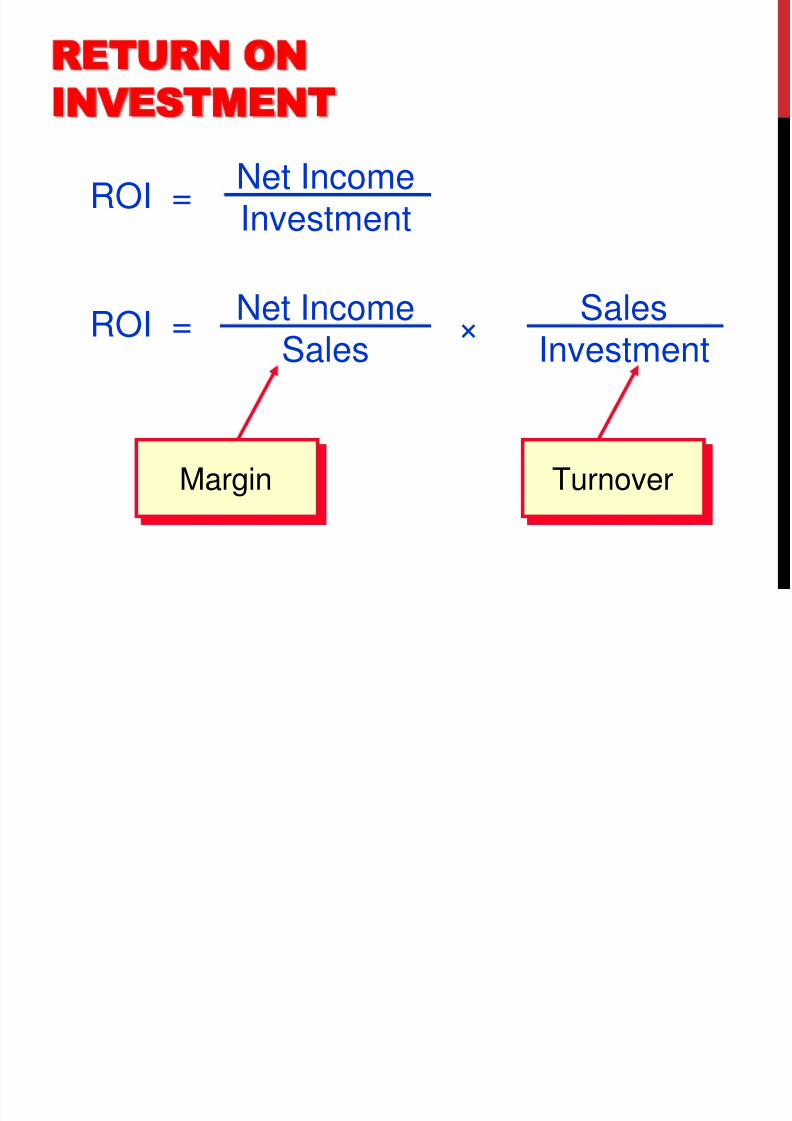
ROI =Net IncomeInvestment
ROI = Net IncomeSales
×Sales
Investment
Margin Turnover
RETURN ON
INVESTMENT

8/2/2019 Ma Ppt Final
http://slidepdf.com/reader/full/ma-ppt-final 44/51
RETURN ON
INVESTMENT
Cola Company reports the following:
Net Income $ 30,000Sales $ 500,000
Investment $ 200,000
Let’s calculate ROI.

8/2/2019 Ma Ppt Final
http://slidepdf.com/reader/full/ma-ppt-final 45/51
ROI = 6% × 2.5 = 15%
RETURN ON
INVESTMENT
ROI = Net IncomeSales
×Sales
Investment
ROI = $30,000$500,000
×$500,000$200,000

8/2/2019 Ma Ppt Final
http://slidepdf.com/reader/full/ma-ppt-final 46/51
IMPROVING R0I
Three ways to improve ROI
Increase
Sales
ReduceExpenses
Reduce
Investment

8/2/2019 Ma Ppt Final
http://slidepdf.com/reader/full/ma-ppt-final 47/51
IMPROVING R0I
Cola Company’s manager was able to increase sales to
$600,000 which increased net income to $42,000.
There was no change in investment.
Let’s calculate the new ROI.

8/2/2019 Ma Ppt Final
http://slidepdf.com/reader/full/ma-ppt-final 48/51
Cola Company increased ROI from 15% to 21%.
ROI = 7% × 3 = 21%
ROI = Net IncomeSales
×Sales
Investment
ROI = $42,000$600,000
×$600,000$200,000
IMPROVING R0I

8/2/2019 Ma Ppt Final
http://slidepdf.com/reader/full/ma-ppt-final 49/51
ROI - A MAJOR
DRAWBACK
As division manager at Cola Company,your compensation package includesa salary plus bonus based on your division’s ROI -- the higher your ROI, the bigger your bonus.
The company requires an ROI of 20% on all newinvestments -- your division has been producing anROI of 30%.
You have an opportunity to invest in a new projectthat will produce an ROI of 25%.
As division manager would youinvest in this project?

8/2/2019 Ma Ppt Final
http://slidepdf.com/reader/full/ma-ppt-final 50/51
ROI - A MAJOR DRAWBACK
As division manager,I wouldn’t invest in that project because
it would lower my pay!
I thought we weresupposed to do what
was best for the
company!

8/2/2019 Ma Ppt Final
http://slidepdf.com/reader/full/ma-ppt-final 51/51
THANK YOU ONE & ALL