Embed Size (px)
Citation preview

PowerPoint Slides prepared by: Andreea CHIRITESCU
Eastern Illinois University
Tracking the U.S. Economy
© 2014 Cengage Learning. All Rights Reserved. May not be copied, scanned, or duplicated, in whole or in part, except for use as permitted in a license distributed with a certain product or service or otherwise on a password-protected website for classroom use.
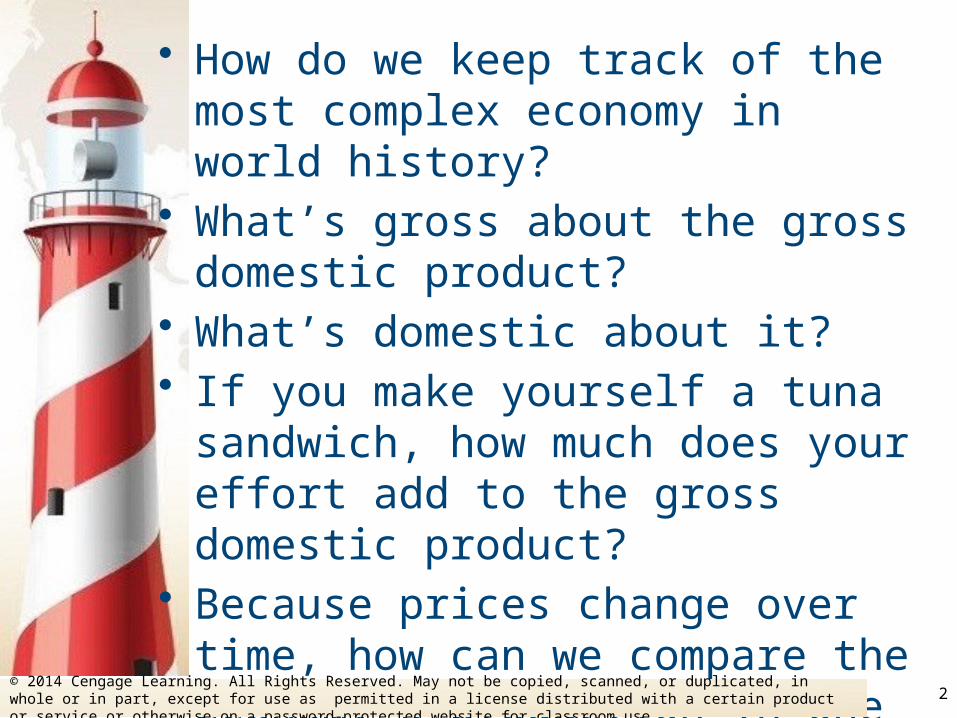
• How do we keep track of the most complex economy in world history?
• What’s gross about the gross domestic product?
• What’s domestic about it?• If you make yourself a tuna sandwich, how
much does your effort add to the gross domestic product?
• Because prices change over time, how can we compare the economy’s production in one year with that in other years?
© 2014 Cengage Learning. All Rights Reserved. May not be copied, scanned, or duplicated, in whole or in part, except for use as permitted in a license distributed with a certain product or service or otherwise on a password-protected website for classroom use.
2
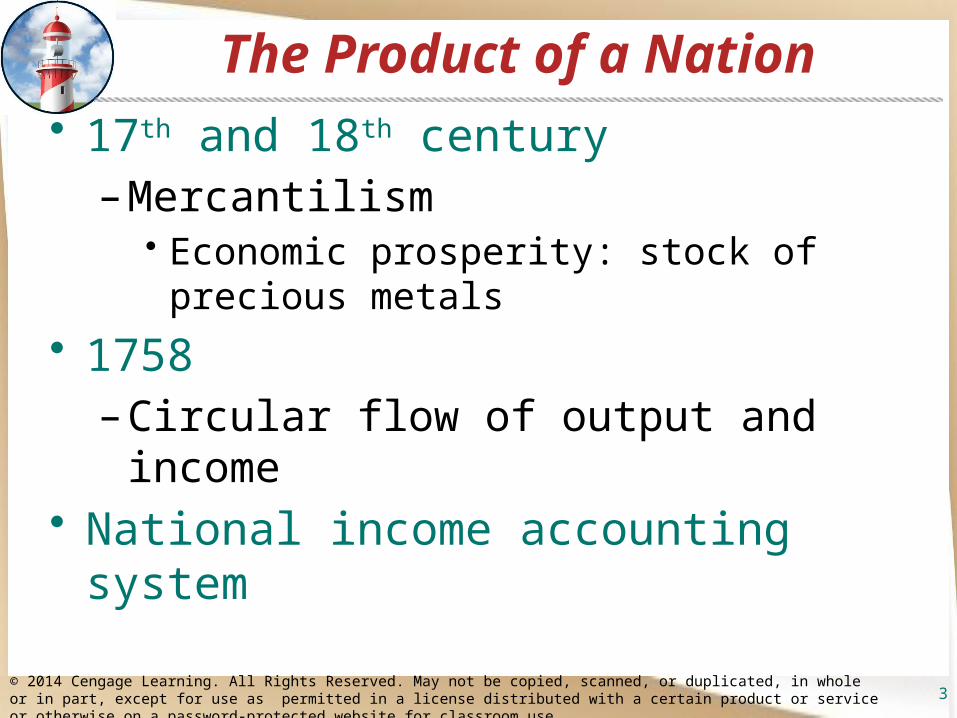
The Product of a Nation• 17th and 18th century
– Mercantilism • Economic prosperity: stock of precious metals
• 1758– Circular flow of output and income
• National income accounting system
© 2014 Cengage Learning. All Rights Reserved. May not be copied, scanned, or duplicated, in whole or in part, except for use as permitted in a license distributed with a certain product or service or otherwise on a password-protected website for classroom use.
3
National Income Accounts• GDP
– Market value– All final goods and services– Produced during a year– By resources located in US
• One person’s spending– Another person’s income
© 2014 Cengage Learning. All Rights Reserved. May not be copied, scanned, or duplicated, in whole or in part, except for use as permitted in a license distributed with a certain product or service or otherwise on a password-protected website for classroom use.
4
National Income Accounts• Expenditure approach
– Spending on all final goods and services• Produced in the nation • Within the year
• Income approach – Earnings by those who produce all output
• In the nation• During the year
© 2014 Cengage Learning. All Rights Reserved. May not be copied, scanned, or duplicated, in whole or in part, except for use as permitted in a license distributed with a certain product or service or otherwise on a password-protected website for classroom use.
5
National Income Accounts• Final goods and services
– Sold to the final user• Intermediate goods and services
– Purchased by firms– For further processing and resale
© 2014 Cengage Learning. All Rights Reserved. May not be copied, scanned, or duplicated, in whole or in part, except for use as permitted in a license distributed with a certain product or service or otherwise on a password-protected website for classroom use.
6
GDP: Expenditure Approach• Consumption, C
– Household purchases of final goods and services• Except for new residences (investment)
– Personal consumption expenditures– Households
• Services, nondurable goods, durable goods
– 70% of GDP
© 2014 Cengage Learning. All Rights Reserved. May not be copied, scanned, or duplicated, in whole or in part, except for use as permitted in a license distributed with a certain product or service or otherwise on a password-protected website for classroom use.
7
GDP: Expenditure Approach• Investment, I
– Gross private domestic investment– New capital goods
• Physical capital• New residential construction
– Net additions to inventories– 15% of GDP
© 2014 Cengage Learning. All Rights Reserved. May not be copied, scanned, or duplicated, in whole or in part, except for use as permitted in a license distributed with a certain product or service or otherwise on a password-protected website for classroom use.
8
GDP: Expenditure Approach• Physical capital
– Manufactured items used to produce goods and services• New plants, new equipment
• Residential construction– Building new homes or dwelling places
• Inventories– Producers’ stocks of finished and in-
process goods
© 2014 Cengage Learning. All Rights Reserved. May not be copied, scanned, or duplicated, in whole or in part, except for use as permitted in a license distributed with a certain product or service or otherwise on a password-protected website for classroom use.
9
GDP: Expenditure Approach• Government purchases, G
– Spending for goods and services• By all levels of government
– Government outlays minus transfer payments
– 19% of GDP
© 2014 Cengage Learning. All Rights Reserved. May not be copied, scanned, or duplicated, in whole or in part, except for use as permitted in a license distributed with a certain product or service or otherwise on a password-protected website for classroom use.
10
GDP: Expenditure Approach• Net exports, X-M
– Exports (X) minus imports (M)• Physical items• Invisibles (intangibles)
– Negative• Imports > Exports
– Averaged negative 4% of GDP for the last decade
C+I+G+(X-M)=Aggregate expenditure=GDP
© 2014 Cengage Learning. All Rights Reserved. May not be copied, scanned, or duplicated, in whole or in part, except for use as permitted in a license distributed with a certain product or service or otherwise on a password-protected website for classroom use.
11
Composition of Aggregate Expenditure
• Consumption, C– Stable from year to year– Long term trend: increase
• Investment, I– Fluctuates more from year to year– No long term trend
© 2014 Cengage Learning. All Rights Reserved. May not be copied, scanned, or duplicated, in whole or in part, except for use as permitted in a license distributed with a certain product or service or otherwise on a password-protected website for classroom use.
12
Composition of Aggregate Expenditure
• Government purchase, G– Long-term trend: declined
• Decrease in defense spending since 1960s
– Not included: transfer payments (increased)
• Net exports, X-M– Negative
© 2014 Cengage Learning. All Rights Reserved. May not be copied, scanned, or duplicated, in whole or in part, except for use as permitted in a license distributed with a certain product or service or otherwise on a password-protected website for classroom use.
13
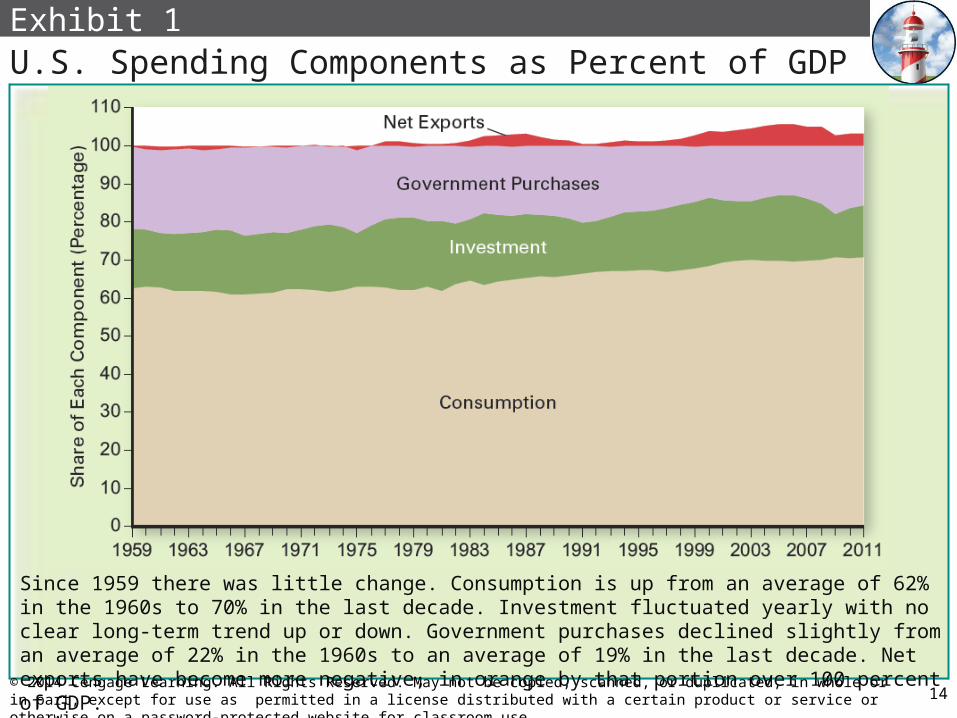
Exhibit 1U.S. Spending Components as Percent of GDP Since 1959
Since 1959 there was little change. Consumption is up from an average of 62% in the 1960s to 70% in the last decade. Investment fluctuated yearly with no clear long-term trend up or down. Government purchases declined slightly from an average of 22% in the 1960s to an average of 19% in the last decade. Net exports have become more negative, in orange by that portion over 100 percent of GDP.
14© 2014 Cengage Learning. All Rights Reserved. May not be copied, scanned, or duplicated, in whole or in part, except for use as permitted in a license distributed with a certain product or service or otherwise on a password-protected website for classroom use.
GDP: Income Approach• Aggregate income
– All earnings of resource suppliers in an economy
– During a given period, usually a year• Wages• Interest• Rent• Profit
Aggregate expenditure = GDP = Aggregate income
© 2014 Cengage Learning. All Rights Reserved. May not be copied, scanned, or duplicated, in whole or in part, except for use as permitted in a license distributed with a certain product or service or otherwise on a password-protected website for classroom use.
15
GDP: Income Approach• Value added at each stage of production
– Selling price of a product • Minus the cost of intermediate goods
purchased from other firms
– Income earned
© 2014 Cengage Learning. All Rights Reserved. May not be copied, scanned, or duplicated, in whole or in part, except for use as permitted in a license distributed with a certain product or service or otherwise on a password-protected website for classroom use.
16
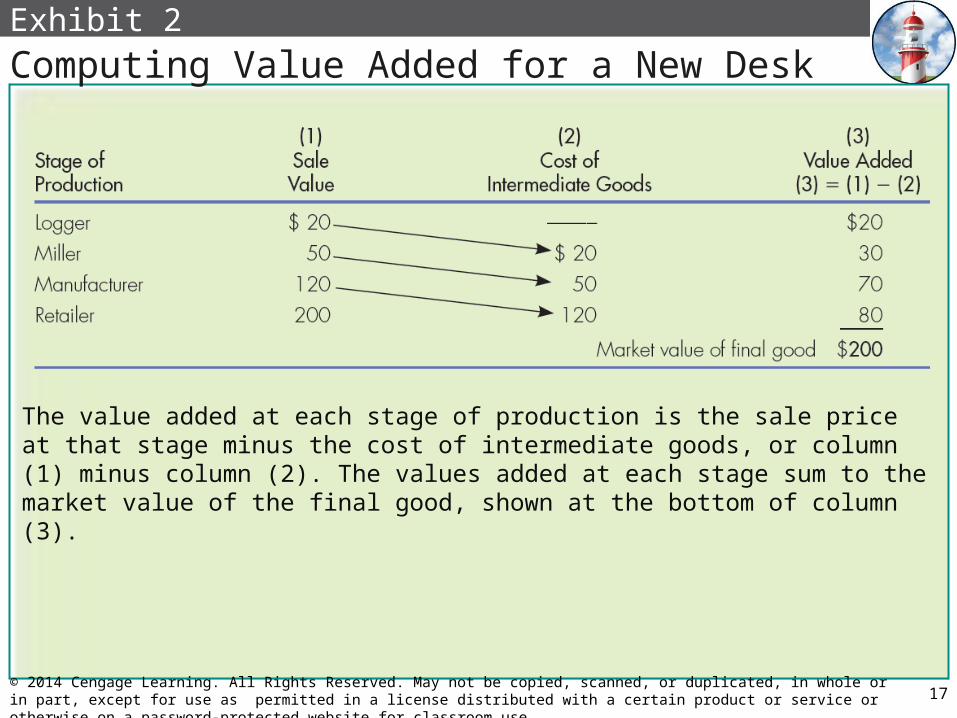
Exhibit 2
Computing Value Added for a New Desk
The value added at each stage of production is the sale price at that stage minus the cost of intermediate goods, or column (1) minus column (2). The values added at each stage sum to the market value of the final good, shown at the bottom of column (3).
17© 2014 Cengage Learning. All Rights Reserved. May not be copied, scanned, or duplicated, in whole or in part, except for use as permitted in a license distributed with a certain product or service or otherwise on a password-protected website for classroom use.
Circular Flow of Income and Expenditure
• Circular flow– Of income and spending in the economy– For household, firms, government, and the
rest of the world• Assumptions
– Capital doesn’t wear out– Firms pay out all profits to firm owners
• We can sayGDP = aggregate income
© 2014 Cengage Learning. All Rights Reserved. May not be copied, scanned, or duplicated, in whole or in part, except for use as permitted in a license distributed with a certain product or service or otherwise on a password-protected website for classroom use.
18
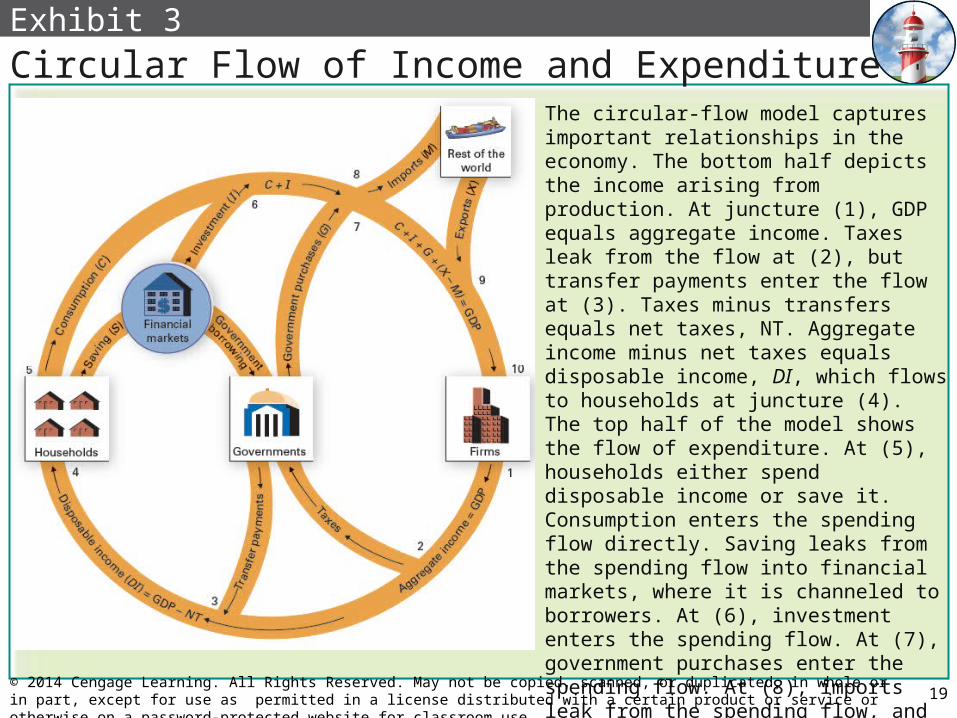
Exhibit 3
Circular Flow of Income and ExpenditureThe circular-flow model captures important relationships in the economy. The bottom half depicts the income arising from production. At juncture (1), GDP equals aggregate income. Taxes leak from the flow at (2), but transfer payments enter the flow at (3). Taxes minus transfers equals net taxes, NT. Aggregate income minus net taxes equals disposable income, DI, which flows to households at juncture (4). The top half of the model shows the flow of expenditure. At (5), households either spend disposable income or save it. Consumption enters the spending flow directly. Saving leaks from the spending flow into financial markets, where it is channeled to borrowers. At (6), investment enters the spending flow. At (7), government purchases enter the spending flow. At (8), imports leak from the spending flow, and at (9), exports enter the spending flow. Consumption plus investment plus government purchases plus net exports add up to the aggregate expenditure on GDP received by firms at (10).
19© 2014 Cengage Learning. All Rights Reserved. May not be copied, scanned, or duplicated, in whole or in part, except for use as permitted in a license distributed with a certain product or service or otherwise on a password-protected website for classroom use.
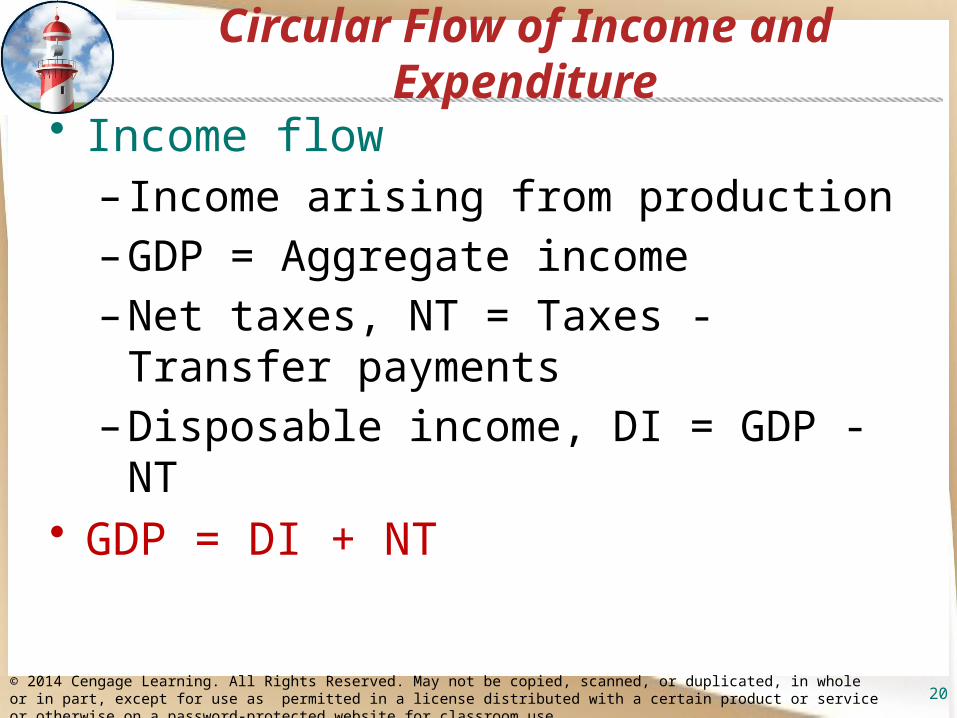
Circular Flow of Income and Expenditure
• Income flow– Income arising from production– GDP = Aggregate income– Net taxes, NT = Taxes - Transfer
payments– Disposable income, DI = GDP - NT
• GDP = DI + NT
© 2014 Cengage Learning. All Rights Reserved. May not be copied, scanned, or duplicated, in whole or in part, except for use as permitted in a license distributed with a certain product or service or otherwise on a password-protected website for classroom use.
20
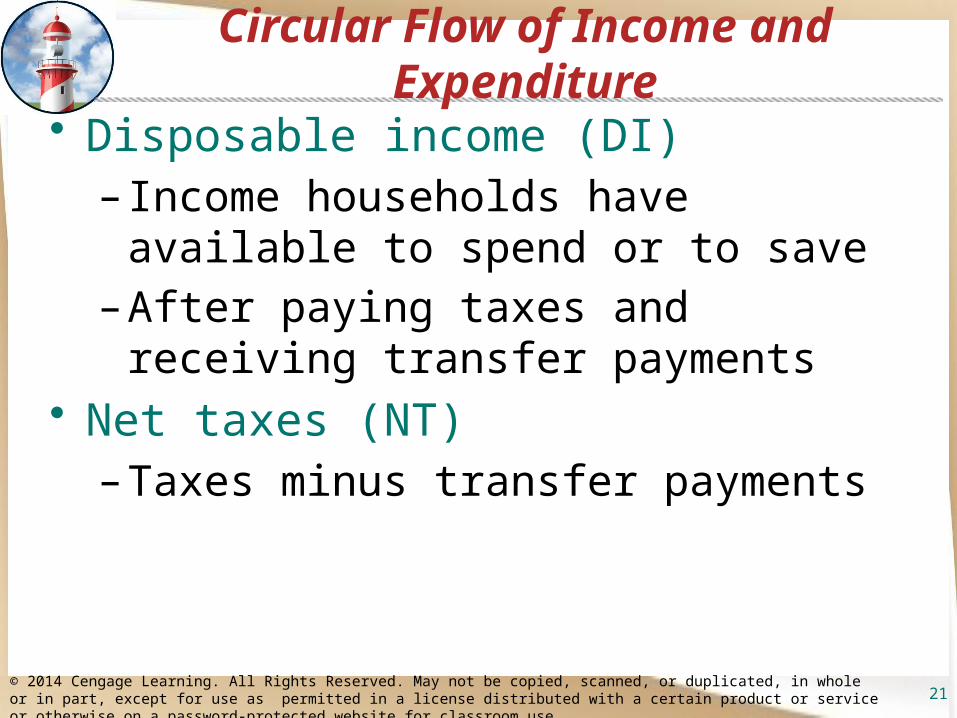
Circular Flow of Income and Expenditure
• Disposable income (DI)– Income households have available to
spend or to save– After paying taxes and receiving transfer
payments• Net taxes (NT)
– Taxes minus transfer payments
© 2014 Cengage Learning. All Rights Reserved. May not be copied, scanned, or duplicated, in whole or in part, except for use as permitted in a license distributed with a certain product or service or otherwise on a password-protected website for classroom use.
21
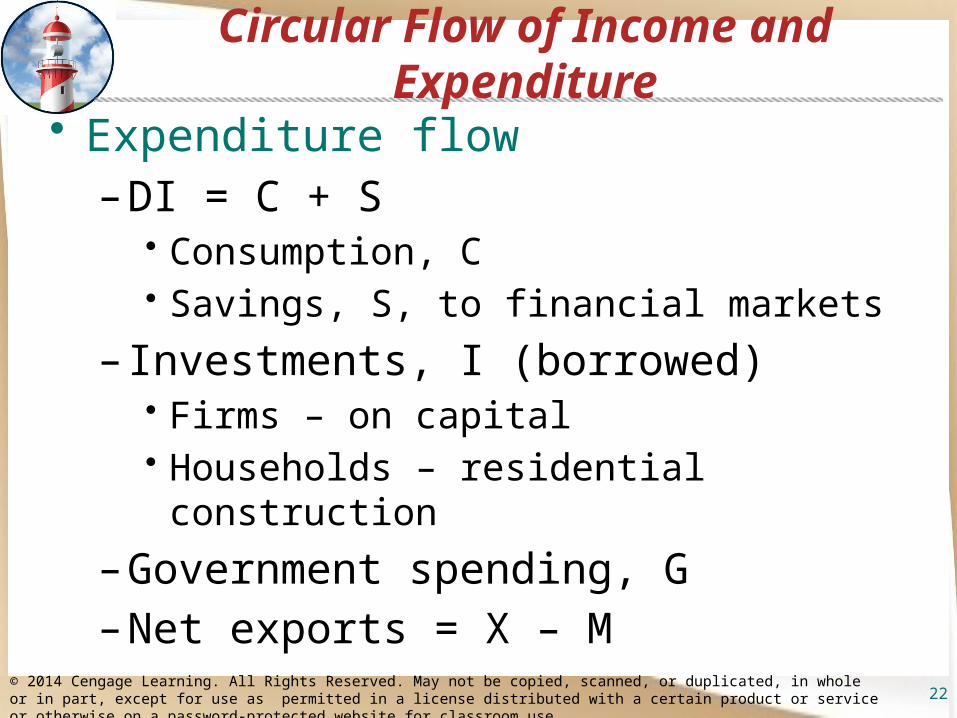
Circular Flow of Income and Expenditure
• Expenditure flow – DI = C + S
• Consumption, C • Savings, S, to financial markets
– Investments, I (borrowed)• Firms – on capital• Households – residential construction
– Government spending, G– Net exports = X – M
© 2014 Cengage Learning. All Rights Reserved. May not be copied, scanned, or duplicated, in whole or in part, except for use as permitted in a license distributed with a certain product or service or otherwise on a password-protected website for classroom use.
22
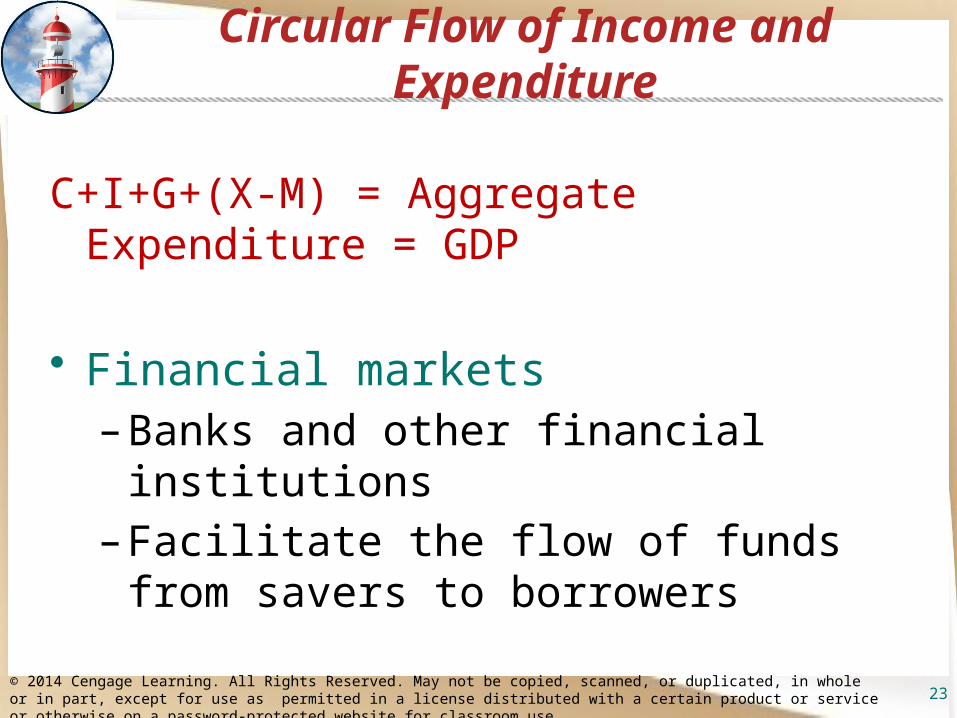
Circular Flow of Income and Expenditure
C+I+G+(X-M) = Aggregate Expenditure = GDP
• Financial markets– Banks and other financial institutions– Facilitate the flow of funds from savers to
borrowers
© 2014 Cengage Learning. All Rights Reserved. May not be copied, scanned, or duplicated, in whole or in part, except for use as permitted in a license distributed with a certain product or service or otherwise on a password-protected website for classroom use.
23
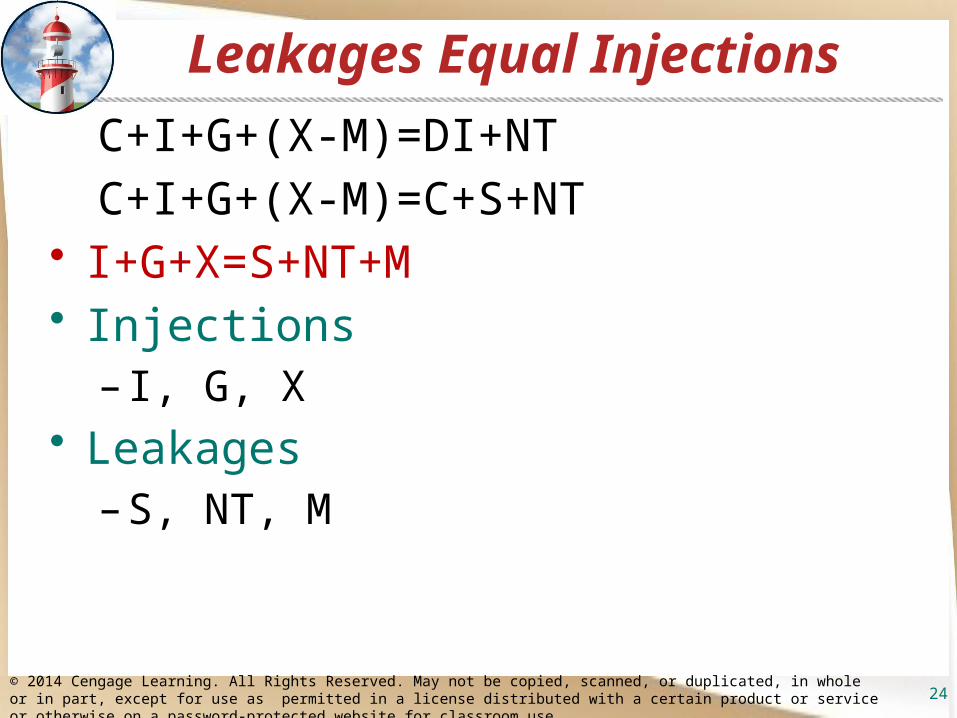
Leakages Equal Injections
C+I+G+(X-M)=DI+NT
C+I+G+(X-M)=C+S+NT• I+G+X=S+NT+M• Injections
– I, G, X• Leakages
– S, NT, M
© 2014 Cengage Learning. All Rights Reserved. May not be copied, scanned, or duplicated, in whole or in part, except for use as permitted in a license distributed with a certain product or service or otherwise on a password-protected website for classroom use.
24
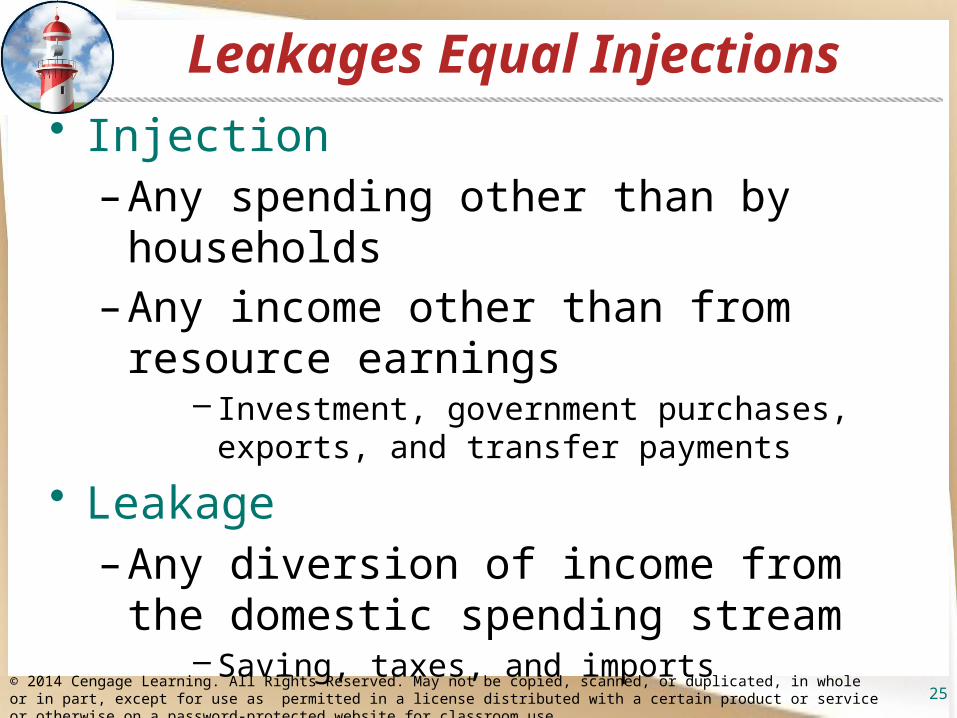
Leakages Equal Injections • Injection
– Any spending other than by households– Any income other than from resource
earnings– Investment, government purchases, exports, and
transfer payments
• Leakage– Any diversion of income from the domestic
spending stream– Saving, taxes, and imports
© 2014 Cengage Learning. All Rights Reserved. May not be copied, scanned, or duplicated, in whole or in part, except for use as permitted in a license distributed with a certain product or service or otherwise on a password-protected website for classroom use.
25
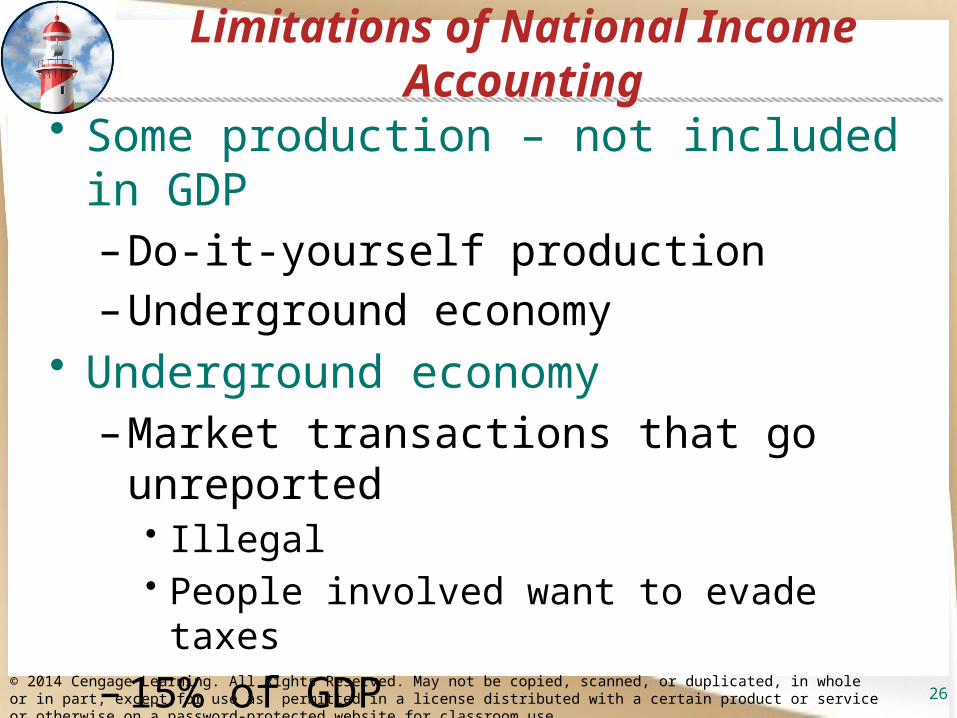
Limitations of National Income Accounting
• Some production – not included in GDP– Do-it-yourself production– Underground economy
• Underground economy– Market transactions that go unreported
• Illegal• People involved want to evade taxes
– 15% of GDP– $2 trillion in 2012
© 2014 Cengage Learning. All Rights Reserved. May not be copied, scanned, or duplicated, in whole or in part, except for use as permitted in a license distributed with a certain product or service or otherwise on a password-protected website for classroom use.
26
Limitations of National Income Accounting
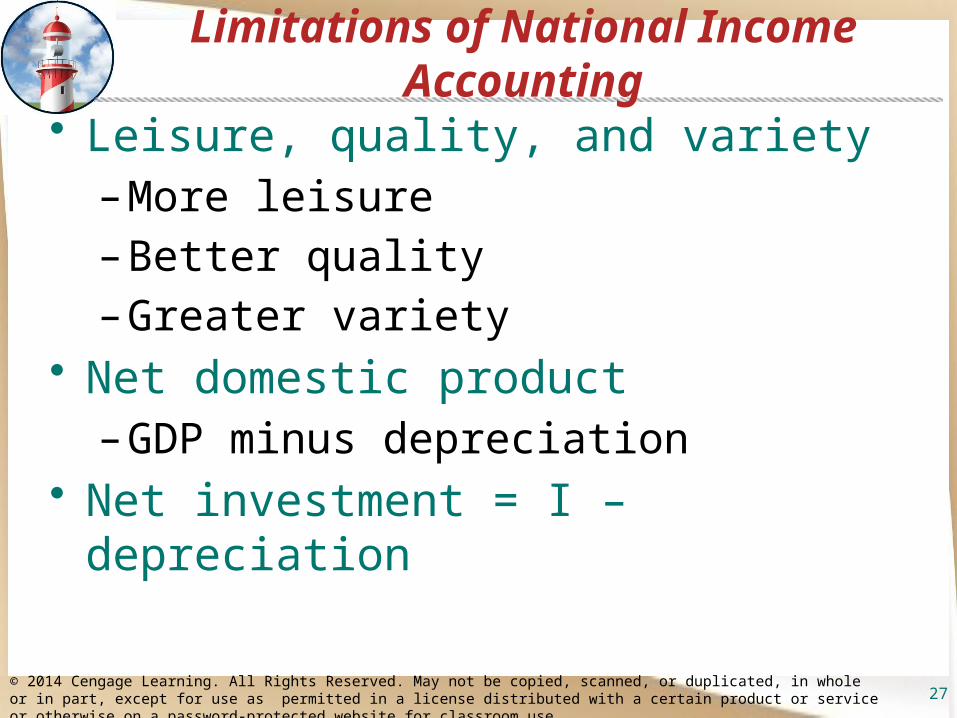
• Leisure, quality, and variety– More leisure– Better quality– Greater variety
• Net domestic product– GDP minus depreciation
• Net investment = I – depreciation
© 2014 Cengage Learning. All Rights Reserved. May not be copied, scanned, or duplicated, in whole or in part, except for use as permitted in a license distributed with a certain product or service or otherwise on a password-protected website for classroom use.
27
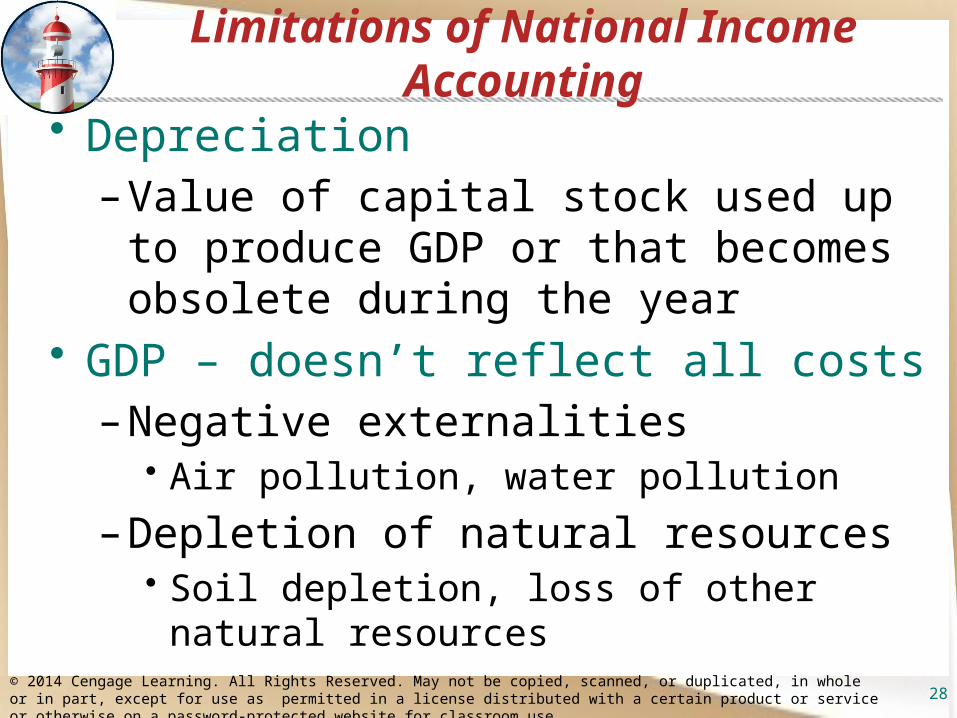
Limitations of National Income Accounting
• Depreciation– Value of capital stock used up to produce
GDP or that becomes obsolete during the year
• GDP – doesn’t reflect all costs– Negative externalities
• Air pollution, water pollution
– Depletion of natural resources• Soil depletion, loss of other natural resources
© 2014 Cengage Learning. All Rights Reserved. May not be copied, scanned, or duplicated, in whole or in part, except for use as permitted in a license distributed with a certain product or service or otherwise on a password-protected website for classroom use.
28
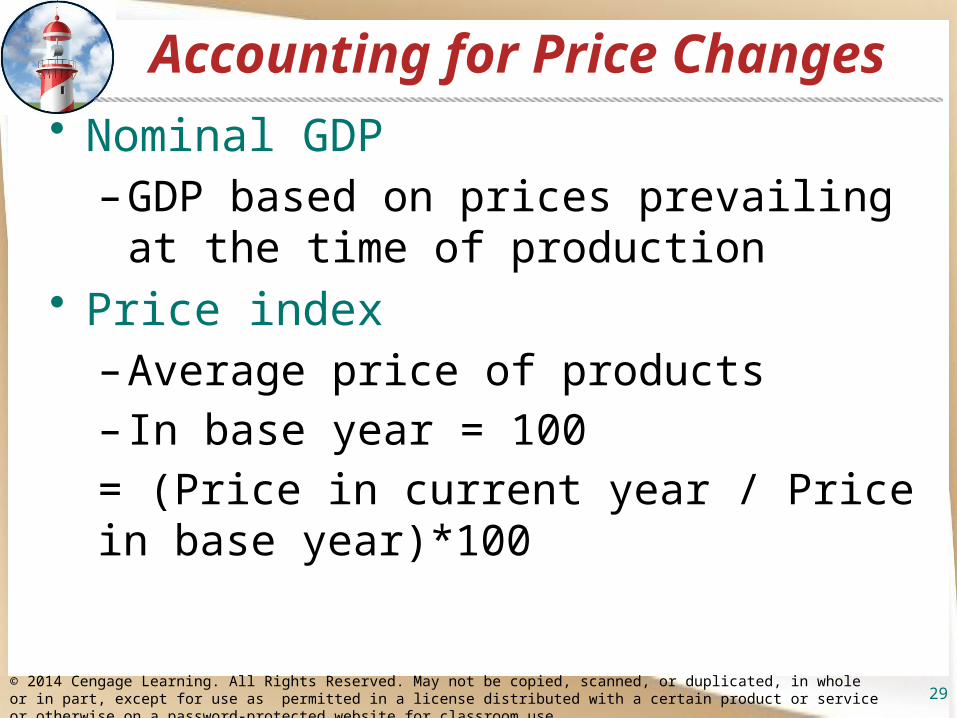
Accounting for Price Changes• Nominal GDP
– GDP based on prices prevailing at the time of production
• Price index– Average price of products– In base year = 100
= (Price in current year / Price in base year)*100
© 2014 Cengage Learning. All Rights Reserved. May not be copied, scanned, or duplicated, in whole or in part, except for use as permitted in a license distributed with a certain product or service or otherwise on a password-protected website for classroom use.
29
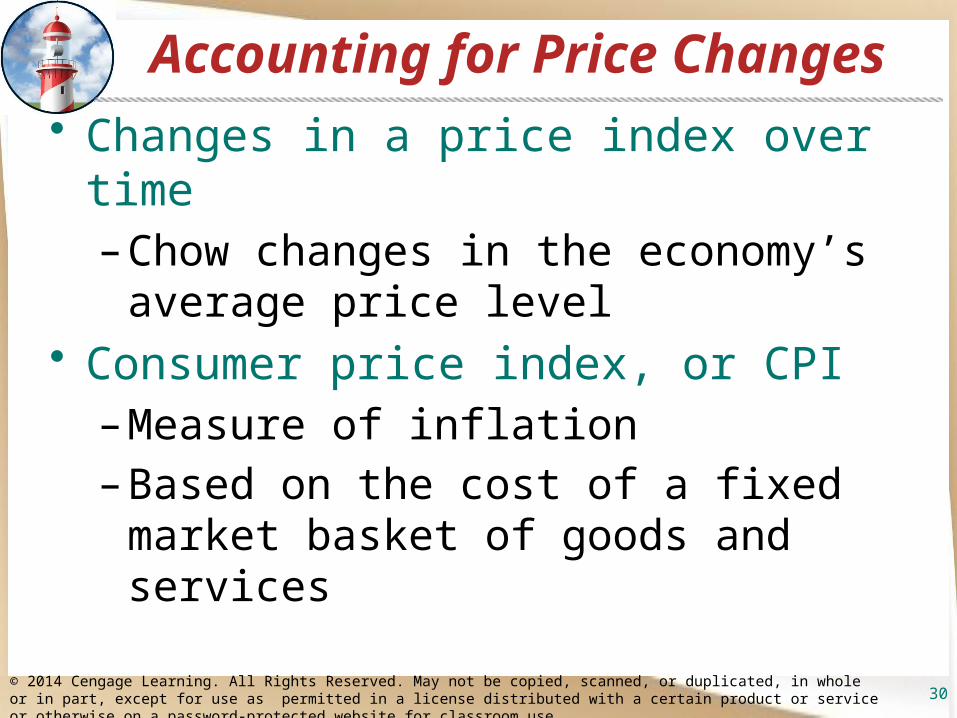
Accounting for Price Changes• Changes in a price index over time
– Chow changes in the economy’s average price level
• Consumer price index, or CPI– Measure of inflation– Based on the cost of a fixed market basket
of goods and services
© 2014 Cengage Learning. All Rights Reserved. May not be copied, scanned, or duplicated, in whole or in part, except for use as permitted in a license distributed with a certain product or service or otherwise on a password-protected website for classroom use.
30
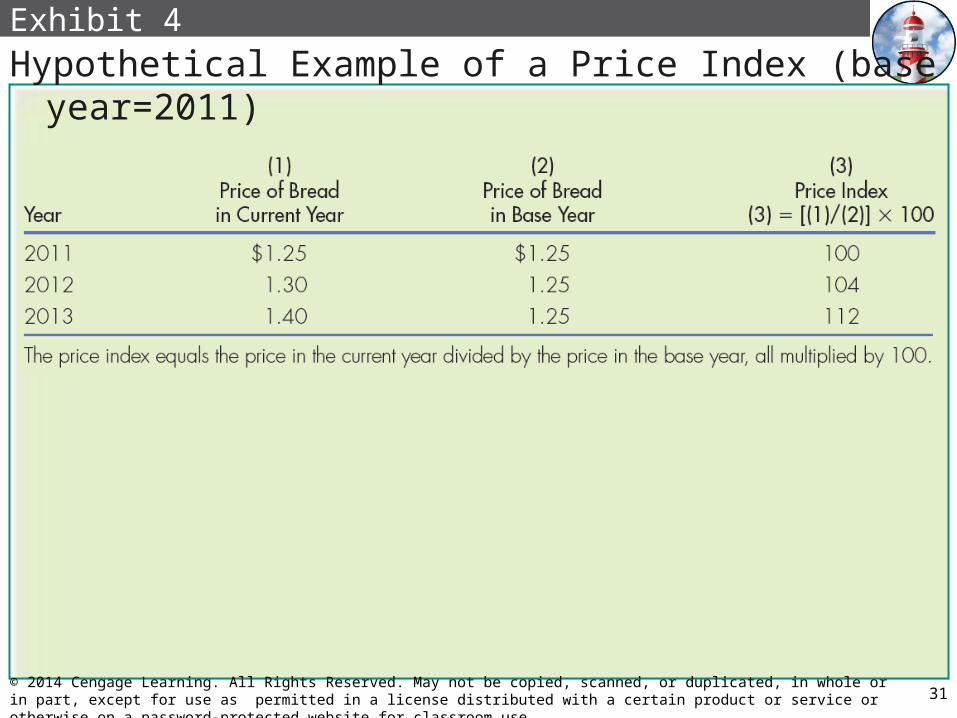
Exhibit 4
Hypothetical Example of a Price Index (base year=2011)
31© 2014 Cengage Learning. All Rights Reserved. May not be copied, scanned, or duplicated, in whole or in part, except for use as permitted in a license distributed with a certain product or service or otherwise on a password-protected website for classroom use.
Accounting for Price Changes• Consumer price index, CPI
– Market basket
= (Cost of basket in current year / Cost in base year)*100– Overstates inflation, more than 1
percentage point per year• Quality bias; Substitution• Discount stores• Widely used products
© 2014 Cengage Learning. All Rights Reserved. May not be copied, scanned, or duplicated, in whole or in part, except for use as permitted in a license distributed with a certain product or service or otherwise on a password-protected website for classroom use.
32
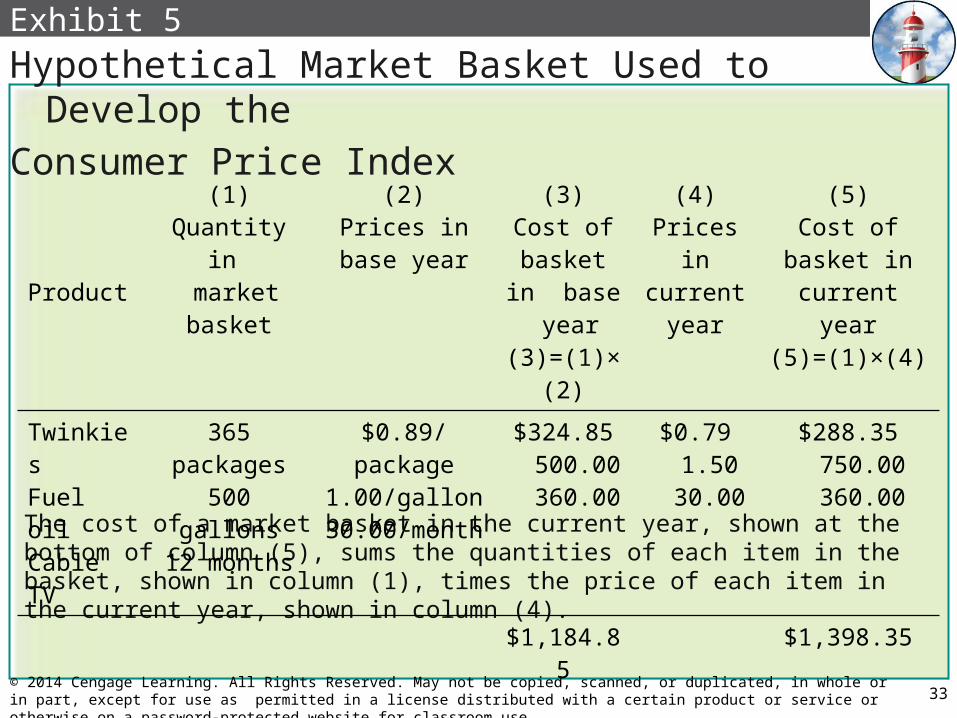
Exhibit 5
Hypothetical Market Basket Used to Develop the
Consumer Price Index
The cost of a market basket in the current year, shown at the bottom of column (5), sums the quantities of each item in the basket, shown in column (1), times the price of each item in the current year, shown in column (4).
33© 2014 Cengage Learning. All Rights Reserved. May not be copied, scanned, or duplicated, in whole or in part, except for use as permitted in a license distributed with a certain product or service or otherwise on a password-protected website for classroom use.
Product
(1)Quantity in
market basket
(2)Prices in base
year
(3)Cost of
basket in base year(3)=(1)×(2)
(4)Prices in current
year
(5)Cost of basket in current year
(5)=(1)×(4)
TwinkiesFuel oilCable TV
365 packages500 gallons12 months
$0.89/package1.00/gallon
30.00/month
$324.85 500.00 360.00
$0.79 1.50 30.00
$288.35 750.00 360.00
$1,184.85 $1,398.35
Price Check on Aisle 2
• BLS, each month:–400 data collectors–85,000 prices–211 item categories in the CPI basket–Price adjustments–Some products
• No longer on the market–Greatest challenge
• Identify substitutes for products that are no longer available
34© 2014 Cengage Learning. All Rights Reserved. May not be copied, scanned, or duplicated, in whole or in part, except for use as permitted in a license distributed with a certain product or service or otherwise on a password-protected website for classroom use.
Accounting for Price Changes• GDP price index
– Comprehensive inflation measure• Of all goods and services included in GDP
= (Nominal GDP/Real GDP)*100– Before 1995
• Fixed-weighted system; base year 1987
– Chain-weighted system; base year 2000
© 2014 Cengage Learning. All Rights Reserved. May not be copied, scanned, or duplicated, in whole or in part, except for use as permitted in a license distributed with a certain product or service or otherwise on a password-protected website for classroom use.
35
Accounting for Price Changes• Chain-weighted system
– An inflation measure – Adjusts the weights from year to year in
calculating a price index– Thereby reducing the bias caused by a
fixed-price weighting system
© 2014 Cengage Learning. All Rights Reserved. May not be copied, scanned, or duplicated, in whole or in part, except for use as permitted in a license distributed with a certain product or service or otherwise on a password-protected website for classroom use.
36
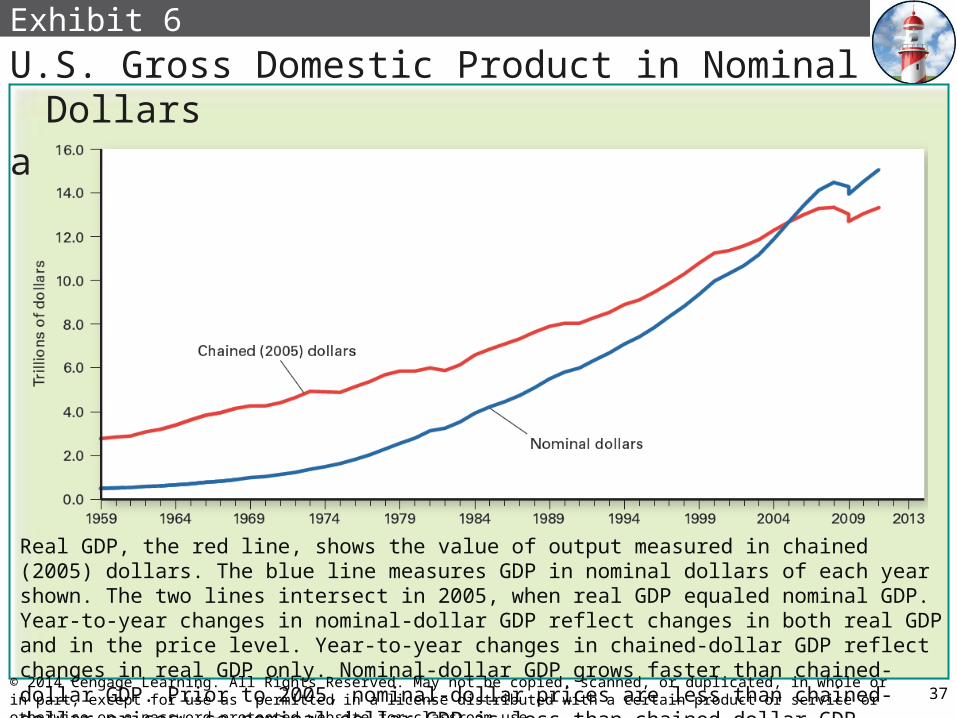
Exhibit 6
U.S. Gross Domestic Product in Nominal Dollars
and Chained (2005) Dollars
Real GDP, the red line, shows the value of output measured in chained (2005) dollars. The blue line measures GDP in nominal dollars of each year shown. The two lines intersect in 2005, when real GDP equaled nominal GDP. Year-to-year changes in nominal-dollar GDP reflect changes in both real GDP and in the price level. Year-to-year changes in chained-dollar GDP reflect changes in real GDP only. Nominal-dollar GDP grows faster than chained-dollar GDP. Prior to 2005, nominal-dollar prices are less than chained-dollar prices, so nominal-dollar GDP is less than chained-dollar GDP.
37© 2014 Cengage Learning. All Rights Reserved. May not be copied, scanned, or duplicated, in whole or in part, except for use as permitted in a license distributed with a certain product or service or otherwise on a password-protected website for classroom use.
Appendix National Income Accounts• Gross national product, GNP
–Market value –Of all final goods and services –Produced by resources supplied by U.S.
residents and firms• Regardless where those resources are
located
• GNP= GDP + net earnings of American resources abroad
38© 2014 Cengage Learning. All Rights Reserved. May not be copied, scanned, or duplicated, in whole or in part, except for use as permitted in a license distributed with a certain product or service or otherwise on a password-protected website for classroom use.

Appendix National Income Accounts• Net earnings of American resources
abroad– Income earned by American resources
abroad –Minus income earned by resources in the
United States owned by those outside the country
39© 2014 Cengage Learning. All Rights Reserved. May not be copied, scanned, or duplicated, in whole or in part, except for use as permitted in a license distributed with a certain product or service or otherwise on a password-protected website for classroom use.
Appendix National Income Accounts• Net national product
= GNP minus Depreciation• National income
= Net national product + Any statistical discrepancy
40© 2014 Cengage Learning. All Rights Reserved. May not be copied, scanned, or duplicated, in whole or in part, except for use as permitted in a license distributed with a certain product or service or otherwise on a password-protected website for classroom use.
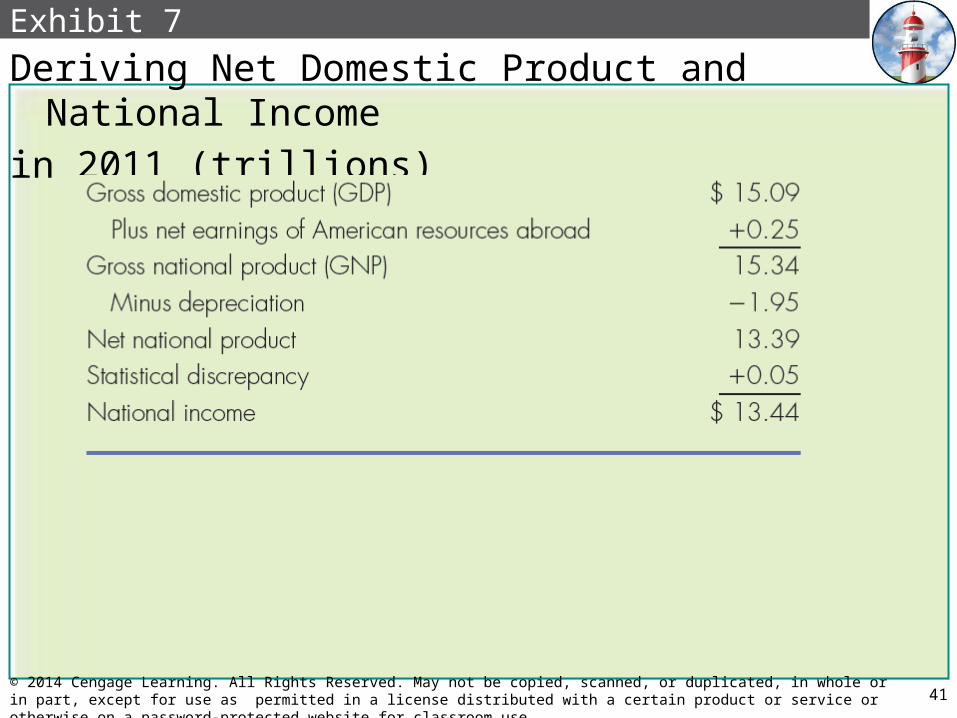
Exhibit 7
Deriving Net Domestic Product and National Income
in 2011 (trillions)
41© 2014 Cengage Learning. All Rights Reserved. May not be copied, scanned, or duplicated, in whole or in part, except for use as permitted in a license distributed with a certain product or service or otherwise on a password-protected website for classroom use.
Appendix National Income Accounts• Personal income
–National income–Plus income received but not earned–Minus income earned but not received
• Income earned but not received• Employer’s share of Social Security taxes• Taxes on production• Net of subsidies• Corporate income taxes• Undistributed corporate profits
42© 2014 Cengage Learning. All Rights Reserved. May not be copied, scanned, or duplicated, in whole or in part, except for use as permitted in a license distributed with a certain product or service or otherwise on a password-protected website for classroom use.
Appendix National Income Accounts• Income received but not earned
–Government transfer payments–Receipts from private pension plans– Interest paid by government and by
consumers• Disposable income
–Personal income minus taxes–Spend or save
43© 2014 Cengage Learning. All Rights Reserved. May not be copied, scanned, or duplicated, in whole or in part, except for use as permitted in a license distributed with a certain product or service or otherwise on a password-protected website for classroom use.
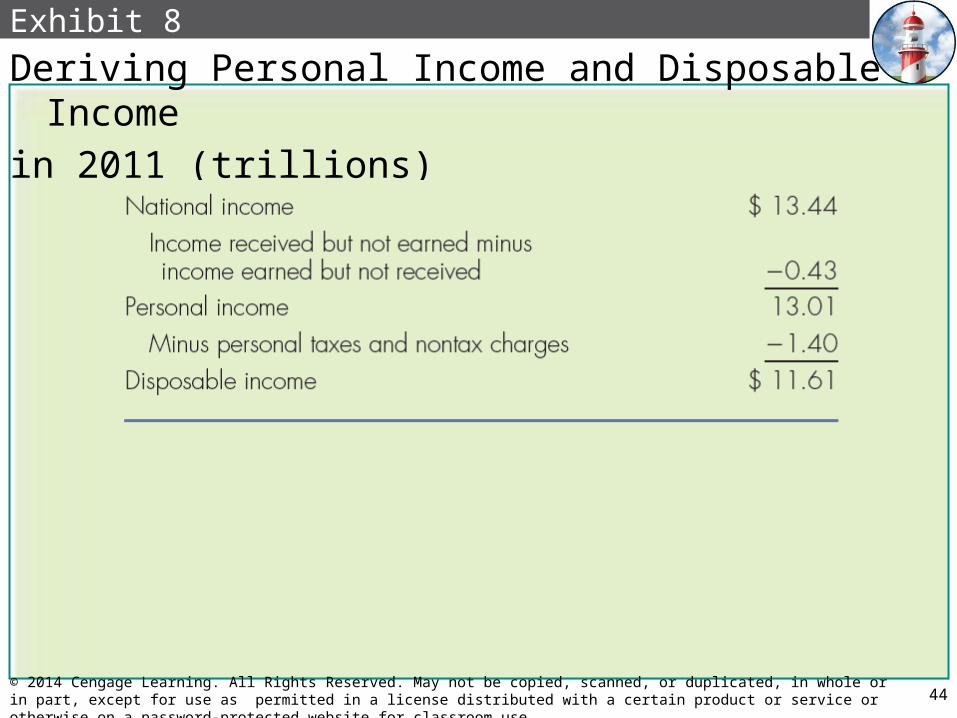
Exhibit 8
Deriving Personal Income and Disposable Income
in 2011 (trillions)
44© 2014 Cengage Learning. All Rights Reserved. May not be copied, scanned, or duplicated, in whole or in part, except for use as permitted in a license distributed with a certain product or service or otherwise on a password-protected website for classroom use.
Appendix National Income Accounts• Summary income statement of the
economy–Aggregate expenditure
• Consumption• Gross investment• Government purchases• Net exports
45© 2014 Cengage Learning. All Rights Reserved. May not be copied, scanned, or duplicated, in whole or in part, except for use as permitted in a license distributed with a certain product or service or otherwise on a password-protected website for classroom use.
Appendix National Income Accounts• Summary income statement of the
economy–Aggregate income
• Employee compensation• Proprietors’ income• Corporate profits• Net interest• Rental income of persons
46© 2014 Cengage Learning. All Rights Reserved. May not be copied, scanned, or duplicated, in whole or in part, except for use as permitted in a license distributed with a certain product or service or otherwise on a password-protected website for classroom use.
Appendix National Income Accounts• Employee compensation
–Money wages–Employer contributions
• Social Security taxes, medical insurance, and other fringe benefits
• Proprietors’ income–Earnings of unincorporated businesses
47© 2014 Cengage Learning. All Rights Reserved. May not be copied, scanned, or duplicated, in whole or in part, except for use as permitted in a license distributed with a certain product or service or otherwise on a password-protected website for classroom use.
Appendix National Income Accounts• Corporate profits
–Net revenues received by incorporated businesses• Before subtracting corporate income taxes
• Net interest– Interest received by individuals–Excludes
• Interest paid by consumers to businesses• Interest paid by government
48© 2014 Cengage Learning. All Rights Reserved. May not be copied, scanned, or duplicated, in whole or in part, except for use as permitted in a license distributed with a certain product or service or otherwise on a password-protected website for classroom use.
Appendix National Income Accounts• Rental income of persons
– Imputed rental value of owner-occupied housing
–Minus the cost of owning that property • Property taxes, insurance, depreciation• Interest paid on the mortgage
49© 2014 Cengage Learning. All Rights Reserved. May not be copied, scanned, or duplicated, in whole or in part, except for use as permitted in a license distributed with a certain product or service or otherwise on a password-protected website for classroom use.
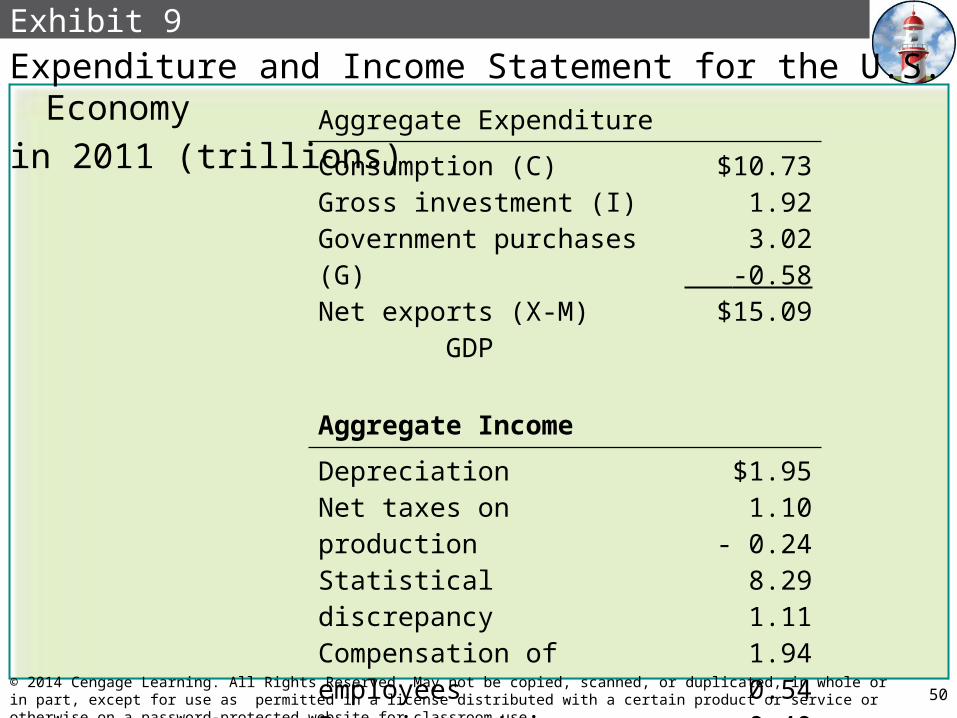
Exhibit 9
Expenditure and Income Statement for the U.S. Economy
in 2011 (trillions)
50© 2014 Cengage Learning. All Rights Reserved. May not be copied, scanned, or duplicated, in whole or in part, except for use as permitted in a license distributed with a certain product or service or otherwise on a password-protected website for classroom use.
Aggregate Expenditure
Consumption (C) Gross investment (I)Government purchases (G)Net exports (X-M) GDP
$10.73 1.92 3.02 -0.58$15.09
Aggregate Income
DepreciationNet taxes on productionStatistical discrepancyCompensation of employeesProprietors’ incomeCorporate profitsNet interestRental income of persons GDP
$1.95 1.10- 0.24
8.29 1.11 1.94 0.54 0.40$15.09