Embed Size (px)
Citation preview

192
c h a p t e r
The Instruments of Trade Policy
Previous chapters have answered the question, “Why do nations trade?” bydescribing the causes and effects of international trade and the functioningof a trading world economy. While this question is interesting in itself, its
answer is even more interesting if it also helps answer the question, “What shoulda nation’s trade policy be?” For example, should the United States use a tariff oran import quota to protect its automobile industry against competition fromJapan and South Korea? Who will benefit and who will lose from an importquota? Will the benefits outweigh the costs?
This chapter examines the policies that governments adopt toward interna-tional trade, policies that involve a number of different actions. These actionsinclude taxes on some international transactions, subsidies for other transac-tions, legal limits on the value or volume of particular imports, and many othermeasures. The chapter thus provides a framework for understanding the effectsof the most important instruments of trade policy.
LEARNING GOALS
After reading this chapter, you will be able to:
• Evaluate the costs and benefits of tariffs, their welfare effects, and winnersand losers of tariff policies.
• Discuss what export subsidies and agricultural subsidies are, and explainhow they affect trade in agriculture in the United States and the EuropeanUnion.
• Recognize the effect of voluntary export restraints (VERs) on both importingand exporting countries, and describe how the welfare effects of these VERscompare with tariff and quota policies.
Basic Tariff AnalysisA tariff, the simplest of trade policies, is a tax levied when a good is imported. Specifictariffs are levied as a fixed charge for each unit of goods imported (for example, $3 perbarrel of oil). Ad valorem tariffs are taxes that are levied as a fraction of the value of theimported goods (for example, a 25 percent U.S. tariff on imported trucks—see the follow-ing box). In either case, the effect of the tariff is to raise the cost of shipping goods to acountry.
Part
Tw
o
9In
tern
atio
nal
Trad
eP
olic
y
M09_KRUG6654_09_SE_C09.QXD 10/20/10 9:54 PM Page 192
Tariffs are the oldest form of trade policy and have traditionally been used as asource of government income. Until the introduction of the income tax, for instance,the U.S. government raised most of its revenue from tariffs. Their true purpose, how-ever, has usually been twofold: both to provide revenue and to protect particulardomestic sectors. In the early 19th century, for example, the United Kingdom used tar-iffs (the famous Corn Laws) to protect its agriculture from import competition. In thelate 19th century, both Germany and the United States protected their new industrialsectors by imposing tariffs on imports of manufactured goods. The importance oftariffs has declined in modern times because modern governments usually prefer toprotect domestic industries through a variety of nontariff barriers, such as importquotas (limitations on the quantity of imports) and export restraints (limitations onthe quantity of exports—usually imposed by the exporting country at the importingcountry’s request). Nonetheless, an understanding of the effects of a tariff remains vitalfor understanding other trade policies.
In developing the theory of trade in Chapters 3 through 8, we adopted a general equi-librium perspective. That is, we were keenly aware that events in one part of the economyhave repercussions elsewhere. However, in many (though not all) cases, trade policiestoward one sector can be reasonably well understood without going into detail about thosepolicies’ repercussions on the rest of the economy. For the most part, then, trade policycan be examined in a partial equilibrium framework. When the effects on the economy asa whole become crucial, we will refer back to general equilibrium analysis.
Supply, Demand, and Trade in a Single IndustryLet’s suppose there are two countries, Home and Foreign, both of which consume and pro-duce wheat, which can be costlessly transported between the countries. In each country,wheat is a simple competitive industry in which the supply and demand curves are functionsof the market price. Normally, Home supply and demand will depend on the price in termsof Home currency, and Foreign supply and demand will depend on the price in terms ofForeign currency. However, we assume that the exchange rate between the currencies is notaffected by whatever trade policy is undertaken in this market. Thus we quote prices in bothmarkets in terms of Home currency.
Trade will arise in such a market if prices are different in the absence of trade.Suppose that in the absence of trade, the price of wheat is higher in Home than it is inForeign. Now let’s allow foreign trade. Since the price of wheat in Home exceeds theprice in Foreign, shippers begin to move wheat from Foreign to Home. The export ofwheat raises its price in Foreign and lowers its price in Home until the difference inprices has been eliminated.
To determine the world price and the quantity traded, it is helpful to define two newcurves: the Home import demand curve and the Foreign export supply curve, which arederived from the underlying domestic supply and demand curves. Home import demand isthe excess of what Home consumers demand over what Home producers supply; Foreignexport supply is the excess of what Foreign producers supply over what Foreign con-sumers demand.
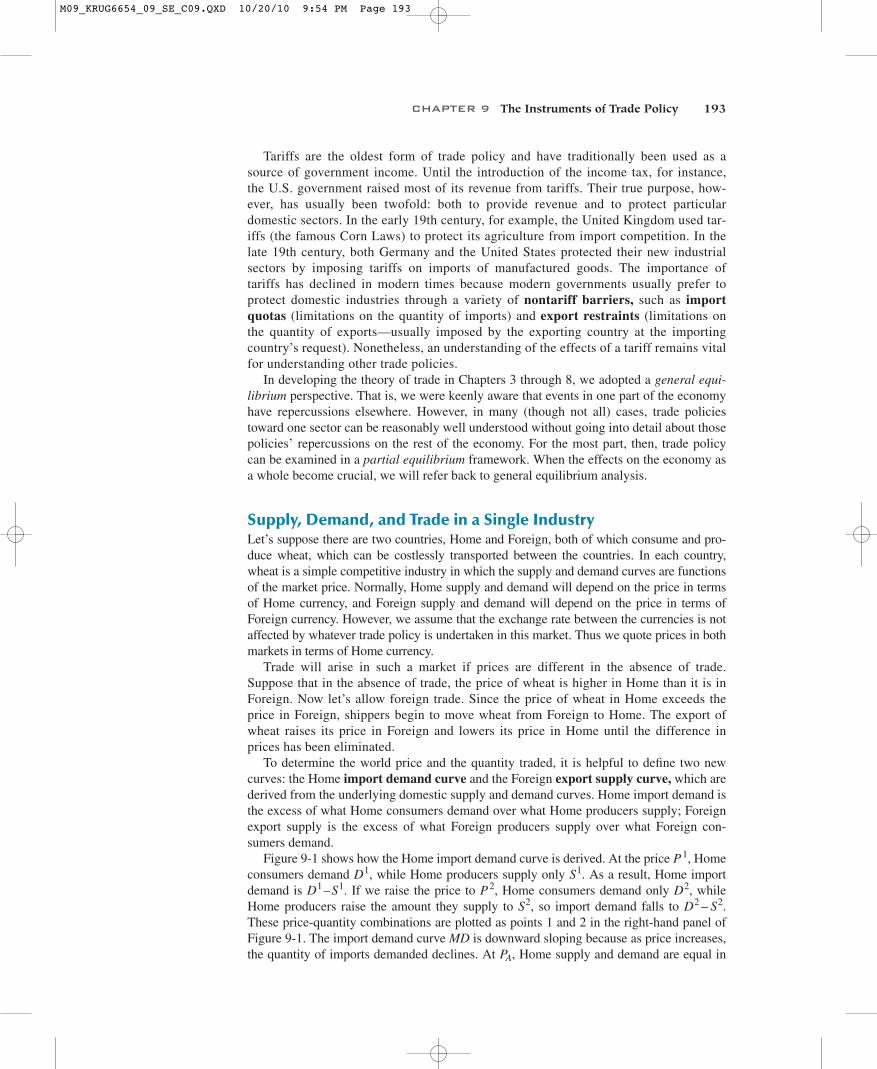
Figure 9-1 shows how the Home import demand curve is derived. At the price , Homeconsumers demand , while Home producers supply only . As a result, Home importdemand is . If we raise the price to , Home consumers demand only , whileHome producers raise the amount they supply to , so import demand falls to .These price-quantity combinations are plotted as points 1 and 2 in the right-hand panel ofFigure 9-1. The import demand curve MD is downward sloping because as price increases,the quantity of imports demanded declines. At , Home supply and demand are equal inPA
D2 – S2S2D2P2D1–S1
S1D1P1
CHAPTER 9 The Instruments of Trade Policy 193
M09_KRUG6654_09_SE_C09.QXD 10/20/10 9:54 PM Page 193
194 PART TWO International Trade Policy
the absence of trade, so the Home import demand curve intercepts the price axis at.
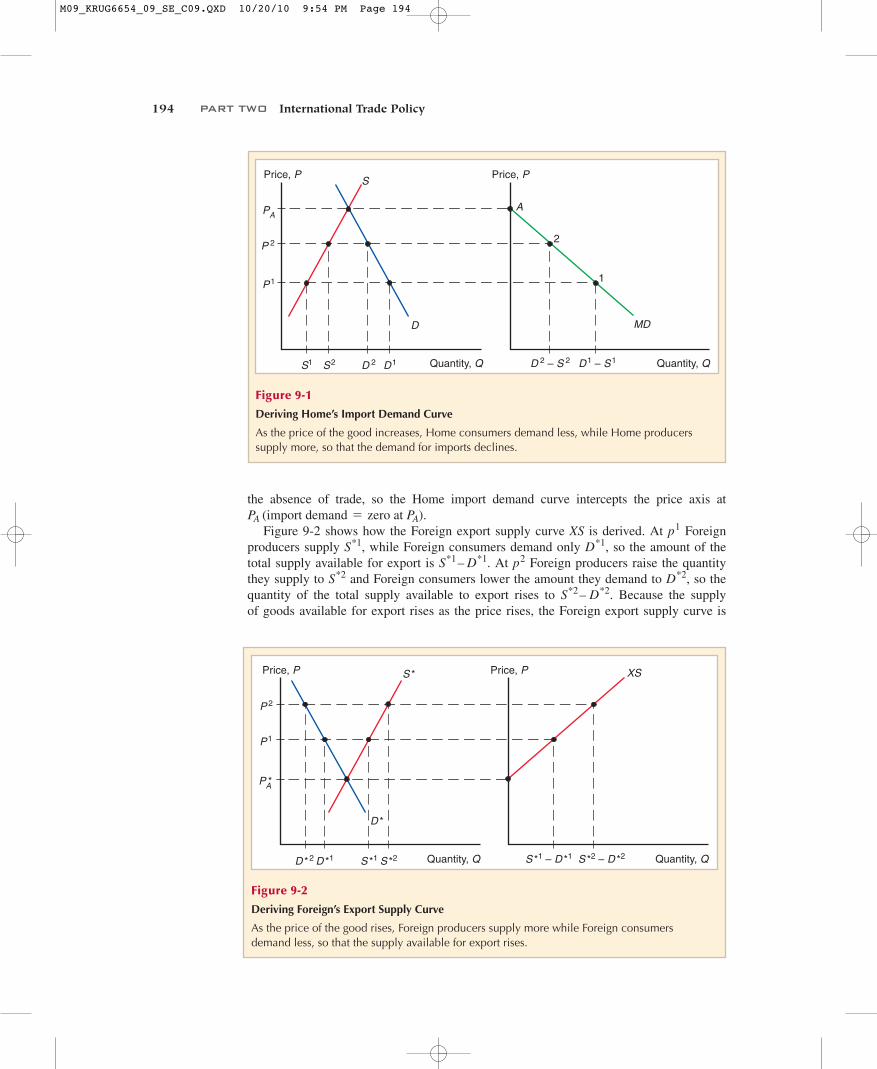
Figure 9-2 shows how the Foreign export supply curve XS is derived. At Foreignproducers supply , while Foreign consumers demand only , so the amount of thetotal supply available for export is . At Foreign producers raise the quantitythey supply to and Foreign consumers lower the amount they demand to , so thequantity of the total supply available to export rises to . Because the supplyof goods available for export rises as the price rises, the Foreign export supply curve is
S*2– D*2D*2S*2
p2S*1– D*1D*1S*1
p1PA (import demand = zero at PA)
Price, P
Quantity, Q
PA
P1
P 2
D 2 D1S2S1
Price, P
MDD
S
D 2 – S 2 D1 – S1Quantity, Q
A
1
2
Figure 9-1
Deriving Home’s Import Demand Curve
As the price of the good increases, Home consumers demand less, while Home producerssupply more, so that the demand for imports declines.
Price, P
Quantity, Q
P1
P 2
D *2 D *1 S *2S *1
Price, P XS
D *
S *
S *2 – D *2S *1 – D *1Quantity, Q
PA*
Figure 9-2
Deriving Foreign’s Export Supply Curve
As the price of the good rises, Foreign producers supply more while Foreign consumers demand less, so that the supply available for export rises.
M09_KRUG6654_09_SE_C09.QXD 10/20/10 9:54 PM Page 194

CHAPTER 9 The Instruments of Trade Policy 195
upward sloping. At , supply and demand would be equal in the absence of trade, so theForeign export supply curve intersects the price axis at .
World equilibrium occurs when Home import demand equals Foreign export supply(Figure 9-3). At the price where the two curves cross, world supply equals worlddemand. At the equilibrium point 1 in Figure 9-3,
By adding and subtracting from both sides, this equation can be rearranged to say that
or, in other words,
Effects of a TariffFrom the point of view of someone shipping goods, a tariff is just like a cost of transporta-tion. If Home imposes a tax of $2 on every bushel of wheat imported, shippers will be un-willing to move the wheat unless the price difference between the two markets is at least $2.
Figure 9-4 illustrates the effects of a specific tariff of $t per unit of wheat (shown as t inthe figure). In the absence of a tariff, the price of wheat would be equalized at in bothHome and Foreign, as seen at point 1 in the middle panel, which illustrates the world mar-ket. With the tariff in place, however, shippers are not willing to move wheat from Foreignto Home unless the Home price exceeds the Foreign price by at least $t. If no wheat is be-ing shipped, however, there will be an excess demand for wheat in Home and an excesssupply in Foreign. Thus the price in Home will rise and that in Foreign will fall until theprice difference is $t.
Introducing a tariff, then, drives a wedge between the prices in the two markets. Thetariff raises the price in Home to and lowers the price in Foreign to . InHome, producers supply more at the higher price, while consumers demand less, so thatfewer imports are demanded (as you can see in the move from point 1 to point 2 on theMD curve). In Foreign, the lower price leads to reduced supply and increased demand, andthus a smaller export supply (as seen in the move from point 1 to point 3 on the XS curve).Thus the volume of wheat traded declines from , the free trade volume, to , theQTQW
PT*
= PT - tPT
PW
World demand = World supply.
Home demand + Foreign demand = Home supply + Foreign supply
Home demand - Home supply = Foreign supply - Foreign demand.
PW
PA* 1export supply = zero at PA
*2PA*
Price, P
Quantity, Q
PW
MD
XS
QW
1
Figure 9-3
World Equilibrium
The equilibrium world price is whereHome import demand (MD curve)equals Foreign export supply (XS curve).
M09_KRUG6654_09_SE_C09.QXD 10/20/10 9:54 PM Page 195

196 PART TWO International Trade Policy
volume with a tariff. At the trade volume , Home import demand equals Foreign exportsupply when .
The increase in the price in Home, from to , is less than the amount of the tariff,because part of the tariff is reflected in a decline in Foreign’s export price and thus is notpassed on to Home consumers. This is the normal result of a tariff and of any trade policythat limits imports. The size of this effect on the exporters’ price, however, is often verysmall in practice. When a small country imposes a tariff, its share of the world market forthe goods it imports is usually minor to begin with, so that its import reduction has verylittle effect on the world (foreign export) price.
The effects of a tariff in the “small country” case where a country cannot affectforeign export prices are illustrated in Figure 9-5. In this case, a tariff raises the price ofthe imported good in the country imposing the tariff by the full amount of the tariff, from
to . Production of the imported good rises from to , while consumption ofthe good falls from to . As a result of the tariff, then, imports fall in the countryimposing the tariff.
Measuring the Amount of ProtectionA tariff on an imported good raises the price received by domestic producers of that good.This effect is often the tariff’s principal objective—to protect domestic producers from thelow prices that would result from import competition. In analyzing trade policy in practice, itis important to ask how much protection a tariff or other trade policy actually provides. Theanswer is usually expressed as a percentage of the price that would prevail under free trade.An import quota on sugar could, for example, raise the price received by U.S. sugar producersby 35 percent.
Measuring protection would seem to be straightforward in the case of a tariff: If thetariff is an ad valorem tax proportional to the value of the imports, the tariff rate itselfshould measure the amount of protection; if the tariff is specific, dividing the tariff by theprice net of the tariff gives us the ad valorem equivalent.
D2D1S2s1PW + tPW
PTPW
PT - PT*
= tQT
Home market World market Foreign market
Price, P
PW
Quantity, Q
D
S
PT
Price, P
Quantity, QQT
D *
S *
Price, P
Quantity, QQW
MD
XS
PT*
21
3
t
Figure 9-4
Effects of a Tariff
A tariff raises the price in Home while lowering the price in Foreign. The volume traded thus declines.
M09_KRUG6654_09_SE_C09.QXD 10/20/10 9:54 PM Page 196

CHAPTER 9 The Instruments of Trade Policy 197
Price, P
Quantity, Q
PW + t
D
S
D2 D1S1 S2
Imports after tariff
Imports before tariff
PW
Figure 9-5
A Tariff in a Small Country
When a country is small, a tariff itimposes cannot lower the foreignprice of the good it imports. As aresult, the price of the import risesfrom to and the quan-tity of imports demanded fallsfrom to .D2
- S2D1- S1
PW + tPW
However, there are two problems with trying to calculate the rate of protection thissimply. First, if the small country assumption is not a good approximation, part of theeffect of a tariff will be to lower foreign export prices rather than to raise domestic prices.This effect of trade policies on foreign export prices is sometimes significant.
The second problem is that tariffs may have very different effects on different stages ofproduction of a good. A simple example illustrates this point.
Suppose that an automobile sells on the world market for $8,000 and that the parts outof which that automobile is made sell for $6,000. Let’s compare two countries: one thatwants to develop an auto assembly industry and one that already has an assembly industryand wants to develop a parts industry.
To encourage a domestic auto industry, the first country places a 25 percent tariffon imported autos, allowing domestic assemblers to charge $10,000 instead of $8,000. Inthis case it would be wrong to say that the assemblers receive only 25 percent protection.Before the tariff, domestic assembly would take place only if it could be done for $2,000(the difference between the $8,000 price of a completed automobile and the $6,000 cost ofparts) or less; now it will take place even if it costs as much as $4,000 (the differencebetween the $10,000 price and the cost of parts). That is, the 25 percent tariff rate providesassemblers with an effective rate of protection of 100 percent.
Now suppose that the second country, to encourage domestic production of parts,imposes a 10 percent tariff on imported parts, raising the cost of parts of domesticassemblers from $6,000 to $6,600. Even though there is no change in the tariff onassembled automobiles, this policy makes it less advantageous to assemble domesti-cally. Before the tariff it would have been worth assembling a car locally if it could bedone for ; after the tariff, local assembly takes place onlyif it can be done for . The tariff on parts, then, while provid-ing positive protection to parts manufacturers, provides negative effective protection toassembly at the rate of
Reasoning similar to that seen in this example has led economists to make elaboratecalculations to measure the degree of effective protection actually provided to particular
-30 percent 1-600/2,0002.$1,400 1$8,000 - $6,6002$2,000 1$8,000 - $6,0002
M09_KRUG6654_09_SE_C09.QXD 10/20/10 9:54 PM Page 197
industries by tariffs and other trade policies. Trade policies aimed at promoting economicdevelopment, for example (Chapter 11), often lead to rates of effective protection muchhigher than the tariff rates themselves.1
Costs and Benefits of a TariffA tariff raises the price of a good in the importing country and lowers it in the exporting country.As a result of these price changes, consumers lose in the importing country and gain in the ex-porting country. Producers gain in the importing country and lose in the exporting country. Inaddition, the government imposing the tariff gains revenue. To compare these costs and benefits,it is necessary to quantify them. The method for measuring costs and benefits of a tariff dependson two concepts common to much microeconomic analysis: consumer and producer surplus.
Consumer and Producer SurplusConsumer surplus measures the amount a consumer gains from a purchase by computingthe difference between the price he actually pays and the price he would have been willingto pay. If, for example, a consumer would have been willing to pay $8 for a bushel ofwheat but the price is only $3, the consumer surplus gained by the purchase is $5.
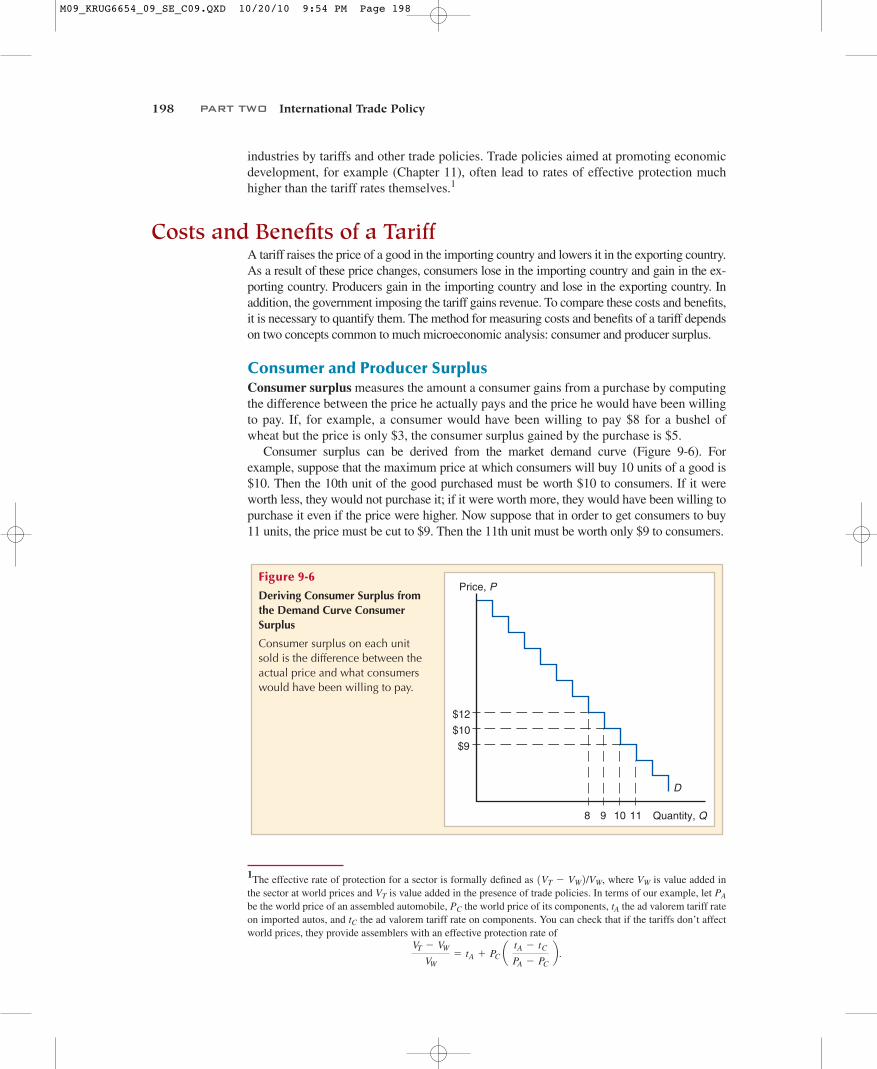
Consumer surplus can be derived from the market demand curve (Figure 9-6). Forexample, suppose that the maximum price at which consumers will buy 10 units of a good is$10. Then the 10th unit of the good purchased must be worth $10 to consumers. If it wereworth less, they would not purchase it; if it were worth more, they would have been willing topurchase it even if the price were higher. Now suppose that in order to get consumers to buy11 units, the price must be cut to $9. Then the 11th unit must be worth only $9 to consumers.
198 PART TWO International Trade Policy
Price, P
Quantity, Q
D
$12
$10
$9
8 9 10 11
Figure 9-6
Deriving Consumer Surplus fromthe Demand Curve ConsumerSurplus
Consumer surplus on each unitsold is the difference between theactual price and what consumerswould have been willing to pay.
1The effective rate of protection for a sector is formally defined as , where is value added inthe sector at world prices and is value added in the presence of trade policies. In terms of our example, let be the world price of an assembled automobile, the world price of its components, the ad valorem tariff rateon imported autos, and the ad valorem tariff rate on components. You can check that if the tariffs don’t affectworld prices, they provide assemblers with an effective protection rate of
VT - VW
VW= tA + PC a
tA - tC
PA - PC b .
tC
tAPC
PAVT
VW1VT - VW2/VW
M09_KRUG6654_09_SE_C09.QXD 10/20/10 9:54 PM Page 198

CHAPTER 9 The Instruments of Trade Policy 199
Suppose that the price is $9. Then consumers are willing to purchase only the 11thunit of the good and thus receive no consumer surplus from their purchase of that unit.They would have been willing to pay $10 for the 10th unit, however, and thus receive$1 in consumer surplus from that unit. They would also have been willing to pay$12 for the 9th unit; in that case, they would have received $3 of consumer surplus onthat unit, and so on.
Generalizing from this example, if P is the price of a good and Q the quantity demanded atthat price, then consumer surplus is calculated by subtracting P times Q from the area underthe demand curve up to Q (Figure 9-7). If the price is , the quantity demanded is and theconsumer surplus is measured by the area labeled a. If the price falls to , the quantitydemanded rises to and consumer surplus rises to equal a plus the additional area b.
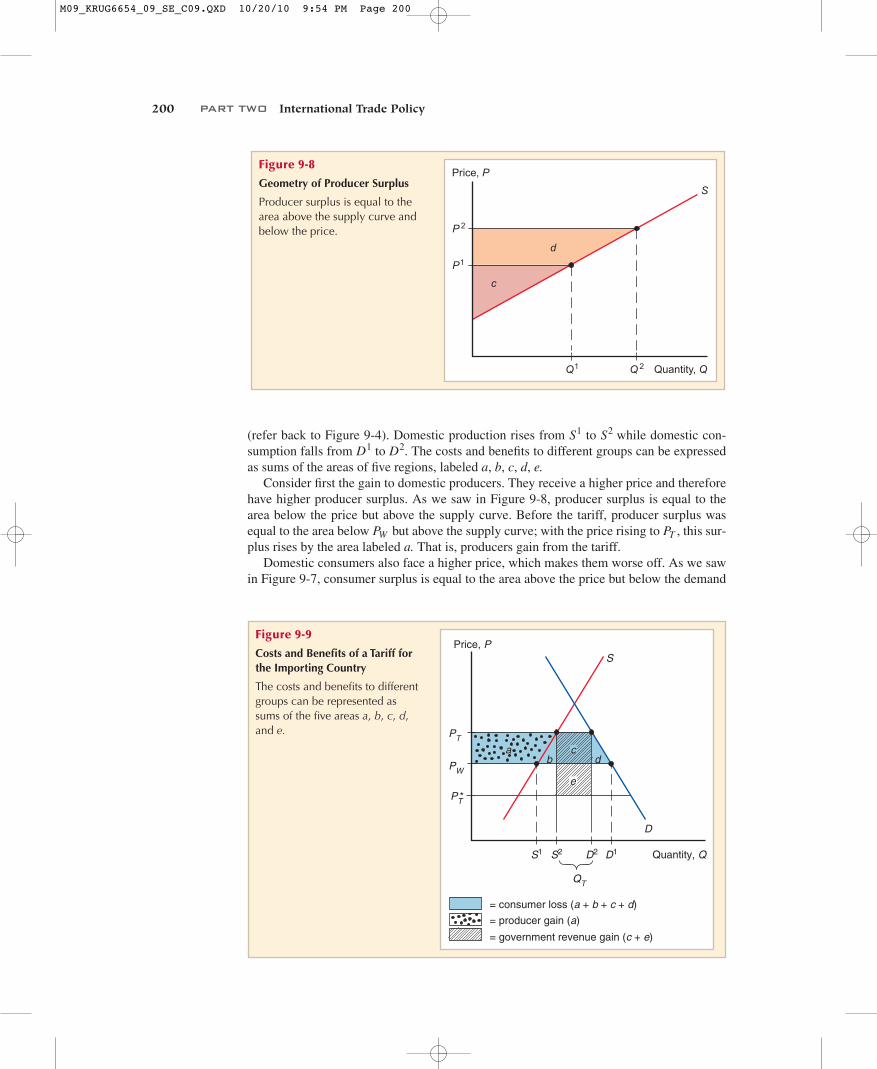
Producer surplus is an analogous concept. A producer willing to sell a good for $2 butreceiving a price of $5 gains a producer surplus of $3. The same procedure used to deriveconsumer surplus from the demand curve can be used to derive producer surplus from thesupply curve. If P is the price and Q the quantity supplied at that price, then producersurplus is P times Q minus the area under the supply curve up to Q (Figure 9-8). If theprice is , the quantity supplied will be , and producer surplus is measured by area c. Ifthe price rises to , the quantity supplied rises to , and producer surplus rises to equal cplus the additional area d.
Some of the difficulties related to the concepts of consumer and producer surplus aretechnical issues of calculation that we can safely disregard. More important is the ques-tion of whether the direct gains to producers and consumers in a given market accuratelymeasure the social gains. Additional benefits and costs not captured by consumer andproducer surplus are at the core of the case for trade policy activism discussed inChapter 10. For now, however, we will focus on costs and benefits as measured by con-sumer and producer surplus.
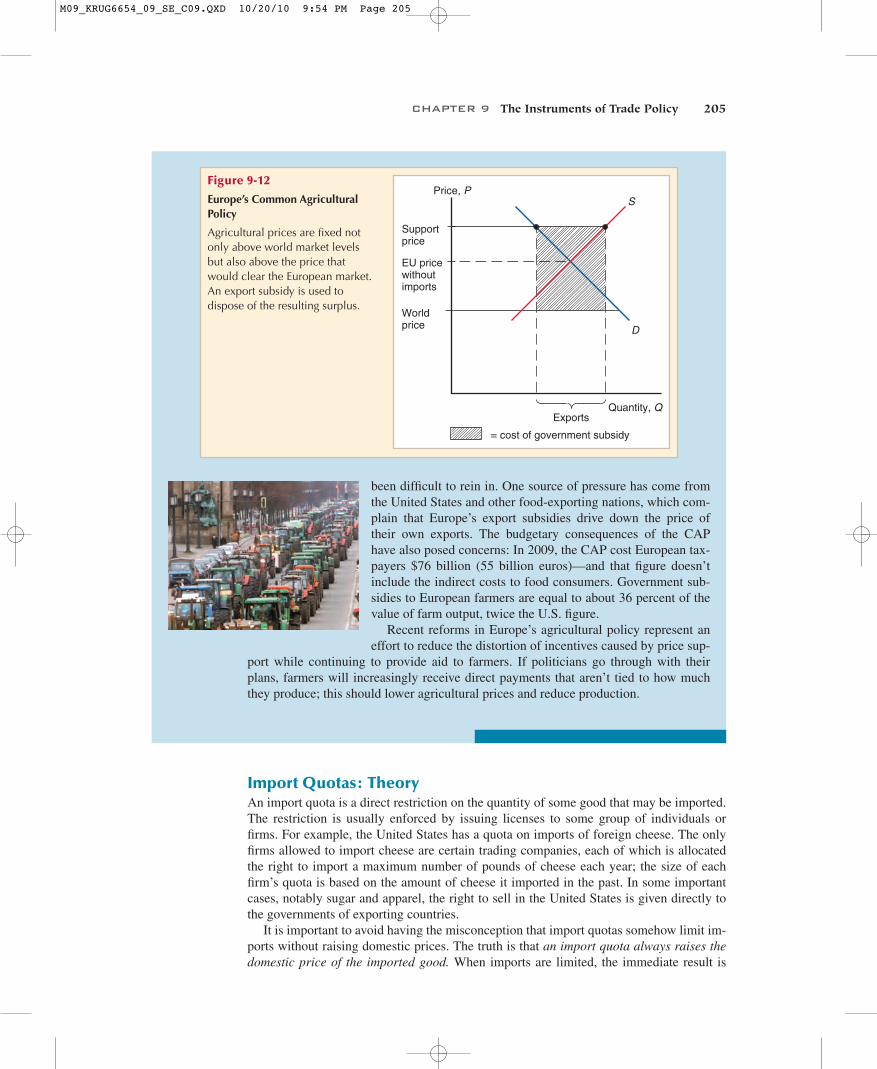
Measuring the Costs and BenefitsFigure 9-9 illustrates the costs and benefits of a tariff for the importing country. The tariffraises the domestic price from to but lowers the foreign export price from to PT
*PWPTPW
Q2P2Q1P1
Q2P2
Q1P1
Price, P
Quantity, Q
D
Q2
P2
P1
Q1
a
b
Figure 9-7
Geometry of Consumer Surplus
Consumer surplus is equal to thearea under the demand curve andabove the price.
M09_KRUG6654_09_SE_C09.QXD 10/20/10 9:54 PM Page 199
200 PART TWO International Trade Policy
(refer back to Figure 9-4). Domestic production rises from to while domestic con-sumption falls from to . The costs and benefits to different groups can be expressedas sums of the areas of five regions, labeled a, b, c, d, e.
Consider first the gain to domestic producers. They receive a higher price and thereforehave higher producer surplus. As we saw in Figure 9-8, producer surplus is equal to thearea below the price but above the supply curve. Before the tariff, producer surplus wasequal to the area below but above the supply curve; with the price rising to , this sur-plus rises by the area labeled a. That is, producers gain from the tariff.
Domestic consumers also face a higher price, which makes them worse off. As we sawin Figure 9-7, consumer surplus is equal to the area above the price but below the demand
PTPW
D2D1S2S1
Price, P
Quantity, Q
S
Q 2
P 2
P1
Q1
d
c
Figure 9-8
Geometry of Producer Surplus
Producer surplus is equal to thearea above the supply curve andbelow the price.
a
Price, P
Quantity, Q
D
S
D2 D1S1 S2
PW
= consumer loss (a + b + c + d)
= government revenue gain (c + e)
PT
= producer gain (a)
bc
d
ePT*
QT
Figure 9-9
Costs and Benefits of a Tariff forthe Importing Country
The costs and benefits to differentgroups can be represented assums of the five areas a, b, c, d,and e.
M09_KRUG6654_09_SE_C09.QXD 10/20/10 9:54 PM Page 200

CHAPTER 9 The Instruments of Trade Policy 201
curve. Since the price consumers face rises from to , the consumer surplus falls bythe area indicated by So consumers are hurt by the tariff.
There is a third player here as well: the government. The government gains by col-lecting tariff revenue. This is equal to the tariff rate t times the volume of imports
. Since , the government’s revenue is equal to the sum ofthe two areas c and e.
Since these gains and losses accrue to different people, the overall cost-benefitevaluation of a tariff depends on how much we value a dollar’s worth of benefit to eachgroup. If, for example, the producer gain accrues mostly to wealthy owners of resources,while consumers are poorer than average, the tariff will be viewed differently than if thegood is a luxury bought by the affluent but produced by low-wage workers. Furtherambiguity is introduced by the role of the government: Will it use its revenue to financevitally needed public services or waste that revenue on $1,000 toilet seats? Despite theseproblems, it is common for analysts of trade policy to attempt to compute the net effectof a tariff on national welfare by assuming that at the margin, a dollar’s worth of gain orloss to each group is of the same social worth.
Let’s look, then, at the net effect of a tariff on welfare. The net cost of a tariff is
(9-1)
or, replacing these concepts by the areas in Figure 9-9,
(9-2)
That is, there are two “triangles” whose area measures loss to the nation as a whole and a“rectangle” whose area measures an offsetting gain. A useful way to interpret these gainsand losses is the following: The triangles represent the efficiency loss that arises because atariff distorts incentives to consume and produce, while the rectangle represents the termsof trade gain that arise because a tariff lowers foreign export prices.
The gain depends on the ability of the tariff-imposing country to drive down foreignexport prices. If the country cannot affect world prices (the “small country” case
1a + b + c + d2 - a - 1c + e2 = b + d - e.
Consumer loss - producer gain - government revenue,
t = PT - PT*QT = D2
- S2
a + b + c + d.PTPW
Price, P
Quantity, Q
D
S
PW
PT
b d
e
Imports
= efficiency loss (b + d)
= terms of trade gain (e)
PT*
Figure 9-10
Net Welfare Effects of a Tariff
The colored triangles representefficiency losses, while the rectangle represents a terms of trade gain.
M09_KRUG6654_09_SE_C09.QXD 10/20/10 9:54 PM Page 201

202 PART TWO International Trade Policy
Tariffs for the Long Haul
We just saw how a tariff can be used to increaseproducer surplus at the expense of a loss in con-sumer surplus. There are also many other indirectcosts of tariffs: They can lead trading partners toretaliate with their own tariffs (thus hurtingexporting producers in the country that first im-posed the tariff); they can also be fiendishly hardto remove later on even after economic conditionshave completely changed, because they help topolitically organize the small group of producersthat is protected from foreign competition. (Wewill discuss this further in Chapter 10.) Finally,large tariffs can induce producers to behave increative—though ultimately wasteful—ways inorder to avoid them.
In the case of the tariff known as the “ChickenTax,” the tariff lasted for so long (47 years, andcounting) that it ended up hurting the sameproducers that had intensively lobbied to maintainthe tariff in the first place!* This tariff got its namebecause it was a retaliation by U.S. PresidentLyndon Johnson’s administration against a tariffon U.S. chicken exports imposed by WesternEurope in the early 1960s. The U.S. retaliation,focusing on Germany (one of the main politicalforces behind the original chicken tariff), imposeda 25 percent tariff on light commercial truckvehicles. At the time, Volkswagen was a big pro-ducer of such vehicles and exported many ofthem to the United States. As time went by, many
illustrated in Figure 9-5), region e, which represents the terms of trade gain, disap-pears, and it is clear that the tariff reduces welfare. A tariff distorts the incentives ofboth producers and consumers by inducing them to act as if imports were more expen-sive than they actually are. The cost of an additional unit of consumption to the econ-omy is the price of an additional unit of imports, yet because the tariff raises thedomestic price above the world price, consumers reduce their consumption to the pointat which that marginal unit yields them welfare equal to the tariff-inclusive domesticprice. This means that the value of an additional unit of production to the economy isthe price of the unit of imports it saves, yet domestic producers expand production tothe point at which the marginal cost is equal to the tariff-inclusive price. Thus theeconomy produces at home additional units of the good that it could purchase morecheaply abroad.
The net welfare effects of a tariff are summarized in Figure 9-10. The negative effectsconsist of the two triangles b and d. The first triangle is the production distortion lossresulting from the fact that the tariff leads domestic producers to produce too much of thisgood. The second triangle is the domestic consumption distortion loss resulting from thefact that a tariff leads consumers to consume too little of the good. Against these lossesmust be set the terms of trade gain measured by the rectangle e, which results from thedecline in the foreign export price caused by a tariff. In the important case of a small coun-try that cannot significantly affect foreign prices, this last effect drops out; thus the costs ofa tariff unambiguously exceed its benefits.
Other Instruments of Trade PolicyTariffs are the simplest trade policies, but in the modern world, most government inter-vention in international trade takes other forms, such as export subsidies, import quotas,voluntary export restraints, and local content requirements. Fortunately, once we haveunderstood tariffs, it is not too difficult to understand these other trade instruments.
M09_KRUG6654_09_SE_C09.QXD 10/20/10 9:54 PM Page 202

CHAPTER 9 The Instruments of Trade Policy 203
of the original tariffs were dropped, except for theones on chickens and light commercial trucks.Volkswagen stopped producing those vehicles, butthe U.S. “big three” auto and truck producerswere then concerned about competition fromJapanese truck producers and lobbied to keep thetariff in place.
Japanese producers responded by building thoselight trucks in the United States (see Chapter 8).†
As a result, the latest company to be hit by theconsequences of the tariff is Ford, one of those“big three” U.S. producers! Ford produces a smallcommercial van in Europe, the “Transit Connect,”which is designed (with its smaller capacity and
ability to navigate old, narrow streets) forEuropean cities. The recent spike in fuel pricessharply increased demand in some U.S. citiesfor this truck. In 2009, Ford started selling thesevehicles in the United States. To get around the25 percent tariff, Ford installs rear windows, rearseats, and seat belts prior to shipping the vehiclesto the United States. These vehicles are no longerclassified as commercial trucks but as passengervehicles, which are subject to the much lower2.5 percent tariff. Upon arrival in Baltimore, therear seats are promptly removed and the rear win-dows replaced with metal panels—before deliveryto the Ford dealers.
*See Matthew Dolan, “To Outfox the Chicken Tax, Ford Strips Its Own Vans,” Wall Street Journal, September 23, 2009.†Before opening production facilities in the United States, Subaru got around the tariff by bolting two plastic seats to theopen bed of the pickup truck (Subaru BRAT) that the company exported to the United States, thus evading the lightcommercial truck classification.
Export Subsidies: TheoryAn export subsidy is a payment to a firm or individual that ships a good abroad. Like atariff, an export subsidy can be either specific (a fixed sum per unit) or ad valorem (a pro-portion of the value exported). When the government offers an export subsidy, shipperswill export the good up to the point at which the domestic price exceeds the foreign priceby the amount of the subsidy.
The effects of an export subsidy on prices are exactly the reverse of those of a tariff(Figure 9-11). The price in the exporting country rises from to , but because the pricein the importing country falls from to , the price increase is less than the subsidy.PS
*PW
PSPW
*
a
Price, P
Quantity, Q
D
S
PW
= consumer loss (a + b)
PS
= producer gain (a + b + c)
d
= cost of government subsidy (b + c + d + e + f + g)
Exports
e f g
b c
PS
Subsidy
Figure 9-11
Effects of an Export Subsidy
An export subsidy raises prices in the exporting country whilelowering them in the importingcountry.
M09_KRUG6654_09_SE_C09.QXD 10/20/10 9:54 PM Page 203

204 PART TWO International Trade Policy
In the exporting country, consumers are hurt, producers gain, and the government losesbecause it must expend money on the subsidy. The consumer loss is the area ; theproducer gain is the area ; the government subsidy (the amount of exports timesthe amount of the subsidy) is the area . The net welfare loss istherefore the sum of the areas . Of these, b and d represent consump-tion and production distortion losses of the same kind that a tariff produces. In addition, andin contrast to a tariff, the export subsidy worsens the terms of trade because it lowers theprice of the export in the foreign market from to . This leads to the additional terms oftrade loss , which is equal to times the quantity exported with the sub-sidy. So an export subsidy unambiguously leads to costs that exceed its benefits.
PW - PS*e + f + g
PS*PW
b + d + e + f + gb + c + d + e + f + g
a + b + ca + b
Case Study
Europe’s Common Agricultural PolicyIn 1957, six Western European nations—Germany, France, Italy, Belgium, theNetherlands, and Luxembourg—formed the European Economic Community, whichhas since grown to include most of Europe. Now called the European Union (EU), itstwo biggest effects are on trade policy. First, the members of the European Union haveremoved all tariffs with respect to each other, thus creating a customs union (discussedin the next chapter). Second, the agricultural policy of the European Union has devel-oped into a massive export subsidy program.
The European Union’s Common Agricultural Policy (CAP) began not as an export sub-sidy, but as an effort to guarantee high prices to European farmers by having the EuropeanUnion buy agricultural products whenever the prices fell below specified support levels. Toprevent this policy from drawing in large quantities of imports, it was initially backed bytariffs that offset the difference between European and world agricultural prices.
Since the 1970s, however, the support prices set by the European Union have turnedout to be so high that Europe—which, under free trade, would be an importer of mostagricultural products—was producing more than consumers were willing to buy. As aresult, the European Union found itself obliged to buy and store huge quantities offood. At the end of 1985, for example, European nations had stored 780,000 tons ofbeef, 1.2 million tons of butter, and 12 million tons of wheat. To avoid unlimitedgrowth in these stockpiles, the European Union turned to a policy of subsidizingexports to dispose of surplus production.
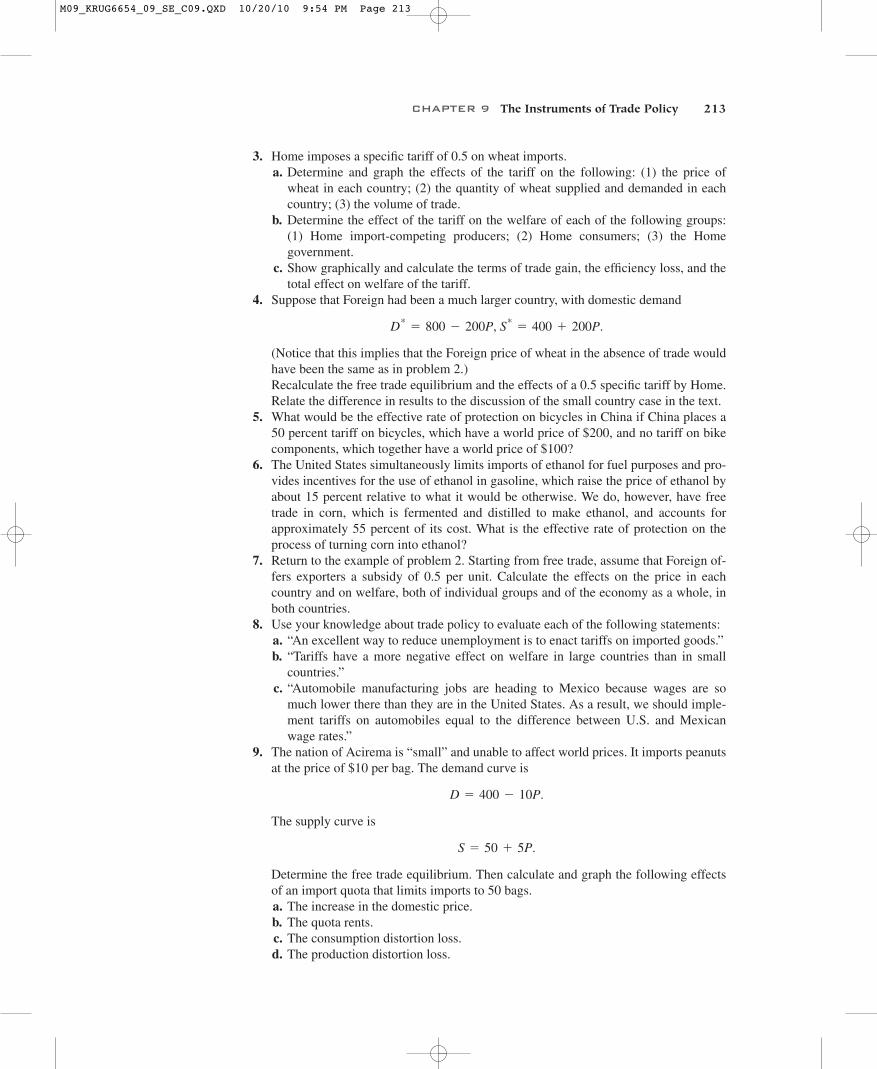
Figure 9-12 shows how the CAP works. It is, of course, exactly like the export sub-sidy shown in Figure 9-11, except that Europe would actually be an importer under freetrade. The support price is set not only above the world price that would prevail in itsabsence but also above the price that would equate demand and supply even withoutimports. To export the resulting surplus, an export subsidy is paid that offsets the differ-ence between European and world prices. The subsidized exports themselves tend todepress the world price, increasing the required subsidy. A recent study estimated thatthe welfare cost to European consumers exceeded the benefits to farm producers bynearly $30 billion (21.5 billion euros) in 2007.2
Despite the considerable net costs of the CAP to European consumers and taxpay-ers, the political strength of farmers in the EU has been so strong that the program has
2See Pierre Boulanger and Patrick Jomini, Of the Benefits to the EU of Removing the Common AgriculturalPolicy, Sciences Politique Policy Brief, 2010.
M09_KRUG6654_09_SE_C09.QXD 10/20/10 9:54 PM Page 204
CHAPTER 9 The Instruments of Trade Policy 205
been difficult to rein in. One source of pressure has come fromthe United States and other food-exporting nations, which com-plain that Europe’s export subsidies drive down the price oftheir own exports. The budgetary consequences of the CAPhave also posed concerns: In 2009, the CAP cost European tax-payers $76 billion (55 billion euros)—and that figure doesn’tinclude the indirect costs to food consumers. Government sub-sidies to European farmers are equal to about 36 percent of thevalue of farm output, twice the U.S. figure.
Recent reforms in Europe’s agricultural policy represent aneffort to reduce the distortion of incentives caused by price sup-
port while continuing to provide aid to farmers. If politicians go through with theirplans, farmers will increasingly receive direct payments that aren’t tied to how muchthey produce; this should lower agricultural prices and reduce production.
Price, P
Quantity, Q
D
S
= cost of government subsidy
Exports
Support price
Worldprice
EU price without imports
Figure 9-12
Europe’s Common AgriculturalPolicy
Agricultural prices are fixed notonly above world market levelsbut also above the price thatwould clear the European market.An export subsidy is used todispose of the resulting surplus.
Import Quotas: TheoryAn import quota is a direct restriction on the quantity of some good that may be imported.The restriction is usually enforced by issuing licenses to some group of individuals orfirms. For example, the United States has a quota on imports of foreign cheese. The onlyfirms allowed to import cheese are certain trading companies, each of which is allocatedthe right to import a maximum number of pounds of cheese each year; the size of eachfirm’s quota is based on the amount of cheese it imported in the past. In some importantcases, notably sugar and apparel, the right to sell in the United States is given directly tothe governments of exporting countries.
It is important to avoid having the misconception that import quotas somehow limit im-ports without raising domestic prices. The truth is that an import quota always raises thedomestic price of the imported good. When imports are limited, the immediate result is
M09_KRUG6654_09_SE_C09.QXD 10/20/10 9:54 PM Page 205

that at the initial price, the demand for the good exceeds domestic supply plus imports.This causes the price to be bid up until the market clears. In the end, an import quota willraise domestic prices by the same amount as a tariff that limits imports to the same level(except in the case of domestic monopoly, in which the quota raises prices more than this;see the appendix to this chapter).
The difference between a quota and a tariff is that with a quota, the government receivesno revenue. When a quota instead of a tariff is used to restrict imports, the sum of moneythat would have appeared with a tariff as government revenue is collected by whoeverreceives the import licenses. License holders are thus able to buy imports and resell them ata higher price in the domestic market. The profits received by the holders of import licensesare known as quota rents. In assessing the costs and benefits of an import quota, it is cru-cial to determine who gets the rents. When the rights to sell in the domestic market areassigned to governments of exporting countries, as is often the case, the transfer of rentsabroad makes the costs of a quota substantially higher than the equivalent tariff.
206 PART TWO International Trade Policy
Case Study
An Import Quota in Practice: U.S. SugarThe U.S. sugar problem is similar in its origins to the European agricultural problem: A domestic price guarantee by the federal government has led to U.S. prices aboveworld market levels. Unlike the European Union, however, the domestic supply in theUnited States does not exceed domestic demand. Thus the United States has beenable to keep domestic prices at the target level with an import quota on sugar.
A special feature of the import quota is that the rights to sell sugar in the UnitedStates are allocated to foreign governments, which then allocate these rights to theirown residents. As a result, rents generated by the sugar quota accrue to foreigners. Thequotas restrict the imports of both raw sugar (almost exclusively, sugar cane) as well asrefined sugar. We now describe the most recent forecast for the effects of the importrestrictions on raw sugar cane (the effects on the sugar refining industry are more com-plicated, as raw sugar is a key input of production for that industry).3
Figure 9-13 shows those forecasted effects for 2013. The quota would restrict im-ports to approximately 3 million tons; as a result, the price of raw sugar in the UnitedStates would be 35 percent above the price in the outside world. The figure is drawnwith the assumption that the United States is “small” in the world market for raw sugar;that is, removing the quota would not have a significant effect on the world price.According to this estimate, free trade would increase sugar imports by 66 percent.
The welfare effects of the import quota are indicated by the areas a, b, c, and d.Consumers lose the surplus , with a total value of $884 million. Part ofthis consumer loss represents a transfer to U.S. sugar producers, who gain the producersurplus a equal to $272 million. Part of the loss represents the production distortion b($68 million) and the consumption distortion d ($91 million). The rents to the foreigngovernments that receive import rights are summarized by area c, equal to $453 million.
The net loss to the United States is equal to the distortions plus the quotarents (c), a total of $612 million per year. Notice that much of this net loss comes fromthe fact that foreigners get the import rights.
(b + d)
a + b + c + d
3These estimates are based on a reports by the U.S. International Trade Commission (2009) cited in FurtherReadings.
M09_KRUG6654_09_SE_C09.QXD 10/20/10 9:54 PM Page 206

CHAPTER 9 The Instruments of Trade Policy 207
Price, $/ton
= consumer loss (a + b + c + d)
= quota rents (c)
= producer gain (a)
Quantity of sugar,million tons
Demand
Supply
a cd
Price in U.S. Market $426
World Price $275
1.8 2.7 5.7 6.9
b
Figure 9-13
Effects of the U.S. Import Quota on Sugar
The quota limits imports of rawsugar to 3 million tons. Withoutthe quota, imports of sugarwould be 66 percent higher, or5.1 million tons. The result ofthe quota is that the price ofsugar is $426 per ton, versus the$275 price on world markets.This produces a gain for U.S.sugar producers, but a muchlarger loss for U.S. consumers.There is no offsetting gain inrevenue because the quota rents are collected by foreign governments.
The sugar quota illustrates in an extreme way the tendency of protection to providebenefits to a small group of producers, each of whom receives a large benefit, at the ex-pense of a large number of consumers, each of whom bears only a small cost. In thiscase, the yearly consumer loss amounts to only about $3 per capita, or a little more than$11 for a typical family. Not surprisingly, the average American voter is unaware thatthe sugar quota exists, and so there is little effective opposition.
From the point of view of the raw sugar producers (farmers and processors), how-ever, the quota is a life-or-death issue. These producers employ only about 6,500 work-ers, so the producer gains from the quota represent an implicit subsidy of about$42,000 per employee. It should be no surprise that these sugar producers are veryeffectively mobilized in defense of their protection.
Opponents of protection often try to frame their criticism not in terms of consumerand producer surplus but in terms of the cost to consumers of every job “saved” by animport restriction. Clearly, the loss of the $42,000 subsidy per employee indirectly pro-vided by the quota would force raw sugar producers to drastically reduce their employ-ment. Without the quota, it is forecasted that 32 percent of the 6,500 jobs would be lost.This would result in a cost to the U.S. consumer of $432,000 per job saved.
When one also considers that raw sugar is a key input of refined sugar (which is thenused to produce a vast variety of confectionery consumer goods), the costs escalateeven higher. In Chapter 4 we briefly mentioned these costs, which were roughly doublethe ones we have summarized here for raw sugar only. When one further considers thatthe high cost of sugar reduces employment in those sugar-using industries, the issue isno longer that the consumer cost per job saved is astronomically high; rather, it isplainly that jobs are being lost, not saved, by the sugar quota. The U.S. Department ofCommerce has estimated that, for every farming/processing job saved by high sugarprices, three jobs are lost in the confectionery manufacturing industries.4
4See U.S Department of Commerce, International Trade Administration, Employment Changes in U.S. FoodManufacturing: The Impact of Sugar Prices, 2006.
M09_KRUG6654_09_SE_C09.QXD 10/20/10 9:54 PM Page 207

208 PART TWO International Trade Policy
Voluntary Export RestraintsA variant on the import quota is the voluntary export restraint (VER), also known as avoluntary restraint agreement (VRA). (Welcome to the bureaucratic world of trade policy,where everything has a three-letter symbol!) A VER is a quota on trade imposed from theexporting country’s side instead of the importer’s. The most famous example is the limita-tion on auto exports to the United States enforced by Japan after 1981.
Voluntary export restraints are generally imposed at the request of the importer and areagreed to by the exporter to forestall other trade restrictions. As we will see in Chapter 10,certain political and legal advantages have made VERs preferred instruments of trade pol-icy in some cases. From an economic point of view, however, a voluntary export restraintis exactly like an import quota where the licenses are assigned to foreign governments andis therefore very costly to the importing country.
A VER is always more costly to the importing country than a tariff that limits importsby the same amount. The difference is that what would have been revenue under a tariffbecomes rents earned by foreigners under the VER, so that the VER clearly produces aloss for the importing country.
A study of the effects of the three major U.S. voluntary export restraints of the 1980s—in textiles and apparel, steel, and automobiles—found that about two-thirds of the cost toconsumers of these restraints was accounted for by the rents earned by foreigners.5
In other words, the bulk of the cost represents a transfer of income rather than a loss ofefficiency. This calculation also emphasizes that, from a national point of view, VERs aremuch more costly than tariffs. Given this fact, the widespread preference of governmentsfor VERs over other trade policy measures requires some careful analysis.
Some voluntary export agreements cover more than one country. The most famous mul-tilateral agreement is the Multi-Fiber Arrangement, which limited textile exports from 22countries until the beginning of 2005. Such multilateral voluntary restraint agreements areknown by yet another three-letter abbreviation: OMA, for “orderly marketing agreement.”
5See David G. Tarr, A General Equilibrium Analysis of the Welfare and Employment Effects of U.S. Quotas inTextiles, Autos, and Steel (Washington, D.C.: Federal Trade Commission, 1989).
Case Study
A Voluntary Export Restraint in Practice: Japanese AutosFor much of the 1960s and 1970s, the U.S. auto industry was largely insulated fromimport competition by the difference in the kinds of cars bought by U.S. and foreignconsumers. U.S. buyers, living in a large country with low gasoline taxes, preferredmuch larger cars than Europeans and Japanese, and, by and large, foreign firms hadchosen not to challenge the United States in the large-car market.
In 1979, however, sharp oil price increases and temporary gasoline shortagescaused the U.S. market to shift abruptly toward smaller cars. Japanese producers,whose costs had been falling relative to those of their U.S. competitors in any case,moved in to fill the new demand. As the Japanese market share soared and U.S. outputfell, strong political forces in the United States demanded protection for the U.S. in-dustry. Rather than act unilaterally and risk creating a trade war, the U.S. governmentasked the Japanese government to limit its exports. The Japanese, fearing unilateral
M09_KRUG6654_09_SE_C09.QXD 10/20/10 9:54 PM Page 208

CHAPTER 9 The Instruments of Trade Policy 209
U.S. protectionist measures if they did not do so, agreed to limit their sales. The firstagreement, in 1981, limited Japanese exports to the United States to 1.68 million auto-mobiles. A revision raised that total to 1.85 million in 1984. In 1985, the agreementwas allowed to lapse.
The effects of this voluntary export restraint were complicated by several factors.First, Japanese and U.S. cars were clearly not perfect substitutes. Second, the Japaneseindustry to some extent responded to the quota by upgrading its quality and sellinglarger autos with more features. Third, the auto industry is clearly not perfectly compet-itive. Nonetheless, the basic results were what the discussion of voluntary export re-straints earlier would have predicted: The price of Japanese cars in the United Statesrose, with the rent captured by Japanese firms. The U.S. government estimates the totalcosts to the United States to be $3.2 billion in 1984, primarily in transfers to Japanrather than efficiency losses.
Local Content RequirementsA local content requirement is a regulation that requires some specified fraction of a fi-nal good to be produced domestically. In some cases this fraction is specified in physicalunits, like the U.S. oil import quota in the 1960s. In other cases the requirement is stated invalue terms, by requiring that some minimum share of the price of a good represent do-mestic value added. Local content laws have been widely used by developing countriestrying to shift their manufacturing base from assembly back into intermediate goods. Inthe United States, a local content bill for automobiles was proposed in 1982 but was neveracted on.
From the point of view of the domestic producers of parts, a local content regulationprovides protection in the same way an import quota does. From the point of view of thefirms that must buy locally, however, the effects are somewhat different. Local contentdoes not place a strict limit on imports. Instead, it allows firms to import more, providedthat they also buy more domestically. This means that the effective price of inputs to thefirm is an average of the price of imported and domestically produced inputs.
Consider, for instance, the earlier automobile example in which the cost of importedparts is $6,000. Suppose that purchasing the same parts domestically would cost $10,000but that assembly firms are required to use 50 percent domestic parts. Then they will facean average cost of parts of , which will be re-flected in the final price of the car.
The important point is that a local content requirement does not produce either govern-ment revenue or quota rents. Instead, the difference between the prices of imports anddomestic goods in effect gets averaged in the final price and is passed on to consumers.
An interesting innovation in local content regulations has been to allow firms to sat-isfy their local content requirement by exporting instead of using parts domestically.This is sometimes important. For example, U.S. auto firms operating in Mexico havechosen to export some components from Mexico to the United States, even thoughthose components could be produced in the United States more cheaply, because doingso allows them to use less Mexican content in producing cars in Mexico for Mexico’smarket.
$8,000 10.5 * $6,000 + 0.5 * $10,0002
M09_KRUG6654_09_SE_C09.QXD 10/20/10 9:54 PM Page 209

210 PART TWO International Trade Policy
Other Trade Policy InstrumentsThere are many other ways in which governments influence trade. We list some of thembriefly.
1. Export credit subsidies. This is like an export subsidy except that it takes theform of a subsidized loan to the buyer. The United States, like most other countries,has a government institution, the Export-Import Bank, that is devoted to providing atleast slightly subsidized loans to aid exports.
2. National procurement. Purchases by the government or strongly regulated firmscan be directed toward domestically produced goods even when these goods are moreexpensive than imports. The classic example is the European telecommunications in-dustry. The nations of the European Union in principle have free trade with eachother. The main purchasers of telecommunications equipment, however, are phonecompanies—and in Europe, these companies have until recently all been government-owned. These government-owned telephone companies buy from domestic supplierseven when the suppliers charge higher prices than suppliers in other countries. The result is that there is very little trade in telecommunications equipment withinEurope.
American Buses, Made in Hungary
In 1995, sleek new buses began rolling onto thestreets of Miami and Baltimore. Probably very fewriders were aware that these buses had been made inHungary, of all places.
Why Hungary? Well, before the fall of commu-nism in Eastern Europe, Hungary had in fact manu-factured buses for export to other Eastern blocnations. However, because these buses were poorlydesigned and badly made, few people thought theindustry could start exporting to Western countriesany time soon.
What changed the situation was some cleverHungarian investors’ realization that there is a loop-hole in a little-known but important U.S. law, theBuy American Act, originally passed in 1933. Thislaw in effect imposes local content requirements ona significant range of products.
The Buy American Act affects procurement(purchases by government agencies, including stateand local governments) by requiring that Americanfirms be given preference in all such purchases. A bid by a foreign company can be accepted only ifit is a specified percentage below the lowest bid by adomestic firm. In the case of buses and other trans-portation equipment, the foreign bid must be at least
25 percent below the domestic bid, effectively shut-ting out foreign producers in most cases. Nor can anAmerican company simply act as a sales agent forforeigners: While “American” products can containsome foreign parts, 51 percent of the materials mustbe domestic.
What the Hungarians realized was that theycould set up a production chain that just barely metthis criterion. They set up operations in two loca-tions: one in Hungary, producing the shells of buses(the bodies, without anything else), and an assemblyoperation in Georgia. American axles and tires wereshipped to Hungary, where they were put onto thebus shells; these were then shipped back to theUnited States, where American-made engines andtransmissions were installed. The whole productwas slightly more than 51 percent American, andthus these buses were legally “American” buses thatcity transit authorities were allowed to buy. Theadvantage of the whole scheme was the opportu-nity to use inexpensive Hungarian labor: AlthoughHungarian workers took about 1,500 hours to as-semble a bus (compared with less than 900 hours inthe United States), their $4 per-hour wage rate madeall the transshipments worthwhile.
M09_KRUG6654_09_SE_C09.QXD 10/20/10 9:54 PM Page 210

CHAPTER 9 The Instruments of Trade Policy 211
3. Red-tape barriers. Sometimes a government wants to restrict imports withoutdoing so formally. Fortunately or unfortunately, it is easy to twist normal health,safety, and customs procedures in order to place substantial obstacles in the way oftrade. The classic example is the French decree in 1982 that all Japanese videocas-sette recorders had to pass through the tiny customs house at Poitiers—effectivelylimiting the actual imports to a handful.
The Effects of Trade Policy: A SummaryThe effects of the major instruments of trade policy are usefully summarized by Table 9-1,which compares the effect of four major kinds of trade policy on the welfare of consumers.
This table certainly does not look like an advertisement for interventionist trade policy.All four trade policies benefit producers and hurt consumers. The effects of the policies oneconomic welfare are at best ambiguous; two of the policies definitely hurt the nation as awhole, while tariffs and import quotas are potentially beneficial only for large countriesthat can drive down world prices.
Why, then, do governments so often act to limit imports or promote exports? We turn tothis question in Chapter 10.
SUMMARY
1. In contrast to our earlier analysis, which stressed the general equilibrium interaction ofmarkets, for analysis of trade policy it is usually sufficient to use a partial equilibriumapproach.
2. A tariff drives a wedge between foreign and domestic prices, raising the domesticprice but by less than the tariff rate. An important and relevant special case, however,is that of a “small” country that cannot have any substantial influence on foreignprices. In the small country case, a tariff is fully reflected in domestic prices.
3. The costs and benefits of a tariff or other trade policy may be measured using the con-cepts of consumer surplus and producer surplus. Using these concepts, we can showthat the domestic producers of a good gain because a tariff raises the price theyreceive; the domestic consumers lose, for the same reason. There is also a gain ingovernment revenue.
TABLE 9-1 Effects of Alternative Trade Policies
TariffExport Subsidy
Import Quota
Voluntary Export Restraint
Producer surplus Increases Increases Increases Increases
Consumer surplus Falls Falls Falls Falls
Government revenue
Increases Falls (government spending rises)
No change (rents to license holders)
No change (rents to foreigners)
Overall national welfare
Ambiguous (falls for small country)
Falls Ambiguous (falls for small country)
Falls
M09_KRUG6654_09_SE_C09.QXD 10/20/10 9:54 PM Page 211

212 PART TWO International Trade Policy
4. If we add together the gains and losses from a tariff, we find that the net effect on na-tional welfare can be separated into two parts: On one hand is an efficiency loss, whichresults from the distortion in the incentives facing domestic producers and consumers.On the other hand is a terms of trade gain, reflecting the tendency of a tariff to drivedown foreign export prices. In the case of a small country that cannot affect foreignprices, the second effect is zero, so that there is an unambiguous loss.
5. The analysis of a tariff can be readily adapted to analyze other trade policy measures,such as export subsidies, import quotas, and voluntary export restraints. An exportsubsidy causes efficiency losses similar to those of a tariff but compounds theselosses by causing a deterioration of the terms of trade. Import quotas and voluntaryexport restraints differ from tariffs in that the government gets no revenue. Instead,what would have been government revenue accrues as rents to the recipients of im-port licenses (in the case of a quota) and to foreigners (in the case of a voluntaryexport restraint).
KEY TERMS
ad valorem tariff, p. 192consumer surplus, p. 198consumption distortion
loss, p. 201effective rate of protection,
p. 197efficiency loss, p. 201export restraint, p. 193
export subsidy, p. 203export supply curve, p. 193import demand curve, p. 193import quota, p. 193local content requirement,
p. 209nontariff barriers, p. 193producer surplus, p. 199
production distortion loss, p. 201
quota rent, p. 206specific tariff, p. 192terms of trade gain, p. 201voluntary export restraint
(VER), p. 208
PROBLEMS
1. Home’s demand curve for wheat is
Its supply curve is
Derive and graph Home’s import demand schedule. What would the price of wheat bein the absence of trade?
2. Now add Foreign, which has a demand curve
and a supply curve
a. Derive and graph Foreign’s export supply curve and find the price of wheat thatwould prevail in Foreign in the absence of trade.
b. Now allow Foreign and Home to trade with each other, at zero transportation cost.Find and graph the equilibrium under free trade. What is the world price? What isthe volume of trade?
S*= 40 + 20P.
D*= 80 - 20P
S = 20 + 20P.
D = 100 - 20P.
M09_KRUG6654_09_SE_C09.QXD 10/20/10 9:54 PM Page 212
CHAPTER 9 The Instruments of Trade Policy 213
3. Home imposes a specific tariff of 0.5 on wheat imports.a. Determine and graph the effects of the tariff on the following: (1) the price of
wheat in each country; (2) the quantity of wheat supplied and demanded in eachcountry; (3) the volume of trade.
b. Determine the effect of the tariff on the welfare of each of the following groups:(1) Home import-competing producers; (2) Home consumers; (3) the Home government.
c. Show graphically and calculate the terms of trade gain, the efficiency loss, and thetotal effect on welfare of the tariff.
4. Suppose that Foreign had been a much larger country, with domestic demand
(Notice that this implies that the Foreign price of wheat in the absence of trade wouldhave been the same as in problem 2.)Recalculate the free trade equilibrium and the effects of a 0.5 specific tariff by Home.Relate the difference in results to the discussion of the small country case in the text.
5. What would be the effective rate of protection on bicycles in China if China places a50 percent tariff on bicycles, which have a world price of $200, and no tariff on bikecomponents, which together have a world price of $100?
6. The United States simultaneously limits imports of ethanol for fuel purposes and pro-vides incentives for the use of ethanol in gasoline, which raise the price of ethanol byabout 15 percent relative to what it would be otherwise. We do, however, have freetrade in corn, which is fermented and distilled to make ethanol, and accounts forapproximately 55 percent of its cost. What is the effective rate of protection on theprocess of turning corn into ethanol?
7. Return to the example of problem 2. Starting from free trade, assume that Foreign of-fers exporters a subsidy of 0.5 per unit. Calculate the effects on the price in eachcountry and on welfare, both of individual groups and of the economy as a whole, inboth countries.
8. Use your knowledge about trade policy to evaluate each of the following statements:a. “An excellent way to reduce unemployment is to enact tariffs on imported goods.”b. “Tariffs have a more negative effect on welfare in large countries than in small
countries.”c. “Automobile manufacturing jobs are heading to Mexico because wages are so
much lower there than they are in the United States. As a result, we should imple-ment tariffs on automobiles equal to the difference between U.S. and Mexicanwage rates.”
9. The nation of Acirema is “small” and unable to affect world prices. It imports peanutsat the price of $10 per bag. The demand curve is
The supply curve is
Determine the free trade equilibrium. Then calculate and graph the following effectsof an import quota that limits imports to 50 bags.a. The increase in the domestic price.b. The quota rents.c. The consumption distortion loss.d. The production distortion loss.
S = 50 + 5P.
D = 400 - 10P.
D*= 800 - 200P, S*
= 400 + 200P.
M09_KRUG6654_09_SE_C09.QXD 10/20/10 9:54 PM Page 213

214 PART TWO International Trade Policy
10. If tariffs, quotas, and subsidies each cause net welfare losses, why are they so com-mon, especially in agriculture, among the industrialized countries such as the UnitedStates and the members of the European Union?
11. Suppose that workers involved in manufacturing are paid less than all other workersin the economy. What would be the effect on the real income distribution within theeconomy if there were a substantial tariff levied on manufactured goods?
FURTHER READINGS
Jagdish Bhagwati. “On the Equivalence of Tariffs and Quotas,” in Robert E. Baldwin et al., eds.Trade, Growth, and the Balance of Payments. Chicago: Rand McNally, 1965. The classic com-parison of tariffs and quotas under monopoly.
W. M. Corden. The Theory of Protection. Oxford: Clarendon Press, 1971. A general survey of theeffects of tariffs, quotas, and other trade policies.
Robert W. Crandall. Regulating the Automobile. Washington, D.C.: Brookings Institution, 1986.Contains an analysis of the most famous of all voluntary export restraints.
Gary Clyde Hufbauer and Kimberly Ann Elliot. Measuring the Costs of Protection in the UnitedStates. Washington, D.C.: Institute for International Economics, 1994. An assessment of U.S.trade policies in 21 different sectors.
Kala Krishna. “Trade Restrictions as Facilitating Practices.” Journal of International Economics 26(May 1989), pp. 251–270. A pioneering analysis of the effects of import quotas when both for-eign and domestic producers have monopoly power, showing that the usual result is an increasein the profits of both groups—at consumers’ expense.
Patrick Messerlin. Measuring the Costs of Protection in Europe: European Commercial Policy in the2000s. Washington, D.C.: Institute for International Economics, 2001. A survey of Europeantrade policies and their effects, similar to Hufbauer and Elliot’s work for the United States.
D. Rousslang and A. Suomela. “Calculating the Consumer and Net Welfare Costs of Import Relief.”U.S. International Trade Commission Staff Research Study 15. Washington, D.C.: InternationalTrade Commission, 1985. An exposition of the framework used in this chapter, with a descriptionof how the framework is applied in practice to real industries.
U.S. International Trade Commission. The Economic Effects of Significant U.S. Import Restraints.Washington, D.C., 2009. A regularly updated economic analysis of the effects of protection onthe U.S. economy.
MYECONLAB CAN HELP YOU GET A BETTER GRADEIf your exam were tomorrow, would you be ready? For each chapter,
MyEconLab Practice Tests and Study Plans pinpoint which sections you havemastered and which ones you need to study. That way, you are more efficientwith your study time, and you are better prepared for your exams.
To see how it works, turn to page 9 and then go towww.myeconlab.com/krugman
M09_KRUG6654_09_SE_C09.QXD 10/20/10 9:54 PM Page 214

215
a p p e n d i x t o c h a p t e r 9
Tariffs and Import Quotas in the Presence of Monopoly
The trade policy analysis in this chapter assumed that markets are perfectly competitive, sothat all firms take prices as given. As we argued in Chapter 8, however, many markets forinternationally traded goods are imperfectly competitive. The effects of international tradepolicies can be affected by the nature of the competition in a market.
When we analyze the effects of trade policy in imperfectly competitive markets, a newconsideration appears: International trade limits monopoly power, and policies that limittrade may therefore increase monopoly power. Even if a firm is the only producer of agood in a country, it will have little ability to raise prices if there are many foreign suppli-ers and free trade. If imports are limited by a quota, however, the same firm will be free toraise prices without fear of competition.
The link between trade policy and monopoly power may be understood by examining amodel in which a country imports a good and its import-competing production is con-trolled by only one firm. The country is small on world markets, so the price of the importis unaffected by its trade policy. For this model, we examine and compare the effects offree trade, a tariff, and an import quota.
The Model with Free TradeFigure 9A-1 shows free trade in a market where a domestic monopolist faces competitionfrom imports. D is the domestic demand curve: demand for the product by domestic resi-dents. is the world price of the good; imports are available in unlimited quantities atthat price. The domestic industry is assumed to consist of only a single firm, whose mar-ginal cost curve is MC.
PW
Price, P
Quantity, Q
MR
MC
D
PM
PW
Qf DfQM
Imports under free trade
Figure 9A-1
A Monopolist Under Free Trade
The threat of import competitionforces the monopolist to behavelike a perfectly competitive industry.
M09_KRUG6654_09_SE_C09.QXD 10/20/10 9:54 PM Page 215

216 PART TWO International Trade Policy
If there were no trade in this market, the domestic firm would behave as an ordinaryprofit-maximizing monopolist. Corresponding to D is a marginal revenue curve MR, andthe firm would choose the monopoly profit-maximizing level of output and price .
With free trade, however, this monopoly behavior is not possible. If the firm tried tocharge , or indeed any price above , nobody would buy its product, because cheaperimports would be available. Thus international trade puts a lid on the monopolist’s priceat .
Given this limit on its price, the best the monopolist can do is produce up to the pointwhere marginal cost is equal to the world price, at . At the price , domesticconsumers will demand units of the good, so imports will be . This outcome,however, is exactly what would have happened if the domestic industry had been perfectlycompetitive. With free trade, then, the fact that the domestic industry is a monopoly doesnot make any difference in the outcome.
The Model with a TariffThe effect of a tariff is to raise the maximum price the domestic industry can charge. If aspecific tariff t is charged on imports, the domestic industry can now charge (Figure 9A-2). The industry still is not free to raise its price all the way to the monopolyprice, however, because consumers will still turn to imports if the price rises above theworld price plus the tariff. Thus the best the monopolist can do is to set price equal to mar-ginal cost, at . The tariff raises the domestic price as well as the output of the domesticindustry, while demand falls to and thus imports fall. However, the domestic industrystill produces the same quantity as if it were perfectly competitive.6
Dt
Qt
PW + t
Df - QfDf
PWQf
PW
PWPM
PMQM
6There is one case in which a tariff will have different effects on a monopolistic industry than on a perfectly com-petitive one. This is the case where a tariff is so high that imports are completely eliminated (a prohibitive tariff).For a competitive industry, once imports have been eliminated, any further increase in the tariff has no effect. A monopolist, however, will be forced to limit its price by the threat of imports even if actual imports are zero.Thus an increase in a prohibitive tariff will allow a monopolist to raise its price closer to the profit-maximizingprice .PM
Price, P
Quantity, Q
MR
MC
D
PM
PW
Qf DfDtQMQt
Imports under a tariff, t
PW + t
Figure 9A-2
A Monopolist Protected by a Tariff
The tariff allows the monopolist toraise its price, but the price is stilllimited by the threat of imports.
M09_KRUG6654_09_SE_C09.QXD 10/20/10 9:54 PM Page 216

CHAPTER 9 The Instruments of Trade Policy 217
The Model with an Import QuotaSuppose the government imposes a limit on imports, restricting their quantity to a fixedlevel . Then the monopolist knows that when it charges a price above , it will not loseall its sales. Instead, it will sell whatever domestic demand is at that price, minus theallowed imports . Thus the demand facing the monopolist will be domestic demand lessallowed imports. We define the post-quota demand curve as it is parallel to the domes-tic demand curve D but shifted units to the left (Figure 9A-3).
Corresponding to is a new marginal revenue curve . The firm protected by animport quota maximizes profit by setting marginal cost equal to this new marginal rev-enue, producing and charging the price (The license to import one unit of the goodwill therefore yield a rent of )
Comparing a Tariff and a QuotaWe now ask how the effects of a tariff and a quota compare. To do this, we compare a tar-iff and a quota that lead to the same level of imports (Figure 9A-4). The tariff level t leadsto a level of imports ; we therefore ask what would happen if instead of a tariff, the gov-ernment simply limited imports to .
We see from the figure that the results are not the same. The tariff leads to domesticproduction of and a domestic price of The quota leads to a lower level of do-mestic production, , and a higher price, . When protected by a tariff, the monopolisticdomestic industry behaves as if it were perfectly competitive; when protected by a quota,it clearly does not.
The reason for this difference is that an import quota creates more monopoly powerthan a tariff. When monopolistic industries are protected by tariffs, domestic firms knowthat if they raise their prices too high, they will still be undercut by imports. An importquota, on the other hand, provides absolute protection: No matter how high the domesticprice, imports cannot exceed the quota level.
PqQq
PW + t.Qt
Pq - PW
Pq.Qq
MRqDq
QDq;
Q
PWQ
Imports = Q
Price, P
Quantity, Q
MRq
MC
D
Pq
PW
Dq
Qq Qq + Q
Figure 9A-3
A Monopolist Protected by anImport Quota
The monopolist is now free toraise prices, knowing that the domestic price of imports will rise too.
M09_KRUG6654_09_SE_C09.QXD 10/20/10 9:54 PM Page 217

This comparison seems to say that if governments are concerned about domesticmonopoly power, they should prefer tariffs to quotas as instruments of trade policy. In fact,however, protection has increasingly drifted away from tariffs toward nontariff barriers,including import quotas. To explain this, we need to look at considerations other than eco-nomic efficiency that motivate governments.
218 PART TWO International Trade Policy
Price, P
MC
Imports = Q
Qt Qt + Q Quantity, Q
DDq
MRq
Pq
PW
PW + t
Figure 9A-4
Comparing a Tariff and a Quota
A quota leads to lower domesticoutput and a higher price than atariff that yields the same level ofimports.
M09_KRUG6654_09_SE_C09.QXD 10/20/10 9:54 PM Page 218