Embed Size (px)
Citation preview

1
M E M O R A N D U M
EUGENE WATER & ELECTRIC BOARD
TO: Commissioners Brown, Carlson, Mital, Simpson and Helgeson
FROM: Frank Lawson, General Manager DATE: April 26, 2018
SUBJECT: New EWEB Quarterly Report for Q1, 2018
OBJECTIVE: Information Only Issue Each quarter the Board receives an update on the organization’s performance, including major projects, operational performance and strategic initiatives where the utility is placing focus. Additionally, Management prepares a number of distinct reports to inform the Board of the Utility’s financial results, and other outcomes as required by board policy such as the EL1 capital and quarterly contract reports. While each of these deliver useful information, they lack a holistic view of the organization’s status. Discussion The General Manager’s Report for Q1, 2018 is intended to give the Board and EWEB’s customer owners a more comprehensive and transparent view of the organization’s results. For example, Management heard a desire from Commissioners to better understand the drivers behind the operational and strategic dashboards. As such, the new report describes more of the activities and metrics which inform the status lights and trend arrows on the dashboards. The operational and strategic dashboards appear in the appendix of the Q1 report; contingent upon the Board’s feedback, the new General Manager’s Report may serve as a substitute for the dashboards in the future. The new report is structured to depict a holistic view of performance and the narrative conveys the relationships between various areas of the utility. The customary Electric and Water Financial Statements, EL1 Capital Reports, Contracts Report and Community Investment Report will remain available as part of the appendix. Management looks forward to receiving Commissioners’ and customers’ feedback, and further refining the content as desired. Requested Board Action None at this time.

Quarterly Strategic and Operational Report
Q1 - 2018
Eugene Water & Electric Board
April 26, 2018

Quarterly Strategic and Operational Report Q1 - 2018
Eugene Water & Electric Board
Frank Lawson. CEO/General Manager Susan Ackerman, Chief Energy Officer Matt Barton, Chief Information Officer
Mel Damewood, Chief Water Engineering & Operations Officer Sue Fahey, Chief Financial Officer
Lena Kostopulos, Chief Workforce Officer Rod Price, Chief Electric Engineering & Operations Officer
Rene Gonzalez, Customer Solutions Manager Julie McGaughey, Customer Operations Manager
Table of Contents General Information ........................................................................................................................................................ 2
Executive Summary .......................................................................................................................................................... 2
Strategic Initiatives .......................................................................................................................................................... 3
Operating Revenue & Consumption ................................................................................................................................. 4
Electric Utility Financial Report ........................................................................................................................................ 6
Water Utility Financial Report .......................................................................................................................................... 9
Energy & Electric Operations ...........................................................................................................................................12
Water Operations ...........................................................................................................................................................17
Customer Services & Programs .......................................................................................................................................19
Information & Technology ..............................................................................................................................................23
Enterprise Operations .....................................................................................................................................................25
Workforce.......................................................................................................................................................................26
Government & Legislative Affairs ....................................................................................................................................30
Enterprise Risk Management ..........................................................................................................................................30
Glossary ..........................................................................................................................................................................32
Appendix ........................................................................................................................................................................33

Page 2 of 33
General Information Electric Water Service territory 236 square miles Miles of line or pipe 13,000 800 Substations/Pump Stations 35 27 Water Storage - 23 reservoirs (89 MGal, Capacity) Number of customers 200,000 served 93,000 53,000 Annual Operating Budget $212.7M $18.9M Annual Capital Budget $49.7M $19.6M Executive Summary The management of Eugene Water & Electric Board is pleased to report the results of the first quarter, 2018, to our governing Commissioners and the public. These results are preliminary unaudited, and may be refined. First quarter Electric operating revenue exceeded anticipated budget by $5.4 million, primarily driven by strong wholesale sales from additional Columbia River hydro flows, offset by soft industrial retail sales as our largest customer shutdown for two weeks in March. Although typically only approximately 19% of the yearly total, water revenue slightly exceeded budget assumptions by $50,000 in Q1. Both Electric and Water Net Income for the first quarter exceeded expectations at $1.7 million and $730,000, respectively. EWEB continues to have strong financial performance, and is already positioned to absorb anticipated costs from the impact of a “spill injunction” on BPA. Operationally, water quality and delivery standards were achieved, with breaks and unplanned outages below target. EWEB’s hydroelectric and wind generating resources met availability targets greater than 90% at 98% and 95%, respectively, although thermal resource availability fell below target because of an outage at the IP Springfield Co-Gen facility. So far in 2018, electric delivery reliability is the best in five years primarily driven by favorable weather conditions, and proactive maintenance work. Strategically, EWEB made progress in two areas including the planning and design of the first two distributed neighborhood emergency water/electric stations, and the necessary review of customer service policies designed to make it easier for customers to interact with us. The Board of Commissioners accelerated this review because of their decision to shift our metering deployment approach from “opt-in” to “out-out” based on the role of metering in EWEB’s ability to achieve our strategic goals over the next decade. Organizationally, three significant changes occurred in the first quarter, including the hiring of Chief Energy Officer, Susan Ackerman to lead EWEB’s generation, power planning, and power trading functions. Additionally, Chief Financial Officer, Sue Fahey, now has leadership responsibility for EWEB’s Customer Operations and EWEB’s Advanced Metering Program. Finally, within the Customer Solutions Division, new key account assignments and roles have been clarified for Customer Relationship Managers, and financial products (limited income, GreenPower) and electrification (EV, Developer) roles have been assigned to new Business Line Managers. At the end of the first quarter, EWEB had 476 employees, and a 1.7% attrition rate for the quarter. The beginning of 2018 saw the launch of a new EWEB wellness program, Wellworks™, with participation expected to increase throughout the year. The number of injuries increased in Q1, although the severity was well below historic levels. Multiple preventative trainings are scheduled throughout this year including ODOT/CDL related training, body mechanics, and dog attack prevention. Overall, EWEB continues to work on an organization culture built on integrity and respect, with an emphasis on achieving sustainable results. We appreciate your support. Frank Lawson, General Manager

Page 3 of 33
Strategic Initiatives

Page 4 of 33
Operating Revenue & Consumption Electric Operating Revenues Total Electric Utility operating revenue exceeded budget by $5.4 million for the first quarter of 2018. Wholesale and other revenue had a favorable $5.9 million variance driven by a high than expected water for hydro generation in the Columbia River Basin. Wholesale market prices, however, remain lower than the 2018 budget. Retail revenue was $500,000 below budget due to a relatively warmer January that has been partially offset by cooler than average temperatures in February and March. Electric Retail Sales by Consumption Actual residential consumption is tracking, on average, with the first quarter budgeted assumptions. In March 2018 an Industrial customer had a planned outage which was extended, creating the variance from budgeted consumption.
Electric Wholesale & Contribution Margins The Electric Utility contribution margin represents the amount power sales exceed power expenses. The three main drivers of contribution margin volatility are 1) retail and wholesale sales, which depend largely on weather and economic conditions, 2) hydroelectric production which is weather dependent, and 3) power prices which are market driven. The risks associated with these volatile factors are managed through a variety of mechanisms, including conservative budgeting assumptions which assume revenue that is $2.7 million less than expected conditions, a power hedging program that ensures fixed prices up to 90% of the expected hydro level, and maintaining power reserves.
50,000
70,000
90,000
110,000
130,000
150,000
MW
h
Q1 2018 Residential Sales2016
2017
2018
Budget2018
90,000
100,000
110,000
120,000
130,000
MW
hGeneral Service & Large Industrial
Sales2016
2017
2018
Budget2018
-
20,000,000
40,000,000
60,000,000
80,000,000
100,000,000
120,000,000
JAN FEB MAR APR MAY JUN JUL AUG SEP OCT NOV DEC
Electric Contribution Margin ($) by month and YTD
2018 Budget
2018 Actual / Projected

Page 5 of 33
Contribution margin was $2.5 million above budget at the end of the first quarter primarily due to strong water flows in the Columbia River Basin which resulted in higher revenues from EWEB’s Bonneville Power Administration’s slice contract. Water Operating Revenue The Water Utility had positive $50,000 budget variance in total operating revenues for the first quarter of 2018. Retail revenue had a favorable variance of approximately $150,000 indicating that sales to water customers are collectively in line with the year-to-date seasonally-shaped budget. Wholesale and other revenue had an unfavorable $100,000 variance mostly due to a decrease in customer billable work (other revenue) during the winter months. Wholesale sales includes sales to the Water Districts, City of Veneta, as well as sales to the Willamette Water Company.
160,000
170,000
180,000
190,000
200,000
210,000
Kgal
Q1 2018 Residential Sales
2016
2017
2018
2018BUDGET
190,000
210,000
230,000
250,000
270,000
Kgal
Q1 2018 General Service, Contract & Other Sales
2016
2017
2018
2018BUDGET
Q1 2018ACTUAL
Q1 2018BUDGET
$- $1,000 $2,000 $3,000 $4,000 $5,000 $6,000 $7,000 $8,000
Thou
sand
s$
Water Operating Revenues
Other
Wholesale
Commercial& IndustrialResidential
$30.3
$0.9 $(0.7)
$0.6
$ 2.7
$(0.8)
$0.9
$32.8
-
5.0
10.0
15.0
20.0
25.0
30.0
35.0
Budget Retail Demand(Weather)
Retail Demand(Industrial)
Retail Demand(Other)
Retail Demand(Wholesale
offset)
Slice Price Unexplained Preliminary CM
in m
illio
ns ($
)
Preliminary Contribution YTD Margin VarianceYTD March 2018 Budget vs. Actual (in million $)
$(1.2)

Page 6 of 33
Electric Utility Financial Report Financials For the three months ended March 31, 2018, net income for the Electric Utility was $10.0 million. This was $1.7 million favorable when compared against the seasonally-shaped budget primarily due to higher than anticipated revenue which was partially offset by higher purchased power costs. For comparability purposes, the budget has been modified to reflect seasonal fluctuations in revenue, purchased power, and wheeling.
Electric Operating Expenses Electric O&M expense was at 26.7% of the annual budget for the period ended March 31, 2018. Purchased power had a $3.7 million unfavorable variance due to portfolio balancing activities and is offset by a favorable wholesale sales variance. The $300,000 favorable variance in Operating expenses resulted mostly from position vacancy savings. Other income (expense) had an unfavorable variance of $300,000 primarily due to investment earnings and changes in market value. Operations & Maintenance (O&M) Expense Budget Monitoring As noted in the chart below, the first quarter variance to the straight-line department expense budget is $771,000 and is primarily driven by the cyclical nature of spending. Customer Solutions historically has higher spend for the limited income programs in the fourth quarter. The Electric division variance is driven by timing of building and operations work, as well as vegetation management. The Energy division variance is primarily a result of delays in joint agency environmental spending, pending settlement negotiations. Utility Services resides within the Water division and much of that work is completed during the summer months.
Q1 2018ACTUAL
Q1 2018BUDGET
-
10.0
20.0
30.0
40.0
50.0
60.0
70.0
Mill
ions
($)
Electric O&M ExpenseCILT
Non-Operating
Admin. & General, and Other
Transmission & Distributionand GenerationSystem Control
Purchased Power & Wheeling

Page 7 of 33
Budget Monitoring (Excludes Labor, Revenues, and Power costs)
Division 2018 Working
Budget Q1 2018 YTD
Working Budget Q1 2018 Actuals
% of Actual to Budget
2018 YTD Variance to
Straight Line Budget
Customer Solutions 5,259,000 1,315,000 1,152,000 21.9% 163,000 Electric 9,658,000 2,415,000 2,230,000 23.1% 185,000 Energy 9,336,000 2,334,000 2,028,000 21.7% 306,000 Finance 2,552,000 638,000 622,000 24.4% 16,000 Finance - Customer Ops 440,000 110,000 105,000 23.9% 5,000 General Manager 134,000 34,000 38,000 28.4% (4,000) Human Resources 804,000 201,000 192,000 23.9% 9,000 Information Services 3,066,000 766,000 753,000 24.6% 14,000 Water 1,600,000 400,000 323,000 20.2% 77,000
Grand Total 32,849,000 8,213,000 7,443,000 22.7% 771,000 Electric Capital Combined Net Utility Plant at March 31, 2018 increased $4.7 million when compared to the balance at March 31, 2017, as a result of construction of electric transmission and distribution infrastructure and substation projects, including several 15kV breaker replacements and the construction of the Holden Creek Substation. Year to date capital spending is 13% of the annual budget. The majority of capital costs are incurred in the second and third quarters. As the year progresses, Engineering and Operations expect their spend rate to approach budget. An additional $2.5 million in capital work has been submitted to the board for consideration. For further detail on Electric Capital Spending, see Appendix C - EL1 Report. Electric Financial Strength Measurements

Page 8 of 33
Reserve levels In the second quarter, the Board will approve transfers among reserve funds based on 2017 ending reserve levels. Balances will be updated for the second quarter report.
Electric Utility Schedule of Cash Reserves FINANCIAL POLICY BALANCE REFERENCE TARGET 12/31/2017 Working Cash Rate Sufficiency $ 24,000,000 $ 44,014,801
DESIGNATED FUNDS Operating Reserve Rate Stability $ 2,000,000 $ 2,082,704 Self-Insurance Reserve Rate Stability 1,720,000 1,773,975 Power Reserve Rate Stability 17,000,000 17,000,000 Capital Improvement Reserve Capital Reserve 22,000,000 22,414,827 Rate Stabilization Fund Rate Stability 5,000,000 31,298,759 Other Designated Funds - 15,817,500 DESIGNATED FUNDS TOTAL $ 47,720,000 $ 90,387,764 CASH & DESIGNATED FUNDS TOTAL $ 71,720,000 $ 134,402,565
Electric Utility Financial Outlook The 2018 budget included $500,000 in savings from position vacancies. At the end of the March the Electric Utility has realized that savings and is projected to reach $800,000 in total vacancy savings by the end of the year. Although it is early in the budget year, non-labor expenses are expected to be at budget by the end of the year. Retail revenues are expected to be on budget by end of year, however strong hydro conditions and conservative budget assumptions are driving higher than budgeted wholesale revenues. As a result, contribution margin is forecasted to be $5.7 million greater than budget. See Appendix A - Electric Utility Financial Statement for an interim summary statement.

Page 9 of 33
Water Utility Financial Report Financials For the three months ended March 31, 2018, net income for the Water Utility was $1.62 million; $720,000 favorable when compared against the budget which is seasonably shaped for revenue. Within the Water Utility, revenue and maintenance activities peak in the summer months while production and delivery costs remain fairly constant throughout the year. The $730,000 favorable budget variance in Operating expenses resulted from seasonal maintenance and construction activities that typically peak during the summer months, as well as savings from position vacancies.
Water Operating Expenses Water O&M expense was at 21.7% of the annual budget for the period ended March 31, 2018. The $730,000 favorable budget variance in Operating expenses resulted from seasonal maintenance and construction activities that typically peak during the summer months, as well as $150,000 savings from position vacancies.
Water Capital Combined Net Utility Plant at March 31, 2018 increased $5.3 million when compared to the balance at March 31, 2017 as a result of addressing critical aging infrastructure in the distribution system, such as main improvements, pump station upgrades, and projects related to the Hayden Bridge Water Treatment Plan. The majority of capital spending occurs in the second and third quarters. At the end of the first quarter, the capital budget is 15% spent. At the end of first quarter, the water utility had a total of 136 Type 1 and Type 2 open work orders with a value of $4,824,600 (including Water’s portion of Shared Services: 151 WO’s totaling $6,584,800). During the first quarter, 57 work orders were closed or placed in Finish status. These have a value of approximately $610,000. See Appendix C - EL1 Report for Electric, Water & Shared Services

Page 10 of 33
Water Financial Strength Measurements
Operations & Maintenance Budget Monitoring The Water Utility has a favorable non-labor variance of $532,000 to budget. Water Operations, where spending is not linear, accounts for most of that. Maintenance, construction, and professional services historically ramp up mid-year. Additionally, there are energy consumption savings at Hayden Bridge.

Page 11 of 33
Water Reserve levels In the second quarter, the Board will approve transfers among reserve funds based on 2017 ending reserve levels. Balances will be updated for the second quarter report.
Water Utility Schedule of Cash Reserves FINANCIAL POLICY BALANCE REFERENCE TARGET 12/31/2017
Working Cash Rate Sufficiency $ 3,400,000 $ 10,610,632 DESIGNATED FUNDS Operating Reserve Rate Stability $ 1,000,000 $ 1,012,184 Self-Insurance Reserve Rate Stability 280,000 288,712 Capital Improvement Reserve Capital Reserve 7,000,000 7,889,164 Rate Stabilization Fund Rate Stability 1,000,000 1,307,263 Other Designated Funds - 10,972,511 DESIGNATED FUNDS TOTAL $ 9,280,000 $ 21,469,835 CASH & DESIGNATED FUNDS TOTAL $ 12,680,000 $ 32,080,467
Water Utility Financial Outlook The Water Utility has a favorable variance to budget, although it is early in the budget year and the majority of the revenues are realized in the third quarter. Some of the Water Utility spending also tends to be cyclical, peaking in the summer, and non-labor expenses are expected to be at budget by the end of the year. The 2018 budget included $150,000 in savings from position vacancies. As of March 31, 2018, the Water Utility has realized those savings and is projected to reach $270,000 in vacancy savings by the end of the year. See Appendix B - Water Utility Financial Statement for an interim summary statement.

Page 12 of 33
Energy & Electric Operations
EWEB owns and operates generation, transmission, and distribution equipment and systems for the sale and delivery for electricity to our customer-owners (local consumers) and other electricity resellers (wholesale). Continuing to provide electricity safely, reliability, and affordably is our operational priority. Energy Production/Generation In the first quarter, EWEB generation totaled 1,314,786 MWhs with 58% supplied by the Bonneville Power Administration (BPA), 15% from EWEB-owned generation, and the remainder for power purchases. The reliability of the EWEB-owned electric generation resources was within the target of greater than 90% Availability Factor for hydroelectric and wind resources. However, an outage at the IP co-generation site in Springfield impacted the Availability of this thermal resource. Hydroelectric and thermal combined for a Forced Outage Factor of 3.16%, above our target of 3%. For Q1-2018, EWEB’s hydro and thermal resources had a combined availability factor of 94.88%, and the capacity factor was 46.75%.
Generation Reliability by Fuel Type Generation Type Availability Factor Forced Outage
Factor Notes
Target > 90% < 3.00% Wind 95.05% N/A Hydro 98.20% 0.63% Thermal 86.62% 9.46% Affected by extended outage at IP
related to oil spill at the mill.

Page 13 of 33
Electric Delivery Reliability EWEB tracks electric system reliability using Institute of Electrical Electronic Engineers (IEEE) metrics, including System Average Interruption Frequency Index (SAIFI) & System Average Interruption Duration Index (SAIDI). At the end of the first quarter, electric system reliability was within target and the lowest in the past five years primarily due to mild weather. For more detail on reliability metrics, see Appendix F – Reliability Index Report.
First Quarter Outages
Total # of outages
Total # of customers interrupted
Total outage minutes
66 2,809 290,115
System Average Interruption Frequency Index (SAIFI) & System Average Interruption Duration Index (SAIDI) Outage Performance Details
Index YTD Actual YTD 5 Year Average Pacific Northwest APA City
Average YTD Dashboard
SAIFI 0.054 0.097 0.10
SAIDI (minutes) 6.27 14.01 10.8
Unit Year Month Availabilty Factor Forced Outage Factor Capacity FactorCarmen 1 2018 03 98.96 0.86 43.65Carmen 2 2018 03 99.07 0.93 9.63Trail Bridge 2018 03 96.22 0.19 57.72Leaburg 1 2018 03 91.54 0.00 77.44Leaburg 2 2018 03 91.69 0.00 87.38Walterville 2018 03 100.00 0.00 97.16Stone Creek 2018 03 100.00 0.00 68.23EWEB Hydro 2018 03 98.20 0.63 42.19
IP Springfield 2018 03 69.17 21.39 56.64WGA (Wauna) 2018 03 99.01 0.99 59.15EWEB Thermal 2018 03 86.62 9.46 58.11
Harvest Wind 2018 03 97.76 N/AFoote Creek 2018 03 93.33 N/AEWEB Wind 2018 03 95.05 N/A
Q1 2018 Generation YTD Report
Output Factor56.74
67.09
62.6361.0184.5995.3097.1668.23
81.89
68.36
59.74

Page 14 of 33
Proactively, EWEB continues to pursue activities and projects to prevent outages, including those related to equipment maintenance adherence, tree and vegetation management, and special outage prevention projects.
Electric Line Tree and Vegetation Management Month Planned Completed % Complete PCOP* Status
January 23.33 23.1 99% 5,118
February 23.33 14.37 62%
March 23.33 16.77 72% 1,797
* PCOP = Potential Customer Outages Prevented
Emergency Preparedness and Resiliency
Blackstart Assessment - Lower McKenzie River projects During Q1, a consultant to EWEB completed an assessment of both the Leaburg and Walterville hydroelectric plants for their ability to accommodate blackstart capabilities. The consultant found that the Leaburg plant currently has blackstart capability. It was apparently installed as part of the 2002/2003 plant work completed following relicensing of the project. However, it doesn’t appear that the system has ever been commissioned or tested. During Q2, staff intend to assess the electrical side of the process to evaluate capabilities and needs for standing up generation from Leaburg in a blackstart situation (see Electric Division Master Plan discussion).
Outage Management Generation updated the Incident Command System (ICS) portion of its Emergency Action Plan (EAP) to incorporate and embed the ICS structure into the plans. This was completed during Q1/2018. The next step will be to make generation-specific improvements to the ICS process to facilitate ICS process use in the event of a dam safety emergency. From an electric delivery perspective, EWEB has been working on supporting outage and disruptive event communications through written, visual and digital materials, process improvements, and employee training. In February, approximately 50 employees in customer-facing roles attended Outage Communication Training. A new and improved external website includes extensive outage reporting, safety and restoration information for customers. Improvements position EWEB to execute fully integrated public information campaigns during major outages

Page 15 of 33
Distributed/Neighborhood Emergency Station(s) Over the next five years, EWEB will deploy at least five (5) distributed “neighborhood” emergency stations for water distribution and independent electric operation (a.k.a. microgrid). In 2018, EWEB is working with two local school districts to design and construct two “neighborhood” emergency stations, including both water and electric infrastructure. Water Engineering has initiated work at Kalapuya High School in West Eugene, while Electrical Engineering has started design work for Howard Elementary near River Road. In the first quarter, EWEB initiated work on an Intergovernmental Agreement (IGA) with both Bethel School District and Eugene 4J School District and selected the first emergency sites. The IGAs are still being finalized.
Electric Neighborhood Microgrid Project
Milestone Status Planned Date
Actual Date
Comments
Determine site location/preliminary design
1/1/2018 1/11/18 Howard Elementary Selected
4j IGA Agreement 3/3/2018 TBD Going before 4j board meeting 4/3/2018. Expected
to be executed prior to end of month. Goal was to have in place prior to awarding contractor.
Advertise and Award Design Build RFP
3/3/2018 3/3/2018 Awarded to Worley Parsons.
Design 5/1/2018 TBD Design underway and on track. 30% to be complete week of April 9.
Procurement 7/1/2018 TBD Schedule on track. Installation 8/30/2018 TBD Schedule on track. Commissioning 9/4/2018 TBD Schedule on track.
Asset Management & Planning The Electric Utility manages approximately $760 million of assets (plant-in-service), including generation, transmission, and distribution infrastructure.
Integrated Electric Resource Planning (IERP) The goal of an IERP is to develop a plan for making decisions impacting our future generating resources. Staff is developing a schedule of work and engagement processes to complete the next IERP for publishing in 2021. The IERP will identify and evaluate long-term portfolio alternatives bringing the best fit between supply, customer consumption, affordability and EWEB’s strategic direction. This work includes modeling and analysis of potential load strategies and supply characteristics. Staff will update the current IERP in June. Load growth continues to be flat, and EWEB’s resource position is expected to remain long for the next decade. Five parallel efforts are currently underway to support development of the 2021 IERP.
1. Existing supply resource performance evaluation. 2. Partnering with Customer Solutions and Finance to identify consumption side demand response, time based
conservation and pricing programs potential and costs. This is anticipated to be an ongoing inter-departmental effort over the next three years while yielding initial recommendations in 2019.
3. Engagement, participation and advocacy in regional issues pertinent to future EWEB power resource decisions. This entails participation and advocacy in Pacific Northwest (PNW) market forums and policy development discussing and debating evolving wholesale market products and rules supporting renewable integration, carbon reduction policies, transmission services provision, and reliability services.

Page 16 of 33
4. Working with both BPA and the Public Power Council (PPC) in preparing for the upcoming BP-20 Rate Case. Additionally, staff is engaging in BPA initiatives developing new power and transmission service and business decisions and protocols. This is part of an ongoing effort to support BPA’s long-term viability and EWEB’s interest in its largest resource. BPA’s progress and success will also factor into EWEB’s strategic power resources recommendations and decisions over the next several years.
5. Developing analytical tools to support consumption side program evaluation and development, power generation and power markets analytics. Staff’s goal is completion of the market models during 2018 and end use forecasting models in 2019.
Carmen Smith
EWEB staff continue to wait for the release of the Clean Water Act Section 401 Certification from the Oregon Department of Environmental Quality and a Biological Opinion from the National Marine Fisheries Service. These two documents, which are expected to be issued in the second quarter of 2018, are the last remaining documents needed by the Federal Energy Regulatory Commission (FERC) prior to Carmen-Smith license issuance. During the first quarter, staff provided comments to the Oregon DEQ on the draft 401 certification and attended a public hearing on the certification. Conversations with FERC staff indicate that EWEB should plan on license issuance in the second half of 2018. Engineering and operations staff continued preparation for a full Carmen plant outage scheduled to begin in April 2018 to facilitate the replacement of the plant’s two 114-inch turbine shutoff valves. The plant is expected to be offline from mid-April through October. Staff also continue to make good progress on plant modernization work in preparation for the planned 2019 through 2021 outages. Contracts were approved by the Board and awarded in Q1 for procurement of new turbine runners, for generator rewinds and for new switchgear and plant controls.
Electric Master Planning A draft master plan is underway with a targeted completion date by June. Some additional detailed analytical assessments will be contracted to complete portions of this work. A study by Black & Veatch was completed in February. The first phase included a feasibility study for powering in- town critical loads from the Leaburg power plant and upgrades required at Leaburg to allow for unit black start. The next phase is currently in the planning stage and will consist of determining actual load values and possibilities for curtailment, additional stability studies, transmission system switching procedures and investigation at the Seneca power plant. Initial scoping of a detailed Asset Management Plan has been initiated, and will pause until Q3 following the draft Electric Master Plan.
Holden Creek Substation The Holden Creek substation, located on Hwy 126 near Leaburg, construction and commissioning has been completed, with the tie into the Bonneville Power Administration’s Thurston-Cougar 115kV transmission line planned for late April. Upriver distribution circuits will be added to the station load in June following BPA vegetation work. From mid-June to late August, the Leaburg substation will be reconfigured to remove distribution supply equipment, and to prepare the generation feeds for tie into the Holden Creek Substation. Design will be completed in Q4 2018 for control room and generator connection changes, which will take place in summer 2019. See Appendix C - EL1 Report for Electric, Water & Shared Services for capital project details.

Page 17 of 33
Water Operations EWEB owns and operates intake, treatment, transmission, and distribution equipment and systems for the sale and delivery for clean drinking water to our customer-owners (local consumers) and other water resellers (wholesale, water districts). Continuing to provide water safely, reliability, and affordably is our operational priority. Source Protection Activated the McKenzie Watershed Emergency Response System (MWERS) in response to the International Paper 1,000 gallon oil spill below EWEB’s intake in mid-March 2018. EWEB and HazMat Team response was successful and effective, providing a “live” drill that tested and confirmed EWEB’s approach to spill response. Increased monitoring below IP due to discharge of untreated stormwater due to plant shutdown during spill. Illegal camp inspections occurred monthly in 1st quarter in close coordination with Willamalane and City of Springfield. Camps were identified and put into the LCOG web application to track activity; cleanups occurred within 48 hours of identification. Starting in April coordinated inspections will increase to once every two weeks. The state laboratory governing agency (ORELAP) performed an audit on the Hayden Bridge laboratory in March. A report on the findings is expected by May. Water Quality and Public Safety EWEB continually monitors water quality at the filtration plants, and within the distribution system. There were no water quality concerns impacting water production in the first quarter. The finished water output for the Hayden Bridge Treatment Plant is shown below.
Jan Feb March April May June July August September October November December
5 year Max 521.8 465.5 503.8 546.6 836.6 1149.9 1373.3 1360.6 1025.7 737.5 517.1 541.92
5 year Min 465.5 425.3 475.4 500.7 682.2 969.7 1218.1 1220 819.6 562.2 493.6 488.2
2018 FW 497.4 457.3 501.8
400
500
600
700
800
900
1000
1100
1200
1300
1400
Tota
l Flo
w (M
G)
Finished Water Production

Page 18 of 33
Water Delivery Reliability
Goal Unit Annual Target Quarterly Results Ensure Reliability of Water Products
Leaks and Breaks per 100 Miles of Pipe # 9 1 Minimize Unplanned Outages # 92 11
Average Duration of Unplanned Outages Minutes 149 116
Boil Water Notices # of Notices None caused by EWEB 0
Asset Management & Planning Type 1 work is proceeding with costs coming in below the straight line budget for this time of year. This is to be expected as costs lag for new projects. Principal type 1 work to date has been for pipelines with a minor amount of pump station work. Several larger pump station and treatment plant projects will start soon which will increase expenditures in this area. Costs are below the straight line budget for type 2 work as well. This will continue until the third quarter when a significant amount of pre-purchased equipment is scheduled to arrive. The construction of the new disinfection facility at Hayden Bridge will also begin in the third quarter raising the expenditures to budget levels.
Hayden Bridge Disinfection Water Engineering has reached 90% design with consultant on the Hayden Bridge On-Site Disinfection Building and equipment. Contract for equipment will be submitted to the Board for the May 2018 meeting. Emergency Preparedness and Resiliency Water Management staff is also working on communication protocols and restoration procedures for Hayden Bridge and the transmission system.
Distributed/Neighborhood Emergency Station(s) Over the next five years, EWEB will deploy at least five (5) distributed “neighborhood” emergency stations for water distribution and independent electric operation (a.k.a. microgrid). In 2018, EWEB is working with two local school districts to design and construct two “neighborhood” emergency stations, including both water and electric infrastructure. Water Engineering has initiated work at Kalapuya High School in West Eugene, while Electrical Engineering has started design work for Howard Elementary near River Road. In the first quarter, EWEB initiated work on an Intergovernmental Agreement (IGA) with both Bethel School District and Eugene 4J School District and selected the first emergency sites. The IGAs are still being finalized.
Mobile Treatment In conjunction with distributed neighborhood emergency stations, water engineering is working on a mobile treatment trailer that underwent initial raw water at the Hayden Bridge intake during the first quarter. This commissioning and testing period will continue for the next few months. Preliminary results indicate that a few changes will be required in the equipment which we will implement during the commissioning period. A pre-proposal for a pilot study, ‘Impact of Intermittent Operation on Biofilter Performance’, has been accepted by the Water Research Foundation. The full proposal will be submitted the week of April 9th.
Hayden Bridge Emergency Generators Emergency back-up generators for Hayden Bridge Treatment Plant and Intake are on order and should be delivered in Q2 for installation. This back-up generation will be of sufficient capacity to deliver about 20 mgd.

Page 19 of 33
Customer Services & Programs EWEB serves approximately 200,000 people in the Eugene metro area, and in the McKenzie River valley. Customer Operations includes responsive services, including customer initiated support using telephone, digital media, or in-person and includes the development and support of products and services, including energy/water efficiency, limited income support, design services, and special programs like GreenPower™. Several organization changes were made in the first quarter, including Customer Service Operations (in-person, call center, meter reading) now reporting to Chief Financial Officer, Sue Fahey. Because of the importance of customer interaction, the Advanced Metering Program (“smart meter”) will also be the responsibility of CFO Fahey. Within the products and services area (a.k.a. Customer Solutions), a restructuring now includes a combination of Field Services (efficiency & conservation), Customer Relationship Managers (key accounts), and Business Line Managers (product development and management). Operational Metrics Direct customer interactions (in-person and telephone) struggled to meet response performance goals in the quarter, primarily due to increased volume resulting from EWEB’s conversion to a new payment location (Lockbox Service). In the first quarter, EWEB supported 57,773 customer interactions, approximately 928 per day.
Customer Interactions Type Q1 2018 2018YTD Q1/Day Q1 2017 2017 TYD Change YTD Total Calls Served 41,979 41,979 674 42,348 42,348 -0.9% In-Person Customer Visits 15,794 15,794 254 15,449 15,449 2.2%
EWEB Customer Response Metrics
Credit & Collections Write-offs through February totaled $40,000. For the same time period, the 2017 write-offs were $4,000. After the December 2016 ice storm, collection efforts were suspended for a couple of months due to the high volume of estimated bills. The 2018 budget for uncollectible accounts is $480,000.

Page 20 of 33
Advanced Metering Infrastructure (AMI) In February, the Board of Commissioners approved an opt-out deployment approach, requiring the Customer Service Policy revisions and a communication plan to support AMI project that are now in process. CFO Fahey has been assigned sponsorship of AMI, and is building a team for project rollout in second half of 2018.
Monthly AMI Meter Report Electric meters installed as of Mar 1: 4,562 Water meters installed as of Mar 1: 979 Electric meters installed as of Apr 1: 5,124 Water meters installed as of Apr 1: 1,179 Electric meters installed per week in March: 127 (eight-year deployment target: 230 per week, we are in an intentional slow down to get final policy developed and board approved)
Water meters installed per week in March: 45 (eight-year deployment target: 150 per week)
The average percentage of register reads retrieved from opt-in meters each day was 97.9%, this reflects a decrease of approximately 1.5% due to daylight saving time and the change in timing of meter read deliveries. The total percentage of billing register reads which were automatically delivered to CIS in March was 98.9%. The following operations characteristics are representative of quarterly activities.
• Electric meter deployment has been reduced pending policy changes at the board level, and pending elimination of the backlog of disconnects for non-pay. The electric meter change service order backlog from opt-in requests is 1,800 meters (earliest is June 2017).
• Water meter deployment is ramping slowly pending the addition of labor resources. The water meter change service order backlog from opt-in requests is 760 meters (earliest is June 2017). Water Operations is gearing up to drastically increase the pace of the Smart Meter roll out and plans to hire additional staff to help the Water division get through the project. The rest of 2018 will be spent honing processes and procedures for the most efficient roll out with the highest level of customer service possible.
• Notable smart meter related events in March 2018: Five Power Quality events resulted in proactive trouble calls. One Auto disconnect due to auto open.
Customer Operations Initiatives
• Customer Service post-call transactional survey is in final testing. Scheduled for Q2 implementation. • Second draft of Customer Service policy revision reviewed by Board in April. Revisions are being proposed to
enhance ease of use and align with the Board’s strategic direction. • Eight additional customer service analysts (CSA) have been hired to improve call metrics and support conversion
to new Customer Information System. • Expanded hours of operation for phone queue expected to be implemented in June. • Researching viability of credit card payments by phone and retail cash payments.
Business Growth & Retention In the first quarter, the Customer Relationship Management group (formerly Key Accounts) was restructured to better identify and maximize opportunities and to provide proactive, personalized service to major customers. Key accounts were selected and assigned, and Customer Relationship Managers are currently in the process of creating customized business plans for customers to identify short and long term mutual benefit opportunities. Also in the first quarter, a new team of Business Line Managers was created, who are responsible for identifying opportunities to review, analyze and enhance current EWEB offerings and to create new products and services that will benefit customers and enhance their business relationship with EWEB. Current work activities include the refined pursuit of Limited Income and Electrification opportunities.

Page 21 of 33
Service, Responsiveness and Transparent Communication EWEB is executing an integrated communication and public information campaign focused on EWEB’s affordability initiative, budget, prices, efficiency measures, including eweb.org newsroom articles, social media campaigns, bill insert, Pipeline cover story, and earned media coverage. In the first quarter, we created AMI Communication Blueprint to guide EWEB’s outreach strategy for successful project implementation. Enhancements to increase simplicity and effectiveness of working with construction/developers is being developed, and we are exploring options to create opportunities and partnerships to obtain information that will enable us to simplify and improve business processes. Public Relations and Community Involvement The Board requested that management provide a quarterly report of donations, sponsorships and grants. Guidelines are in place to ensure consistency and transparency for how we invest our customers’ dollars for the betterment and well-being of the community we serve. In 2018, we are striving to provide strong alignment between EWEB’s discretionary community investment criteria and the Strategic Plan. While we continue to advocate for all of the same worthy causes, sponsorship dollars will be focused on initiatives that are both closely connected to EWEB’s core mission and provide the broadest benefit to our customers. Please see appendix for a list of sponsorships, donations, grants, event participation and other contributions for Q1 2018, categorized by interest area and type of giving. Appendix E - EL3 Community Investment Report Products & Services
Modernization Products EWEB is developing the enterprise-wide processes necessary to operationalize and market products and services enabled by advanced meters, including advanced outage notification, consumption portal, and leak detection.
Financial Products In order to increase customer participation, we have expanded Greenpower Grants eligibility to include projects focused on reducing or offsetting carbon emissions, including projects that support conversion from fossil fuel to clean energy sources. In 2017, only one party applied for a GreenPower Grant, while this year five (5) applied in the first quarter for final award in Q2. The five finalists are the following.
2018 GreenPower™ Grant Finalists Eugene Science Center: 32.5-kilowatt photovoltaic array with battery back-up
Eugene Waldorf School: Micro-grid with 2.65-kilowatt photovoltaic array and battery back-up Friends of Trees: Volunteers will plant 600 trees in west Eugene for cooling and carbon sequestration
Pearl Buck Center: 24-kilowatt photovoltaic array St. Vincent de Paul of Lane County: Photovoltaic array to serve the Youth House for Boys
Limited Income Benefactors
EWEB offers several types of support as part of our limited income program. In the first quarter, approximately $245,000 of EWEB Customer Care and Customer Care Plus funds were distributed. EWEB is presently evaluating potential opportunities to enhance the program in the future, with an increased emphasis on conservation and efficiency.
Electrification / Smart Load Growth / Carbon Reduction In early 2018, EWEB Launched a new marketing campaign and promotion aimed at encouraging customers to convert from fossil fuels. “A Fossil-free World Starts at Home” is an ongoing campaign aimed at supporting local and regional carbon goals, and promoting EWEB’s clean portfolio. The “Clean Power Promotion” is a short-term incentive ($350 additional) to help make it easy and affordable for customers to switch. In January, EWEB hosted a public Carbon Policy
Page 22 of 33
Forum on policy options for reducing greenhouse gas emissions in the Northwest, EWEB's existing clean energy portfolio, and the utility's position on carbon pricing. Approximately 75 community members, public partners and staff attended the forum. Finally, in Q1 EWEB developed Incentives aimed to make electric vehicles more accessible to increase adoption rate. Collaborating with local and regional organizations to promote EV’s and install charging stations within EWEB service area (UO & COE). Customer Solutions Field Services (Conservation & Energy/Water Efficiency) EWEB spends over $2.5 million annually on energy and water conservation and efficiency projects. Simplifying energy efficiency processes to save time, reduce overhead and deliver more conservation dollars directly to customers. Improvements include streamlining the commercial lighting rebate process and leveraging the BPA lighting calculator. In addition, consolidating and aligning residential and commercial HVAC offerings, which saves time and money for contractors and customers. Resurrecting a former program, EWEB is partnering with UO and City of Eugene to offer free home energy assessments for rental properties. This is the Home Energy Score (HES) program’s second year. In 2017, the program generated 248 scores (of which 229 were rentals), and rental property owners invested more than $100,000 in the community, saving over 23,000 kWh per year. The 2018 HES program includes water efficiency and leak detection.

Page 23 of 33
Information & Technology Strategic Projects and Initiatives Currently Underway Strategic Projects
Customer Information System Replacement (CIS-R)
The goal of the Implement CIS System Replacement (CIS-R) Project is to implement Cayenta’s Utility CIS. Implementation Goals for this project are:
• Allow EWEB to reduce the day-to-day O&M costs of operating and maintaining customer records system(s) • Enhance our ability to manager Customer Relationships • Allow for lower cost integration with other key systems • Allow us to retain capabilities seen as part of our core, basic service (i.e. online billing and payment, budget
billing etc.) • Simplify the on premise technology stack currently needed to support CIS Operations • Enable EWEB to provide its customers new products and services, such as more diverse pricing options • Provide more flexibility in bill presentment configuration
Generally, EWEB is on track to launch the new CIS-R system in late 2019. In the first quarter, EWEB began functional testing of the system to ensure that the system conforms to all requirements. Late in the quarter, testing revealed some potential issues with system and applications security associated with the Cayenta system and architecture. Although Cayenta responded to our RFP that they met EWEB’s CIS-R technical and business requirements, some are not being fulfilled and EWEB has issued notice to Cayenta that these issues need to be remedied. To assist with testing and configuration, EWEB has retained a third party, Whitlock Consulting, to support the project in the areas of Testing, Training, Data Conversion and System Configuration Validation. Whitlock has senior Cayenta application expertise. EWEB Business Analysts are working to become in-house experts with the application in both its use and configuration. It is expected that before go-live EWEB will have two in-house application experts that are supported by both Cayenta and Whitlock professional services. In Q2, in addition to resolving and testing the solution to any Cayenta technical issues, EWEB will focus on determining the range and amount of data to convert from the current CIS to Cayenta based on legal requirements and operational needs. We will also begin to build the data extracts needed to move the data into Cayenta. In Q3 we will begin to test the conversion process.
Business Intelligence (BI) Technology The purpose of business intelligence (BI) technology at EWEB is to give business users timely, relevant and easily accessible information in order to make effective decisions that enhance value for our customer-owners. The technology will integrate and transform data from multiple, separate systems, into usable information. This vision will be accomplished through the development of data governance, management, and warehousing. The Business Intelligence Project was on hold throughout the first quarter, as priorities shifted to the CIS-R project. However, the Focus for the next quarter will be on completing the data warehouse design. Once complete, we will be able to move forward with building the prototype (non-production). The purpose is to trial a proof-of-concept and to provide specifications for a real working system. Cyber Security No cyber security issues were reported in the quarter, and we continue to maintain a diligent preventative program.

Page 24 of 33
Asset Management & Capital Planning EWEB has completed an assessment and asset strategy of information technology and systems, and is working with Finance to load a complete roster of IT assets into the hierarchy contained in the Work and Asset Management (WAM) system for maintenance and replacement management. IT capital spending is on track, with more detail contained in Appendix C - EL1 Report for Electric Water & Shared Services.
Major Systems Replacement System replacement plan on target. Upcoming activities include:
• Replacement of EWEB’s Network Time Protocol (NTP) System. This will reduce the number of legacy NTP devices from 42 down to 4
• Upgrades to our Compute and Storage systems to support Cayenta • Consolidation and replacement of Electric SCADA servers

Page 25 of 33
Enterprise Operations Property Management During the first quarter of 2018, EWEB engaged the expertise of Evans, Elder, Brown, and Seubert (EEBS) to assist in property related opportunities and issues. Additionally, the Board directed staff to negotiate contracts with two real estate attorneys to provide direct counsel to the Board on specific matters.
Headquarters Building Evans, Elder, Brown, and Seubert completed an analysis for future disposition of the Headquarters building, including options for marketing the building for sale in the near term or continuing to lease it. In March, the EWEB Board provided guidance to continue leasing the building for 5-10 years before reevaluating. EWEB staff have since been engaged with Philips, the current tenant, to negotiate the terms of a new lease agreement. Philips has asked for additional space with the option to expand in the future.
Riverfront property Although occurring in the second quarter, as of the authoring of this report the sale of the Riverfront surplus property has closed with the deed recorded April 17, 2018. More details will be provided in the next quarterly report.
Fleet Services Carbon reduction goal; under Oregon State’s renewable fuels mandate, gasoline sold in the state must be blended with 10% ethanol (E10) and diesel fuel sold in the state must be blended with at least 5% biodiesel (B5). EWEB’s Fleet Services has been exceeding these mandates by blending higher levels of low carbon, alternative fuels such as ethanol and hydrogenation-derived renewable diesel in support of the utility’s sustainability goals. Asset optimization/Fleet Reduction; as part of the affordability initiative, by Q4 2018 EWEB has targeted a 15% reduction to the size of its fleet as compared to Q1 2017 levels. To date the utility has obtained 5.8% of that goal. The fleet size has reduced in some areas, while others have increased due to department realignments and the recent ramp up of AMI. Fleet Services continues to monitor vehicle and equipment use and provides utilization and fuel usage reports to the user departments on a quarterly basis.
320330340350360370380
Q1-17 Q2-17 Q3-17 Q4-17 Q1-18 Q2-18 Q3-18 Q4-18
Flee
t Si
ze
Tracking of 15% Fleet Reduction
Actual Target

Page 26 of 33
Workforce Overall, Human Resources (HR) performance indicators are positive. Operational plans are progressing as scheduled with good results. HR metric indicators are positive and there are no extraordinary or unanticipated developments driving concerns in any particular HR functional area or in the workforce arena in general. Safety There has been an increase in the number and frequency of injuries as compared to 2017, though below average in severity. Overall injury rate YTD and OSHA recordables are high compared to the 3-year average (YTD total: 18, 3-year avg: 11; YTD OSHA: 7, 3-year avg: 3). There are 6 lost days this quarter, well below the 3-year average of 30 days. The message being shared in safety meetings is to slow down, carefully pre-plan work, watch out for each other, and maintain an awareness of surroundings.
Meeting planned DOT/CDL Audit Work plan activities are underway. A cost proposal has been received for onsite training items. Driver files and documented process are currently being updated. 2019 Internal Audit prep is scheduled for Q4 2018. Identification of at-risk groups and implementation of mitigation measures is on track. Body mechanics training scheduled for Q4 2018. We are still moving forward on meter reading equipment upgrades as the transition to AMI gets underway. There is new safety focus connected to AMI implementation coordinating efforts between Customer Service, Meter Reading, and Meter Shop with emphasis on process mapping and ensuring productive and safe interactions with customers. Workforce Composition EWEB workforce composition metrics have changed only slightly following 2017 early retirements with EWEB minority workforce representation numbers still leading those Lane County labor statistics. EWEB continues to lag in the employment of females overall, largely due to the high number of trade, labor and craft jobs in the Utility.
718
0
20
40
60
Injury Summary Q1 2018
Avg. OSHA Avg. Total
2018 OSHA 2018 Total
5.60255075
100125150175
OPM Lost Days Q1 2018
2015 2016 2017 2018 YTD

Page 27 of 33
Employee Statistics & Demographics No. of Employees 467 New Employee Hires / Quarter 16 Promotions / Quarter 7 Reclassifications / Quarter 7 Total Employee Exits / Quarter 8 Voluntary Exits / Quarter 7 Average Age 46 Attrition Rate 1.7% Gender Female Male
EWEB 31.26% 68.74% IBEW 2.45% 97.55%
Minority Minority Non-Minority EWEB 12.21% 82.01% IBEW 8.59% 88.34%
Age Age Range % Empl. 20 - 30 years 5.78% 30 - 40 years 24.84% 40 - 50 years 33.83% 50 - 60 years 29.34% 60+ years 6.21%
Attrition Total attrition remains very low at 1.7%, slightly below Q1, 2017. Voluntary exits are below the 3-year average. Sexual Harassment Training for EWEB Leaders Human Resources has completed 4 of the 5 Sexual Harassment Training sessions provided to EWEB leadership. Feedback from participants has been very positive and attendance of the target group is anticipated to be at nearly 100%. As of April 25, 103 managers, supervisors, leads, and other employees completed the 4-hour training. Compensation & Benefits/Oregon Pay Equity Compensation and Benefits programs remain competitive. Compensation mid-points and benefits packages within 5% +/- comparator avg. Corrections made in 2017; benchmark re-pricing every 3 years with ongoing monitoring for any anomalies. 0 salary exception rates.
A workforce pay-equity study is underway in preparation for compliance with a 2019 legislative standard. Employee Relations; BOLI complaints & investigations underway EWEB received a BOLI racial discrimination complaint surrounding hiring process in which occurred in 2017. EWEB submitted its detailed response to BOLI in January and we await BOLI’s disposition or next directed steps.
No substantive internal employee relations complaints or investigations during first quarter.
Employee performance ratings reported this quarter for year 2017 are in with a “skilled” rating being awarded to approximately 80% of the workforce.

Page 28 of 33
IBEW Labor Relations The productive trend in union relations remains with the Utility successfully negotiating an alternative to potential lay-offs which would have resulted from the passage of HB3203. The Utility created a proposal leveraging bumping scenarios, direct appointment to vacant jobs and pay rate preservation as a means to avoid lay-offs which the Union was happy to accept. Labor Management Committee (a forum for management and labor to meet to bring and discuss emerging concerns) remains very productive. There have been no grievances so far this year. Major Workforce Initiatives
Wellness The Wellworks Program launched and Web portal opened January 2018. Drop-in sessions that provided information to employees and provided login and registration support were well attended. The program has been well-received and we are encouraged by the number of employee logins, but an actual participation rate cannot be determined until employees complete the Tier 1 requirements. Participation is anticipated to steadily increase through the year as more opportunities to earn participation points occur. Year-long communications plan execution is underway in partnership with Wellworks to maintain interest and to support participation goals.
Outsource Leave Management In late March, EWEB met with representatives from The Standard Insurance Co. to begin “current state” process mapping, identify required process and policy changes and to review EWEB reporting, administration and guarantee requirements. An EWEB IS resource was identified and met with the Standard’s technology team to begin building the required interfaces and information feeds. EWEB leave policies are currently under review. The project is on track to launch on 5/1/18 and go live on 9/1/18.
Ultipro Following considerable system testing and training for the entire utility, time management (UTM) successfully launched this quarter with payroll now fully transferred from eP to Ultipro. In addition to time management and payroll, HR Core, Benefits, Compensation, Life Events and Open Enrollment modules have been fully implemented. Work on the Ultipro Onboarding to manage new hire processing is underway and on schedule with required letters, forms, and documents being collected and redesigned. This module will give new hires a head start on all their paperwork and enable more productive time during their first weeks on the job. Ultipro goal setting is being piloted with the Executive Team and a few of their direct reports and looks like something that will be useful across the Utility. Organizational Development
EWEB U marketing campaign underway to increase awareness & utilization
EWEB is reviewing the SkillSoft platform (EWEB-U), along with efforts to increase utilization. The cost/benefit value of the program will be evaluated at the end of the year. While it’s too early to tell if program marketing is boosting voluntary learning, a jump in utilization in February is an encouraging sign. Throughout 2018, EWEB-U will be used to support new employee on-boarding and all-employee policy education and compliance training. In the first quarter, EWEB-U was accessed 112 times, compared to 552 in all of 2017.
Supervisory Development Project The first phase of this project was to engage a group of supervisor volunteers for the purpose of developing a benchmark supervisor job description accompanied by a set of minimum requirements and competencies. That work will be the basis of a prioritized list of topics upon which developmental and training approaches can be established. The project will result in a framework for individual supervisor development and performance expectations and a consistent approach to EWEB supervision.

Page 29 of 33
The project has been well-received so far with more than 2/3 of all supervisors volunteering to participate in a series of 2-hour work sessions which so far have yielded agreement around common job duties, minimum requirements, and competencies for success. A final draft is underway and once adopted by the group, will be presented to the ET for review, input and approval. The next phase, determining the development and training focus, will begin in May. Doing this work in a group setting has enabled supervisors to recognize that they have a peer group across the utility. The discussions have created a common understanding of the supervisory role and clarified what will be required for success regardless of operational division or department. Benefits Utilization Medical and vision plan utilization is running below expectations. Dental is running high, which may be a function of employees receiving preventative visits for the new wellness VEBA deposit. While it is too early determine the full picture, based on this preliminary review EWEB’s premium rate trajectory is trending below the LTFP forecast of 8%. A clearer picture should emerge in mid-April when Q1 plan data is available. EWEB continues to trend below the national average in terms of premium renewals. There were no Tier 4 retirements during Q1, and therefore no opt-outs.

Page 30 of 33
Government & Legislative Affairs Legislative / Carbon Policy EWEB Staff leveraged results of the PGP/E3 Carbon Study in ongoing communication with public power, the environmental community, Oregon state agencies and legislature, as well as the well-attended January 24th EWEB Carbon Forum. The 2018 short legislative session in Oregon meant that there was no vote on a cap and trade (cap and invest) bill from Oregon this year, but there appears to be momentum in favor of a bill for the 2019 long session. A side benefit of the discussions on carbon is they have presented opportunities to address Oregon’s unusual support for added spill on the Federal Columbia River Power System (FCRPS), which further depresses BPA’s revenue, increases EWEB’s power costs, and makes integrating variable renewable generation more difficult. Enterprise Risk Management Federal Energy Regulatory Commission (FERC) review of EWEB’s Dam Safety Program As part of the FERC Portland Regional Office’s (PRO) annual review of EWEB’s dam safety program, PRO staff indicated that they wanted to hold the review in Eugene at EWEB’s ROC facility. This meeting usually occurs at the PRO office in Portland. FERC staff also asked that General Manager Lawson and Chief Energy Officer Ackerman be in attendance for the review. FERC staff shared a number of findings from the 2017 dam safety incident in Oroville, California, and other hydroelectric, dam safety and industrial accidents with the General Manager and EWEB staff. FERC also identified a number of areas of concern they have with EWEB policy, procedures and practices relating to corporate culture and dam safety. FERC staff followed up the meeting with written correspondence. EWEB staff met a second time with FERC PRO staff to further the discussion and express our knowledge, understanding and commitment to dam safety as it pertains to our hydroelectric facilities. The primary outcome from the meetings so far is a commitment from both sides to improve and formalize communication between EWEB and FERC. Monthly dam safety check-in calls are to start in April 2018. Quarterly Contracts The following contracts exceeded $150,000 in the past quarter, and required Board of Commissioner approval:
1. Alstom Renewable ($19,750,000) for rehabilitation of the Carmen-Smith Hydroelectric Project (CS) turbine generators
2. Crown Technical Systems ($890,000) for CS generator equipment 3. Worley Parsons ($990,000) for a battery energy storage system
The Quarterly Contract Report includes all contracts that value between $40,000 and $150,000, and is attached as Appendix D - Quarterly Contracts Report. Legal Matters EWEB v. MWH et al: Case is stayed pending ruling from the Court of Appeals on the question of venue, arbitration versus trial. Parties are engaged in discovery through appointed Special Master while Court of Appeals deliberates. EWEB v. Michael P. Miller: EWEB sought a declaratory judgment to establish rights under an easement over Mr. Miller’s property to maintain fish passage around the Walterville plant. The trial court found in EWEB’s favor, and Mr. Miller appealed. In March 2018, the Court of Appeals affirmed EWEB’s declaratory injunctive relief judgment entered by Lane County Circuit Court in all respects. PERS Litigation: In February, Harrang, Long, Gary and Rudnick (HLR&G), EWEB legal counsel for employment matters, filed a petition for review with the Oregon Supreme Court in response to a Court of Appeals decision regarding a case surrounding PERS creditable service for temporary employment. HLR&G contacted other Oregon public employers to solicit their amici support. The following organizations participated: Portland Metro, Lane County, League of Oregon

Page 31 of 33
Cities, Special Districts of Oregon and Oregon School Boards Association. Opposing counsels for both PERS and for the individual plaintiff filed responses to EWEB's petition. The Supreme Court's decision to grant the petitioned review is anticipated in the next three months. Compliance During the past quarter, the following compliance violations were discovered and/or self-reported.
Compliance Violations 1. Finance had an Oregon Minimum Standards violation due to not reporting new banking relationships to
the State within 3 days of opening accounts. No penalties were assessed. 2. The Social Security Administration (SSA) performed an audit of customer social security number
verification which are required in certain cases to set up a new account. Staff were unable to provide one requested form, and there were minor data missing on 6 additional forms. SSA’s report has not yet been finalized, and penalties, if any, are unknown.
3. The small procurement threshold was breached in the Water Division by splitting an order between two purchase orders.
WECC/NERC Audit
EWEB is preparing for a fall 2018 onsite WECC/NERC audit of our compliance with Operations and Planning (O&P) standards, as part of FERC Order 693. During the first quarter, EWEB enlisted the service of a third-party consultant to assess our system control processes, and some will need updates. During the second quarter, staff will complete the Critical Infrastructure Protection (CIP) Internal Controls Evaluation, as well as complete the Compliance Assessment for O&P and CIP.

Page 32 of 33
Glossary BLM: Business Line Manager CI: Continuous Improvement CIA: Contributions in Aid of Construction CIS: Customer Information System CIP: Capital Improvement Plan CIP: Critical Infrastructure Protection CRM: Customer Relationship Manager FERC: Federal Energy Regulatory Commission FCRPS: Federal Columbia River Power System GIS: Geographical Information System ICS: Incident Command System IP: International Paper KPI: Key Performance Indicator NERC: North American Electric Reliability Corporation PERS: Public Employees Retirement System PUC: Public Utility Commission RCP: Retail Cash Payment RMC: Risk Management Committee SAIDI: System Average Interruption Duration Index SAIFI: System Average Interruption Frequency Index

Page 33 of 33
Appendix Appendix A: Electric Financial Statements Appendix B: Water Financial Statements Appendix C: EL1 Report for Electric, Water & Shared Services Appendix D: Contracts Quarterly Report Appendix E: EL3 Report Community investment sponsorships Appendix F: Reliability Index Report Appendix G: Operational Dashboard Appendix H: Strategic Dashboard Disclaimer: The unaudited financial statements provided in this report are intended for management purposes only.
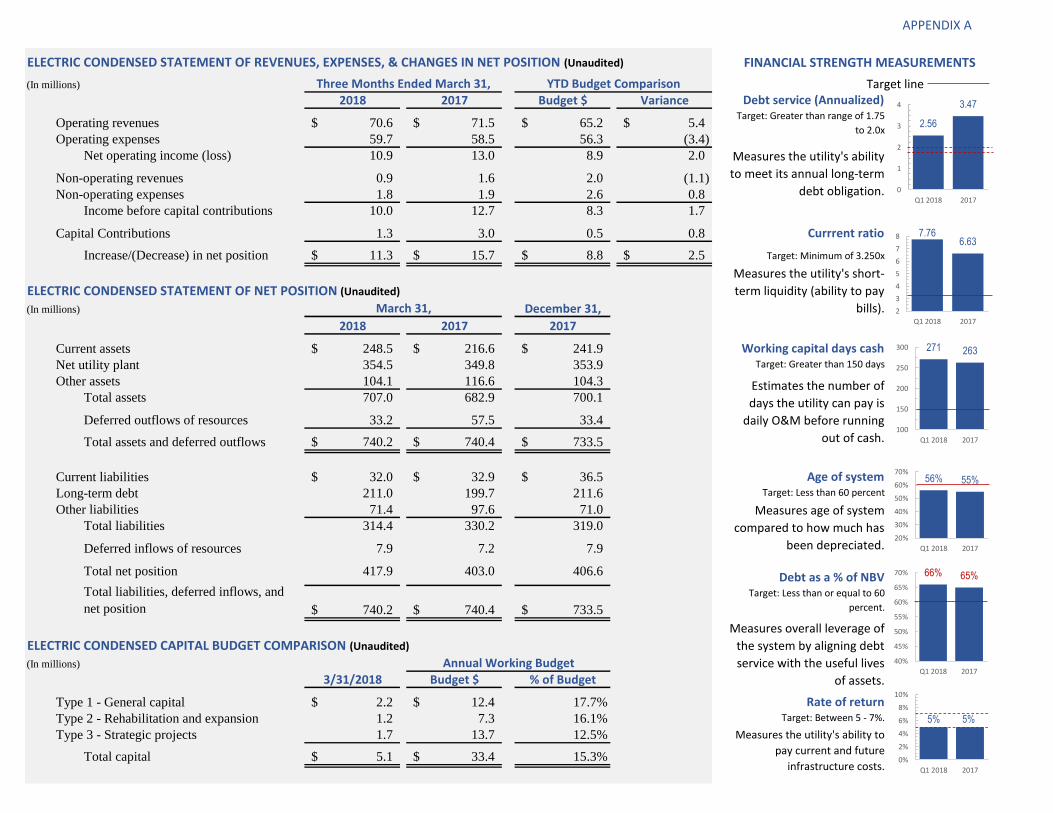
ELECTRIC CONDENSED STATEMENT OF REVENUES, EXPENSES, & CHANGES IN NET POSITION (Unaudited)
(In millions) Target line2018 2017 Budget $ Variance
Operating revenues 70.6$ 71.5$ 65.2$ 5.4$
Operating expenses 59.7 58.5 56.3 (3.4)
Net operating income (loss) 10.9 13.0 8.9 2.0
Non-operating revenues 0.9 1.6 2.0 (1.1)
Non-operating expenses 1.8 1.9 2.6 0.8
Income before capital contributions 10.0 12.7 8.3 1.7
Capital Contributions 1.3 3.0 0.5 0.8
Increase/(Decrease) in net position 11.3$ 15.7$ 8.8$ 2.5$
ELECTRIC CONDENSED STATEMENT OF NET POSITION (Unaudited)
(In millions) December 31,
2018 2017 2017
Current assets 248.5$ 216.6$ 241.9$
Net utility plant 354.5 349.8 353.9
Other assets 104.1 116.6 104.3
Total assets 707.0 682.9 700.1
Deferred outflows of resources 33.2 57.5 33.4
Total assets and deferred outflows 740.2$ 740.4$ 733.5$
Current liabilities 32.0$ 32.9$ 36.5$
Long-term debt 211.0 199.7 211.6
Other liabilities 71.4 97.6 71.0
Total liabilities 314.4 330.2 319.0
Deferred inflows of resources 7.9 7.2 7.9
Total net position 417.9 403.0 406.6
Total liabilities, deferred inflows, and
net position 740.2$ 740.4$ 733.5$
ELECTRIC CONDENSED CAPITAL BUDGET COMPARISON (Unaudited)
(In millions)
3/31/2018 Budget $ % of Budget
Type 1 - General capital 2.2$ 12.4$ 17.7%
Type 2 - Rehabilitation and expansion 1.2 7.3 16.1%
Type 3 - Strategic projects 1.7 13.7 12.5%
Total capital 5.1$ 33.4$ 15.3%
Target: Less than 60 percent
Target: Greater than range of 1.75
to 2.0x
Measures the utility's short-
term liquidity (ability to pay
bills).
Debt as a % of NBVTarget: Less than or equal to 60
percent.
Target: Greater than 150 days
Age of system
Estimates the number of
days the utility can pay is
daily O&M before running
out of cash.
Currrent ratio
Measures the utility's ability
to meet its annual long-term
debt obligation.
Target: Minimum of 3.250x
Working capital days cash
FINANCIAL STRENGTH MEASUREMENTS
Debt service (Annualized)Three Months Ended March 31, YTD Budget Comparison
March 31,
Annual Working Budget
Measures age of system
compared to how much has
been depreciated.
Rate of returnTarget: Between 5 - 7%.
Measures the utility's ability to
pay current and future
infrastructure costs.
Measures overall leverage of
the system by aligning debt
service with the useful lives
of assets.
2.56
3.47
0
1
2
3
4
Q1 2018 2017
7.766.63
2
3
4
5
6
7
8
Q1 2018 2017
271 263
100
150
200
250
300
Q1 2018 2017
56% 55%
20%
30%
40%
50%
60%
70%
Q1 2018 2017
66% 65%
40%
45%
50%
55%
60%
65%
70%
Q1 2018 2017
5% 5%
0%
2%
4%
6%
8%
10%
Q1 2018 2017
APPENDIX A

WATER CONDENSED STATEMENT OF REVENUES, EXPENSES, & CHANGES IN NET POSITION (Unaudited)
(In thousands) Target line2018 2017 Budget $ Variance
Operating revenues 7,750$ 7,820$ 7,700$ 50$
Operating expenses 5,620 6,000 6,350 730
Net operating income (loss) 2,130 1,820 1,350 780
Non-operating revenues 60 160 160 (100)
Non-operating expenses 570 730 610 40
Income before capital contributions 1,620 1,250 900 720
Capital Contributions 1,480 1,100 390 1,090
Increase/(Decrease) in net position 3,100$ 2,350$ 1,290$ 1,810$
WATER CONDENSED STATEMENT OF NET POSITION (Unaudited)
(In millions) December 31,
2018 2017 2017
Current assets 54.5$ 58.9$ 54.6$
Net utility plant 167.0 161.7 165.4
Other assets 6.9 4.3 6.9
Total assets 228.3 224.8 226.9
Deferred outflows of resources 6.8 11.5 6.9
Total assets and deferred outflows 235.1$ 236.3$ 233.8$
Current liabilities 4.0$ 4.7$ 5.5$
Long-term debt 65.3 75.6 65.5
Other liabilities 15.4 19.4 15.4
Total liabilities 84.7 99.7 86.5
Deferred inflows of resources 1.7 1.0 1.7
Total net position 148.7 135.6 145.6
Total liabilities, deferred inflows, and
net position 235.1$ 236.3$ 233.8$
WATER CONDENSED CAPITAL BUDGET COMPARISON (Unaudited)
(In thousands)
3/31/2018 Budget $ % of Budget
Type 1 - General capital 1,430$ 7,731$ 18.5%
Type 2 - Rehabilitation and expansion 782 5,874 13.3%
Type 3 - Strategic projects 20 1,030 2.0%
Total capital 2,232$ 14,635$ 15.3%
Measures overall leverage of
the system by aligning debt
service with the useful lives
of assets.
Annual Working Budget
Rate of returnTarget: Between 5 - 7%.
Measures the utility's ability to
pay current and future
infrastructure costs.
Target: Less than or equal to 60
percent.
Currrent ratio
Target: Minimum of 3.250x
Measures the utility's short-
term liquidity (ability to pay
bills).March 31,
Working capital days cashTarget: Greater than 150 days
Estimates the number of
days the utility can pay is
daily O&M before running
out of cash.
Age of systemTarget: Less than 60 percent
Measures age of system
compared to how much has
been depreciated.
Debt as a % of NBV
Measures the utility's ability
to meet its annual long-term
debt obligation.
FINANCIAL STRENGTH MEASUREMENTS
Three Months Ended March 31, YTD Budget ComparisonDebt service (Annualized)
Target: Greater than range of 2.0 to
2.50x
4.32 4.19
1
2
3
4
5
Q1 2018 2017
13.77
9.93
2
4
6
8
10
12
14
Q1 2018 2017
621
468
100
200
300
400
500
600
700
Q1 2018 2017
43% 42%
20%
30%
40%
50%
60%
70%
Q1 2018 2017
43% 43%
40%
45%
50%
55%
60%
65%
Q1 2018 2017
8% 9%
0%
2%
4%
6%
8%
10%
Q1 2018 2017
APPENDIX B

Capital "EL1" Report: Electric, 2018‐Q1 APPENDIX C
Type 1 ‐ General Capital
Capital Category Budget YTD ActualYear‐End Projection
Electric Infrastructure ‐ Generation $2,020,000 $168,084 $1,901,602
Electric Infrastructure ‐ Substations $1,435,000 $112,775 $1,550,000
Electric Infrastructure ‐ Telecom $427,000 $34,737 $225,000
Electric Infrastructure ‐ Transmission & Distribution $6,440,000 $1,680,856 $7,100,000
Project Budget YTD ActualYear‐End Projection
InitialPlan
To‐DateActual
Project‐End Projection
StartInitialPlanned
Completion
ProjectedCompletion
Downtown Fiber Network $0 $2,071 $1,400,000 $2,100,000 $522,174 $2,100,000 Mar‐2017 Dec‐2018 Dec‐2018
Due to potential risk of further delay, the EDA grant will no longer be used for the fiber network portion of the project. As a result, EWEB can now officially own the fiber assets and funding for this work needs transferred back to the Capital budget from O&M. The project is still fully reimbursable, funded by the City of Eugene. EWEB staff are in the planning stages now with installation on the remainder of the network expected to begin Q3 of this year. ‐NICE
Advanced Meters (Electric) $938,000 $132,612 $1,900,000 $6,638,000 $1,089,000 $12,000,000 Oct‐2013 Dec‐2025 Dec‐2025Project implementation has been accelerated to accomplish strategic objectives within target dates per Opt Out deployment approval by the Board. Meters are being deployed on a consistent basis with meter procurements underway. Projection also includes $300k in labor for planning and implementation staff. ‐NICE
Electric Master Plan $45,000 $4,996 $4,996 $1,250,000 $134,209 $700,000 Jul‐2016 Dec‐2016 Mar‐2019
Spending shown accounts for coordination and planning associated with purchase of property for Thurston substation expansion. Purchase expected to occur in Q1 of 2019 after a lot line adjustment has taken place, which reduces purchased parcel size to approximately half of current property. This change will reduce risk of EWEB environmental mitigations that may be required, and reduce cost. Delay in purchase does not effect critical path of the substation expansion. ‐NICE
Upriver Re‐Configuration/Holden Ck. Substation $977,000 $316,911 $855,000 $3,000,000 $5,709,646 $5,830,000 Jan‐2014 Oct‐2015 Sep‐2019
Holden Creek substation construction and commissioning has been completed, and tie into the Thurston‐Cougar 115kV transmission line is planned for late April by BPA. Upriver distribution circuits will be added to the station load in June following BPA vegetation work. From mid June to late August, the Leaburg substation will be reconfigured to remove distribution supply equipment, and to prepare the generation feeds for tie into the Holden Creek Substation. Design will be completed in Q4 2018 for control room and generator feed changes which will ultimately take place in summer 2019. ‐NICE
Downtown Distribution Network $1,026,000 $87,783 $1,500,000 $15,000,000 $5,755,901 $20,000,000 Sep‐2010 Dec‐2015 Dec‐2028
Due to complexities of replacing a failed vault at 10th and Pearl, a $500k overage is expected for the Downtown Distribution Network program for 2018. This vault was found during inspection to have visible cracking, and has functionally failed. Work includes re‐conductoring the supply feed, re‐configuration of the system to allow for de‐energization of the vault, replacement of the vault, and repair of the roadway and underground facilities in the vicinity. Final procurement is underway with execution planned for June‐September. ‐NICE
Grid Edge Demonstration Project $320,000 $29,740 $1,250,000 $1,200,000 $170,728 $1,250,000 May‐2016 Jun‐2017 Sep‐2018
Installation of a 500kW output, 1MWh battery system is planned at 4j Howard Elementary, with execution between June and September. Full project cost has been moved to 2018; budgeted amount shown was originally slated for final completion. Site will be part of EWEB's emergency water supply program by tying this backup power source in with an onsite well for community water distribution after a large scale disaster or long term outage. Work is being performed by a contractor under a design‐build turnkey project and is at 30% detailed design, with procurement of the battery modules underway. ‐NICE
ROC Consolidation $615,000 $0 $700,000 $2,000,000 $0 $2,000,000 Mar‐2018 Dec‐2020 Dec‐2020
Projection includes $600k for a parking lot expansion at ROC to accommodate additional vehicles after consolidation. This is currently under design and is expected to be completed later this year during the construction season. $100k is included for the Electric Company's share of the Hayden Bridge Backup Dispatch building costs for this year. Costs for facilities at Hayden Bridge are very preliminary and will be further refined this year as design progresses. ‐NICE
Project Budget YTD ActualYear‐End Projection
InitialPlan
To‐DateActual
Project‐End Projection
StartInitialPlanned
Completion
ProjectedCompletion
Carmen Smith License Implementation $13,700,000 $1,718,504 $13,850,000 $135,000,000 $44,857,786 $129,500,000 May‐2009 Dec‐2021 Dec‐2025
The Project End Projection has been updated to reflect the 2016 Settlement Agreement. Although there is only one regulatory filing outstanding, there is no certainty regarding license issuance date. Carmen Powerhouse renewal efforts are underway with major construction activities on schedule to commence in May. The turbine shutoff valve installations will complete by the end of October with the plant returning to operation in November 2018. Procurement of equipment for rebuilding the substation in 2019 is underway and design documents for the installation contract are on schedule to be completed in the Fall of 2018. GE was issued the notice to proceed on design work for the first unit rehab in 2020. Planning for fish passage and other recreation and environmental improvements required by the anticipated license has begun. ‐ZINNIKER, BOYLE
Total Electric Capital (Excluding Shared Services) $27,943,000 $4,289,069 $32,236,598 115%
1. Budget amounts are adjusted to reflect changes presented and approved by the Board on April 4, 2017 (April True Up)
Status/Comments
LB lake debris boom installation completed during April outage; work under contract for summer construction includes LB forebay sluice gate replacement, LB dam replacement emergency generator purchase, and Smith Dam log boom construction, Stone Creek relay and exciter replacement designs nearing completion, Stone controls upgrade postponed to 2019.‐ZINNIKER
Type 1 Projects currently tracking on planned schedule. RTU replacement at Bethel has been completed, with Adams replacement underway and Oakway replacement planned for September. Three substation battery bank replacements are planned to be completed throughout the year and into Q3. Spring Creek substation work is on track and currently under final design with execution to occur between May 15th and August 27th. Work will consist of 115kV breaker, switch, relay, and PT replacements. One substation fence replacement is expected to be completed in Q3, with the site TBD. ‐ NICE
Customer reimbursable work is forecasted to be under budget by approximately $400k. Historically this budget has been over estimated and will be adjusted at true up. Renewal and replacement work is expected to offset this underspend with a $500k overage due to completion of some 2017 planned switch replacements that occurred in early 2018. The remaining 2018 planned Renewal and Replacement work is on track. Enhancements and additions to the distribution system are on track. Pre capitalized transformers are included in this total, however $250k of meter spending is now accounted for in the Advanced Meter line below in the Type 2 section. ‐BRECKENRIDGE
These categories match the Capital Improvement Plans (CIPs) submitted by Water & Electric.
Type 1 ‐ General Capital is budgeted Year‐by‐Year for recurring capital expenditures from January through December. Type 1 Capital includes categorized collections of projects of less than $1 million. Typical examples include "pole replacements" as part of Transmission & Distribution. This work typically involves many small projects that up to $1.2‐$1.7 million per year.
Type 2 projects have "discrete" scopes, schedules (launch through completion), and cost over $1MM during the project life.
Type 3 ‐ Strategic Projects & Programs 2018 ‐ Q1 Project Total Schedule
2018 ‐ Q1 Note ‐ Changes from previous report(s) are in BOLD
Type 2 Rehabilitation & Expansion Projects 2018 ‐ Q1 Project Total Schedule
Management Notes: The overall Electric Capital Budget (excluding shared services) expenditure rate is lower than actual to date (13% spending vs. 25% of year). Type 1 expenditures predicted at year end is at 104% of budget vs. actual, with about 16% spent through Q1. Type 2 spending ended at 14% at the end of Q1, and projected expenditures at year end are at 194%. This large variance is in part due to a transfer of $1.4M from O&M to capital for the downtown fiber network that will be needed. This will be offset in contribution from the City of Eugene since it will be reimbursable work, and in the true up will be shown with a corresponding $1.4M capital budget instated. The other main driver to the Type 2 electric overage is an acceleration of the AMI project which accounts for an almost $1.3M overage. No large balloon payments are expected for Type 1 and Type 2 spending this year, however Type 1 and Type 2 spending rate is expected to increase starting in May and through October as large efforts currently in design are executed. Carmen Smith spending is expected to be just over 100% of budgeted at year end with 12% spent through Q1. The main driver being the Carmen Power Plant TSV installation which is currently underway. Additionally, procurements for the Carmen Substation are expected to begin, and staff expect significant spending on fish passage design to resume in 2018. Year end projections of total expenditures vs. budget for Type 1 & Type 2 work combined is predicted to be 129% excluding Shared Services and Type 3, and 115% including Type 3 (Carmen) for the overall Electric Division budget (with precap materials included).
Status/Comments
Status/Comments
Consists of EWEB driven and Customer Driven fiber work, as well as upgrades associated with LRIG. EWEB driven work is currently tracking below expected trajectory, Customer Driven work is expected to be completed on target based on historical performance, and LRIG work has been deferred due to staffing constraints. ‐ NICE

Capital "EL1" Report: Water, 2018‐Q1 APPENDIX C
Type 1 ‐ General Capital
Project Budget YTD ActualYear‐EndProjection
Source ‐ Water Intakes & Filtration Plant $577,000 $86,531 $815,000
Mains ‐ Replacements, Improvements, & Trans. $4,069,000 $1,017,809 $4,069,000
Services $1,545,000 $427,816 $1,545,000
Pump Stations and Reservoirs $896,000 $188,147 $1,174,000
$7,087,000 $1,720,303 $7,603,000 107%
Project Budget YTD ActualYear‐EndProjection
InitialPlan
To‐DateActual
Project‐End Projection
StartInitial
Planned Completion
ProjectedCompletion
Hayden Bridge Disinfection System Replacement $3,183,000 $60,944 $2,052,000 $3,645,000 $361,888 $3,580,000 2017 YE‐2018 Q2‐2019Replacement of gas chlorine system with on‐site liquid hypochlorite system. Nearing completion of installation design. Equipment pre‐purchase in progress. Budget reduction included in 2018 Capital True Up (Initial Plan ‐ 2015 CIP)
Hayden Bridge Seismic Upgrades $103,000 $39,720 $60,000 $1,215,529 $1,400,787 $1,420,000 2014 YE‐2015 Q1‐2018Project complete. Yellow due to being slighly over budget for total project. (17%) Phase 1 (basins and filters) costs more expensive than anticipated while 2017 (headhouse) costs came in much less than anticipated. This is the final quarter this project will be on the EL1 Report. (Initial Plan ‐ 2013 CIP)
Distribution System Scada/PLC Upgrades $206,000 $6,285 $56,000 $3,079,780 $597,394 $650,000 2013 YE‐2016 YE‐2018Multi‐Year upgrade project to upgade communications and control at pump stations. Going forward this work will be incorporated into planned standard pump station Type 1 work. (Initial Plan 2013 CIP)
Hayden Bridge Standby Power Improvements $0 $6,408 $1,150,000 $1,728,000 $118,074 $1,300,000 2015 YE‐2017 Q3‐2018Design and equipment pre‐purchase is complete. Awaiting delivery of two generators, one for Hayden Bridge Plant and one for Intakes along with electric equipment. Delays in design process pushed the completion date to Q3 2018. Budget addition/carryover included in 2018 Capital True Up. (Initial Plan ‐ 2015 CIP)
Hawkins Reservoir Improvements $1,457,000 $0 $0 $2,067,000 $154,000 $154,000 2014 YE‐2018 YE‐2017
2017 Structural evaluations identified significant deficiencies with the existing reservoir. Due to high cost for improvements, shifted focus to constructing new reservoir as part of the Water Utility's plan for distributed base level reservoir. Budget reduction included in 2018 Capital True Up. Project will not be included in future EL‐1 reports. (Initial Plan 2016 CIP)
Advanced Meters (Water) $0 $212,405 $600,000 NA $212,405 TBD 2018 YE‐2026 YE‐2026New Subproject to reflect shift to Opt‐Out Advanced Meter Infrastructure. Incudes cost of pre‐capitalized meters. In 2018, unit costs will be fine tuned so that accurate long term projections can be made. Budget increase included in 2018 Capital True‐Up.
ROC Consolidation $135,000 $0 $235,000 NA $0 $600,000 Q1‐2018 YE‐2020 YE‐2020
New sub‐project for the ROC Consolidation. 2018 costs include a parking lot expansion at ROC to accommodate additional vehicles and design efforts for a new building at Hayden Bridge for backup dispatch, trading, and data. Costs for facilities at Hayden Bridge are very preliminary and will be further refined this year as design progresses. Budget increase included in 2018 Capital True‐Up.
$5,084,000 $325,762 $4,153,000 82%
Project Budget YTD ActualYear‐EndProjection
InitialPlan
To‐DateActual
Project‐End Projection
StartInitial
Planned Completion
ProjectedCompletion
Emergency Water Supply $1,030,000 $20,396 $250,000 TBD $20,396 TBD Q1‐2018 YE‐2028 YE‐2028New Sub‐Project for Emergency Water Supply Program. Budget reduction included in 2018 Capital True‐Up and reflects actual projected costs for establishment of emergency distributed sites based on work to date.
Total Water Capital (Excluding Shared Services) $13,201,000 $2,066,461 $12,006,000 16% year end actual to budget
Type 1, 2 Capital (Excluding Shared Services) $12,171,000 $2,046,065 $11,756,000 17% year end actual to budget
Management Notes: Overall Water’s Type 1 projects are tracking well. Our Main Replacements and Improvements is at approximately 24% of budget spent and our service work is at 27% of budget spent. Costs do lag in the reporting system however, so we will watch these areas closely. On the Water Type 2 projects, we are tracking low in the first quarter however several large equipment pre‐purchase contracts will be completed soon with construction contracts following. This should bring up the Type 2 spending significantly as the year progresses. The 2018 Budget will change as part of the Capital True‐Up and it is noted in the comments where changes are proposed.
Type 3 ‐ Strategic Projects & Programs 2018 ‐ Q1 Project Total Schedule
Status/Comments
Type 2 Rehabilitation & Expansion Projects 2018 ‐ Q1 Project Total Schedule
Status/Comments
2018 ‐ Q1
Status/Comments
Three primary projects at Hayden Bridge for 2018: Solids/Pond Improvements, Basin Railing and Access Improvements, and Finished Water Flow Meter Replacements. The 2018 Capital True‐Up provides additional budget due to revised estimates and carryover.
Largest componet in this area is main replacements. This item is tracking low so far. Cost reporting does lag however, so we will be watching this number closely
Includes both reimbursable and non reimbursable service work.
Work this year includes upgrades at Santa Clara, Dillard 975, and Crenshaw pump stations and well as improvements to the Crest 800 and 975 reservoirs. The 2018 Capital True Up provides additional budget due to revised estimates.
These categories will match the Capital Improvement Plans (CIPs) submitted by Water & Electric.
Type 1 ‐ General Capital is budgeted Year‐by‐Year for recurring capital expenditures from January through December. Type 1 Capital includes categorized collections of projects of less than $1 million.Typical examples include "main replacements". This work typically involves dozens of jobs that add
up to $3.5‐4.5 million per year.
Type 2 projects have "discrete" scopes, schedules (launch through completion), and cost over $1MM during the project life, and project life can span multiple years
.Type 3 projects are large strategic programs with long term impacts.

Capital "EL1" Report: Shared Services, 2018‐Q1 APPENDIX C
Type 1 ‐ General CapitalCapital Category Budget YTD Actual
Year‐End Projection
General Plant ‐ Information Technology (I.T.) $1,210,000 ($78,833) $1,210,000
General Plant ‐ Buildings & Land Management $476,000 $112,438 $476,000
General Plant ‐ Electric& Water Fleet Capital $823,000 $49,900 $385,500
Project Budget YTD ActualYear‐End Projection Initial
PlanTo‐DateActual
Project‐End Projection StartInitial
PlannedCompletion
ProjectedCompletion
AMI Information Technology & Integration $215,000 ($100,756) $74,000 $6,475,700 $5,269,303 $6,475,700 May‐2015 Dec‐2017 May‐2018
Customer Information System (CIS) Replacement $4,075,000 $980,530 $4,575,000 $9,700,000 $1,218,730 $11,150,000 Sep‐2016 Aug‐2018 mid to late‐2019
Information Technology Type 2 $100,000 $0 $0 $0 $0 $0
$ 6,899,000.00 $963,279 $6,720,500 97.41%Total Shared Services Capital (This Report)
Type 2 Rehabilitation & Expansion Projects 2018 ‐ Q1 Project Total Schedule
2018 ‐ Q1 Note ‐ Changes from previous report(s) are in BOLD Status/Comments
~$350k budgeted for network device refreshes still to be completed in 2018; ~$300k budgeted for EMCS hardware refreshes to be completed in 2018. ~$60k has been spent so far; ~$350k budgeted and spent on compute and storage upgrades (Knabe)
Still waiting for the final invoice to close out the HQ Elevator project. Est. $5,000.00. (Wahto) Most physical infrastructure is complete for the ROC communication tower: tower construction is complete, the communication shelter has been delivered to the site and is anchored in place, all fencing is complete. EWEB crews will bring service conductors to the shelter in the next two weeks. Next steps include fiber connectivity, completing security and building system controls installation, and data infrastructure. There is not a schedule in place for this next phase of the project. (Wolfe)
Electric ‐ $297,000 to be spent on a vehicle at will not be completed until mid‐year 2019. Water$140,500 to be rolled over into 2019 for the purchase of a new vac‐truck.

Q1 2018, Quarterly Contracts Awarded Report APPENDIX D
Execution Contractor City, State Description Contract Amount Contract Term Contract Process ET Manager1/3/2018 BHE group Eugene, OR Roosevelt Operation Center Parking Lot Expansion 60,000$ 1/3/18 - 3/1/18 Qualification Based Selection-
Direct NegotiationMel Damewood
1/24/2018 Peterson Structural Engineers Portland, OR Carmen Diversion Structure Probable Maximum Flood (PMF) Modifications Design
79,900$ 1/24/18 - 12/31/18 Qualification Based Selection-Direct Negotiation
Susan Ackerman
1/26/2018 US Geological Survey Portland, OR Joint Funding Agreement for Source Water Protection Program Support
68,389$ 1/26/18 - 12/31/18 Intergovernmental Agreement Mel Damewood
1/29/2018 Lane Council of Governments (LCOG) Eugene, OR Master Services Agreement for Source Protection Software Support and System development
135,000$ 1/29/18 - 1/8/19 *Intergovernmental Agreement Mel Damewood
2/6/2018 Ballard Marine Construction Washougal, WA Mud Gate and Actuator Replacement at Leaburg Forebay 75,383$ 2/6/18 - 10/12/18 Formal Invitation to Bid Susan Ackerman
2/9/2018 Stettler Supply Co. Salem, OR Basin Handrail Replacement (Hayden Bridge) 139,865$ 2/9/18 - 12/31/18 Formal Invitation to Bid Mel Damewood2/16/2018 Brenco, Inc. Harrison, OH Used Conductor Puller/Tensioner 50,000$ 2/16/18 - 5/15/18 **Direct Negotiation Mel Damewood2/22/2018 Mason, Bruce & Girard, Inc. Portland, OR Support & Maintenance Agreement for Oregon
Watershed Emergency Response System40,000$ 2/22/18 - 2/21/20 Direct Negotiation with firm that
designed the software systemMel Damewood
2/22/2018 Systems West Engineering Springfield, OR Mechanical & Electrical Design Services-Roosevelto Operations Center Consolidation
95,900$ 2/22/18 - 12/15/18 Qualification Based Selection-Direct Negotiation with previous design firm
Rod Price
3/2/2018 DocuTrak Eugene, OR Confidential Document Destruction 60,000$ 3/2/18 - 3/1/23 Request for Quote Rod Price3/2/2018 Ballard Marine Construction Washougal, WA Crest 800 and Crest 975 Reservoir Hatch, Ladder, Vent,
and Railing Upgrades123,600$ 3/2/18 - 12/31/18 Formal Invitation to Bid Mel Damewood
3/7/2018 OBEC Consulting Engineers Eugene, OR Final Design and Construction Inspection of the 48th Street Channel Collaborative Water Quality Enhancement Project
112,599$ 3/7/18 - 3/6/18 Qualification Based Selection-Informal Request for Proposals
Mel Damewood
3/14/2018 Royal Switchgear Manufacturer Bessemer, AL 115kv V-Type Switches 43,400$ 3/14/18 - 12/31/18 Request for Quote Rod Price3/22/2018 Greensuns, Inc. Pleasant Hill, OR Leaburg Canal Embankment Improvements for 2018 $ 99,520 3/22/18 - 10/1/19 Formal Invitation to Bid Susan Ackerman
3/22/2018 United Sales Associates Lake Oswego, OR Battery Banks and Racks-as needed $ Not To Exceed $150,000 3/22/18 - 3/21/23 Request for Quote Rod Price3/23/2018 Kendall Ford Eugene, OR Truck: 1 ton, 4wd, extended cab / chassis 69,801$ 3/23/18 - 6/30/18 Request for Quote Mel Damewood3/23/2018 1105 Media, Inc. dba Transforming Data with
Intelligence (TDWI)Renton, WA Business Intelligence Dimensional Data Modeling Training
& Consulting Services $ 48,400 3/23/18 - 12/31/18 Personal Services Contract Matt Barton
3/23/2018 Convergint Technologies Tualatin, OR Enterprise Security Systems Customer Support Program 207,275$ 3/23/18 - 2/28/23 ***Direct Negotiation Rod Price
3/26/2018 Power Ford Lincoln Newport, OR 2 Trucks: 18,000 GVRW, 4wd crew cab / chassis 84,531$ 3/26/18 - 6/30/18 Request for Quote Mel Damewood
Small Procurement Overage Report
Questions? Please contact: Sarah Gorsegner, 541-685-7348
EWEB association for all above contracts = None
Water Operations and Engineering had a breach of the $10,000 small procurement threshold in March, 2018. The purchase was to Rosemount, Inc. for three Chlorine Analyzers. The purchase total was $13,762.65, split between two Purchase Orders. Staff have been educated on appropriate purchasing rules and will work with Purchasing staff to request quotes on future purchases.
***The Convergint Technologies contract is a 5 year contract for maintenance and support of software and hardware, which is exempt from Board Approval. Convergint Technologies offers the security system we use to manage our facility access and security systems.
*The LCOG Master Services Agreement is a continuation of technical support services for EWEB's drinking water source protection program which requires access to LCOG's regional GIS and other data developed for Lane County agencies.
**Three used conductor puller/tensioners were considered. EWEB directly negotiated with the reseller offering the equipment in the best condition, at the best price.

Community Investment Q1 2018 APPENDIX E
AGENCY EVENT/DESCRIPTION PAYMENT DATE EVENT DATE AMOUNT INVESTMENT AREA CATEGORY NOTES
Bethel School District Jan-June 2018 Education Grant 01/02/18 N/A $38,500 ECONOMIC: Education Board Directed
Lane Community College Jan-June 2018 Education Grant 01/02/18 N/A $35,000 ECONOMIC: Education Board Directed
McKenzie School District Jan-June 2018 Education Grant 01/02/18 N/A $10,500 ECONOMIC: Education Board Directed
Springfield School District Jan-June 2018 Education Grant 01/02/18 N/A $23,500 ECONOMIC: Education Board Directed
Eugene 4J School District Jan-June 2018 Education Grant 01/02/18 N/A $123,500 ECONOMIC: Education Board Directed
Willamette High School EWEB Electrathon Race 02/01/18 Mar 2018 $1,225 ECONOMIC: Education Board Directed
South Eugene High School Robotics Team 02/08/18 N/A $1,000 ECONOMIC: Education Board Directed Annual Contribution
Total Q1 $233,225
AGENCY EVENT/DESCRIPTION PAYMENT DATE EVENT DATE AMOUNT INVESTMENT AREA CATEGORY NOTES
Equity & Community Consortium Communities of Color Networking Event (EWEB Sponsored First Friday) Apr 2018 05/04/18 $1,150 PEOPLE: Diversity Discretionary (Diversity) Food and Entertainment provided by EWEB
Howard Elementary Annual Tech Trot 04/19/18 05/10/18 $500 ECONOMIC: Education Board Directed Proceeds are used to lower or eliminate the technology fee for students at Howard Technology Immersion School.
Eugene 4J School District Solar Challenge Grant for 4J, Bethel and Springfield School Districts Pending 06/09/18 $19,550 ENVIRONMENTAL: Greenpower Program Rate-Funded Previously funded from Education Grants but in response to Greenpower participant survey results, this project is now funded by the Greenpower program.
Lane County Fair Co-Sponsorship of Lane County Fair Comfort Station Water Booth 02/08/18 07/18-07/22 $900 ENVIRONMENTAL: Water Quality/Reliability Discretionary (Cust. Solutions) Booth Fee / Use of EWEB drinking water fountain w/chiller
Total $22,100
AGENCY EVENT/DESCRIPTION PAYMENT DATE EVENT DATE AMOUNT INVESTMENT AREA CATEGORY NOTES
Eugene Marathon Eugene Marathon N/A 04/29/18 Staff Time ENVIRONMENTAL: Water Quality/Reliability Discretionary (Water Ops) Water Trailer at Finish Line
EWEB Customer Care Program Run to Stay Warm N/A TBA Staff Time ENVIRONMENTAL: Water Quality/Reliability Discretionary (Water Ops) Water Trailer
AGENCY EVENT/DESCRIPTION PAYMENT DATE EVENT DATE AMOUNT INVESTMENT AREA CATEGORY NOTES
United Way & Connected Lane County BookFest Book Drive N/A 04/16-04/30 N/A ECONOMIC: Education N/A BookFest is an event where students K – 2nd grade are invited to choose and keep 6+ books to read over the summer. Across Lane County, we are partnering together in an effort to collect 7,000 books to be distributed in 9 different schools where 75% of kids are not meeting the 3rd grade reading benchmark.
Bethel School District KidWind Challenge N/A 04/20/18 N/A ECONOMIC: Education N/A Interview/Judge Entries5 volunteers = 17.5 hrs
Lane Blood Center Blood Drive N/A 05/24/18 N/A PEOPLE: Emergency Preparedness N/A At ROC
Butte to Butte Butte to Butte N/A 07/04/18 N/A ENVIRONMENTAL: Water Quality/Reliability N/A Water Station volunteers
Special Olympics Oregon Bocce Regional Competition N/A 06/16/18 N/A PEOPLE: Diversity N/A Officiate Bocce competition
Food for Lane County FFLC Volunteer Night N/A Ongoing N/A PEOPLE: Safety Net N/A 39 hours YTD
Sponsorships, Donations, Grants
Volunteer Efforts and Events
Water Truck Deployment
Sponsorships, Donations, Grants
Upcoming and/or committed

M E M O R A N D U M
EUGENE WATER & ELECTRIC BOARD
ENGINEERING / DISTRIBUTION RELIABILITY
TO: Leadership Team
FROM: Tom Ossowski, Electric Systems Engineering
DATE: April 4, 2018
SUBJECT: Electric System Reliability Report – March 2018
Executive Summary
March continued with very mild weather resulting in few weather related outages. This is reflected in the outage statistics which show low outages with most of the outages planned or caused by vehicles.
We are a little behind to meet the 2018 goal for tree trimming goals at 80% of planned year to date which affects 6,915 customers. After a slow start for PUC corrections due to a focus on other reliability projects, we are now ahead of schedule.
In all, outage prevention work this year has affected 7,744 customers.
Outage Performance Details
Index YTD Actual YTD 5 Year Average
Pacific Northwest APA City Average
YTD Dashboard
SAIFI 0.054 0.097 0.10
SAIDI (minutes) 6.27 14.01 10.8
APPENDIX F


2018 Outage Prevention and Resiliency Details
Maintenance
March Actual
YTD Actual
YTD Planned
Year Planned Dashboard
606 681 350 1,400
Tree Trimming
Line Miles Total Customers Risk Reduced
Dashboard March Actual
YTD Actual
YTD Planned
Year Planned March YTD
16.8 56.2 70 280 1,797 6,915
Tree Trimming Completed this Month for Following Lines
Line # Customers Risk Reduced
Overhead Line Miles Completed
% Completed
Hayden Bridge 2406 95 4.4 64%
Leaburg 2004 96 3.4 11%
Hilyard 4127 275 2.3 27%
Hilyard 4128 588 2.9 63%
Laurel 5212 479 1.8 55%
Laurel 5214 23 0.3 4%
Laurel 5216 171 1.2 43%
Laurel 5218 70 0.5 20%

Resiliency Projects
Holden Creek Substation (replacing Leaburg substation) – Percent Complete: 95% Construction is substantially complete, final testing and commissioning has been completed by internal EWEB crews with some minor punch list items remaining. Energization of the bus work to the BPA 115kV Blue River-Thurston Line is planned for April 2018. Distribution load will be transferred to the station from Leaburg Substation in June 2018, with final energization and commissioning including Leaburg Generation intertie in late third quarter of 2018. Substation RTU replacements– Percent Complete: Not Yet Available As part of EWEB’s RTU (Remote Terminal Unit) Asset Replacement Plan, the obsolete RTU’s at the following substations will be replaced with EWEB’s standard SEL RTU and HMI (in-substation user interface screen):
• Bethel • Adams • Oakway
Spring Creek Substation Upgrade – Percent Complete: Not Yet Available Two old oil-filled 115 kV transmission circuit breakers will replaced with modern circuit breakers and seven 115 kV switches and all of the protection relays will be replaced with current, standard equipment. Also the old XLP insulation 15 kV underground feeder get-away cables (cables from substation breakers to the first distribution switch) will be replaced with EPR insulated 15 kV cable with a 40 year warranty. Spring Creek substation was chosen for work this year because several equipment asset plans show this equipment at end of life. This substation has a few feeders which are not able to be back fed from another substation, just this substation’s sister transformer. To avoid outage risk to the connected customers, a summer outage will occur to replace this equipment, with this work coordinated together for one outage. The feeder cable replacement work by internal line crews is coordinated with this project as an opportunistic benefit while the station is out for these upgrades and regular maintenance. WEYCO 3 Substation 115kV Switch Replacements– Percent Complete: Not Yet Available Three 115 kV switches will be replaced with new switches. These switches are end of life, and have shown signs of deterioration by way of increased difficulty to actuate. This station has a high customer economic impact if a failure is experienced. Substation Battery Bank Replacements– Percent Complete: Not Yet Available The battery banks will be replaced at three substations, yet to be determined based on testing results. Battery replacements are chosen on a condition based priority. Live Front Distribution Switch Replacements– Percent Complete: 24% Seven live front switches will replaced with the new standard deadfront switches. All XLP insulated cable terminated at these switches will also be replaced with EPR insulated 15 kV cable with a 40 year warranty. This replacement has safety benefits for internal staff during switching operations, and is preventative replacement to avoid equipment failure which causes customer outages. So far this year two live front switches have been replaced.

APPENDIX G
EWEB ORGANIZATIONAL PERFORMANCE DASHBOARD OPERATIONAL PERFORMANCE INDICATORS CY2018
Operational Performance Area JOP Q1 Status
Q2 Status
Q3 Status
Q4 Status
Owner(s) (Lead) Trend Comments Drivers
Customer Operations McGaughey
Call center metrics below target due to post office/lockbox issues that were resolved in April. Hiring new customer service analysts in April to gear up for CIS conversion. Phone transactional survey delayed due to vendor availability. Projected to be operational in Q2. Meter reading dog interactions high in the first quarter. Working on root cause and future training.
Safety Call Center/Atrium Metrics
Meter Reading Efficiency/Accuracy New ‐ Transactional Survey (Quality)
First Interaction Satisfaction Budget Adherence/Improvement Workforce Depth/Bench Strength
Customer Energy and Water Solutions
Gonzalez
C&M: Active participation/support in EWEB priority projects including AMI (AMI Communications Blueprint/Plan) and CIS (Internal). Work intake process created and implemented. Coordinating with BLM’s and others to support products & services marketing efforts. Timely completion of all outreach and communications efforts. CRM: Account selection process has been improved and accounts have been assigned to CRM’s. Currently in the development of Business Plans for KA’s. New Construction/Developer feedback event planning in process. BLM: Actively reviewing existing EWEB offerings including Limited Income, GP, Solar, etc. Completed promotional incentives for EV Promo, HP Winter Promo in Q1. Active participation in RevUp Eugene (UO). FS: Meeting BPA reimbursement/Conservation numbers and pacing to meet EOY targets.
Safety Outreach/Communications New Product Introductions New Product & Service Sales Key Account Satisfaction LI/EE Incentives vs. Result
(kwh/gal/$) Budget Adherence/Improvement Workforce Depth/Bench Strength
Electric Engineering & Operations Price
Budget and reliability and compliance right on track.
Safety Compliance
Reliability (SAIDI/SAIFI, etc.) Disruption/Storm Response
Project Execution (Cust.& Cap.) Budget Adherence/Improvement

APPENDIX G
EWEB ORGANIZATIONAL PERFORMANCE DASHBOARD OPERATIONAL PERFORMANCE INDICATORS CY2018
Operational Performance Area JOP Q1 Status
Q2 Status
Q3 Status
Q4 Status
Owner(s) (Lead) Trend Comments Drivers
Workforce Depth/Bench Strength
Energy & Generation Operations Ackerman
More green than yellow. Green light is indicative of energy production, trading performance, compliance and budget adherence. Two reportables in Generation, workforce depth and legislative influence continue to be areas of focus. Proforma work continues. Workforce planning is underway, due to anticipated need for specialized labor skills in generation relicensing. Legislative work continues in advance of the 2019 session.
Safety Compliance
Project Proforma/Gen. Availability Trading Operation (mitigation vs
Mkt. performance) Legislative Influence
Budget Adherence/Improvement Workforce Depth/Bench Strength
Water Engineering & Operations Damewood
All Water Quality and Safety targets met in Q1 for the water utility. There were no violations of regulations for safety or water quality. Reliability for the water utility was exceptional for Q1, as there were only 11 unplanned outages (~1 break per 100 miles of pipe) and duration of outage right at about 2 hours ave. Capital projects are progressing as expected and budget currently being adhered to.
Safety Water Quality/Compliance Reliability (breaks/mile) Disruption Response Project Execution DWSP Execution
Budget Adherence/Improvement Workforce Depth/Bench Strength
Finance Fahey
Green represents that financial metrics for both utilities were good in first quarter. Yellow represents Finance division lagging in workforce depth area. Several positions have been filled and work on developing bench strength in compulsory areas that began in 2016 has picked up again.
Safety Board Financial Metrics
Budget Adherence Procurement/Cost Improvements Budget Adherence/Improvement Workforce Depth/Bench Strength

APPENDIX G
EWEB ORGANIZATIONAL PERFORMANCE DASHBOARD OPERATIONAL PERFORMANCE INDICATORS CY2018
Operational Performance Area JOP Q1 Status
Q2 Status
Q3 Status
Q4 Status
Owner(s) (Lead) Trend Comments Drivers
Human Resources Kostopulos
All drivers on track to meet Division goals. Major projects and initiatives including Wellness Program, outsourcing Leave Management, and UltiPro module implementation are underway and meeting planned milestones.
Workforce Metrics Safety (Overall) Compliance
Health & Wellness Labor Relations
UltiPro Project Execution Workforce Depth/Bench Strength Budget Adherence/Improvement
Information Services Barton Projects are on track to meet goals. Both Capital and O&M budgets/projects are progressing as expected. We continue to maintain a strong patching program.
Safety O&M Spending/Reduction
Cyber Security Compliance
Project Execution Workforce Depth/Bench Strength Budget Adherence/Improvement
Status = Traffic light indicators represent past performance for the quarter Trend = Arrows are a projection of future results Red Light = Significant actual or projected miss in cost, scope or schedule. Issues that will likely cause material impacts. Yellow Light = Potential or minor miss with respect to cost, scope or schedule. No major impacts in spite of miss. Gray Light = too early to tell; metrics in process of being defined or collected. Green Light = Completed or projected to complete with respect to cost, scope or schedule. Results exceed or expected to exceed objective. Split Color Light = Two distinct reporting results, which will be explained in the comments section. In the case of a split color light displayed for Financial reporting, revenue will appear on the left‐hand side and expenses will appear on the right‐hand side.

APPENDIX H
EWEB ORGANIZATIONAL PERFORMANCE DASHBOARD STRATEGIC GOALS CY2018
Strategic Initiatives Q1 Status
Q2 Status
Q3 Status
Q4 Status
Owner(s) (Lead) Trend Comments Drivers
Cus
tom
er C
onfid
ence
Customer Confidence – Operational Performance
Executive Leadership (Lawson)
Yellow due to struggles with lockbox and post office forwarding issues in Q1. Positive results include the AMI communications blueprint and process improvements in Distribution Engineering which will enhance speed of delivery and ease of business; developers/customers will notice these changes beginning in Q2.
See Operational Dashboard
Customer Confidence – Technology/ Customer Information System (CIS)
Barton/ Fahey/
McGaughey (Barton)
CIS-R Project is progressing along as planned. The project is meeting its scope, schedule, and budget. Key accomplishments for Q1 include: Installation of Cayenta Utilities application and
database Ten weeks of “Discovery” sessions designed to
validate and discover new or emerging EWEB business requirements and business processes associated with EWEB’s Customer Information Systems.
Completed Functional Test Plan Identified amount of data (in years) to migrate from
EWEB legacy systems to Cayenta Yellow light due to critical defects that will prevent Cayenta from passing acceptance testing. A notice has been issued to Cayenta.
Configuration & Deployment Milestones
(Live in 2019)
Customer Confidence – Technology/ Advanced Metering Infrastructure (AMI)
Fahey
AMI process and organizational structure on track. Deployment Milestones
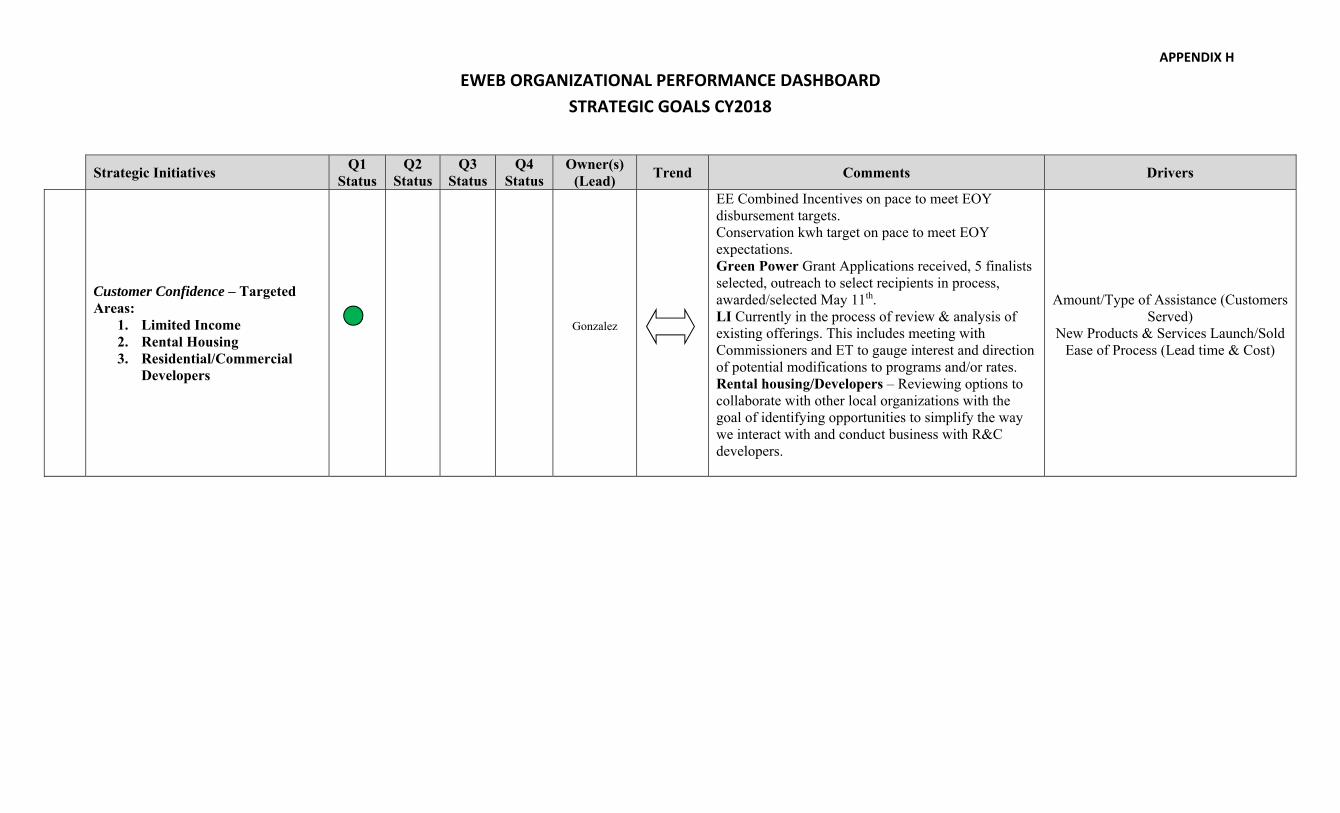
APPENDIX H
EWEB ORGANIZATIONAL PERFORMANCE DASHBOARD STRATEGIC GOALS CY2018
Strategic Initiatives Q1 Status
Q2 Status
Q3 Status
Q4 Status
Owner(s) (Lead) Trend Comments Drivers
Customer Confidence – Targeted Areas:
1. Limited Income 2. Rental Housing 3. Residential/Commercial
Developers
Gonzalez
EE Combined Incentives on pace to meet EOY disbursement targets. Conservation kwh target on pace to meet EOY expectations. Green Power Grant Applications received, 5 finalists selected, outreach to select recipients in process, awarded/selected May 11th. LI Currently in the process of review & analysis of existing offerings. This includes meeting with Commissioners and ET to gauge interest and direction of potential modifications to programs and/or rates. Rental housing/Developers – Reviewing options to collaborate with other local organizations with the goal of identifying opportunities to simplify the way we interact with and conduct business with R&C developers.
Amount/Type of Assistance (Customers Served)
New Products & Services Launch/Sold Ease of Process (Lead time & Cost)

APPENDIX H
EWEB ORGANIZATIONAL PERFORMANCE DASHBOARD STRATEGIC GOALS CY2018
Ele
ctri
c R
esou
rces
Influence regulatory and legislative issues that support/increase the value low-carbon resources.
Ackerman
Influenced the 2018 short-session process to the extent possible. Carbon legislation made it out of committee but didn’t get a floor vote. Positioned well for continued work on the issue in 2018 in advance of the 2019 regular session.
EWEB Strategic Update Carbon Legislation
Climate Recovery Ordinance Climate Energy Action Plan (CEAP)
Res
ilien
cy
Resiliency – Commission our first neighborhood emergency station (water & electricity)
Damewood
Price (Damewood)
Emergency Water Distribution sites - IGA with Kalapuya is being finalized and parts are being ordered. Treatment Trailer is currently being tested and looking to modify. 4J presentation completed. Water investigating potential drill well at Howard School in 2018 as well.
Design & Commissioning Milestones
Resiliency – Electric Master Planning Price
Including: Infrastructure Replacement Resiliency-Black Start Resiliency-Distribution Flexibility Reliability & Safety The Master Plan and Outage Management process improvement are a little behind schedule due to end of year changes and first of year goal setting and performance reviews. Both projects are picking up again.
Milestone- Planning (May)
Organizational Development Exec.
Leadership (Lawson)
New organizational structure in place to support AMI; Chief Financial Officer assigned as sponsor and is building a team for project roll out.
The Supervisory Development Project is going well; in Q1 volunteer participants defined common job duties, minimum requirements and competencies which will be used to update EWEB’s Supervisor position descriptions.
Directional Alignment Workforce Dynamics
Supervisor Competency Employee Development
Integrity & Respect Workforce Depth/Bench Strength

APPENDIX H
EWEB ORGANIZATIONAL PERFORMANCE DASHBOARD STRATEGIC GOALS CY2018
EWEB University was leveraged for several required trainings. Marketing campaign underway to increase awareness which yielded especially positive results in February.
Chief Human Resources Officer delivered Sexual Harassment Prevention Training to 103 managers, supervisors, lead workers and other employees in Q1 and beginning of Q2.
Status = Traffic light indicators represent past performance for the quarter Trend = Arrows are a projection of future results Red Light = Significant actual or projected miss in cost, scope or schedule. Issues that will likely cause material impacts. Yellow Light = Potential or minor miss with respect to cost, scope or schedule. No major impacts in spite of miss. Gray Light = too early to tell; metrics in process of being defined or collected. Green Light = Completed or projected to complete with respect to cost, scope or schedule. Results exceed or expected to exceed objective. Split Color Light = Two distinct reporting results, which will be explained in the comments section. In the case of a split color light displayed for Financial reporting, revenue will appear on the left-hand side and expenses will appear on the right-hand side.