Embed Size (px)
Citation preview

1
M E M O R A N D U M
EUGENE WATER & ELECTRIC BOARD
TO: Commissioners Helgeson, Brown, Mital, Simpson and Carlson
FROM: Frank Lawson, General Manager DATE: October 19, 2017
SUBJECT: Board Governing Style, Board Policy GP1
OBJECTIVE: Information Only Issue According to Board Policy GP1, the Board will monitor and discuss the Board’s process and performance during the last quarter of the year. Self-monitoring will include comparison of Board activity and discipline to policies in the Governance Process and Board-GM Linkage categories. Discussion To comport with the policy, time has been reserved on the December agenda for Commissioners to share their perspectives of the Board’s performance. This opportunity is intended to address any disparities in processes; identify any desire for expanded knowledge in strategic areas; and confirm the Board is giving adequate attention to its priorities. If desired, staff will facilitate advanced work such as a survey, or questionnaire, to aid the discussion. A copy of the assessment used in 2015 is attached as an example. Please consider what you wish to gain from this experience and your preferred method of submitting your impressions. Please provide your feedback to the General Manager and Executive Assistant. Requested Board Action No action is required, management requests Board feedback to guide the process.

EWEB Commissioners Assessment (COMPOSITE)
The following table is a tool to gain an impression of how well the board is doing as a whole. The table is a basic form for board evaluation, but if the evaluation is conducted wholeheartedly, it should generally indicate how well the board is conducting its role.
You may complete the form electronically or print a copy and write in your responses. Commissioners may also attach suggestions to improve ratings for any of the following 27 considerations.
Please submit the completed form to the Executive Assistant no later than _______. The EA will not read the assessments. All identifying information will be removed and the anonymous evaluations will be provided to the Board President who will collate and share the results.
Considerations
5 Strongly
Agree
4 Agree
3 Unsure
2 Disagree
1 Strongly Disagree
1. Board has a full and a common understanding of the roles and responsibilities of the board.
2. Board members understand the organization’s mission, vision, products and services.
3. Structural pattern (board, officers, committees, executives and staff) is clear, delineated in bylaws, and followed by board.
4. Board members actively participate in strategic planning and ongoing strategic thinking.
5. The board has adopted, and uses, explicit measures of progress toward identified outcomes.
6. Board attends to policy- related decisions which effectively guide operational activities of staff.

7. Board receives regular reports on finances/budgets, service/program performance and other important matters.
8. Board effectively represents the organization to the community (i.e. has an “elevator speech.”)
9. Board meetings facilitate focus and progress on important organizational matters with reporting kept to a minimum.
10. Board meetings are adequate in length and held at the right time of the day.
11. Board regularly evaluates and develops yearly goals with the chief executive.
12. The board reviews the compensation of the Executive Director based on industry standards.
13. Board has approved comprehensive personnel policies which have been reviewed by a qualified professional.
14. Board culture encourages and welcomes open discussion, even when members disagree.
15. Board has an emergency succession plan for executive.

Considerations
5 Strongly
Agree
4 Agree
3 Unsure
2 Disagree
1 Strongly Disagree
16. Board is attentive to building leadership capacity on both board and staff.
17. Board regularly assesses itself as a whole and also board member participation individually.
18. Board has a packet of materials for new board members and an orientation process for them.
19. Board has a board agreement, a whistleblower policy and a conflict of interest policy that all board members must sign and follow.
20. The board regularly monitors financial performance and projections.
21. Board members are sufficiently knowledgeable to ask meaningful questions about finances and financial management.
22. The board reviews the audit report and has an opportunity to ask questions of the auditor at an exit conference.
23. The board reviews the 990 before filing.
24. The board has a process for handling urgent matters between meetings.
25. The board has an annual calendar of meetings.
26. The board has an attendance policy.
27. Each member of the board feels involved and interested in the board’s
work.

Written Questions
What specifically would help to make you a more engaged board member?
Please list the three to five issues on which you believe the board should focus its attention in the next year. Be as specific as possible in identifying these points.
In ten years, what do you believe is the single most important impact that this organization should have on the community it serves?
1
M E M O R A N D U M EUGENE WATER & ELECTRIC BOARD
TO: Commissioners Helgeson, Brown, Mital, Simpson and Carlson
FROM: Frank Lawson, General Manager; Jeannine Parisi, Customer Relations Manager
DATE: November 1, 2017
SUBJECT: Community Education Grants
OBJECTIVE: Information only Issue EWEB is implementing a new strategic plan with a focus on affordability, including a review of how discretionary funds are allocated. The Board has directed Management to ensure that its community investment dollars are targeted towards programs and activities that are aligned with the utility’s strategic priorities and provide benefit to the most number of customers. The Board has requested more information about how school grants are applied through this lens. Background The EWEB Education Grant Program, established in 1995, replaced long standing “contributions-in-lieu-of-tax” (CILT) payments to the four school districts in our service territory. A similar change was made in 1998 for Lane Community College. The Grant Program provides funding for water and energy education activities in four area school districts: Eugene (4J), Bethel, Springfield and McKenzie, and for Lane Community College (LCC). Five-year Inter-Governmental Agreements (IGAs) are used to allocate the grant as follows: Eugene (4J)-$247,000; Bethel-$77,000; Springfield-$47,000; McKenzie-$21,000 and for LCC -$70,000. Language in the IGAs provide EWEB with the ability to increase or decrease grant payments as part of the annual budget process. The EWEB Board last renewed the IGAs in December 2015, continuing funding for the following five years at the 2015 funding levels. This renewal carried forward a 50% reduction to LCC enacted during the economic recession. Discussion Support for K-12 education programs are fairly common among electric utilities, including classroom presentations and site tours provided by utility staff, and scaling up to direct funding for equipment, events and curriculum. EWEB’s education grants are one of the more tangible benefits derived from the public ownership of the electric and water utility, with thousands of students as direct beneficiaries. EWEB funding fills a critical resource gap for science curriculum and hands-on learning at area schools, enabling field trips, equipment purchases, teacher training, and multi-district events like the solar car challenge. Refer to the attachment for a summary of the main grant funded activities in the Bethel and 4J School Districts during the 2016-17 school year. For a recent example of how EWEB grants support hands-on science learning, there is an article in the EWEB newsroom and a short video describing the Salmon Watch program. Links to the article and video are here:

2
http://www.eweb.org/about-us/news/salmon-watch-visits-carmen-smith-spawning-channel https://youtu.be/3zdg8MBf1XA. The LCC grant is a bit different in that the funds have largely been to support instruction and administration of its two-year energy management, building controls technician, and water conservation programs. Employment rates play a key factor in community college enrollment levels. Consequently, the current record low unemployment rate (4.5%) has led to under-enrollment in many technical programs, including energy management. Ideally, the building controls and energy management courses target twenty or so students per year, but participation has been much lower the past few years. Students that do graduate have high placement rates in the labor market in a variety of well-paid positions, like energy analysts, resource conservation managers, and building controls specialists. LCC was successful in receiving a grant from the National Science Foundation (NSF) to move its commercial building energy management curriculum completely on-line and offer the curriculum to students throughout the Northwest. The Northwest Public Power Association (NWPPA) and Northwest Public Utilities are intimately involved in the deployment of the online program. With NSF and EWEB grant funds supporting the development of this new effort, LCC has the potential to greatly extend the program’s reach while offering improved economies of scale to the college. This year was the first time the on-line curriculum was offered and the college hopes to improve marketing to increase participation despite current enrollment trends. TBL Assessment No formal TBL has been completed. Recommendation Management has met with LCC program directors to discuss future funding in light of the Board strategic direction and EWEB’s affordability initiative. In comparison to the school district funding, the LCC grant has a more limited reach in terms of the number of EWEB customers impacted. However, there is specific benefit in terms of high workforce placement rates of LCC energy and water conservation program graduates, with graduates finding employment in both private businesses and public utilities throughout the region. Requested Board Action No action is requested at this time; the information in this backgrounder has been provided to assist the Board as they provide direction on the proposed budget which is scheduled to be approved in December.

*Springfield and McKenzie School Districts are supported at levels roughly proportional to the amount of EWEB revenue generated in their districts ($47k and $21k) and use EWEB funding for similar science-based activities.
We believe that science education and hands-on learning for area school children is an important investment in our future. The following is a summary of major EWEB grant-funded activities in the 4J
School District during the 2016-2017 school year.
Salmon Rearing Field Trips/Labs KidWind Projects Science Kits
1700 1800 500+ 7000+
• Energy conservation • Water resources • Biology/Chemistry • Aerodynamics • Sustainable energy • Math/Engineering
• Electric generation/safety
• Local watersheds • Recycling
EWEB Education Grants 4J School District | 2016-2017
Investment
33 Schools Elementary, middle and high
19 STEM Programs
Science, Technology, Engineering & Math
$247K Funds activities, curriculum, equipment &
teacher training
Multi-District Solar Challenge
20th Annual Event involving 3600 students
1000+ Race Day Participants 150 teams from 14 middle schools
4 competitions Speed, art, science, & hills
STUDENT REACH
SUBJECTS

• Energy conservation • Water resources • Math/Engineering • Aerodynamics • Sustainable energy • Biology/chemistry • Watershed protection • Electric safety & generation • Recycling
EWEB Education Grants Bethel School District | 2016 - 2017
We know that education is a critical ingredient for a healthy, prosperous community. The EWEB Education Grant Program provides funding for activities in four area school districts. Here is a summary of the main grant-funded activities in the Bethel School District during the
2016-17 school year.
INVESTMENT
REACH
Field Trips
570 Kids
Watershed & Fish Studies
1000 Kids
Science Kits & Labs
2,000+ Kids
Wind Turbine Projects
500 Kids
Electric & Solar Car Projects
550 Kids
11 Schools
Elementary, middle and high
13 STEM Programs
Science, Technology, Engineering & Math
$77k Grant funds
For activities, curriculum, and materials
SUBJECTS
CONGRATULATIONS!
Ten classes participated and one team from Willamette high school advanced to
the National KidWind Challenge in Anaheim, Ca. Congrats to Team Hot Glue for placing 6th out of 24 teams and 3rd in
energy production!

1
M E M O R A N D U M EUGENE WATER & ELECTRIC BOARD
TO: Commissioners Helgeson, Brown, Mital, Simpson and Carlson
FROM: Rene Gonzales, Customer Solutions Manager
DATE: 10/20/2017
SUBJECT: Comparison of Utility Limited Income Assistance
OBJECTIVE: Information Only Issue This is an information item only regarding EWEB funding levels for limited income customer program offerings compared to other regional utilities. Background At the September and October 2017 Board meetings, Commissioners received public testimony from Keith Kueny, representing the Community Action Partnership of Oregon (CAPO). He urged continuation of funding for limited income assistance and noted that while some other Northwest utilities were expanding their programs, EWEB had not. Commissioners requested additional data on EWEB and regional utilities contributions to limited-income assistance programs. Staff requested data from a dozen area utilities, reviewed published financial reports, and PUC Oregon Utility Statistics books. We received complete information from ten of those utilities. However, direct comparisons are difficult to construct as each utility offers a different suite of programs, some voluntary and some under regulatory obligations. For example, Portland General Electric is required to collect a 1% public purpose charge for low income weatherization, and an additional required contribution for bill assistance, raising over $20 million. In comparison, Snohomish PUD budgets $250,000 for limited income energy efficiency programs, but has an unlimited, needs-based rate discount equivalent to $6.5 million in 2016. Discussion EWEB support for limited income assistance includes bill credits and/or energy education services called Customer Care and Customer Care Plus, as well as, limited income energy assistance programs delivered through EWEB’s customer solutions energy management staff and our partner agencies. Program budgets are supplemented with donations from customers, the annual Run to Stay Warm fundraiser and employee voluntary contributions. Funding levels increased dramatically during the economic recession with the addition of federal support and Board approved increases to programs. As the economy slowly recovered, grants expired and EWEB’s own financial situation became more constrained, budgets for limited income assistance returned to pre-recession levels.

2
Note: EWEB suspended its energy-efficiency programs in 2012.
At a high level, we found that all ten utilities offer limited income energy efficiency programs, eight offer bill pay assistance, four provide rate discounts, and six offer energy education or financial literacy services. The table below shows the percentage of revenue dedicated to limited income programs in calendar year 2016 for each utility. For this comparison, 2016 actual program expenditures, not budgeted amounts, were used to calculate the percentages. For utilities with rate discounts, those contributions were treated as bill pay assistance. Two utilities did not break out energy efficiency funds for limited income customers. And because energy education programs are very difficult to compare, this data was excluded from the table. In short, this presentation is our best understanding of the data provided.
TBL Assessment N/A Recommendation None at this time. Requested Board Action Information only
$- $1,000,000.00 $2,000,000.00 $3,000,000.00 $4,000,000.00 $5,000,000.00 $6,000,000.00 $7,000,000.00
2007 2008 2009 2010 2011 2012 2013 2014 2015 2016 2017
10 YEAR LIMITED-INCOME EXPENDITURES
Bill Assistance Energy Efficiency Combined
0.43
% 0.58
%
0.60
%
0.61
%
0.70
% 0.86
%
0.95
%
1.07
%
1.19
% 1.32
%UTILITY LI EXPENDITURES AS % OF TOTAL RETAIL
REVENUE

Capital "EL1" Report: Electric, 2017 -Q3Type 1 - General Capital
Capital Category Budget YTD ActualYear-End
Projection
Electric Infrastructure - Generation $1,196,000 (Note 2) $795,603 $987,000
Electric Infrastructure - Substations $1,780,000 $984,891 $1,892,294
Electric Infrastructure - Telecom $250,000 $150,112 $200,000
Electric Infrastructure - Transmission &
Distribution$7,065,000 $5,628,699 (1) $7,307,086
Project Budget YTD ActualYear-End
Projection
Initial
Plan
To-Date
Actual
Project-End
ProjectionStart
Initial
Planned
Completion
Projected
Completion
Leaburg Dam Roll Gate Hoists $0 $57,810 $100,000 $5,150,000 $6,342,888 $7,000,000 Jul-2012 Nov-2014 Oct-2018All three hoist systems released for full automatic operation in Q1. Final payments to contractors pending punch list completion, expected by the end of Q4
2017. Potential repair of worn gate teeth under investigation for 2018 implementation. ZINNIKER
Downtown Fiber Network $600,000 $70,556 $600,000 $2,100,000 $69,253 $2,100,000 Mar-2017 Dec-2018 Dec-2018Crews have begun installing fiber microduct for the Downtown Network. City of Eugene has received grant award. Final tasks related to grant compliance
being completed. Most funding for this work will be transferred to O&M in the future and is reimbursible. -NICE
Weyerhauser Property Purchase $1,300,000 $0 $1,300,000 $1,250,000 $122,047 $1,300,000 Jul-2016 Dec-2016 Feb-2018Property purchase delayed from Q1 2017 due to issues with leasee and current Owner. It will be decided late November if funds will be allocated to escrow
to allow funding to be used. Final closing expected to take place in early 2018. This land is for the purpose of the future Thurston Substation reconfiguration
and source protection. A portion of the acquired property is not needed for utility purposes and, therefore, our intent is to surplus it in 2018. -NICE
Upriver Re-Configuration/Holden Ck.
Substation$4,457,000 (Note 2) $2,037,262 $4,857,000 $3,000,000 $1,550,073 $5,830,000 Jan-2014 Oct-2015 Feb-2018
Major equipment has been installed with final terminations and control cable routing in progress. The substation concrete fence is approximately 50%
complete. It is expected all major construction with the exception of the fence will be completed by the first week of November, with Fence completion
going into the second week of November. EWEB crews will be mobilizing the second week of November to finish final wiring, testing and commissioning
through January 2018. Final details for the BPA connection are being completed and energization of the substation is planned for June 2018, following
completion of BPA design and construction activities. $400k overage for 2017 is due to full payment to BPA for the design and execution of interconnection
is being pre-paid per their process. This was originally planned to be paid for in early 2018. -NICE
Downtown Distribution Network $1,000,000 (Note 2) $750,597 $1,100,000 $15,000,000 $266,570 $20,000,000 Sep-2010 Dec-2015 Dec-2028
2018 Total shown includes Pre-capped materials (network protectors & transformers -( $562K precap & $188,597 labor & other thru Sept & $837K precap &
$263K labor & other for 2017 YE). Downtown Network protector replacements have been completed in 2017 at vaults 9G-Lane County Building, 3F-Hilton, 2K-
US Bank. Replacements at 13M-Baker Bldg, 2F Hult Center, 13F-Federal Bldg to occur remainder of year. Engineering is currently in planning phase for
remaining work developing preliminary design, scope, schedule and budget for priority of cable replacements, system modeling and configuration and
communication and automation upgrades. Development of electrical model is currently in progress. Update of GIS mapping is complete. -NICE
Grid Edge Demonstration Project $837,000 (Note 2) $122,048 $130,000 $1,200,000 $143,455 $1,200,000 May-2016 Jun-2017 Sep-2018Project direction finalized to include an installation at ROC and one at a 4J site in 2018, with additional 5 schools in next 5 years. Design-build RFP
advertisement scheduled to be completed mid November with award in early 2018 to manufacturer and integrator. Procurement and delivery of materials
scheduled for end of Q1 of 2018 with installation and commissioning planned for Q3 of 2018. -NICE
Jessen Substation Reconfiguration $125,000 $0 $0 $125,000 $0 $0 Mar-2017 Dec-2018 Dec-2019Initially planned to do design work in 2017 and construction in 2018 however project execution pushed out to 2019 after asset prioritization efforts in order
to place emphasis on completion of upriver transmission reconfiguration program. -NICE
Project Budget YTD ActualYear-End
Projection
Initial
Plan
To-Date
Actual
Project-End
ProjectionStart
Initial
Planned
Completion
Projected
Completion
Carmen Smith License Implementation $11,700,000 $3,835,554 $5,900,000 $135,000,000 $41,696,710 $129,500,000 May-2009 Dec-2021 Dec-2025
The Project End Projection has been updated to reflect the 2016 Settlement Agreement that has been filed with the FERC. Staff has completed and filed the
revisions to the FERC exhibits and the Biological Assessment. We expect the license to be issued no earlier than Q2 of 2018. Implementation of 5-year plan
to address aging infrastructure at Carmen Powerhouse underway. The Carmen Power Tunnel was successfully dewatered and inspected in October with
minor repairs required in a future outage. The turbine shutoff valves were delivered late, so installation was re-scheduled to begin in May 2018 with intent
to complete by the end of October 2018. Design and procurement of equipment for rebuilding the substation in 2019 has also begun. (ZINNIKER, BOYLE)
Total Electric Capital (Excluding Shared Services) $30,185,000 $14,433,132 $24,373,380 81%
Note(s)
2. Budget amounts are adjusted to reflect changes presented and approved by the Board on April 4, 2017 (April True Up)
Status/Comments
Capital work continued in Q3 during the planned outages. New canal flow meter in Walterville is operational. Rec trail at Leaburg forebay is
complete. Emergent capital work at Stone Creek (triggered by failed generator relay) more than offset by LB-WV capital deferred to compensate. -
ZINNIKER
Type 1 Projects currently tracking on planned schedule and within 5% of budget. Bertelsen 115kV breaker and swich replacement is completed and
commissioned. 15kV breaker replacements at three stations are expected to be completed in mid November. Remainder of R&R projects
substantially complete and in closeout phase (comm upgrades, battery replacements, etc.). - NICE
Customer reimbursable work is forecasted to be under budget by $600k due to a lull of customer construction, with renewal and replacement work
expected to be over budget by $1.3M due to EWEB's capacity to complete more work via an EWEB hired contractor. Enhancements and additions
to the distribution system are on track. Actuals or year-end projection shown does not include pre-capitalized transformers or meters of which
have spent to date approximately $1.2M to date. - FATOOH
These categories match the Capital Improvement Plans (CIPs) submitted by Water & Electric.
Type 1 - General Capital is budgeted Year-by-Year for recurring capital expenditures from January through December. Type 1 Capital
includes categorized collections of projects of less than $1 million. Typical examples include "pole replacements" as part of Transmission &
Distribution. This work typically involves many small projects that up to $1.2-$1.7 million per year.
Type 2 projects have "discrete" scopes, schedules (launch through completion), and cost over $1MM during the project life.
Type 3 - Strategic Projects & Programs 2017 thru Q3 Project Total Schedule
2017 thru Q3 Note - Changes from previous report(s) are in BOLD
Type 2 Rehabilitation & Expansion
Projects2017 thru Q3 Project Total Schedule
Management Notes: The Electric Capital Budget expenditure rate is lower than actual to date (48% vs. 75%), Type I expenditures predicted year end is at 114% of budget vs. actual. ($11.7M), with about 85% spent through Q3. Type II spending ended at 37% of Q3 spending, and projected
expenditures year end at 97%. Spending for this work type is not consistent with a straight line approximation due to end of year anticipated balloon payments (i.e.: Holden Creek, Weyerhaeuser Purchase). Holden Creek Substation project substantial construction by the contractor is slated
to complete in November 2017 and is expected to have large contractor and major equipment payments come in before year end. Downtown Network projects have shown steady spending are on track for this year with a slight overspend due to opportunistic work being completed in
addition to the planned work. Carmen Smith spending is expected to be approximately 50% of budgeted at year end due to delays in the Turbine Shutoff Valve delivery, which has resulted in this project being pushed to 2018. Staff also postponed the acceleration of Trail Bridge fish passage
design work once it became clear that the FERC would not issue a new license in 2017. Staff expect significant spending on fish passage design to resume in 2018. These spending delays were anticipated during the development of the 2018 capital budget for Carmen-Smith, so no transfer of
2017 budget to 2018 is anticipated during the April True-Up. Year end projections of total expenditures vs. budget for Type 1 & Type 2 work combined is predicted to be 106% excluding Shared Services and Type 3, and 81% including Type 3 (Carmen) for the overall Electric Division budget
(with precap materials included).
1. Distribution transformers, Non-AMI meters and network protectors are being capitalized when received in inventory, therefore some projects in T&D and Downtown network are understated.
Status/Comments
Status/Comments
Consists of EWEB driven and Customer Driven work. Currently tracking below expected trajectory. Construction of two projects with the city have
been completed with the third started the week of October 16th. - NICE
\\ewebnetwork.net\data\share\EL1_Reports\2017\Q3\EL-1 Capital Report - Electric - Q3 - 2017-DRAFT.xlsx

Capital EL1 Report: Water, 2017-Q310/27/2017
Type 1 - General Capital
Project Budget YTD ActualYear-End
Projection
Source - Water Intakes & Filtration Plant $1,030,000 $577,000 $800,000
Mains - Replacements, Improvements, & Trans. $4,378,000 $3,067,000 $4,485,000
Services and Meters $1,803,000 $1,515,000 $2,000,000
Pump Stations $1,236,000 $406,000 $900,000
Reservoirs $103,000 $11,000 $50,000
Project Budget YTD ActualYear-End
Projection
Initial
Plan
To-Date
Actual
Project-End
ProjectionStart
Initial
Planned
Completion
Projected
Completion
Hayden Bridge Disinfection System Replacement $700,000 $93,000 $400,000 $3,645,000 $93,000 $3,580,000 2017 YE-2018 YE-2018Replacement of gas chlorine system with on-site liquid hypochlorite system. Project currently in design. (Initial
Plan - 2015 CIP)
Hayden Bridge Seismic Upgrades $515,000 $104,000 $220,000 $1,215,529 $1,221,067 $1,440,000 2014 YE-2015 Q1-2018Phase 1 (Basins and Filters) is complete. Phase 2 (Headhouse) deferred to 2017-2018. Phase 1 costs more
expensive than anticipated while 2017 costs coming in much less than anticipated. (Initial Plan - 2013 CIP)
Distribution System Scada/PLC Upgrades $412,000 $107,000 $400,000 $3,079,780 $588,109 $1,300,000 2013 YE-2016 YE-2019Multi-Year upgrade project. Completed Crest System. Currently working on Dillard and Willamette systems.
Project complexities and staffing limitations are affecting schedule (Initial Plan 2013 CIP)
Hayden Bridge Standby Power Improvements $1,030,000 $46,000 $450,000 $1,728,000 $72,666 $1,360,000 2015 YE-2017 Q1-2018
Design is complete and proceeding with the prepurchase of two generators, one for Hayden Bridge Plant and
one for Intakes along with electric equipment. Delays in design process have pushed construction to early 2018.
(Initial Plan - 2015 CIP)
Hawkins Reservoir Improvements $300,000 $124,000 $125,000 $2,067,000 $124,000 $2,110,000 2014 YE-2018 Q2-2019
Structural evaluations identified significant deficiencies with the existing reservoir. Due to high cost for
improvements, shifting focus to constructing new reservoir as part of the Water Utility's plan for distributed base
level reservoir. Adjustments will be made in 2018 Capital Plan to reflect change in focus. (Initial Plan 2016 CIP)
Project Budget YTD ActualYear-End
Projection
Initial
Plan
To-Date
Actual
Project-End
ProjectionStart
Initial
Planned
Completion
Projected
Completion
Second Source of Supply $1,830,000 $1,603,000 $1,700,000
Varied from
$52M to
$120M
$2,483,000 $67,000,0002014 with
PlanningYE-2021 YE-2030
Project has been deferred to the later years of the ten year CIP. For 2018 this project will be replaced with the
Emergency Water Supply Project
Total Water Capital (Excluding Shared Services) $13,337,000 $7,653,000 $11,530,000 86% year end projection to budget
Type 1, 2 Capital (Excluding Shared Services) $11,507,000 $6,050,000 $9,830,000 85% year end projection to budget
Status/Comments
Status/Comments
Work this year includes Upgrades at Santa Clara and Laurel Hill Pump
Stations, a new Crenshaw Pump Station (reimbursable) and work on a new
City View 1150 Pump Station. Scaling back Laurel Hill significantly is dropping
year end projections.
2017 work includes new hatch/vent and ladder at Crest 800 Reservoir
Project Total
Status/Comments
Schedule
Schedule
Management Notes: Overall Water’s Type 1 projects are tracking well. Our largest item in this area, Main Replacements is at approximately 74% of budget spent. Costs do lag in the reporting system however, so we will need to watch this area
closely. On the Water Type 2 projects, we are tracking low as design issues have delayed the start of construction on a couple projects to 2018. In addition, completed strutural evaluations have caused the Water Utility to change the focus on the
Hawkins Reservoir Rehabiliation delaying expenditures in this area. Type 3 projects are marked red for EL1 report due to project deferral. This project will be replaced by the Emergency Water Supply program in 2018. Overall, water has $13,337,000
budgeted for capital in 2017 (adjusted for the April True-Up) and anticipates spending 85% of that amount. Engineering’s target is attain at least 90% expenditures of the capital budget amounts which the Water Utility has exceeded for the past
several years. This year we will be below target due to the issues on the Type 2 projects noted.
Project Total
Largest item is solids improvement project. Also included are costs for
treatment trailer equipment, a SCADA/Historian upgrade and close out work
for the South Filter Upgrade.
Largest componet in this area is main replacements. This item is tracking well
so far. Cost reporting does lag however, so we will be watching this number
closely
Includes both new services and meters as well as replacement of existing
service lines. Running high - will monitor as we get closer to year end.
Type 3 - Strategic Projects & Programs 2017
2017
Type 2 Rehabilitation & Expansion Projects 2017
These categories will match the Capital Improvement Plans (CIPs) submitted by Water & Electric.
Type 1 - General Capital is budgeted Year-by-Year for recurring capital expenditures from January through December. Type 1 Capital includes categorized collections of projects of less than $1 million.Typical examples include "main replacements". This work typically involves dozens of jobs that add
up to $3.5-4.5 million per year.
Type 2 projects have "discrete" scopes, schedules (launch through completion), and cost over $1MM during the project life, and project life can span multiple years
.Type 3 projects are large strategic programs with long term impacts.

Capital "EL1" Report: Shared Services, 2017-Q3
Type 1 - General Capital
Capital Category Budget YTD ActualYear-End Projection
General Plant - Information Technology (I.T.) $1,185,355 $910,449 $1,185,355
General Plant - Buildings & Land Management $1,322,000 $340,301 $615,000
General Plant - Electric& Water Fleet Capital $610,000 $243,893 $610,000
Project Budget YTD ActualYear-End Projection Initial
Plan
To-Date
ActualProject-End Projection Start
Initial
Planned
Completion
Projected
Completion
AMI Information Technology & Integration $1,930,000 $2,112,027 $2,200,000 $6,475,700 $5,143,934 $6,475,700 May-2015 Dec-2017 May-2018Q3 2017 - Automated meter-to-bill process is in place for 1% of customer
meters, and eight-year full deployment has begun. Additional software
integration work is expected to continue through the end of 2017. (Jones)
Customer Information System (CIS) Replacement $1,500,000 $8,429 $186,495 $9.7M $8,429 $11,150,000 Sep-2016 Aug-2018 mid to late-2019Projected spending lower than anticipated due to
availability delay in third party resources.
$6,547,355 $3,615,099 $4,796,850 73.26%Note(s)
Total Shared Services Capital (This Report)1) April 2017 true-up budget numbers are reflected as Budget, as approved by Board on April 4, 2017.
Management Notes: Type I IT Projects are on track and on schedule. This is good news since in the past these projects have lagged for various reasons. As per the April True Up, Fleet Capital was
reduced significantly due to a re-assessment of future fleet needs and strategy. AMI is progressing forward in current Opt In Strategy. Projected spending is in the 82% range for end of year, largely
driven by the cancelation of HQ Fire Alarm System Upgrade and the shift to O&M from Capital by Facilities.
Type 2 Rehabilitation & Expansion Projects 2017 - Q3 Project Total Schedule
Status/Comments
2017- Q3 Note - Changes from previous report(s) are in BOLD
Status/Comments
In the future, these categories will match the Capital
Improvement Plans (CIPs) submitted by Water & Electric.
Type 1 - General Capital is budgeted Year-by-Year for recurring
capital expenditures from January through December. Type 1
Capital includes categorized collections of projects of less than $1
million. Typical examples include "pole replacements" as part of
Transmission & Distribution. This work typically involves many
small projects that add up to $1.2-$1.7 million per year.
Type 2 projects have "discrete" scopes, schedules (launch through
completion), and cost over $1MM during the project life.
Increase in IS Type I capital 500K as of 9/28/17 will be used to:
-Refresh the wireless infrustructure
-Refresh of Leaburg networking equipment
-Simplification of core network
Elevator Contracts approved by Board in Feb 2017 Contract for elevator upgrade has
been issued to Kone. All materials will be onsite and HQ North Building elevator
completed by end of year. HQ main building elevators completed in 2018. Upgrade of HQ
Fire Alarm System has been cancelled. (Morgenstern) ROC Comm Tower construction
tasks are underway and expected to be completed in December. (Wolfe)
Fleet recently rolled back in April True up - due to changes in strategy of fleet. ($500,000
for Electric, $110,000 for Water) remaining procurements are moving forward for 2017.
(Damewood)

1
M E M O R A N D U M EUGENE WATER & ELECTRIC BOARD
TO: Commissioners Helgeson, Brown, Mital, Simpson and Carlson
FROM: Mike McCann, Interim Chief Energy Officer, and Mark Zinniker, Generation
Engineering Supervisor
DATE: October 27, 2017
SUBJECT: EWEB Power Canal Seepage
OBJECTIVE: Summarize EWEB’s Seepage Management Approach for the Hydro Power Canals Issue Water seeping through the earthen embankments of the Leaburg and Walterville Canals affects adjoining private properties to varying degrees. Seepage is present at various locations along the full length of both canals, resulting in effects on neighboring properties that range from the difficult to perceive (increased subsurface groundwater levels) to the obvious (small flowing streams through natural swales or drainage ditches). The extent of seepage varies with canal water level, peaking at full canal flow and essentially disappearing when the canals are dewatered for annual maintenance. Neighbor reactions to the seepage conditions are also variable, ranging from favorable (seepage is used by some property owners for landscaping ponds/features and shallow wells) to negative (threats of property damage claims). EWEB primarily receives seepage-related complaints during the wet weather season when the combination of canal seepage and precipitation-derived stormwater is most likely to overwhelm the drainage capacity of neighboring properties, resulting in areas of spongy soils and/or ponding. Background The Walterville Canal, with a length of approximately four miles, was originally constructed between 1909 and 1910. The Leaburg Canal, with a length of approximately five miles, was constructed between 1927 and 1928. The canals were constructed by excavating into the slopes and hillsides above the McKenzie River where native materials ranged from alluvial deposits of silty/sandy gravels to basalt bedrock that required blasting. The excavation spoils were used to construct the downhill canal embankments. Modern repair work typically reveals the presence of a thin layer of finer grained soil on the interior face of the canal embankments that creates an earthen ‘liner’ for the canals. The embankment materials were placed in shallow lifts and compacted using teams of horses. The quality of construction was likely variable and generally poor relative to modern earthwork standards. As a result of the pre-modern earthwork designs and construction techniques, the presence of water seeping through the canal embankments is an expected and inevitable side effect of the power canals. As such, seepage impacts on neighboring properties became evident as soon as the power

2
canals were filled and went into operation. Archive records contain a significant volume of correspondence between EWEB and adjoining property owners regarding seepage impacts. These date from the initial days of canal operation to the present. Neighboring properties with poor drainage tend to be the most sensitive to canal seepage. Examples include properties sandwiched between the power canals and Highway 126. The highway itself is constructed on a raised embankment that impedes the downhill flow of water (canal seepage as well as stormwater). The water must either find its way to a culvert passing beneath the highway or infiltrate into the ground. Figure 1 shows this type of property during the wet weather season after a period of heavy rainfall. The highway is just beyond the trees on the left side of the photo and canal slope on the right.
Figure 1. Ponding between the Leaburg Canal and Highway 126 following heavy rainfall
Other properties adjacent to the canals are relatively flat. An example of this type of property is shown in Figure 2. Even though not sandwiched between the canal and highway, the water must pond significantly before it can drain away, otherwise it must infiltrate into the groundwater table. Again, this type of ponding is typically only present during periods of heavy rainfall.

3
Figure 2. Seepage effects on flat farmland adjacent to the Walterville Canal Canal Safety Surveillance and Monitoring While water seeping through the earthen canal embankments is normal, EWEB staff are constantly alert to the possibility of normal, clear seepage becoming excessive. Excessive seepage refers to levels of leakage from the canal that contain enough energy to erode embankment materials, resulting in heavy flows of cloudy or muddy water. If left unchecked, excessive seepage could remove soils to the point of undermining the structural integrity of a canal embankment, resulting in an uncontrolled release of water or ‘canal breach’. The entire Leaburg Canal and portions of the Walterville Canal are categorized by the Federal Energy Regulatory Commission (FERC) as High Hazard due to the potential for a failure to cause loss of life, property, or environmental resources. Prevention of a canal breach or uncontrolled release of water is the purpose of EWEB’s Dam Safety Program, a formal program that guides a wide variety of dam safety activities that are performed by EWEB engineering and operations staff, various contractors, and dam safety specialists. As part of the Dam Safety Program, EWEB staff regularly monitor seepage conditions along Leaburg and Walterville Canals. The monitoring activities include daily inspections of the high hazard portions of the canals by operations staff. On a weekly basis, operations staff also gather flow

4
measurements at permanent seepage weirs located at various known seepage points along the canals. These devices quantify the amount of seepage for analysis and trending by engineering staff. Figure 3 shows one of the seepage weirs. There are also numerous sites where seepage cannot be collected for measurement, but are still visually monitored and documented on weekly inspection checklists. These regular monitoring activities position EWEB staff to recognize any changed conditions that might warrant response. Additional dam safety inspections are conducted on monthly and quarterly intervals by EWEB operations and/or engineering staff. Dam safety engineers from the FERC inspect each canal annually. And every five years, an independent consultant hired by EWEB conducts an in-depth dam safety inspection and documentation review.
Figure 3. Permanent seepage weir monitoring station
Hazard Mitigation Control System Given the recognized potential for emergent problems on the canals and the importance of a prompt response to avert an uncontrolled release of water, EWEB has installed a Hazard Mitigation Control

5
Systems (HMCS) on both the Leaburg and Walterville Canals. Figure 4 shows a solar-powered HMCS monitoring station along the Leaburg Canal.
Figure 4. HMCS water level monitoring station, Leaburg Canal
The HMCS systems monitor water levels in the canals to confirm that they remain within a normal range. If the water level falls below the normal range (or rises above normal due to a canal blockage), the HMCS will first alarm, and then automatically close the canal intake gates if the condition worsens. In the unlikely event that a leak were to progress to the point of creating an abnormal water level even in the middle of the night, the HMCS ensures a proactive mitigation action without human intervention. Annual Canal Maintenance and Repairs The EWEB management team approved an annual O&M budget increase in 2013 that authorized spending a minimum of $100,000 per year for canal repairs. The first round of canal repairs were designed later that year for review and approval by the FERC and in-water work permitting agencies so that the work could be completed during the 2014 annual canal outage. EWEB has continued to design and implement canal repairs during each subsequent year as follows:
• 2014: 500 linear feet near Cogswell Creek on the Leaburg Canal • 2015: 100 linear feet near Johnson Creek on the Leaburg Canal • 2016: 520 linear feet near Rawhide Creek on the Walterville Canal • 2017: 120 linear feet near Johnson Creek on the Leaburg Canal
Construction timing for the repair work is constrained by several factors. Primary factors are the dependency of the McKenzie Hatchery and irrigators on the canals for water supply. The McKenzie

6
Hatchery can only tolerate a drawdown of the Leaburg Canal during the wet weather season. The hatchery’s alternative water supply from Cogswell Creek generally becomes inadequate in May. Irrigators along the Walterville Canal typically need the canal full by late June to maintain their crops. Within these seasonal constraints, EWEB needs to find a dry weather period to complete the precipitation-sensitive earthwork. The canal repair contracts are set up to require contractor mobilization on short notice in order to take advantage of favorable weather conditions when they appear. Staff experience to date indicates that the duration of dry weather windows during the wet weather season doesn’t permit much more than the currently targeted volume of earthwork at a given site. As a side note, EWEB completes annual maintenance on the fish screens and other activities that require a canal drawdown at the same time that the canal repairs are underway. The linear footage of canal bank that can be improved in a given year is dependent on how much of the interior slope of the canal is targeted for repair. If monitoring data indicate that the seepage is originating in the upper portion of the embankment and a relatively shallow repair design is expected to suffice, the linear footage of repair will be greater than if monitoring data indicates that the seepage is sourced deep on the canal and coffer damming will be required to complete the repairs. Figure 4 shows relatively shallow repair work underway in 2014 and Figure 5 shows a deep repair in progress with a hydraulic cofferdam system.
Figure 4. Shallow canal slope repairs, Leaburg Canal 2014
The effectiveness of canal repairs completed to date, in terms of reduction in seepage, has been variable. While the 2015 and 2016 repairs were highly effective at reducing seepage, the effectiveness of the 2014 and 2017 canal repairs was marginal. This variability is indicative of the

7
inherent trickiness of sleuthing out the source of a water leak. Correctly identifying a needle-in-the-haystack type seepage source is tricky and may require multiple repair attempts to resolve.
Figure 5. Deep canal slope repairs with coffer dam, Leaburg Canal 2015
It is important to note that even marginally effective canal repairs yield valuable improvement to the canals. The canals are home to a number of rodent species including nutria, beaver, otter, and muskrat which might try to burrow into any exposed soils below the waterline of the canals. By restoring the coverage of rip rap on the interior slopes of the canal, EWEB effectively armors the canals against rodent burrowing. The improved armoring also protects the underlying soils of the canal embankments from scour. Prioritization of Canal Repairs Each fall, EWEB generation staff review the latest seepage monitoring data and surveillance information in order to select a portion or portions of the canal embankments for repair during the next year’s annual canal outage. The following are the main considerations in order of importance that influence EWEB’s prioritization of the canal repairs:
1. Seepage areas of concern that have been observed to be worsening. 2. Risk ranking for stable seepage areas:
a. Perceived likelihood of failure b. Consequence of failure
3. In cases where the risk ranking is equal, the lower cost repair area may be prioritized if a delay in addressing the competing repair area is acceptable.

8
In the event that the cost to repair the priority seepage areas exceeds the baseline annual O&M budget allocation of $100,000, EWEB staff know that they have the ability to request additional funding from contingency reserves. Requested Board Action Information only, no Board action requested.

1
M E M O R A N D U M EUGENE WATER & ELECTRIC BOARD
TO: Commissioners Helgeson, Brown, Mital, Simpson and Carlson
FROM: Sue Fahey, Chief Financial Officer; TiaMarie Harwood, Interim General
Accounting & Treasury Supervisor
DATE: October 18, 2017
SUBJECT: Third Quarter 2017 Financial Report
OBJECTIVE: Information Only Organization Wide
Electric Utility Budgets Water Utility Budgets Capital Budget Spend YTD 52% Capital Budget Spend YTD 61% O&M Budget Spend YTD 84% O&M Budget Spend YTD 86%
Through the end of September, 75% of the annual budget year has passed. The Electric Utility is reporting a year-to-date unfavorable O&M budget variance primarily due to the $15.7 million accounting loss on the June debt defeasance. Excluding the defeasance loss, the year-to-date spending would be 77%. The Water Utility is reporting a year-to-date unfavorable O&M budget variance due to payment on intercompany debt. Excluding the interest expense recognized with the debt payoff, the year-to-date spending would be 72%. A budget amendment will be submitted for Board approval later this year. Labor The organization budgeted $1.3 million in turnover savings. Through September actual savings from vacancies is $3.0 million or 230% of target. At the current trajectory the year end savings will exceed $4 million. Savings are partially offset by early retirement (EVRI) and severance costs of approximately $500,000. No potential costs from November EVRI/Severance have been included. Non-Labor Operations & Maintenance Department Variance – Appendix A Actual non-labor department spend to date is 70% compared to budget. The overall forecast is expected to be $136,000 under budget by end of 2017. Unallocated contingency funds for the Electric Utility are $2,448,000 and for the Water Utility, $471,000. Electric Utility Electric Schedule of Revenues, Expenses, and Changes in Net Position (Income Statement) – Appendix B, page 1

2
Electric Income before capital contributions (Net Income) Net income for the Electric Utility is $6.5 million. The variance of Net Income to the Year-to-Date (YTD) seasonally shaped budget is favorable by $2.1 million. This would be more but for the $15.7 million accounting loss on defeasance of debt recorded in June. Excluding the defeasance loss, net income has a $17.8 million favorable variance. The variance detail compared to budget is as follows (unfavorable)/favorable: Millions
• Retail Revenue $ 3.9 • Wholesale and Other revenue 11.9 • Purchased Power (2.7) • Non-power Operating Expenses 1.9 • Other Non-operating revenues 2.2 • Other Non-operating expenses (15.1)
$ 2.1
For comparability purposes, the budget has been modified to reflect seasonal fluctuations in revenue, purchased power and wheeling.
Electric Operating Revenues The positive budget variance in Residential revenue is a result of colder than anticipated weather during the first quarter of the year. Year-to-date, Sales for resale and other income has a favorable variance of $11.9 million. Early 2017 stream flows were strong and hydro-generation exceeded expected volumes. In addition, a planned outage at Carmen-Smith was delayed until 2018, further contributing to the amounts available for sale in wholesale markets. Electric Operating Expenses Purchased Power has a $2.7 million unfavorable variance due to portfolio balancing activities and is offset by favorable wholesale sales variance. System Control has a favorable variance of $453,000 primarily related to labor savings in the power trading and pricing & portfolio management
$0
$5,000
$10,000
$15,000
$20,000
$25,000
Jan Feb Mar April May June July Aug Sept
Electric System Net Income2017 YTD (in thousands)
ACTUALS BUDGET ACTUALS WITHOUT LOSS ON DEFEASANCE

3
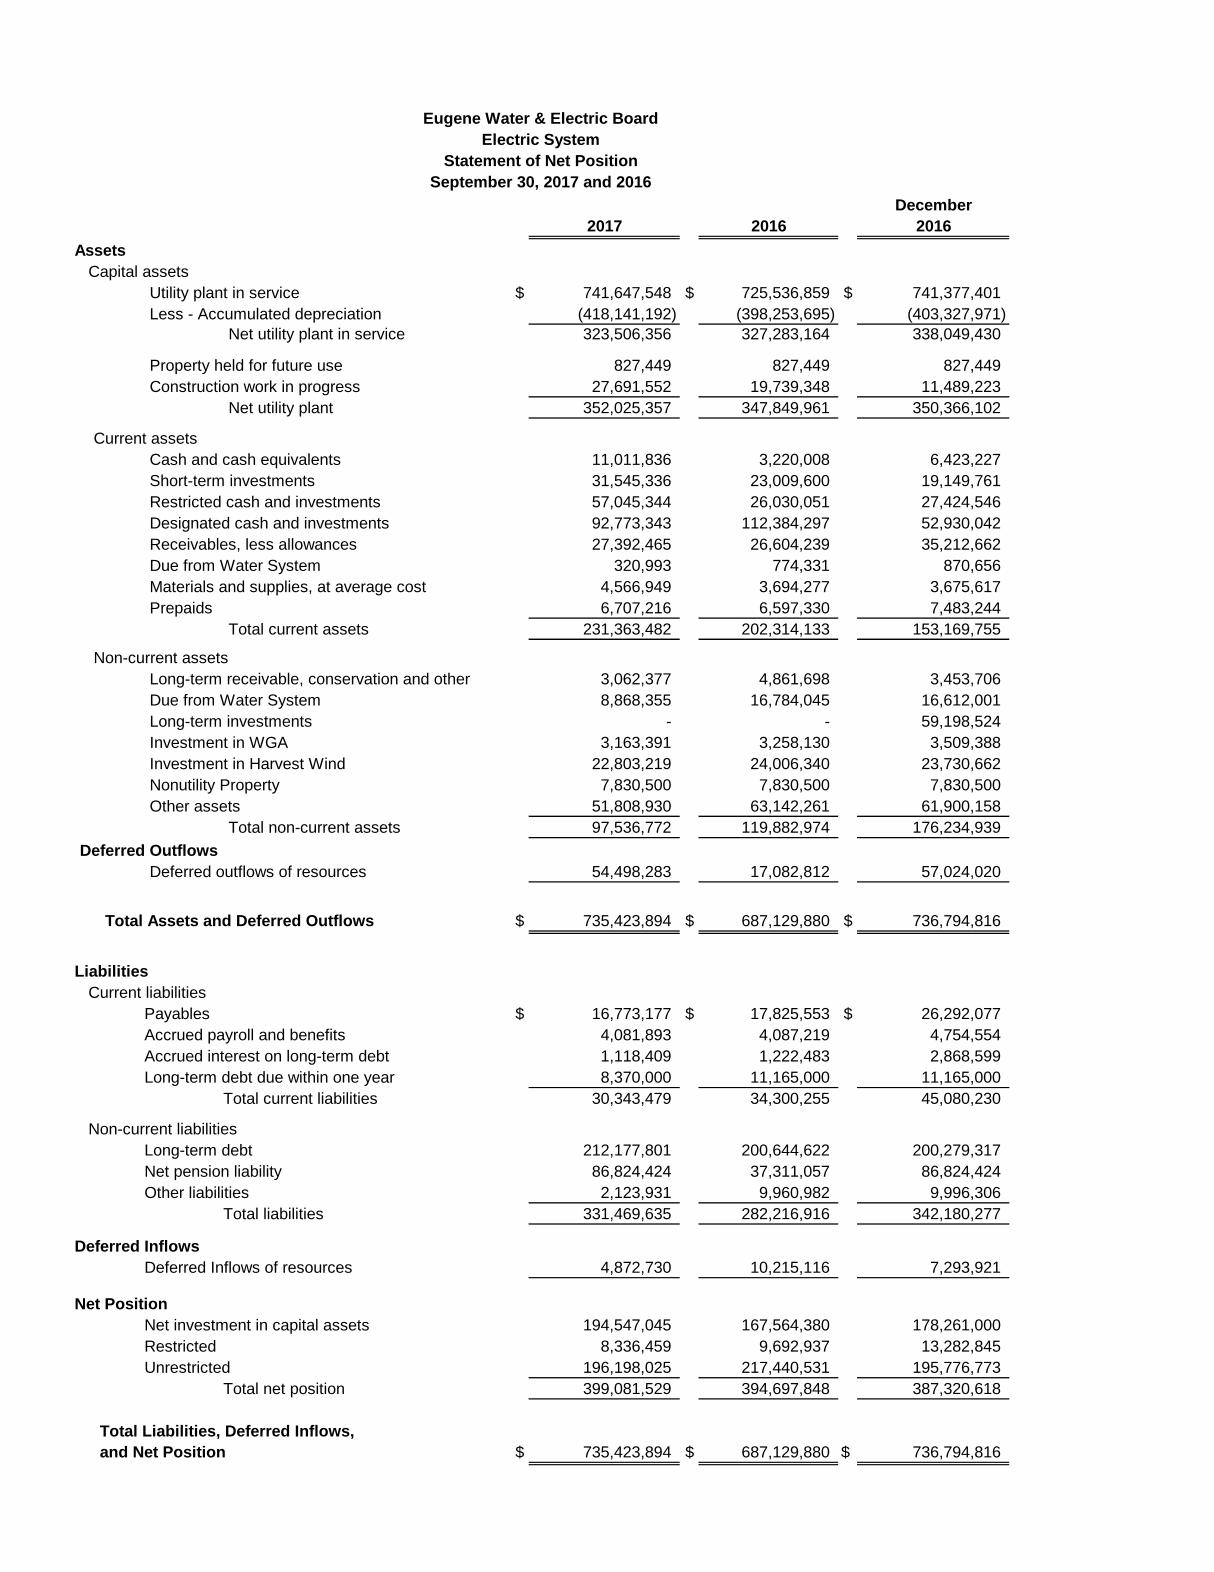
departments. Wheeling has an unfavorable variance of $696,000 due to additional BPA transmission costs associated with favorable hydro generation and unbudgeted amortization of prepaid Harvest Wind transmission. The variance of $497,000 to budget in Generation is fuel savings as a result of EWEB electing not to take its share of IP generation when wholesale prices were low. Administrative and general expenses include year-to-date budgeted contingency funds of $1.9 million which mask an unfavorable variance. The primary drivers of this variance are $762,000 of turnover savings and $1 million of PERS savings which are realized in other expense categories, for example System Control. Conservation expenses are favorable due to low spending year-to-date for energy management services. Non-operating Revenues Investment earnings have an unfavorable variance due to the mark-to-market adjustment on derivatives. This is a non-cash transaction and required by generally accepted accounting principles (GAAP). There is no budget for the change in the market value for these investments. In June, the Water Utility repaid intercompany debt of $11 million to the Electric Utility which resulted in a $3 million favorable variance for Interest Earnings, Water. Other Non-operating Expenses The significant variance in Other expenses is caused by a $15.7 million accounting loss on defeasance of debt. The Electric Utility used repayment proceeds from the Water Utility, along with other cash reserves to defease high interest debt. The loss is a result of the accounting treatment required when future debt principal and interest obligations are paid. The defeasance allowed the new master bond resolution to take effect and accordingly, this loss will not be included in the debt service coverage calculation. Since this loss was not anticipated in the 2017 budget, the Board will be requested to approve a budget amendment in December. Interest expense and related amortization has an unfavorable variance to budget. At the time the 2017 budget was created, the new amortization schedules related to the 2016 electric bond refunding were not finalized. Contributions in Aid of Construction (CIA) CIA is significantly higher than year-to-date budget due to $1.9 million of CIA collected in 2016 being recorded in 2017 when the capital work was performed as required by GAAP. Electric Statement of Net Position (Balance Sheet) - Appendix B, page 2 Utility Plant in Service is only slightly higher than December 2016 due to a year-end reclassification required by GAAP. The reclassification moves construction work in progress to utility plant in service for work orders where the asset is substantially complete and the work order hasn’t been closed. Accounting and Operations anticipate further increases as more work orders are closed in the fourth quarter. Due from Water System decreased by $8 million as a result of the $11 million repayment mentioned in the Non-operating Revenues section.

4
Long Term Debt has had a net increase of $9 million since the start of the year due to the defeasance of high interest bonds in June and issuance of new lower interest bonds in September. Water Utility Water Schedule of Revenues, Expenses, and Changes in Net Position (Income Statement) - Appendix C, page 1 Water Income before capital contributions (Net Income) Net income for the Water Utility as of September 30, 2017 is $7.25 million and is unfavorable to the seasonally shaped budget by $1.69 million primarily due to Water’s repayment of intercompany debt to the Electric Utility in June 2017. Ignoring the $3 million recognized as interest expense, there would be a favorable $1.3 million variance. The variance from budget breakdown is as follows (unfavorable)/favorable:
Thousands Retail Revenue $ 311 Wholesale and Other Revenue 216 Operating Expenses 504 Non-Operating Revenues 187 Non-Operating Expenses (2,907) $ (1,689)
The comparison of net income to annual budget before capital contributions in the chart below is seasonally shaped. Within the Water Utility, revenue and consumption peak in the summer. Construction and maintenance activities peak in the summer, as well, while production and delivery costs remain fairly constant throughout the year. The drop in June is attributable to the payment of intercompany debt mentioned above.
Water Operating Revenues For purposes of analysis, the revenue budget has been modified to reflect seasonal fluctuations. Residential and Commercial and industrial sales to water customers are collectively in line with the YTD seasonally-shaped budget. Sales for resale and other includes sales to Water Districts, Willamette Water Company, as well as sales to the City of Veneta. Other operating revenue includes
$0
$2,000
$4,000
$6,000
$8,000
$10,000
$12,000
JAN FEB MAR APR MAY JUN JUL AUG SEP
Water System Net Income2017 YTD (in thousands)
ACTUAL BUDGET ACTUAL WITHOUT DEBT REPAYMENT

5
revenues from customer account related fees and reimbursements for billable work. Water Operating Expenses Operating expenses remain favorable and are 97% of the year-to-date budget. Transmission and distribution is below budget by $1.15 million due in part to the inclusion of the Water Utility’s contingency funds, which have not yet been allocated for spending and year-to-date contribute $353 thousand to the favorable budget variance. Labor activity also contributes $559 thousand to this positive variance, which is driven by position vacancies. Administration and general expenses are over budget by $773 thousand. Budgeted amounts for turnover ($191 thousand) and PERS savings ($279 thousand) are driving this variance. Turnover savings have been realized primarily in the Transmission and distribution category.
Water Contributed plant assets include $755 thousand contributed for five completed subdivisions. System Development Charges stem from construction activity and are corollary to contributed assets and contributions in aid.
Water Statement of Net Position (Balance Sheet) - Appendix C, page 2 The Water Utility transferred $11 million to the Electric Utility in June as payment on intercompany debt. Amounts Due to Electric decreased $8 million on the balance sheet and $3 million is recognized as Interest Expense, Electric on the income statement.
EWEB Looking forward For the 2018 budget, the organization has identified approximately $11.5 million in ongoing savings. Labor savings is expected to be $5.8 million overall. Additional savings include $3.8 million in combined debt service due to debt defeasance, $1 million reduction in Electric contingency, and $900,000 in additional O&M savings. These savings are expected to be offset by upticks including, CPI increase assumptions, promotions, new borrowing and other increases yielding a net savings of $6.0 million. Budget continues to work with management and staff to look for efficiencies and cost savings.
$- $1,000 $2,000 $3,000 $4,000 $5,000 $6,000
Depreciation on utility plant
Administrative and general
Conservation expenses
Customer accounting
Transmission and distribution
Source, pumping, and purification
Water System Operating Expenses2017 YTD (in thousands)
2017 2017 BUDGET

1
Non-Labor Operations & Maintenance Departments
1. The favorable customer service variance is primarily driven by seasonality in both conservation incentives and low income assistance. Energy
management anticipates increased conservation incentive spending in the fourth quarter and low income assistance increases in the winter months.
2. Electric is forecasting an unfavorable variance attributed to the cleanup and repair efforts from the December 2016 and first quarter 2017 storm
activity. This is offset by savings in Facilities related to changes in planned maintenance.
3. Energy has a large favorable variance. The variance is largely due to MGP work that has been deferred to 2018. MGP work is partially reimbursed.
Excluding the deferred MGP work, Energy has a negative variance driven primarily by Leaburg Rollgate litigation.
4. Information Services has an unfavorable variance to budget that is partially due to timing factors with annual licensing and maintenance agreement
expenditures, which are expected to track back to budget by end of year for these unamortized renewals. The end of year anticipated unfavorable
variance is due to emergent expenses related to Emergency SAN Replacement, DVMS (Video recording), and Logging & Event Management
Replacement additional Oracle expense, contract labor, and O&M project services and training. Information Services anticipates any remaining
unfavorable variance in non-labor will be offset from favorable variances in labor.
5. Water Operations has a large favorable variance to budget, which is, in part, related to the move of budget from Facilities (dept. 384) to the new
department for Source Protection (dept. 378). After backing out this amount, Water Operations expect to have a favorable variance of $163,000
due to reduced pump maintenance costs and lower residential ATA program costs.
Appendix A

Annual Working9/30/2017 9/30/2016 Budget Budget $ Budget % Budget Variance
Residential $ 75,345,372 $ 67,442,414 $ 101,465,141 $ 72,527,000 1 104% $ 2,818,000Commercial and industrial 77,040,315 74,892,813 101,684,339 75,918,000 1 101% 1,122,000Sale for resale and other 37,709,687 39,955,977 33,670,894 25,767,000 1 146% 11,943,000
Operating revenues 190,095,374 182,291,204 236,820,374 174,212,000 109% 15,883,000
Purchased power 87,303,205 88,900,470 112,087,636 84,581,000 2 103% (2,722,000)System control 3,672,336 4,417,306 5,499,497 4,125,000 89% 453,000Wheeling 10,517,883 9,260,453 13,429,919 9,822,000 1 107% (696,000)Generation 8,395,359 8,660,124 11,855,489 8,892,000 94% 497,000Transmission and distribution 16,116,525 15,122,986 22,223,975 16,668,000 97% 551,000Customer accounting 6,245,083 5,817,286 8,087,026 6,065,000 103% (180,000)Conservation expenses 2,747,876 3,113,688 4,970,472 3,728,000 74% 980,000Administrative and general 17,117,318 15,805,281 22,947,555 17,211,000 99% 94,000Depreciation on utility plant 16,707,154 18,043,035 22,519,483 16,890,000 99% 183,000
Operating expenses 168,822,739 169,140,629 223,621,052 167,982,000 101% (840,000)Net Operating Income 21,272,635 13,150,575 13,199,322 6,230,000 341% 15,043,000
Investment earnings 945,041 3,047,855 2,028,478 1,521,000 62% (576,000)Interest earnings, Water 3,461,171 796,457 737,405 553,000 626% 2,908,000Other non-operating revenue 2,341,377 7,799,155 3,325,150 2,494,000 94% (153,000)
Non-operating Revenues 6,747,589 11,643,467 6,091,033 4,568,000 148% 2,179,000
Other expenses 16,441,563 2,190,298 2,025,935 1,519,000 1082% (14,923,000)Interest expense and related amortization 5,046,998 7,619,474 6,518,766 4,889,000 103% (158,000)
Other Non-operating Expenses 21,488,561 9,809,772 8,544,701 6,408,000 335% (15,081,000)
Income before capital contributions 6,531,663 14,984,270 10,745,654 4,390,000 149% 2,142,000
Contributions in aid of construction 4,008,931 6,620,660 3,219,000 2,414,000 166% 1,595,000Contributed plant assets 1,220,317 695,137 - - 1,220,000
Increase in Net Position $ 11,760,911 $ 22,300,067 $ 13,964,654 $ 6,804,000 173% $ 4,957,000
Notes to the Financial Statements:1 Seasonal budget figure based on PPM forecast used for budgeting.2 Seasonal budget figure based on cyclical account activity averaged from the past four years.Unmarked seasonal budget figures are not shaped and are allocated using a straight-line methodBudget variance column may not add up due to rounding.
Prior Year Comparison
Eugene Water & Electric Board
Schedule of Revenues, Expenses, and Changes in Net Position for the nine months ended September 30, 2017
Electric Utility
YTD Budget Comparison
December2017 2016 2016
AssetsCapital assets
Utility plant in service $ 741,647,548 $ 725,536,859 $ 741,377,401 Less - Accumulated depreciation (418,141,192) (398,253,695) (403,327,971)
Net utility plant in service 323,506,356 327,283,164 338,049,430
Property held for future use 827,449 827,449 827,449 Construction work in progress 27,691,552 19,739,348 11,489,223
Net utility plant 352,025,357 347,849,961 350,366,102
Current assetsCash and cash equivalents 11,011,836 3,220,008 6,423,227 Short-term investments 31,545,336 23,009,600 19,149,761 Restricted cash and investments 57,045,344 26,030,051 27,424,546 Designated cash and investments 92,773,343 112,384,297 52,930,042 Receivables, less allowances 27,392,465 26,604,239 35,212,662 Due from Water System 320,993 774,331 870,656 Materials and supplies, at average cost 4,566,949 3,694,277 3,675,617 Prepaids 6,707,216 6,597,330 7,483,244
Total current assets 231,363,482 202,314,133 153,169,755
Non-current assetsLong-term receivable, conservation and other 3,062,377 4,861,698 3,453,706 Due from Water System 8,868,355 16,784,045 16,612,001 Long-term investments - - 59,198,524 Investment in WGA 3,163,391 3,258,130 3,509,388 Investment in Harvest Wind 22,803,219 24,006,340 23,730,662 Nonutility Property 7,830,500 7,830,500 7,830,500 Other assets 51,808,930 63,142,261 61,900,158
Total non-current assets 97,536,772 119,882,974 176,234,939 Deferred Outflows
Deferred outflows of resources 54,498,283 17,082,812 57,024,020
Total Assets and Deferred Outflows $ 735,423,894 $ 687,129,880 $ 736,794,816
Liabilities Current liabilities
Payables $ 16,773,177 $ 17,825,553 $ 26,292,077 Accrued payroll and benefits 4,081,893 4,087,219 4,754,554 Accrued interest on long-term debt 1,118,409 1,222,483 2,868,599 Long-term debt due within one year 8,370,000 11,165,000 11,165,000
Total current liabilities 30,343,479 34,300,255 45,080,230
Non-current liabilitiesLong-term debt 212,177,801 200,644,622 200,279,317 Net pension liability 86,824,424 37,311,057 86,824,424 Other liabilities 2,123,931 9,960,982 9,996,306
Total liabilities 331,469,635 282,216,916 342,180,277
Deferred InflowsDeferred Inflows of resources 4,872,730 10,215,116 7,293,921
Net PositionNet investment in capital assets 194,547,045 167,564,380 178,261,000 Restricted 8,336,459 9,692,937 13,282,845 Unrestricted 196,198,025 217,440,531 195,776,773
Total net position 399,081,529 394,697,848 387,320,618
Total Liabilities, Deferred Inflows,and Net Position $ 735,423,894 $ 687,129,880 $ 736,794,816
Eugene Water & Electric BoardElectric System
Statement of Net PositionSeptember 30, 2017 and 2016

Eugene Water & Electric BoardElectric Utility
Capital Budget Comparison for the nine months ended September 30, 2017
AnnualWorking
Current Month Year to DateBudget
w/Amendment% of
Budget
Transformers (Pre-capped) 1 $ 106,294 906,752$ -$ 0.0%Network Protectors (Pre-capped) 1 407,240 692,308 - 0.0%Meters (Pre-capped) 1 144,160.0 275,773 - 0.0%Type 1 Capital
2016-2017 ICS Events (6,176) 83,024 - 0.0%Buildings & Land 117,059 284,086 1,074,000 26.5%
1 Distribution 454,473 5,393,454 6,915,000 78.0%Electric Fleet 70,994 139,167 500,000 27.8%Generation 110,341 795,603 1,196,000 66.5%Information Technology 25,327 746,568 562,000 132.8%Substation 235,036 984,891 1,780,000 55.3%Telecom 15,628 150,112 250,000 60.0%Transmission 18,242 235,245 150,000 156.8%
Total Type 1 Capital 1,040,924 8,812,150 12,427,000 70.9%
Type 2 Capital1 AMI 7,873 1,731,862 1,650,000 105.0%
CIS Replacement - - 1,230,000 0.0%Downtown Network 14,277 188,597 1,000,000 18.9%Electric Master Plan 883 2,641 1,425,000 0.2%Grid Edge Demonstration Project - - 837,000 0.0%Holden Creek Substation 396,808 2,037,262 4,457,000 45.7%Leaburg Dam Rollgates 950 57,810 - 0.0%LTD West Side EMX - (5,101) - 0.0%Telecom Type 2 Projects 311 70,556 600,000 11.8%Up River Re-configuration - - - 0.0%
Total Type 2 Capital 421,102 4,083,627 11,199,000 36.5%
Type 3 CapitalCarmen-Smith Re-license 438,975 3,835,554 11,700,000 32.8%
Total Type 3 Capital 438,975 3,835,554 11,700,000 32.8%
Total Capital before CIA 2,558,695 18,606,164 35,326,000 52.7%
Contribution in aid (68,949) (4,008,931) (3,219,000) 124.5%
Grand Total $ 2,489,746 14,597,233 $ 32,107,000 45.5%
1 Meters, transformers and network protectors are capitalized at the time of purchase. The budget for meters is included within the Distribution project and the AMI project. However, the actual costs are not included in project reporting in WAM and are included as their own line item.
CapitalThe capital budget is approved by the Board as the maximum amount allowed for all capital work. Annual budgets by type and by individual projects are prepared for planning and reporting purposes, but overall budget accountability to the Board remains at the total capital level. This Capital Budget Comparison includes overhead applied at the sub-project level, rather than underlying capital work orders. Overhead is applied to underlying capital work orders once they have closed. The Electric Utility has spent $35.3 million or 52.7% of the capital budget, compared to $39.4 million or 43.2% in year to date 2016.

YTD December Performance 2017 Status 2016 Standard
Current Ratio 7.62 4.71 3.250x
Debt as % of Net Book Value 68% 63% ≤ 60%
Debt Service Coverage - Annualized 3.60 1.64 1.75 to 2.0x
Age of System - Overall 56% 54% < 60%Distribution Plant 62%Electric Generating Plant 55%
Days Unrestricted Cash 242 241 >150 days
Rate of Return - Annualized 9% 5% Range 5-7%
See next page for Ratio definitions and benchmark sources
The current ratio remains well above Board targets due to balances in restricted and designated cash remaining classified as short term. Debt as a % of Net Book Value measures the overall leverage of system assets. As of 9/30/17, this metric is outside the performance standard due to the issuance of new debt in September. However, this metric should improve over time as the bond proceeds are spent on plant assets and annual principal payments are made. Debt coverage is higher than the 2017 budget due to the defeasance of debt in June. The debt service coverage ratio as of December 2016 was below the performance standard due to December storm costs and the Carmen-Smith write-off. As of December 2016, the age of the distribution plant system was outside the performance standard. Monitoring this metric is new and the detailed information presented for informational purposes will continue to be refined through discussions with management and engineering. Days Unrestricted Cash continues to remain well above the performance standard and may change after considering highest and best use of cash related to PERS in the fall. Favorable retail and wholesale sales variances continue to drive the rate of return higher than the expected range.
Ratios
Electric SystemFinancial Ratios
September 30, 2017

Current Ratio
Debt as % of Net Book Value (NBV)
Debt Service Coverage
Age of System
Days Unrestricted Cash
Rate of ReturnRate of return on investment, expressed as a percentage of the total amount invested in infrastructure. For mid-year calculations, year-to-date net operating income is annualized. This ratio measures the utility's ability to pay current infrastructure costs and future replacement costs. Per the APPA, a rate of return between 5-7% is an acceptable range.
Total current assets to total current liabilities. This ratio measures the utility's short-term liquidity (ability to pay bills). The standard is set by EWEB financial policies and is meant to support a higher than average credit rating. Long term investments are included in the calculation since they are highly marketable and could be liquidated if the need arose.
Ratio of the amount of debt outstanding against the remaining Net Book Value of assets. This metric measures overall leverage of the system in an effort to align debt service payments with the useful lives of assets. The performance standard of 60% is derived from APPA publications and is typical of electric utilities involved in both generation and distribution.
Ratio of annualized net revenues available for debt service to total long-term debt service for the year. This ratio measures the utility's ability to meet its annual long-term debt obligation. The standard is meant to support a single A credit rating.
Ratio of accumulated depreciation against the historical value of assets. This ratio measures how old the system is as compared to how much has been depreciated. Infrastructure over 65% depreciated should be watched for aging, while infrastructure less than 50% depreciated is representative of newer systems.
Ratio of total unrestricted cash and cash equivalents to average daily cash requirements for operating expenses (defined as yearly budgeted operating expenses net of depreciation divided by 365 days in the year). This figure measures the length of time the utility can carry on normal operations with available unrestricted cash not otherwise designated for future capital needs. Standard and Poor's Industry Standards for Investment Grade ratings are typically 60 to 90 days, however the APPA has indicated 150-200 days unrestricted cash is desired for high bond ratings. Long term investments are included in the calculation since they are highly marketable and could be liquidated if the need arose.

Electric Utility Sales in MWhSeptember 2017
Total Electric Utility Sales in MWhBudget
2015 2016 2017 2017
January 226,208 232,720 263,514 242,322February 191,281 197,213 212,299 206,295March 195,492 203,425 212,765 212,180
Q1 total 612,981 633,357 688,578 660,797
April 185,698 175,157 192,317 189,381May 174,491 175,703 184,183 181,628June 178,629 172,650 175,832 173,101
Q2 total 538,818 523,510 552,333 544,109
July 190,535 178,658 187,351 181,720August 181,414 186,064 193,979 182,280September 173,902 173,917 184,069 171,925
Q3 total 545,851 538,639 565,399 535,926
October 170,136 161,121 0 180,648November 215,218 191,617 0 207,116December 221,322 239,812 0 246,176
Q4 total 606,676 592,550 0 633,940
Annual total 2,304,326 2,288,057 1,806,310 2,374,772
Residential Sales in MWhBudget
2015 2016 2017 2017
January 107,136 113,589 140,471 119,472February 79,168 80,958 101,102 95,404March 81,006 88,256 89,865 90,902
267,310 282,803 331,439 305,778
April 69,023 61,190 70,920 72,327May 55,898 57,055 66,270 61,890June 60,721 56,918 55,295 57,821
185,642 175,163 192,485 192,038
July 63,866 54,329 59,509 59,276August 57,890 64,718 65,473 59,698September 57,313 56,523 60,114 55,814
179,069 175,570 185,096 174,788
October 58,717 62,095 0 66,986November 84,028 76,508 0 88,101December 118,236 115,600 0 123,416
260,981 254,203 0 278,503
Total 893,002 887,738 709,019 951,106
140,000
160,000
180,000
200,000
220,000
240,000
260,000
280,000
Janu
ary
Febr
uary
Mar
ch
April
May
June July
Augu
st
Sept
embe
r
Oct
ober
Nov
embe
r
Dec
embe
r
MW
hMonth
Total Sales2015
2016
2017
Budget 2017
50000
60000
70000
80000
90000
100000
110000
120000
130000
140000
150000
Janu
ary
Febr
uary
Mar
ch
April
May
June
July
Augu
st
Sept
embe
r
Oct
ober
Nov
embe
r
Dec
embe
r
MW
h
Month
Residential Sales2015
2016
2017
Budget 2017

Electric Utility Sales in MWhSeptember 2017
General Service & Large Industrial Sales in MWhBudget
2015 2016 2017 2017
January 117,866 117,905 121,636 121,863February 111,091 114,969 110,038 110,094March 113,463 114,088 121,755 120,455
342,420 346,962 353,429 352,412
April 116,038 112,987 120,325 116,340May 117,742 117,677 117,010 119,103June 117,015 114,827 119,584 114,620
350,795 345,491 356,920 350,063
July 125,672 123,364 126,813 121,718August 122,673 120,117 127,265 121,652September 115,459 116,236 122,786 115,245
363,804 359,717 376,863 358,615
October 110,229 97,802 0 112,698November 130,010 114,712 0 118,066December 101,752 123,126 0 121,635
341,991 335,640 0 352,399
Total 1,399,010 1,387,810 1,087,212 1,413,489
Total Wholesale Sales in MWhBudget
2015 2016 2017 2017
January 166,562 91,229 150,213 110,440February 192,878 119,306 182,911 99,184March 216,315 200,903 213,771 113,334
575,755 411,438 546,895 322,958
April 133,635 251,173 204,220 161,920May 171,384 233,001 219,982 176,984June 130,835 197,619 228,488 176,320
435,854 681,793 652,689 515,224
July 136,993 164,635 207,203 152,104August 116,194 120,758 145,482 123,912September 126,384 110,175 115,187 114,240
379,571 395,568 467,872 390,256
October 93,491 128,793 0 76,632November 94,117 128,802 0 80,031December 109,166 129,274 0 81,840
296,774 386,869 0 238,503
Total 1,687,954 1,875,668 1,667,456 1,466,941
90000
95000
100000
105000
110000
115000
120000
125000
130000
135000
140000
Janu
ary
Febr
uary
Mar
ch
April
May
June July
Augu
st
Sept
embe
r
Oct
ober
Nov
embe
r
Dec
embe
r
MW
hMonth
General Service & Large Industrial Sales2015
2016
2017
Budget 2017
70,000
90,000
110,000
130,000
150,000
170,000
190,000
210,000
230,000
250,000
270,000
Janu
ary
Febr
uary
Mar
ch
April
May
June July
Augu
st
Sept
embe
r
Oct
ober
Nov
embe
r
Dec
embe
r
MW
h
Month
Wholesale Sales2015
2016
2017
Budget 2017
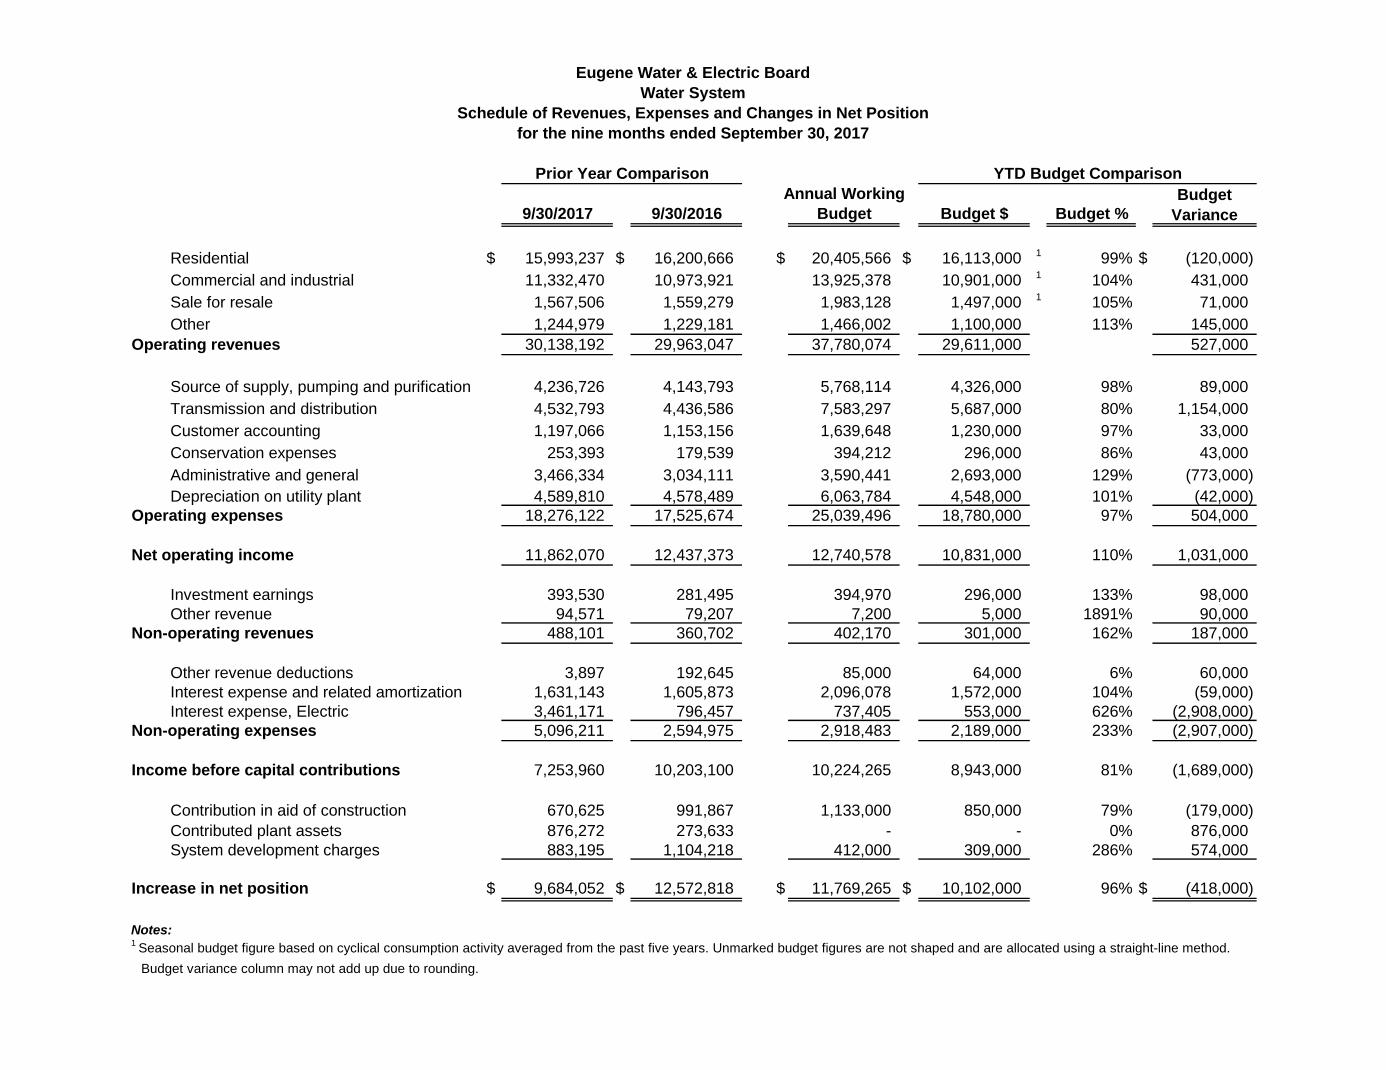
Annual Working9/30/2017 9/30/2016 Budget Budget $ Budget %
Residential $ 15,993,237 $ 16,200,666 $ 20,405,566 $ 16,113,000 1 99% $ (120,000)Commercial and industrial 11,332,470 10,973,921 13,925,378 10,901,000 1 104% 431,000Sale for resale 1,567,506 1,559,279 1,983,128 1,497,000 1 105% 71,000Other 1,244,979 1,229,181 1,466,002 1,100,000 113% 145,000
Operating revenues 30,138,192 29,963,047 37,780,074 29,611,000 527,000
Source of supply, pumping and purification 4,236,726 4,143,793 5,768,114 4,326,000 98% 89,000Transmission and distribution 4,532,793 4,436,586 7,583,297 5,687,000 80% 1,154,000Customer accounting 1,197,066 1,153,156 1,639,648 1,230,000 97% 33,000Conservation expenses 253,393 179,539 394,212 296,000 86% 43,000Administrative and general 3,466,334 3,034,111 3,590,441 2,693,000 129% (773,000)Depreciation on utility plant 4,589,810 4,578,489 6,063,784 4,548,000 101% (42,000)
Operating expenses 18,276,122 17,525,674 25,039,496 18,780,000 97% 504,000
Net operating income 11,862,070 12,437,373 12,740,578 10,831,000 110% 1,031,000
Investment earnings 393,530 281,495 394,970 296,000 133% 98,000Other revenue 94,571 79,207 7,200 5,000 1891% 90,000
Non-operating revenues 488,101 360,702 402,170 301,000 162% 187,000
Other revenue deductions 3,897 192,645 85,000 64,000 6% 60,000Interest expense and related amortization 1,631,143 1,605,873 2,096,078 1,572,000 104% (59,000)Interest expense, Electric 3,461,171 796,457 737,405 553,000 626% (2,908,000)
Non-operating expenses 5,096,211 2,594,975 2,918,483 2,189,000 233% (2,907,000)
Income before capital contributions 7,253,960 10,203,100 10,224,265 8,943,000 81% (1,689,000)
Contribution in aid of construction 670,625 991,867 1,133,000 850,000 79% (179,000)Contributed plant assets 876,272 273,633 - - 0% 876,000System development charges 883,195 1,104,218 412,000 309,000 286% 574,000
Increase in net position $ 9,684,052 $ 12,572,818 $ 11,769,265 $ 10,102,000 96% $ (418,000)
Notes:1 Seasonal budget figure based on cyclical consumption activity averaged from the past five years. Unmarked budget figures are not shaped and are allocated using a straight-line method.
Budget variance column may not add up due to rounding.
Budget Variance
Eugene Water & Electric BoardWater System
Schedule of Revenues, Expenses and Changes in Net Positionfor the nine months ended September 30, 2017
Prior Year Comparison YTD Budget Comparison

December2017 2016 2016
AssetsCapital assets
Utility plant in service $ 271,443,167 $ 255,900,680 $ 267,601,807 Less - Accumulated depreciation (115,794,718) (110,183,778) (111,343,682)
Net utility plant in service 155,648,449 145,716,902 156,258,125 Property held for future use 2,396,812 1,174,768 1,184,434 Construction work in progress 7,303,676 12,540,544 3,063,265
Net Utility Plant 165,348,937 159,432,214 160,505,824
Current assetsCash and cash equivalents 7,370,118 4,812,682 4,740,905 Short-term investments - - 845,370 Restricted cash and investments 16,740,964 19,017,034 19,562,392 Designated cash and investments 21,197,743 26,166,941 14,959,703 Receivables, less allowances 4,669,413 4,519,715 3,298,133 Material and supplies, at average cost 798,679 850,163 900,944 Prepayments and special deposits 1,323,231 1,369,462 1,254,709
Total current assets 52,100,148 56,735,997 45,562,156
Non-current assetsLong-term investments - designated - - 12,286,276 Long-term investments - unrestricted - - 1,269,344 Long-term receivables, conservation and other 124,716 157,718 157,206 Other assets 4,093,566 2,279,461 4,124,167
Total non-current assets 4,218,282 2,437,179 17,836,993
Deferred Outflows of ResourcesDeferred Outflows of Resources 11,412,827 3,689,086 11,561,575
Total Assets & Deferred Outflows $ 233,080,194 $ 222,294,476 $ 235,466,548
Current liabilities
Payables $ 262,688 $ 587,259 $ 1,201,768 Accrued payroll and benefits 972,161 1,016,124 1,094,980 Accrued interest on long-term debt 380,375 386,508 966,271 Long-term debt due within one year 2,160,000 1,840,000 1,840,000 Due to Electric System 320,886 774,331 870,656
Total current liabilities 4,096,110 4,604,222 5,973,675
Non-current liabilitiesLong term debt-bonds payable 56,835,772 59,405,314 59,273,233 Due to Electric System 8,868,355 16,784,045 16,612,001 Net pension liability 19,059,020 8,190,233 19,059,020 Other liabilities 255,751 263,647 267,484
Total liabilities 89,115,008 89,247,461 101,185,413
Deferred Inflows of ResourcesDeferred inflows of resources 1,009,432 1,929,745 1,009,432
Net PositionNet invested in capital assets 108,736,669 95,324,507 97,536,117 Restricted 7,044,149 6,676,573 7,368,976 Unrestricted 27,174,936 29,116,190 28,366,610
Total net position 142,955,754 131,117,270 133,271,703
Total Liabilities, Deferred Inflows & Net Position $ 233,080,194 $ 222,294,476 $ 235,466,548
Eugene Water & Electric BoardWater System
Statement of Net PositionSeptember 30, 2017
Liabilities

Eugene Water & Electric BoardWater System
Capital Budget Comparisonfor the nine months ended September 30, 2017
AnnualWorking % of
Current Month Year-to-Date Budget Budget
Meters (Pre-capped) 1 84,426$ 357,599$ -$ 0.0%Type 1 Capital
Buildings & Land 29,508 55,876 248,000 22.5%Distribution Facilities 46,676 417,500 1,339,000 31.2%Distribution Pipe & Services 1 407,799 4,581,513 6,181,001 74.1%Information Technology 3,958 162,280 123,355 131.6%Source Of Supply 23,512 577,371 1,029,999 56.1%Water Fleet - 104,726 110,000 95.2%
Total Type 1 Capital 511,453 5,899,266 9,031,355 65.3%
Type 2 CapitalAMI 1 1,041 379,477 280,000 135.5%CIS - - 270,000 0.0%Distribution Facilities 22,886 217,586 712,000 30.6%Distribution Pipe & Services 5,019 27,882 - 0.0%Source Of Supply 13,266 221,857 2,245,000 9.9%
Total Type 2 Capital 42,212 846,802 3,507,000 24.1%
Type 3 CapitalSource Of Supply (63,917) 1,602,973 1,830,000 87.6%
Total Type 3 Capital (63,917) 1,602,973 1,830,000 87.6%
Total Capital before CIA 574,174 8,706,640 14,368,355 60.6%
Contributions in aid (41,495) (670,626) (1,133,000) 59.2%
Grand Total $ 532,679 $ 8,036,014 $ 13,235,355 60.7%
1
Capital
Meters are capitalized at the time of purchase. The budget for meters is included within the Distribution Pipe and Services project and the AMI project. However, the actual costs are not included in project reporting in WAM and are included as their own line item.
The capital budget is approved by the Board as the maximum amount allowable for all capital work. Annual budgets by type and by individual project are prepared for planning and reporting purposes, but overall budget accountability to the Board remains at the total capital spending level. This Capital Budget Comparison includes overhead applied at the sub-project level, rather than underlying capital work orders. Overhead is applied to underlying capital work orders once they have closed. Information by project is provided in the quarterly EL1 report.
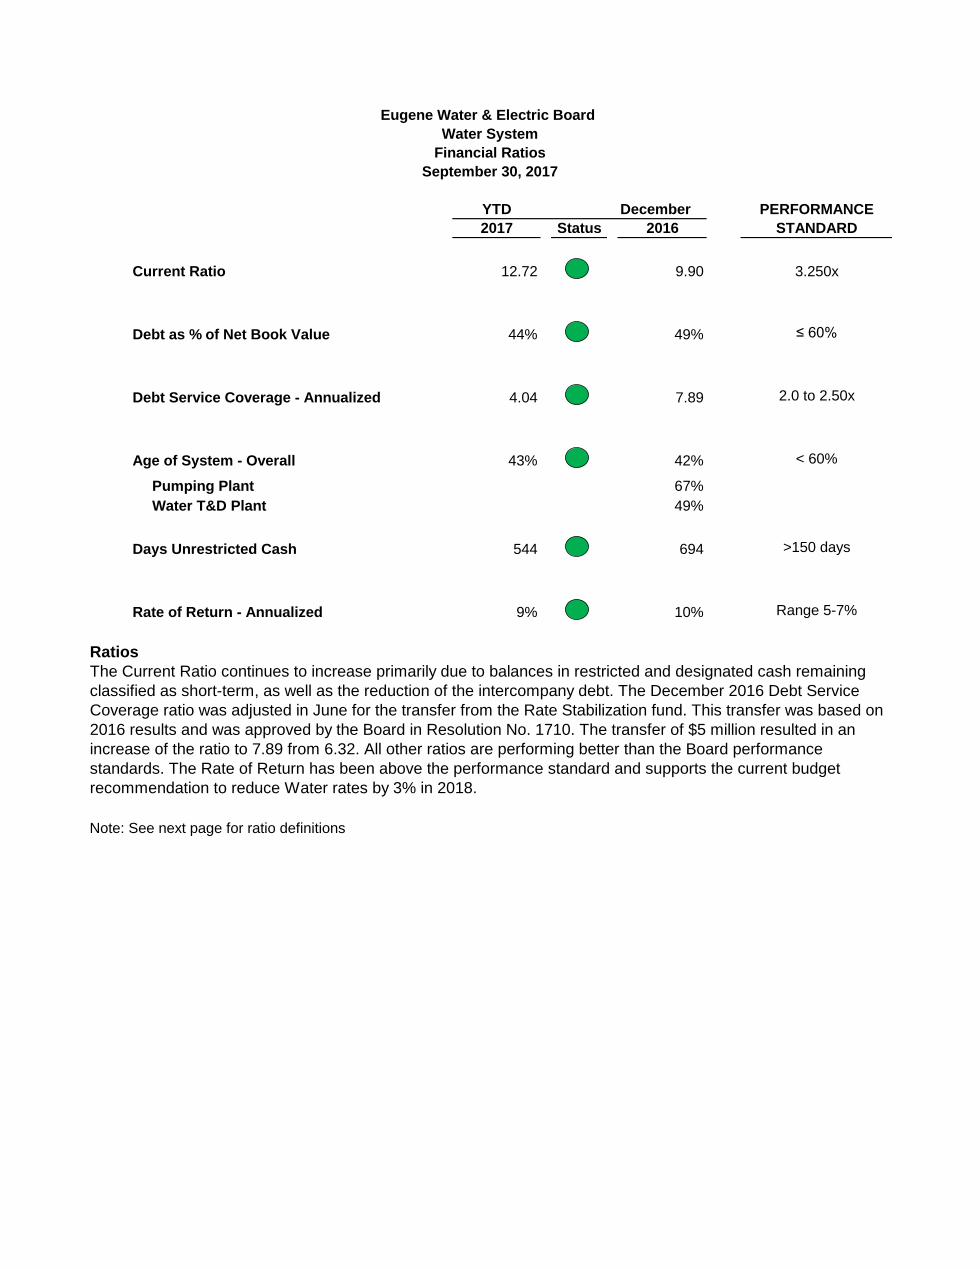
YTD December PERFORMANCE2017 Status 2016 STANDARD
Current Ratio 12.72 9.90 3.250x
Debt as % of Net Book Value 44% 49% ≤ 60%
Debt Service Coverage - Annualized 4.04 7.89 2.0 to 2.50x
Age of System - Overall 43% 42% < 60%
Pumping Plant 67%Water T&D Plant 49%
Days Unrestricted Cash 544 694 >150 days
Rate of Return - Annualized 9% 10% Range 5-7%
Ratios
Note: See next page for ratio definitions
Eugene Water & Electric Board Water System
Financial RatiosSeptember 30, 2017
The Current Ratio continues to increase primarily due to balances in restricted and designated cash remaining classified as short-term, as well as the reduction of the intercompany debt. The December 2016 Debt Service Coverage ratio was adjusted in June for the transfer from the Rate Stabilization fund. This transfer was based on 2016 results and was approved by the Board in Resolution No. 1710. The transfer of $5 million resulted in an increase of the ratio to 7.89 from 6.32. All other ratios are performing better than the Board performance standards. The Rate of Return has been above the performance standard and supports the current budget recommendation to reduce Water rates by 3% in 2018.

Current Ratio
Debt as % Net Book Value (NBV)
Debt Service Coverage
Age of System
Days Unrestricted Cash
Rate of ReturnRate of return on investment, expressed as a percentage of the total amount invested in infrastructure. This ratio measures the utility's ability to pay current infrastructure costs and future replacement costs. Per the AWWA, a range of 5-7% is an acceptable range (the upper quartile for return on assets is approximately 6%).
Total current assets to total current liabilities. This ratio measures the utility's short-term liquidity (ability to pay bills). Long term investments are included in the calculation since they are highly marketable and could be liquidated if the need arose. The standard is set by EWEB financial policies and is meant to support a higher than average credit rating.
Ratio of the amount of debt outstanding against the remaining Net Book Value of assets. This metric measures overall leverage of the system in an effort to align debt service payments with the useful lives of assets.
Ratio of annualized net revenues available for debt service to total long-term debt service for the year. This ratio measures the utility's ability to meet its annual long-term debt obligation. The performance standard is meant to support a double A credit rating.
Ratio of accumulated depreciation against the historical value of assets. This ratio measures how old the system is as compared to how much has been depreciated. Infrastructure over 65% depreciated should be watched for aging, while infrastructure less than 50% depreciated is representative of newer systems.
Ratio of total unrestricted cash and cash equivalents to average daily cash requirements for operating expenses (defined as yearly budgeted operating expenses net of depreciation divided by 365 days in the year). This figure measures the length of time the utility can carry on normal operations with available unrestricted cash not otherwise designated for future capital needs. Long term investments are included in the calculation since they are highly marketable and could be liquidated if the need arose. Standard and Poor's Industry Standards for Investment Grade ratings are typically 60 to 90 days. The higher performance standard supports higher credit rating.

Water System Sales in KgalSeptember 2017
Total Water Sales in KgalBUDGET
2015 2016 2017 2017
January 459,108 399,369 469,493 418,000February 404,303 419,161 405,815 383,804March 467,462 450,547 444,552 426,273
Q1 total 1,330,873 1,269,077 1,319,860 1,228,077
April 487,636 488,756 450,168 455,583May 679,838 662,977 610,855 642,331June 1,051,349 942,995 643,822 855,789
Q2 total 2,218,823 2,094,728 1,704,845 1,953,703
July 1,255,528 1,066,322 1,212,921 1,095,294August 1,145,986 1,190,789 1,242,046 1,098,659September 840,585 863,372 882,048 826,097
Q3 total 3,242,099 3,120,483 3,337,015 3,020,051
October 674,261 566,078 0 548,290November 473,737 478,000 0 471,614December 187,717 653,434 0 346,818
Q4 total 1,335,715 1,697,512 0 1,366,722
Annual total 8,127,510 8,181,800 6,361,720 7,568,552
Residential Sales in KgalBUDGET
2015 2016 2017 2017
January 219,363 199,360 200,913 205,002February 186,053 172,258 176,564 167,091March 213,577 195,684 190,004 184,568
Q1 total 618,993 567,302 567,481 556,661
April 225,226 214,567 190,757 210,157May 328,179 305,247 270,359 306,405June 551,652 474,954 329,725 436,109
Q2 total 1,105,057 994,768 790,841 952,671
July 732,314 560,639 654,795 604,806August 620,535 640,466 681,013 594,718September 417,603 439,526 442,673 419,212
Q3 total 1,770,452 1,640,631 1,778,481 1,618,735
October 315,532 226,033 0 230,696November 191,016 193,702 0 196,394December 41,102 303,194 0 129,266
Q4 total 547,650 722,929 0 556,356
Total 4,042,152 3,925,630 3,136,803 3,684,423
General Service, Contract & Other in KgalBUDGET
2015 2016 2017 2017
January 239,745 200,009 268,580 167,884February 218,250 246,903 229,251 178,739March 253,885 254,863 254,548 203,144
Q1 total 711,880 701,775 752,379 549,766
April 262,410 274,189 259,411 205,880May 351,659 357,730 340,496 294,359June 499,697 468,041 314,097 368,503
Q2 total 1,113,766 1,099,960 914,004 868,743
July 523,214 505,683 558,126 422,280August 525,451 550,323 561,033 414,674September 422,982 423,846 439,375 316,885
Q3 total 1,471,647 1,479,852 1,558,534 1,153,840
October 358,729 340,045 0 247,310November 282,721 284,298 0 227,334December 146,615 350,240 0 173,093
Q4 total 788,065 974,583 0 647,737
Total 4,085,358 4,256,170 3,224,917 3,220,086
0
100,000
200,000
300,000
400,000
500,000
600,000
700,000
800,000Ja
nuar
y
Febr
uary
Mar
ch
April
May
June July
Augu
st
Sept
embe
r
Oct
ober
Nov
embe
r
Dec
embe
r
Kgal
Month
Residential Sales2015
2016
2017
2017 BUDGET
0
100,000
200,000
300,000
400,000
500,000
600,000
Janu
ary
Febr
uary
Mar
ch
April
May
June July
Augu
st
Sept
embe
r
Oct
ober
Nov
embe
r
Dec
embe
r
Kgal
Month
General Service, Contract & Other Sales
2015
2016
2017
2017 BUDGET
-
200,000
400,000
600,000
800,000
1,000,000
1,200,000
1,400,000
Janu
ary
Febr
uary
Mar
ch
April
May
June July
Augu
st
Sept
embe
r
Oct
ober
Nov
embe
r
Dec
embe
r
Kgal
Month
Total Sales2015
2016
2017
2017 BUDGET
1
M E M O R A N D U M EUGENE WATER & ELECTRIC BOARD
TO: Commissioners Helgeson, Brown, Mital, Simpson, and Carlson
FROM: Sue Fahey, Chief Financial Officer; Sarah Gorsegner, Purchasing & Warehouse
Supervisor
DATE: October 27, 2017
SUBJECT: Quarterly Contract Report for Q3 2017
OBJECTIVE: Information Only Issue EWEB Public Contracting Rule 2-0150 and the Board Policy EL2, Purchasing Controls define the process for contract approval and Board reporting. Background In August 2017, the Board approved the current approval and reporting process and thresholds. Current Board approval thresholds via Board Consent Calendar are for contracts where the value of the Goods, Services, Personal Services, Construction, or Equipment meet or exceed $150,000. Current quarterly reporting thresholds are for contracts where the value of the Goods, Services, Personal Services, Construction, or Equipment are between $40,000 and $150,000. Discussion Attached is the contract report for the third quarter of 2017 for contracts between $40,000 and $150,000. Recommendation/Requested Board Action None at this time. This information is provided for informational purposes only.

Contract Execution Contractor City, State Description Contract Amount Contract Term Contract Process ET Manager
8/22/2017 Professional Training Systems Inc. Portland, Oregon Electric Utility System Operations Training $ 100,000.00 9/1/2022 Direct Negotiation Lena Kostopulos
7/27/2017 Mycoff, Fry & Prouse LLC Conifer, ColoradoProfessional Executive Search and Recruitment Services for Chief Energy Resources Officer
48000+ allowable expenses
3/31/2018 Direct Negotiation Lena Kostopulos
10/1/2017 Itron Inc. Liberty Lake, Washington Itron Mobile Radios & Implementation 68,611.00$ 9/30/2018 Direct Negotiation Matt Barton
9/6/2017 Navigant Consulting Inc Folsom, California NERC Compliance Assessment $ 115,000.00 9/6/2018 Formal RFP Rod Price
9/5/2017 Stettler Supply Company Salem, Oregon HB Headhouse Structural Improvements $ 109,205.00 12/31/2017 Formal ITB Mel Damewood
8/3/2017Bank of the Cascades in partnership with Retail Lockbox Inc
Bend, Oregon In-House Remittance $ 50,000.00 8/2/2022 Formal RFP Sue Fahey
7/27/2017 YSI Inc San Diego, California Acoustic Doppler Velocity Meters $ 49,188.00 7/26/2022 Informal Quotes Mel Damewood
7/20/2017 North Coast Electric Eugene, Oregon Dillard 975 Pump Station Equipment Purchase $ 63,358.00 One-Time Purchase Informal Quotes Mel Damewood9/28/2017 Lac Mac Limited Ontario, Canada Price Agreement - Fire Retardant Raingear NTE $150,000 9/27/2022 Informal Quotes Rod Price6/30/2017 Motorola Solutions Schaumburg, IL Motorola two-way radios $ 126,903.50 One-Time Purchase Sole Source Rod Price
8/3/2017 Power Engineering Portland, OregonDesign for Stone Creek-Oak Grove Circuit Breaker & Line Relaying Replacement
$ 47,000.00 11/30/2017 Direct Negotiation Mike McCann
7/28/2017 Landis Consulting Salem, OregonHayden Bridge Standby Power Improvements - Electric Engineering
$ 81,450.00 8/31/2018 Direct Negotiation Mel Damewood
9/26/2017 Black & Veatch Lake Oswego, Oregon EWEB System Resiliency Islanding Study $ 78,519.00 3/1/2018 Direct Negotiation Rod Price
6/21/2017 SSP Innovations Centennial, CO GIS Consulting Services and Responder Training 60,785.50$ 6/21/17 to 12/31/17 Direct Negotiation Matt Barton
Questions? Please contact: Sarah Gorsegner, 541-685-7348
EWEB association for all above contracts = None

1
M E M O R A N D U M EUGENE WATER & ELECTRIC BOARD
TO: Commissioners Helgeson, Brown, Mital, Simpson and Carlson
FROM: Nicholas Nevins, Engineering Technician
DATE: October 4, 2017
SUBJECT: Standards of Conduct for Economic Development Administration (EDA) Grant
OBJECTIVE: Information Only Board Policy GP6 provides that Commissioners shall follow federal ethics requirements and laws when administering any Federal Grant awarded to EWEB. The following information will enable compliance with the standards of conduct requirement of the EDA grant, presently funding the installation of the downtown fiber optic network. A similar memo will be provided for each federal grant awarded to EWEB. CONFLICTS OF INTEREST: A conflict of interest generally exists when an interested party participates in a matter that has a direct and predictable effect on the interested party’s personal or financial interests. A conflict may also exist where there is an appearance that an interested party’s objectivity in performing his or her responsibilities under the project is impaired. Additionally, a conflict may result from non-financial gain to an interested party, such as benefit to reputation or prestige in a professional field. An interested party may not use their position for a purpose that constitutes or presents the appearance of personal conflicts of interest or of personal gain in the administration of an award. An interested party must not receive any direct or indirect financial or personal benefits in connection with this award. EWEB must disclose to EDA, in writing, any potential conflict of interest. GIFTS: An interested party also shall not, directly or indirectly, solicit or accept any gift, gratuity, favor, entertainment or other benefit having monetary value, for himself or herself or for another person or entity, from any person or organization which has obtained or seeks to obtain Investment Assistance from EDA. DEFINITIONS: Interested Party: Any officer, employee or member of the Board. An interested party includes that person’s immediate family and other persons directly connected to the interested party by law or

2
through a business arrangement. Immediate Family: A person’s spouse (or domestic partner or significant other), parents, grandparents, siblings, children and grandchildren, but does not include distant relatives, such as cousins, unless the distant relative lives in the same household as the person.

1
M E M O R A N D U M EUGENE WATER & ELECTRIC BOARD
TO: Commissioners Helgeson, Brown, Mital, Simpson and Carlson
FROM: Karl Morgenstern, Water Quality Lab & Source Protection Supervisor
DATE: October 24, 2017
SUBJECT: Standards of Conduct for U.S. Endowment Grant
OBJECTIVE: Information Only Board Policy GP6 provides that Commissioners shall follow federal ethics requirements and laws when administering any Federal Grant awarded to EWEB. The following information will enable compliance with the standards of conduct requirements of the U.S. Endowment Grant, funded by the U.S. Environmental Protection Agency (EPA) and USDA Natural Resources Conservation Service (NRCS). Funds from this grant will develop a McKenzie Watershed Conservation Fund with Cascade Pacific Resource Conservation Service (a 501(c)3 nonprofit entity) as the fiscal manager of the Fund. Establishing a Watershed Conservation Fund will allow efficient management of multiple funding sources for McKenzie watershed restoration and/or protection work on the ground. A similar memo will be provided for each federal grant awarded to EWEB. CONFLICTS OF INTEREST: No employee, officer or agent may participate in the selection, award, or administration of a contract supported by a Federal award if he or she has a real or apparent conflict of interest. Such a conflict of interest would arise when the employee, officer or agent, any member of his or her immediate family, his or her partner, or an organization which employs or is about to employ any of the parties above, has a financial or other interest in or a tangible personal benefit from a firm considered for a contract. RESPONSE TO CONFLICT OF INTEREST: EWEB must disclose in writing any potential conflict of interest to EPA or the pass-through entity (U.S. Endowment) within 30 calendar days of discovery. Any notification in writing is preferred through email communication. The disclosure must include any information regarding measures to eliminate, neutralize, mitigate or otherwise resolve the conflict. Within 30 days of disclosure, EPA will review the conflict notification and advise EWEB of EPA’s determination on the effectiveness of the measures. GIFTS: The officers, employees, and agents of the non-Federal entity may neither solicit nor accept gratuities, favors, or anything of monetary value from contractors or parties to subcontracts. However, non-Federal entities may set standards for situations in which the financial interest is not substantial or the

2
gift is an unsolicited item of nominal value. DEFINITIONS: Immediate Family: Spouse, spouse’s parents, children, children’s spouses, parents, parents’ spouses, siblings, siblings’ spouses, grandparents, grandparents’ spouses, grandchildren, grandchildren’s spouses, domestic partner, domestic partner’s parents, domestic partners of any individual listed here; and any individual related by blood or affinity whose close association with the employee is the equivalent of a family relationship.


![M& s mobile_engagement_dma_v0.2[1][1]](https://img.pdfslide.us/doc/110x75/5467cbc8af7959d51d8b4e8a/mamp-s-mobileengagementdmav0211.jpg)