Embed Size (px)
Citation preview

M
OS
T AF
A KA
H
A
M
E D
COMPARATIVE STUDY OF SLOPE
STABILITY BY GEOTECHNICAL SOFTWARE
PROGRAMS
A THESIS SUBMITTED TO THE GRADUATE
SCHOOL OF APPLIED SCIENCES
OF
NEAR EAST UNIVERSITY
By
ABDALLA SHLASH
In Partial Fulfillment of the Requirements for the
Degree of Master of Science
In
Civil Engineering
NICOSIA 2020
2018
AB
DA
LL
A S
HL
AS
H
CO
MP
AR
AT
IVE
ST
UD
Y O
F S
LO
PE
ST
AB
ILIT
Y B
Y G
EO
TE
CH
NIC
AL
SO
FT
WA
RE
PR
OG
RA
MS
NE
U
2020
COMPARATIVE STUDY OF SLOPE STABILITY BY
GEOTECHNICAL SOFTWARE PROGRAMS
A THESIS SUBMITTED TO THE GRADUATE
SCHOOL OF APPLIED SCIENCES OF NEAR EAST
UNIVERSITY
By
ABDALLA SHLASH
In Partial Fulfillment of the Requirements for the
Degree of Master of Science
in
Civil Engineering
NICOSIA 2020
Abdalla SHLASH COMPARATIVE STUDY OF SLOPE STABILITY BY
GEOTECHNICAL SOFTWARE PROGRAMS
Approval of Director of Graduate School of
Applied Sciences
Prof Dr Nadire CcedilAVUŞ
We certify this thesis is satisfactory for the award of the degree of
Master of Science in Civil Engineering
Examining Committee in Charge
Assoc Prof Dr Rifat Reşatoğlu Committee Chairman Department of Civil
Engineering Near East University
Assist Prof Dr Youssef Kassem Department of Mechanical
Engineering Near East University
Assist Prof Dr Anoosheh Iravanian Supervisor Department of Civil
Engineering Near East University
I hereby declare that all information in this document has been obtained and presented in
accordance with academic rules and ethical conduct I also declare that as required by
these rules and conduct I have fully cited and referenced all material and results that are
not original to this work
Name Last name Abdalla SHLASH
Signature
Date
ii
ACKNOWLEDGEMENTS
Foremost Irsquod like to express my sincere gratitude my supervisor Assist Prof Dr
Anoosheh Iravanian of the Civil Engineering Department at Near East University for her
patience motivation and valuable guidance The door to Assist Prof Dr Iravanian office
was always open whenever had a question about my research or when I ran into a trouble
This thesis would not have been possible without her
Fınally I want to express my very profound gratitude to my pacemaker my prestigious
father Dr Mohammed Saleh Shlash for his unlimited support and my sparking mother and
sisters for their love and pray and my beloved brother Dr Mohammed Noor
iii
To my familyhellip
iv
ABSTRACT
Soil slopes analysis and design has always been a major field in geotechnical engineering
Different methods have been developed and created to examine two and three dimensional
slopes based on various methods of assumption and assessment The factor of safety can
only be acquired accurately if the slopes critical failure surface is appropriately detected
Different software programs for analyzing and examining slope stability were used and
compared by knowing the parameters of soil strength
Throughout this study software programs such as PLAXIS SLOPEW and FLACSlope
were used to examine the difficulties of slope stability and determine the critical surface of
failure Different values of shear strength parameters were chosen to investigate the
authenticity and efficiency of these programs cohesion (c) soilrsquos unit weight (ɤ) and
internal friction angle (Oslash) and their effect on the value of the factor of safety were
examined Eventually to obtain from various software programs the results have been
contrasted and shared The research findings showed that the slopes factor of safety
changes with changing cohesion soils unit weight and internal friction angle In addition
the slip surface is affected by (λ) the dimensionless function associated with the cohesion
the internal friction angle and the unit weight
The conclusions showed that compared to SLOPEW PLAXIS is easier to use as slope
stability assessment software It gives about 5 lower factor of safety value than
SLOPEW On the other hand FLACSlope is the most complicated software and usually
gives lower value for the factor of safety than SLOPEW and PLAXIS
Keywords slope stability PLAXIS SLOPEW FLACSLOPE factor of safety length of
failure arc
v
OumlZET
Zemin şev stabilitesive tasarımı jeoteknik muumlhendisliğinde her zaman oumlnemli bir alan
olmuştur Ccedileşitli varsayım ve değerlendirme youmlntemlerine dayanarak iki ve uumlccedil boyutlu
eğimleri incelemek iccedilin farklı youmlntemler geliştirildi ve yaratıldı Guumlvenlik faktoumlruuml ancak
eğimin kritik kayma yuumlzeyi uygun şekilde tespit edildiğinde doğru bir şekilde elde
edilebilir Şev stabilitesini analiz etmek ve incelemek iccedilin farklı yazılım programları
kullanılmış ve zemin dayanımı parametreleri karşılaştırılmıştır
Bu ccedilalışma boyunca şev stabilitesinin zorluklarını incelemek ve kritik kayma yuumlzeyini
belirlemek iccedilin PLAXIS SLOPEW ve FLACSlope gibi yazılım programları
kullanılmıştır Bu programların gerccedilekliğini ve verimliliğini araştırmak iccedilin farklı kayma
dayanımı parametrelerinin değerleri seccedililmiştir kohezyon zeminin birim hacim ağırlığı ve
iccedil suumlrtuumlnme accedilısı ve bunların guumlvenlik faktoumlruumlnuumln değeri uumlzerindeki etkileri incelenmiştir
Sonunda ccedileşitli yazılım programlarından elde edilen sonuccedillar karşılaştırıldı ve paylaşıldı
Araştırma bulguları eğimin guumlvenlik faktoumlruumlnuumln değişen kohezyon zeminin birim hacim
ağırlığı ve iccedil suumlrtuumlnme accedilısı ile değiştiğini goumlstermiştir Ek olarak kayma yuumlzeyi
kohezyon iccedil suumlrtuumlnme accedilısı ve birim hacim ağırlık ile ilişkili boyutsuz bir fonksiyondan
(λ) etkilenir
Elde edilen sonuccedillar SLOPEW ile karşılaştırıldığında PLAXISin şev stabilitesi
değerlendirme yazılımının daha kolay olduğunu goumlstermiştir SLOPEWden yaklaşık 5
daha duumlşuumlk guumlvenlik faktoumlruuml verir Oumlte yandan FLACSLOPE guumlvenlik faktoumlruuml iccedilin
SLOPEW ve PLAXISten daha duumlşuumlk bir değer verir
Anahtar Kelimeler şev stabilitesi PLAXIS SLOPEW FLACSLOPE emniyet faktoumlruuml
arıza uzunluğu
vi
TABLE OF CONTENTS
ACKNOWLEDGMENTS ii
ABSTRACT iv
OumlZET v
TABLE OF CONTENTS vi
LIST OF TABLES x
LIST OF FIGURES xii
LIST OF SYMBOLS AND ABBREVIATIONS helliphelliphelliphelliphelliphelliphelliphelliphelliphelliphelliphelliphelliphellip xiv
CHAPTER 1 INTRODUCTION
11 Overview 1
12 Importance of Research 2
13 Aim of the Study 3
14 The Shear Strength Parameters as Input Data 4
15 Common Causes of Slope Failure 5
151 Steepness of the slope 5
152 Water and drainage 6
153 Soil composition 6
154 Vegetation 6
155 Bedding planes 7
156 Joints and fractures 7
157 Sudden shocks 7
16 Types of Slope Failure 8
161 Planar failure 8
162 Wedge failure 8
163 Circulars failure 10
164 Two block failure 11
165 Toppling failure 12
17 Factors affecting Slope Stability 14
171 Slope geometry 14
vii
172 Geological structure 14
173 Lithology 15
174 Ground water 15
175 Dynamic forces 16
176 Internal friction anglehelliphelliphelliphelliphelliphelliphelliphelliphelliphelliphelliphelliphelliphelliphelliphelliphelliphelliphelliphellip 16
177 Cohesion 17
18 Factor of Safety 17
19 Organization of Thesishelliphelliphelliphelliphelliphelliphelliphelliphelliphelliphelliphelliphelliphelliphelliphelliphelliphelliphelliphelliphelliphelliphellip 21
CHAPTER 2 LITERATURE REVIEW
21 Introduction 22
22 Infinite Slopes 22
221Dry condition 23
222 Condition with seepage 24
23 Finite Slopes 25
231 Difference between LE and FE methods 25
232 Finite element methods 26
233 Limit equilibrium methods 30
232 Previous studies on analyzing 2D slope stability 42
24 Soil Slope Failure Surface Searching Methods 51
241 Simulated annealing method 51
242 Simple genetic algorithm 51
243 Leapfrog algorithm method 52
244 Other methods 53
25 Potential Slope Failure Surface and Soil Strength Parameters 53
CHAPTER 3 METHODOLOGY
31 Introduction 54
32 Methodology 54
33 Materials 56
331 Soil 56
viii
332 Water level 56
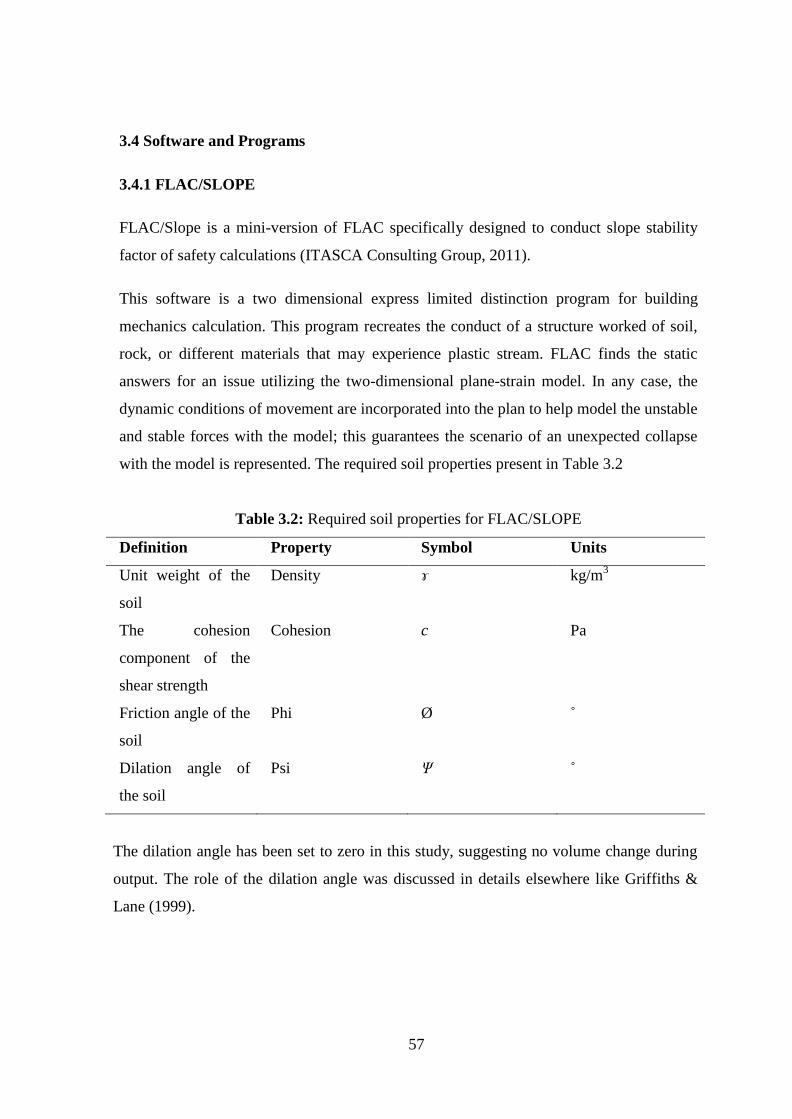
34 Software and Programs 57
341 FLACSLOPE 57
342 SLOPEW 62
343 PLAXIS 65
CHAPTER4 RESULTS AND DISCUSSION
41 Introduction 71
42 Impact of Soil Strength and Slope Geometry Parameters on Factor of Safety 71
421 Impact of Unit weight γ on the factor of safety 71
422 Impact of Cohesion c on the Factor of Safety FS 74
423 Impact of Friction Angle Oslash on the Factor of Safety FS 76
424 Impact of slope geometry on the factor of safety 78
43 Impact of Soil Strength and Geometry Parameters on Slip Surface 79
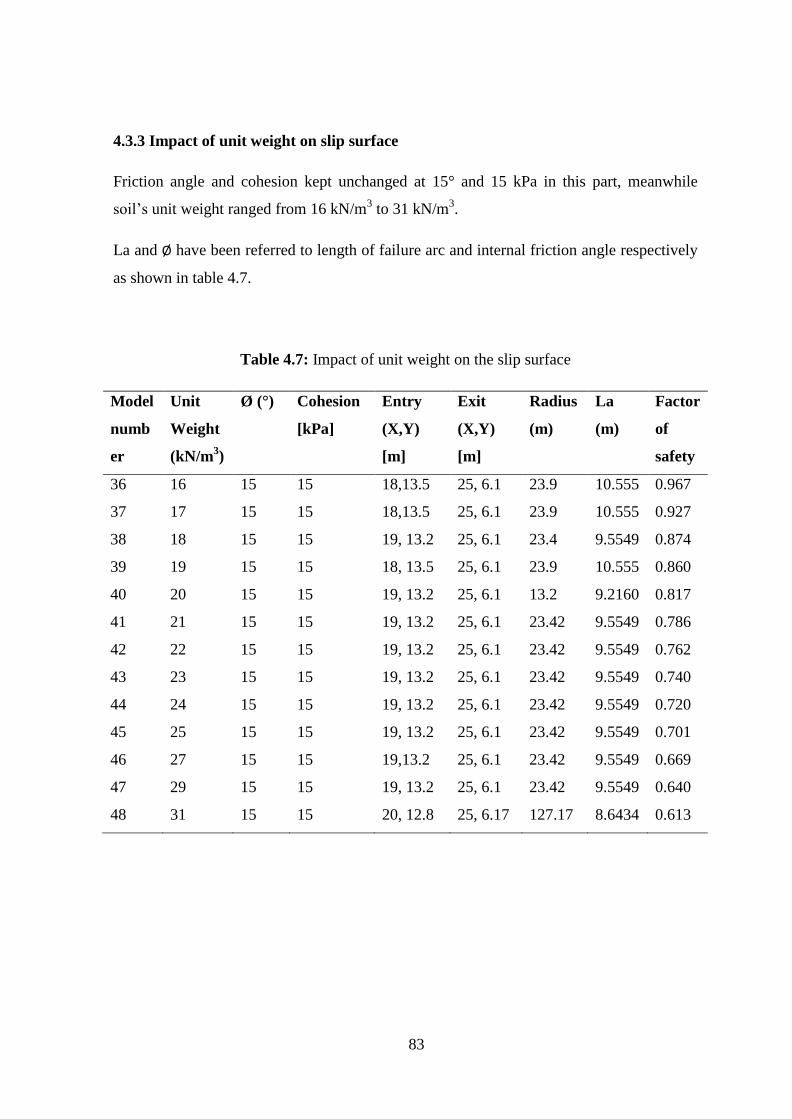
431 Impact of cohesion on the slip surface 81
432 Impact of internal friction angle on the slip surface 82
433 Impact of unit weight on the slip surface 83
434 Impact of cohesion and unit weight on the Slip Surface 84
435 Impact of internal friction angle and unit weight on the slip surface 85
436 Impact of internal friction angle and cohesion on the slip surface 85
437 Impact of slope geometry on the slip surface 86
44 Impact of Soil Strength and Geometry Parameters on Factor of Safety 88
441 Impact of cohesion on the factor of safety 88
442 Impact of internal friction angle on the factor of safety 89
443 Impact of unit weight on the factor of safety 89
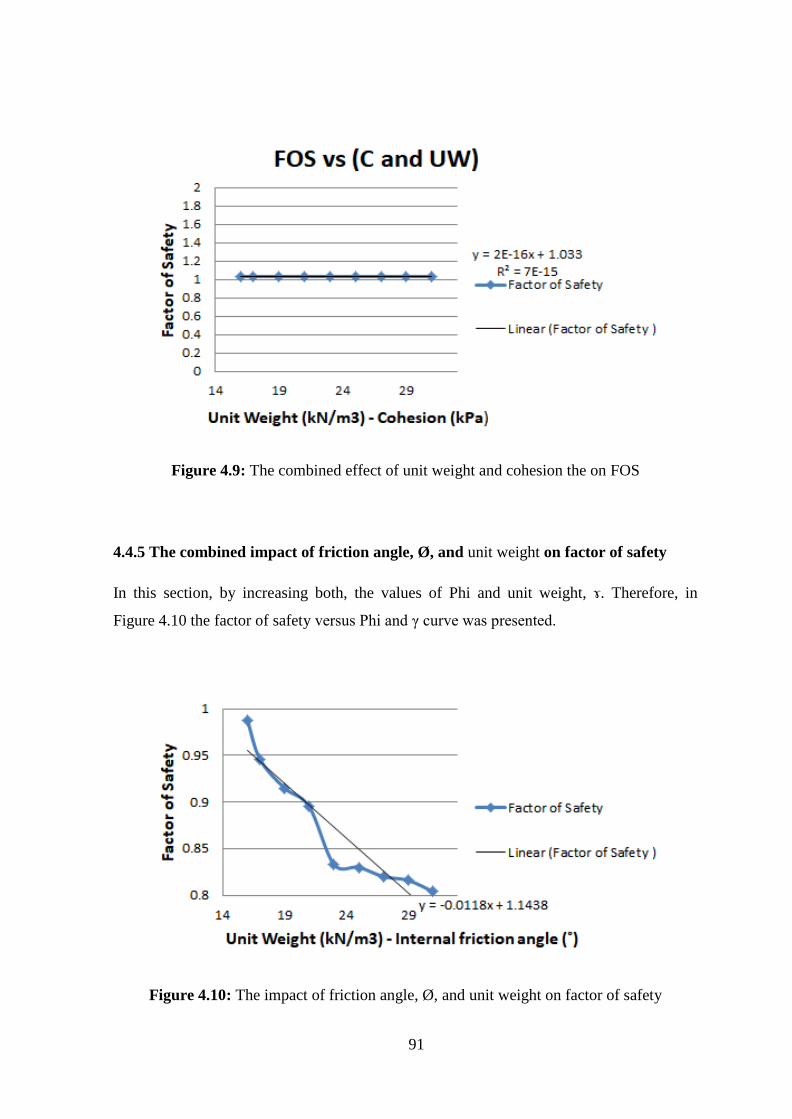
444 The combined impact of unit weight and cohesion the on factor of safety 90
445 The Combined impact of internal friction angle and ɤ on factor of safety 91
446 The combined effect of internal friction angle and cohesion on factor of
safety 92
447 Impact of slope geometry on the factor of safety 93
45 Impact of soil strength and geometry parameters on slip surface 94
451 Impact of Cohesion on the Length of Failure Arc 95
ix
452 Impact of internal friction angle on the length of failure arc 95
453 Impact of unit weight on the length of failure arc 96
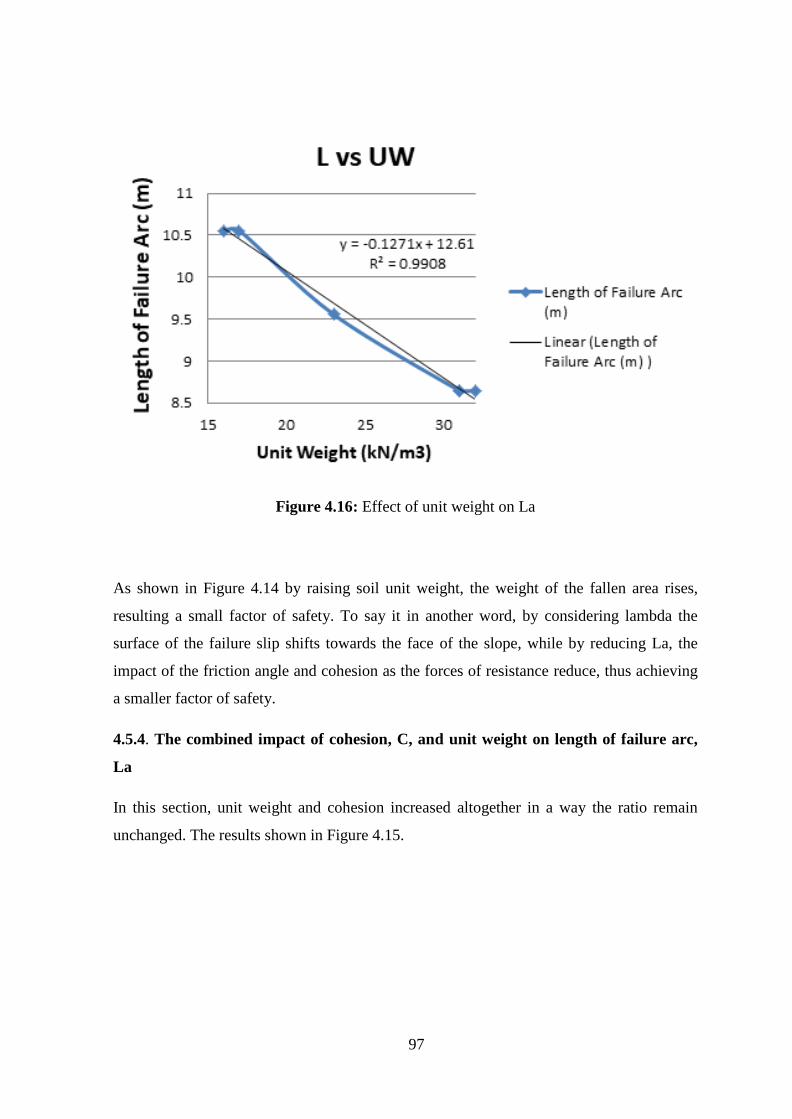
454 The combined impact of cohesion and ɤ on the length of failure arc 97
455 The combined impact of internal friction angle and the unit weight on the
length of failure arc 98
456 The combined impact of internal friction angle and cohesion on the length of
failure arc 99
457 Impact of slope geometry on the length of failure arc 100
46 Re-Analyzing Models by PLAXIS and Comparison of Results 103
47 Re-Analyzing the Previous Models by FLACSlope 111
CHAPTER 5 CONCLUSION AND RECOMMENDATIONS
51 Conclusions helliphelliphelliphelliphelliphelliphelliphelliphelliphelliphelliphelliphelliphelliphelliphelliphelliphelliphelliphelliphelliphelliphelliphelliphelliphelliphellip 114
52 Recommendations helliphelliphelliphelliphelliphelliphelliphelliphelliphelliphelliphelliphelliphelliphelliphelliphelliphelliphelliphelliphelliphelliphelliphelliphellip 115
REFERENCES helliphelliphelliphelliphelliphelliphelliphelliphelliphelliphelliphelliphelliphelliphelliphelliphelliphelliphelliphelliphelliphelliphelliphelliphelliphelliphellip 116
APPENDICES
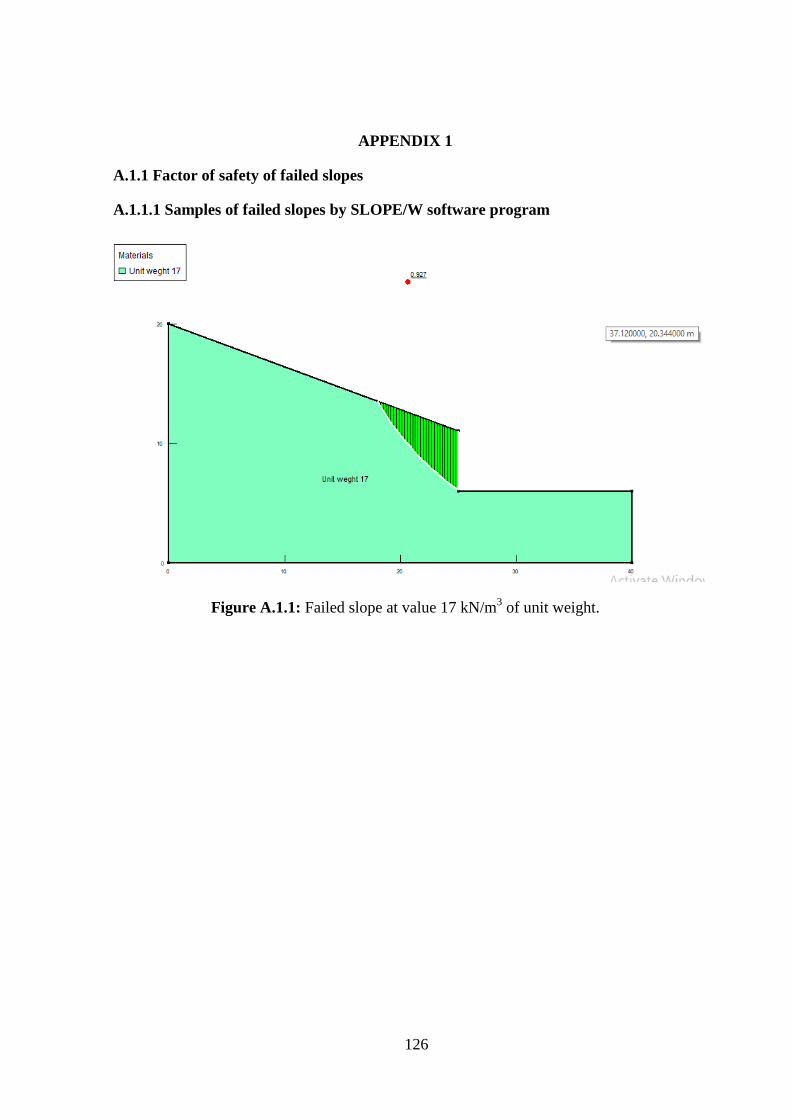
Appendix 1 Factor of safety of failed slopes helliphelliphelliphelliphelliphelliphelliphelliphelliphelliphelliphelliphelliphelliphellip 126
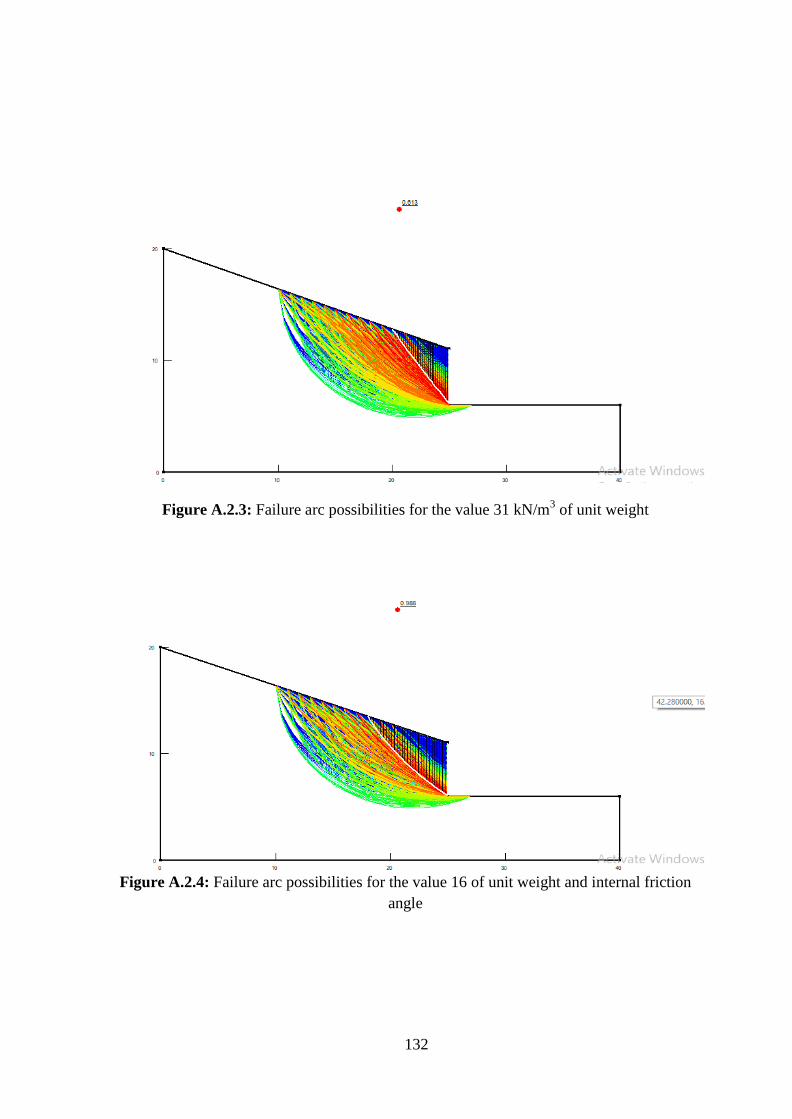
Appendix 2 Failure arc possibilities of failed slope by SLOPEWhelliphelliphelliphelliphelliphelliphellip 130
x
LIST OF TABLES
Table 11 Factor of safety values guidelines 19
Table 2 1 Previous studies analyzing 2D slope stability 43
Table 2 2 Methods of Analyzing 3D Slope Stability 50
Table 3 1 Soil strength parameters 56
Table 3 2 Required soil properties for FLACSLOPE 57
Table 3 3 Required soil properties for SLOPEW 62
Table 3 4 Required Soil Properties for PLAXIS 65
Table 4 1 effect unit weight on FOS 72
Table 4 2 Effect C on FOS 74
Table 4 3 effect Oslash on FOS 76
Table 4 4 Effect of slope geometry on FOS 79
Table 4 5 Effect of cohesion on the slip surface 81
Table 4 6 Effect of internal friction angle on the slip surface 82
Table 4 7 Effect of unit weight on the slip surface 83
Table 4 8 Effect of cohesion and unit weight on the Slip Surface 84
Table 4 9 Effect of internal friction angle and unit weight on the slip surface 85
Table 4 10 Effect of internal friction angle and cohesion on the slip surface 86
Table 4 11 Effect of slope geometry on the slip surface 87
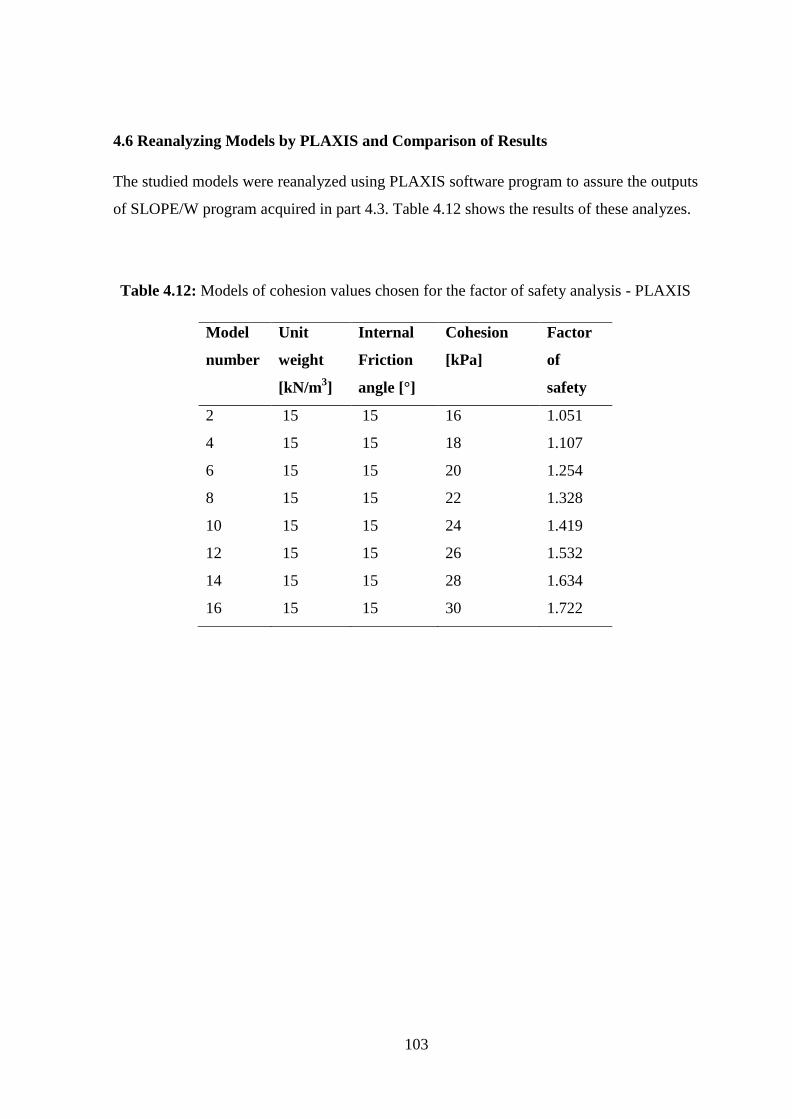
Table 4 12 Models of cohesion values chosen for the factor of safety analysis-
PLAXIShelliphelliphelliphelliphelliphelliphelliphelliphelliphelliphelliphelliphelliphelliphelliphelliphelliphelliphelliphelliphelliphelliphelliphelliphellip 103
Table 4 13 Models of internal friction angle values selected for the factor of safety
analysis for PLAXIS softwarehellip 104
Table 4 14 Models of unit weight values chosen for factor of safety analysis for -
PLAXIS 104
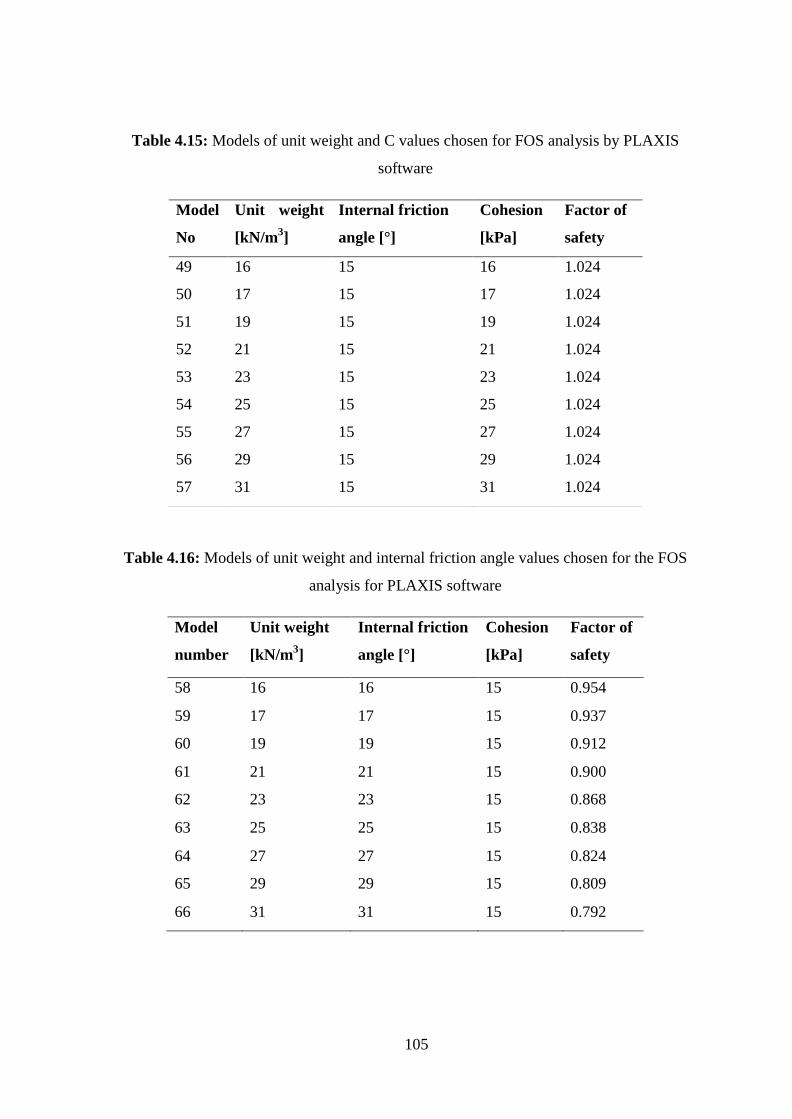
Table 4 15 Models of ɤ and C values chosen for FOS analysis by PLAXIS software
helliphelliphelliphelliphelliphelliphelliphelliphelliphelliphelliphelliphelliphelliphelliphelliphelliphelliphelliphelliphelliphelliphelliphelliphelliphelliphelliphellip 105
Table 4 16 Models of ɤ and Phi values chosen for the FOS analysis for PLAXIS
software 105
Table 4 17 Models of internal friction angle and cohesion values chosen for the
factor of safety analysis for PLAXIS softwarehelliphelliphelliphelliphelliphelliphelliphelliphellip 106
xi
Table 4 18 the difference of FOS between PLAXIS and SLOPEW 107
Table 4 19 Effect of slope geometry on the slip surface - PLAXIS 109
Table 4 20 The difference of FOS between PLAXIS and SLOPEW for slope
geomerty 110
Table 4 21 Reanalyze models by using FLAC software (shear strength parameters
models) 111
Table 4 22 Reanalyze models by using FLAC software (slope geometry models) 112
Table 4 23 The difference between the three software packages (shear
strength parameters models) 112
Table 4 24 The difference between the three software packages (slope geometry
models) 112
xii
LIST OF FIGURES
Figure 1 1 Steepness of the Slope (Guumlzelyurt) 5
Figure 1 2 Planner failure 8
Figure 1 3 Slant wedge failure 9
Figure 1 4 Straight wedge failure 10
Figure 1 5 Circular failure 11
Figure 1 6 Two block failure 12
Figure 1 7 The rotation in toppling failure 13
Figure 1 8 Toppling failure 13
Figure 1 9 Geometrical definition of rock slope stability with plane sliding 19
Figure 2 1 Details for infinite slope 23
Figure 2 2 Divide the structure to many geometric forms 27
Figure 2 3 Swedish Circle 31
Figure 2 4 Friction Circle Method 34
Figure 2 5 Log-Spiral Method 36
Figure 2 6 Ordinary Method of Slices 38
Figure 2 7 Simplified Bishop Method 39
Figure 2 8 Spencerrsquos Method 42
Figure 2 9 Simple Genetic Algorithm 52
Figure 3 1 Insert slopersquos coordinates on FLACSLOPE 58
Figure 3 2 Check on slopersquos drawing 59
Figure 3 3 Assign material properties on FLACSLOPE 60
Figure 3 4 FLACSLOPE Assign mesh 60
Figure 3 5 The difference between fine and medium meshes for the value 17 kNm3 of
unit weight (a) Fine mesh (b) Medium mesh 61
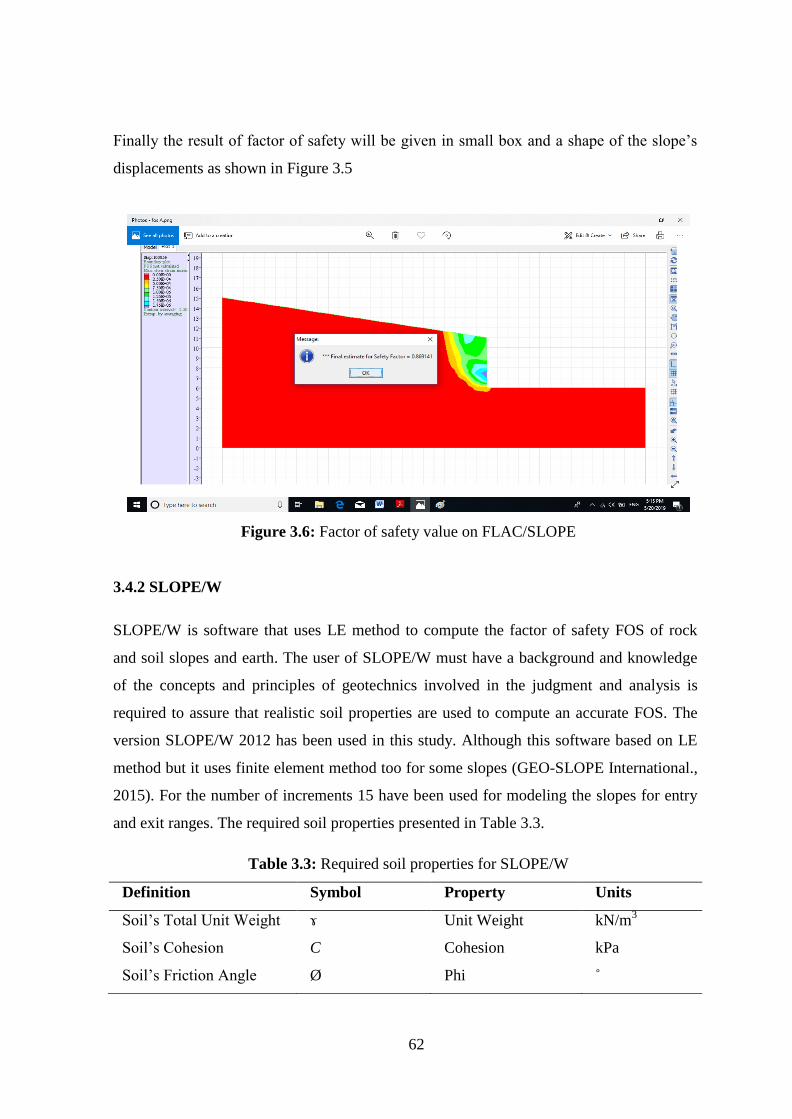
Figure 3 6 Factor of safety value on FLACSLOPE 62
Figure 3 7 SLOPEW set units 63
Figure 3 8 Assign and create the properties of material on SLOPEW 64
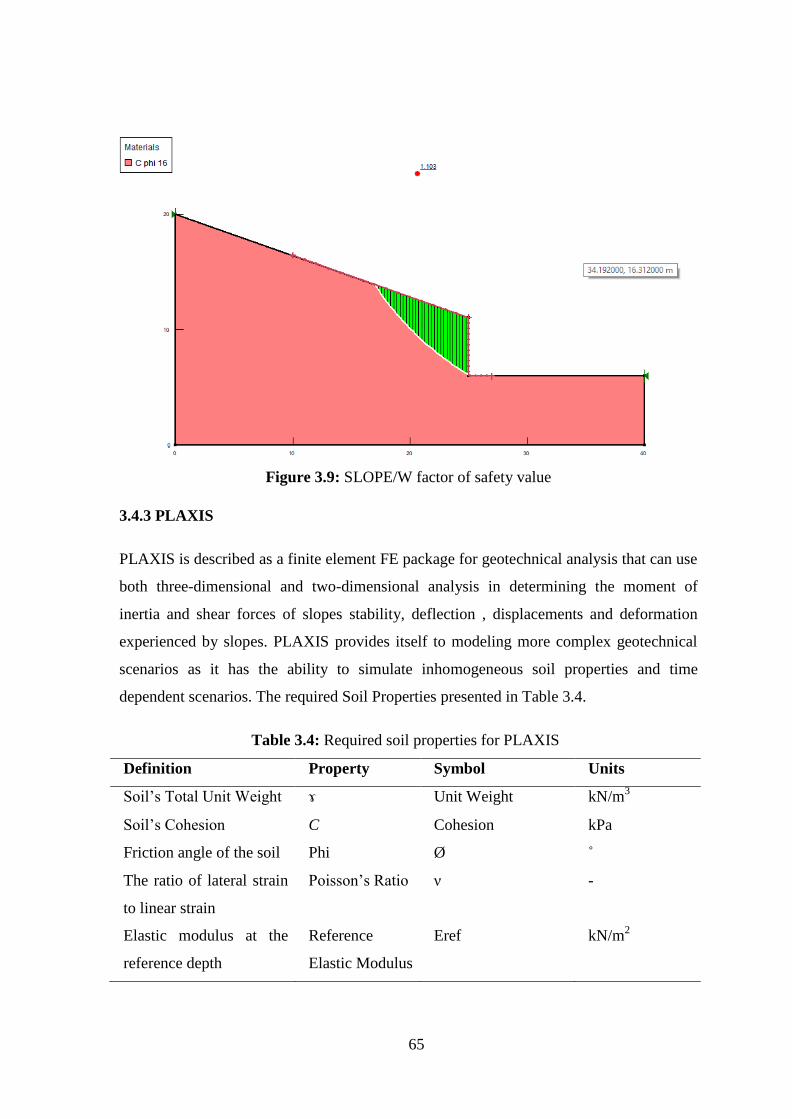
Figure 3 9 SLOPEW factor of safety value 65
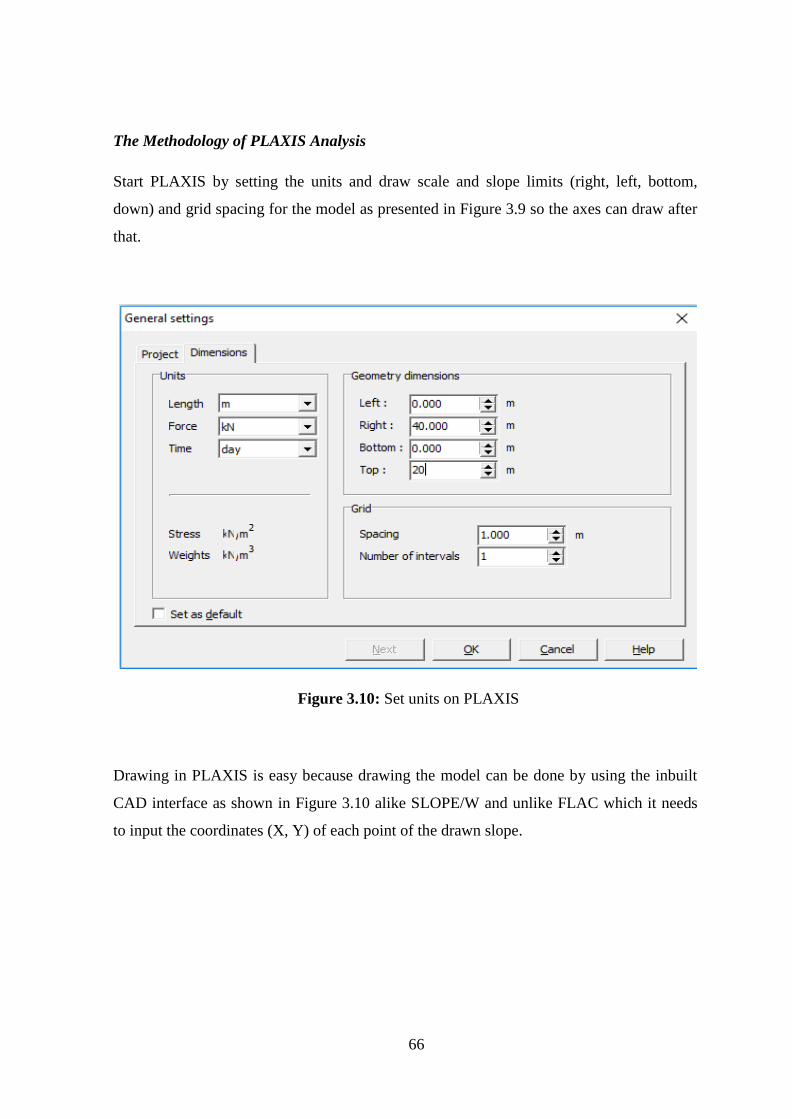
Figure 3 10 Set units on PLAXIS 66
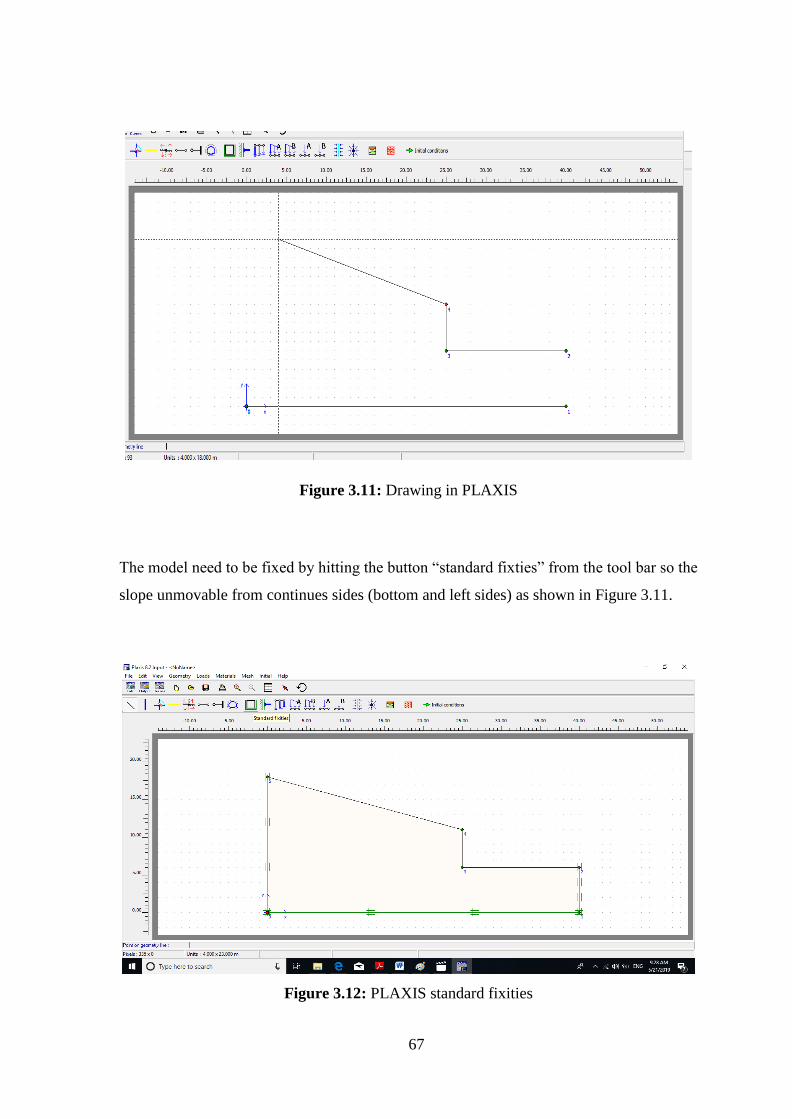
Figure 3 11 Drawing in PLAXIS 67
xiii
Figure 3 12 PLAXIS standard fixties 67
Figure 3 13 Assign and create the properties of material on PLAXIS 68
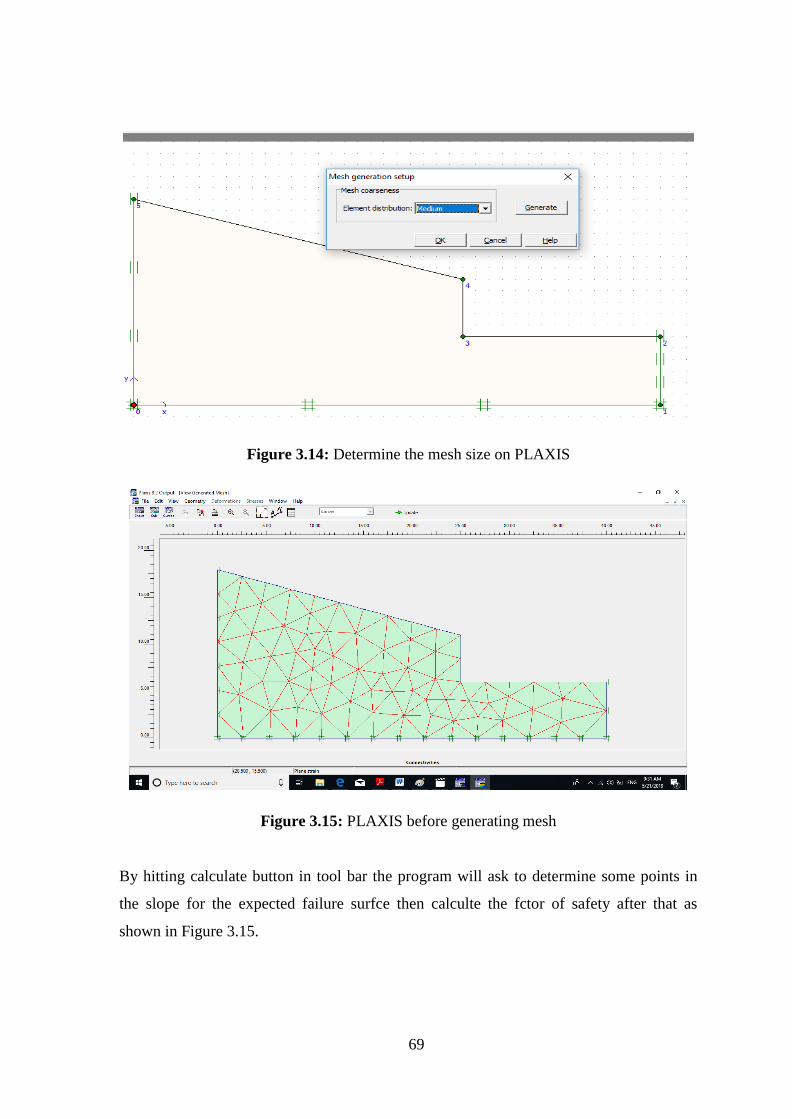
Figure 3 14 Determine the mesh size on PLAXIS 69
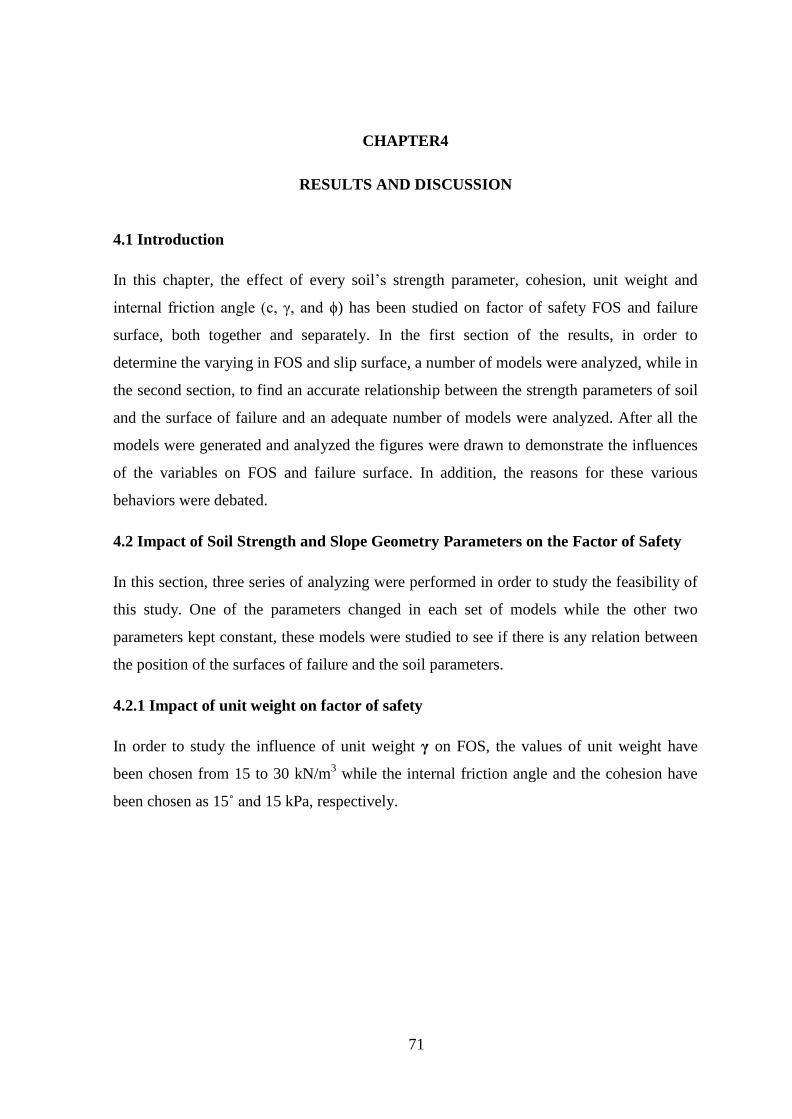
Figure 3 15 PLAXIS before generating mesh 69
Figure 3 16 PLAXIS after generating the mesh 70
Figure 3 17 Slope displacement on PLAXIS 70
Figure 4 1 (a) Effect of unit weight on Slip Surface (b) Exaggerated Part of (a) 73
Figure 4 2 (a) Effect of C on Slip Surface (b) Exaggerated Part of (a) 75
Figure 4 3 (a) Effect of C on Slip Surface (b) Exaggerated Part of (a) 77
Figure 4 4 Models for effect slope geometry on FOS 79
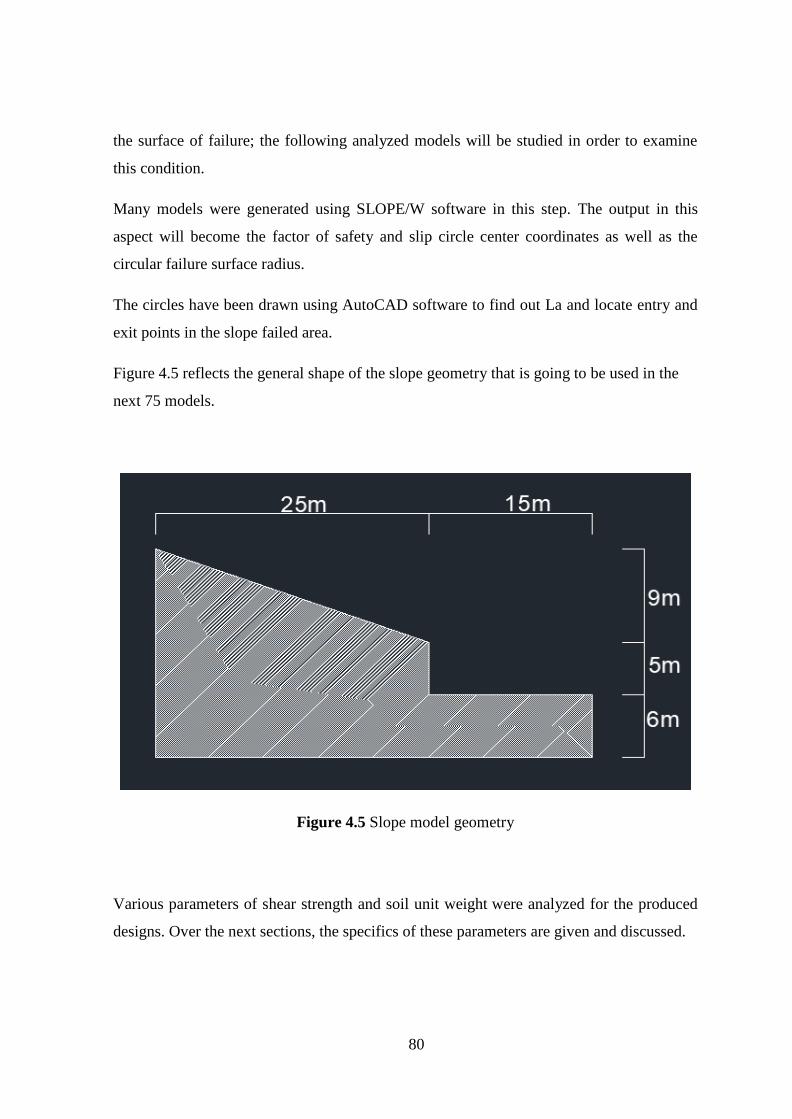
Figure 4 5 Slope model geometry 80
Figure 4 6 Effect of cohesion on the factor of safety 88
Figure 4 7 Effect of internal friction angle on the factor of safety 89
Figure 4 8 Effect of ɤ on the factor of safety 90
Figure 4 9 The combined effect of unit weight and cohesion the on factor of safety 91
Figure 4 10 The combined effect of internal friction angle and ɤ on factor of safety 91
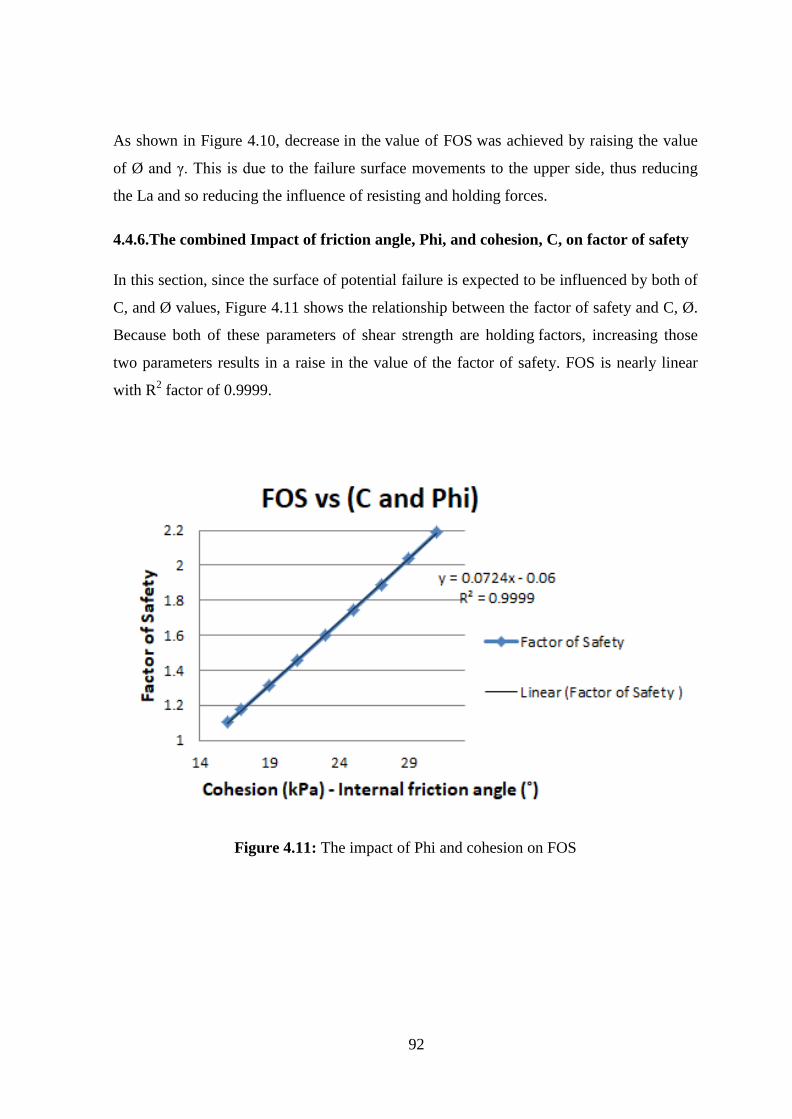
Figure 4 11 The combined effect of internal friction angle and cohesion on factor of
safety 92
Figure 4 12 Effect of Alpha angle on factor of safety 93
Figure 4 13 Effect of Beta angle on factor of safety 94
Figure 4 14 Effect of cohesion on the length of failure arc 95
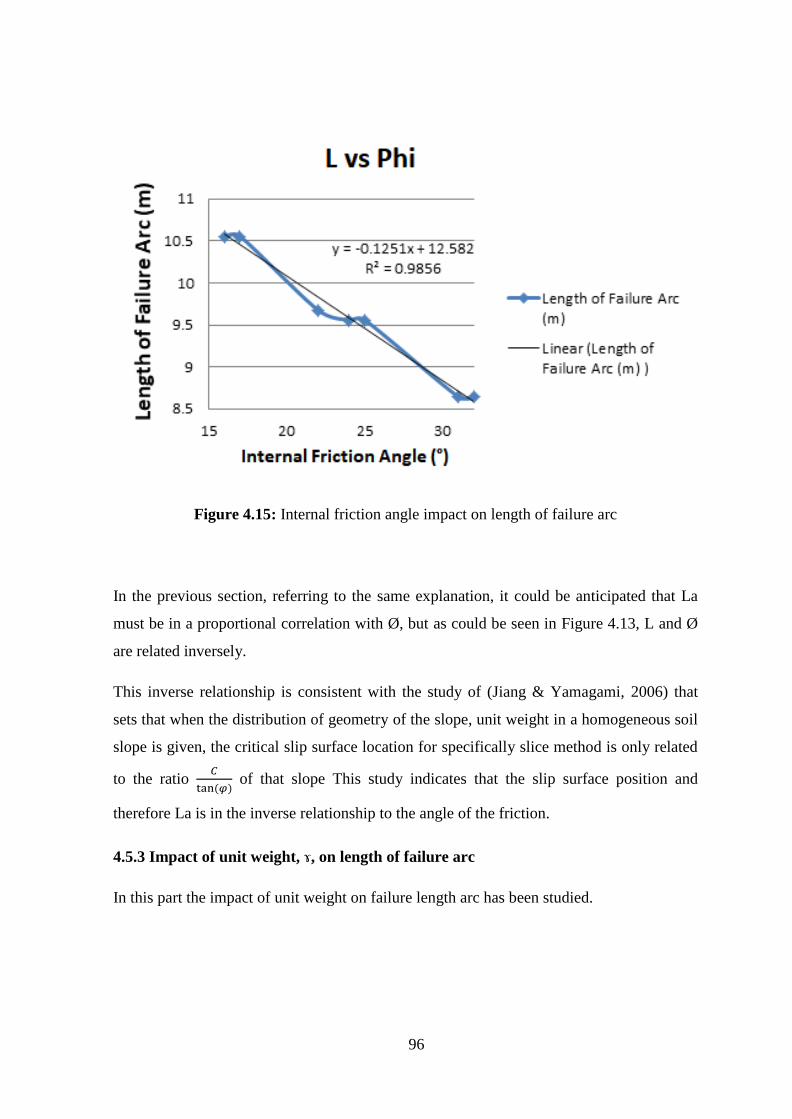
Figure 4 15 Effect of internal friction angle on the length of failure arc 96
Figure 4 16 Effect of ɤ on the length of failure arc 97
Figure 4 17 The combined effect of cohesion and ɤ on the length of failure arc 98
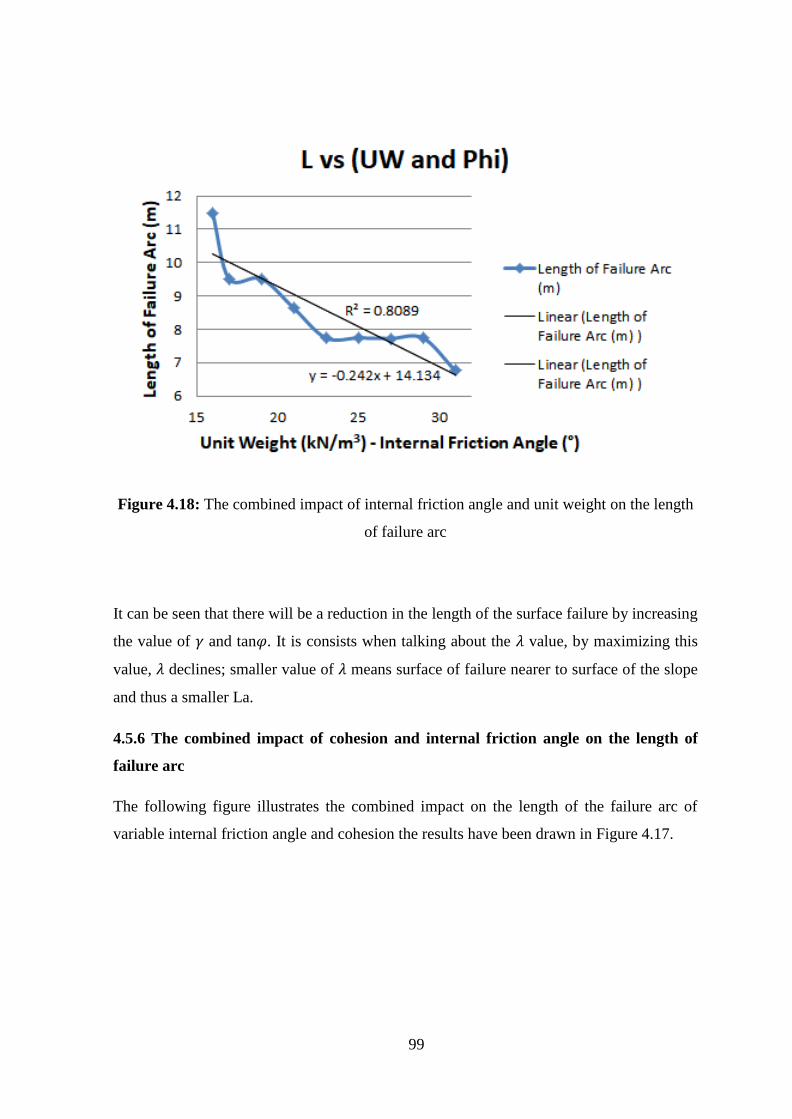
Figure 4 18 The combined effect of internal friction angle and ɤ on the length of
failure arc 99
Figure 4 19 The combined effect of cohesion and internal friction angle on the
length of failure arc 100
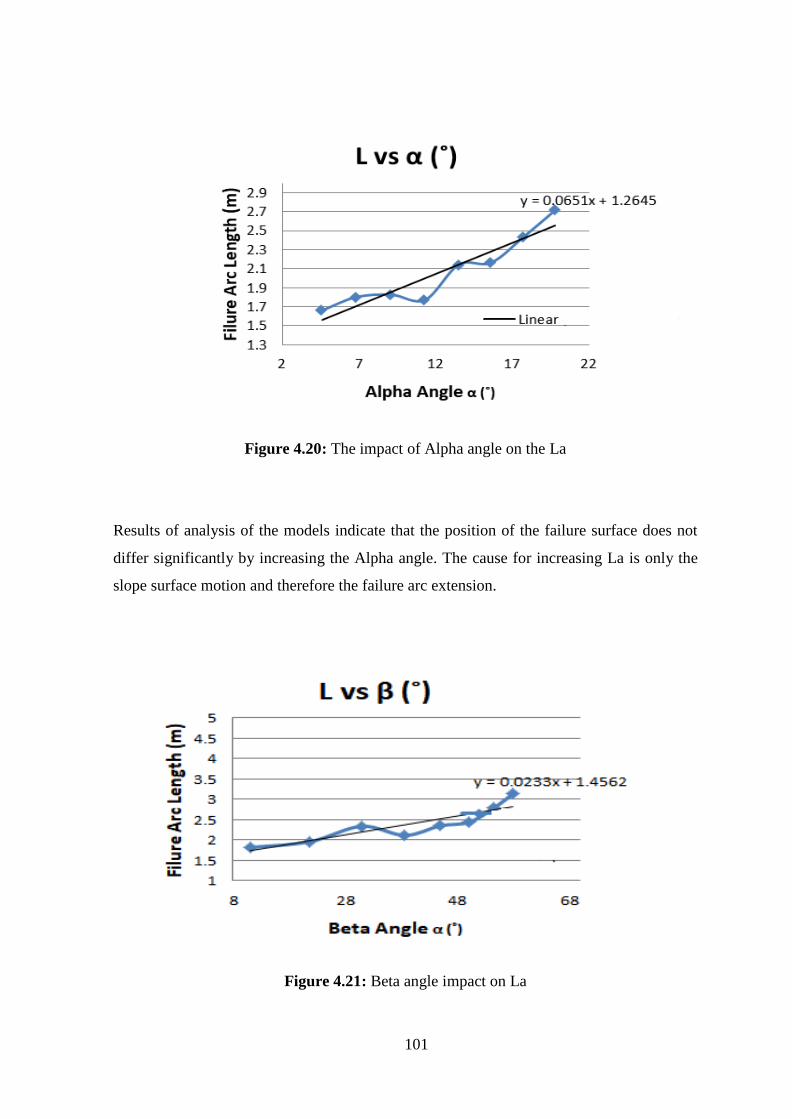
Figure 4 20 The effect of Alpha angle on the length of failure arc 101
Figure 4 21 The effect of Beta angle on the length of failure arc 101
Figure 4 22 (a) Effect of Alpha angle on length of Arc and (b) zoomed Part of (a) 102
xiv
LIST OF SYMBOLS AND ABBREVIATIONS
FOS Factor of Safety
FEM Finite Elements Method
LEM Limit Equilibrium Method
C Cohesion
γ Unit Weight
Oslash Internal Friction Angle
α Horizontal Angle of Slope (Figure 44)
β Vertical Angle of Slope (Figure 44)
AutoCAD Automatic Computer Aided Design
FLAC Fast Lagrangian Analysis of Continua
H Height of Slope
La Length of Failure Arc
Le Slope Surface Entry Distance
1
CHAPTER 1
INTRODUCTION
11 Overview
There are many problems encountered by the engineer student or executor when it comes
to slope stability subject The groundwork should be set up for predicting such problems
and devising appropriate solutions in case of failure occurrence One of the common cases
that is needed to be studied is the balance and stability of the earthworks in some
installation cases such as buildings and archaeological walls on slopes Practically every
phenomenon in nature geological or mechanical could be described with the help of
geotechnical laws so the use of mathematical models for studying the behavior of
geotechnical structures is an important part of geometrical analysis hence the importance
of understanding is how to handle modeling the software programs
The goal of any natural or manmade slopes stability analysis is to determine the failure
surface with the minimum value of factor of safety It is important to identify the critical
failure surface for the specified slope to find the minimum factor of safety Therefore
different methods of searching and optimizing have been used in the past They all
however have the same limitation which is the problem of using hand calculations
Throughout this study the impact of parameters of soil on the slopersquos failure surface and
factor of safety was studied It is possible to determine the critical failure surface for a
given slope by comparing the factor of safety from several experiment slip surfaces The
surface of the slip with the smallest factor of safety is viewed to be the surface of critical
failure
Basically therersquore two types of slopes natural and manmade (artificial) Each of these
types may be composed of rock or soil Natural slopes are also divided into two types
infinite slopes eg the highway between two cities with different sea level rise or
mountains The other type of natural slopes is finite slopes (eg hills) This study is about
finite slopes but will discuss about infinite slops too and how it is analyzed
2
Instances for natural slopes could be named as slope of the mountains slopes on both
sides of the rivers slope of the bottoms of the rivers from the source up to the downstream
Examples on manmade slopes could be counted as slopes of the bridges and slopes of sides
of roads railways and dams
These slopes have internal forces make them balanced against the forces that cause the
collapse of the slope The failure triggering forces could be named as gravity the forces of
water flow through the soil and the low value of cohesion of soil granules On the other
hand the force that resists the collapse of slope is mainly shear force (AbdelRahman
2019) If λ (the correlation between shear strength parameters and potential slip surface Eq
245) is constant the surface of the slip does not adjust with the switch in the parameters of
the shear strength
With the development in technology software packages using the finite difference and
finite element methods have increased in popularity as they head to possess a wide range of
characteristics (Hammouri et al 2008)
The outputs of this study showed that the slopes formed of smaller grains of soil the more
stable will be silty and well-graded soils are more stable than soils with coarse grains such
as gravel and sandy soils also slopes with the heavier soil in terms of unit weight has less
stability Slopes made from boulders or the ones with high content of larger grains have
less stability than slopes formed by gravelly soil
In this study it found that all slopes failed when soil unit weight value more than 15 kNm3
and the other two parameters are constant which represent clayey and silty sands also
when both parameters ɤ and Oslash changed together and the third parameter cohesion is
constant (which represent silty clay) the slopes have failed as well
12 Importance of Research
During the 1960s the science of soil mechanic was adopted on theory and limited empirical
information (Oghli 2011) Modeling of soils with heterogeneous and variable
characteristics varying with ambient conditions was very difficult especially experimental
techniques were doing simple tests when computers were not available at the time but
3
given the rapid scientific development of the world and the computer revolution using
programming that relies on numerical methods has become easier and contributes to the
solution of many geotechnical issues The design of the complex installations of our time
relies on the use of modern computer and software to complete the design in its optimal
form
This research focuses on theory and practice in which we hope to help narrow the gap
between theory and practice by contributing to the use and selection of the best modeling
software packages that are being used by geotechnical engineers globally thus enable
colleague engineers to use these programs and to realize how to deal with the results
obtained from this software
Combining the analysis of slope stability within the design will help to prevent any
geotechnical collapse during the life of the design and throughout construction (Bromhead
1992)
13 Aim of the Study
The widespread use of computers in engineering is the result of progress in production of
easy to use software and the proliferation of personal computers in the world So it can be
said that the design of structures or complexed slopes without the use of computers have
become very rare The design of complex installations of our time relies on the use of
modern computer and software to complete the design in its optimal form
At present the problem of slope stability is one of the main issues facing workers and
engineers in soil field there is still a big distinction between the scientists about the best
way to calculate the stability of the slopes (Oghli 2011)
The main objectives of this study are as follows
1- Extensive literature review to study the theoretical background of the most widely and
commonly used methods of analyzing slope stability as well as analyses of critical surface
techniques
4
2- Using various slope stability analysis software programs to evaluate the impacts of soil
strength parameters (cohesion unit weight internal friction angle) and slope geometry
parameters (Height of the slope vertical angle of the studied slope Alpha and the
horizontal angle of the slope Beta) as shown in Figure 44 on factor of safety and critical
slip surface
3- Compare the results of the different analysis software programs of slope stability in this
thesis
4- Correlate the relationship between parameters of soil strength and slope geometry and
critical slip surface and obtain a numerical equations about the relation between failure
arcrsquos length and soil strength parameters
14 The Shear Strength Parameters as Input Data
Cohesion unit weight and internal friction angle are the shear strength parameters were
chosen as input for software the reason can be mainly explained as
a- Main soil properties and altering each of them is possible in real life not only by
software packages but by many methods (eg injections) which it happened in two areas in
Hong Kong Fung Fae Terrance and Thorpe Manor (Fredlund 1987)
b- Cohesion (c) internal friction angle (Oslash) and soil unit weight (ɤ) are the interpolation of
the software used in this study
c- Cohesion internal friction angle and unit weight are the only factors affecting the length
of failure arc (Naderi 2013)
d- The increase of C Oslash positively affect FOS on the other hand increasing of unit weight
decrease Factor of Safety FOS so it will be a combination of decreasing and increasing
FOS and soil parameters Realizing the range can change each of these parameters which it
will help in predicting the situation in real life
5
15 Common Causes of Slope Failure
To determine where to start the prevention of slope failure in the property first of all we
need to take the time to understand the factors that lead to slope failure All things
considered slope restoration is definitely not a one size fits all arrangement Each slope is
diverse with regards to geography soil creation vegetation and several other variables
Therefore for any slope stability strategy to viably prevent the risk of avalanches and
mudslides it ought to be tailor-fit to the slope on which it is to be implemented on and the
factors of the instability of such a slope Here are some of the common reasons of slope
failure
151 Steepness of the slope
Its known that the steeper a slope is the more volatile it becomes Its valid for making
sand castles and its valid for making hillside homes The natural response of steep slopes
is to move a portion of its materials downwards until it achieves a natural angle of repose
Any type of slope adjustment regardless of whether it is through natural methods for
example a stream undercutting the banks of a river or by laborers expelling an area of the
slopes base to construct streets will affect the slopes stability (Sinai 2012) Figure 11
shows a steep slope in Northern Cyprus
Figure 11 Steepness of the Slope (Guumlzelyurt-Cyprus)
6
152 Water and drainage
Water is denser than air multiple times Amid overwhelming downpours when the water
replaces air between the grains of soil the earth in slopes turns significantly heavier
This turns into an issue when the earth is being kept down by a retaining wall at its base In
particular if the heaviness of the earth behind the retaining wall surpasses the retaining
wallrsquos capacity limit the retaining wall will collapse in a disastrous deluge
And likewise water decreases grain-to-grain contact which lessens the cohesiveness
Beside changes in the groundwater fluid weight in slope rocks amid the rainy season water
saturation increases downslope mass movementrsquos probability
153 Soil composition
The structure of the slopes soil is an imperative factor with regards to preventing slope
failure Distinctive sorts of soils will have altogether different qualities with regards to
frictional resistance from erosion and cohesion among the grains For example loose soil
or sand has low cohesion and will effectively erode when immersed in water Soils that
have a lot of clay then again will in general enlarge when saturated by water this makes
them heavier and progressively tends to motion (Aaron amp Mcdougall 2019)
154 Vegetation
The quantity and type of vegetation in a slope is also proportional to that slopersquos strength
Vegetation (especially its roots) holds the soil in position and makes it more erosion
resistant The more widespread of vegetation the more roots are so the more it can hold the
soil in position The more vegetation there is also the more steady the slope is probably
going to be This is the reason behind why slopes that have had their vegetation removed
or annihilated by fires are prime reason for slope failures in the rainy season (Huvenne
Croker amp Henriet 2002)
7
155 Bedding planes
A bedding plane is fundamentally a surface that isolates a stratified rock layer or bed from
another layer (Mercier et al 2017) It seems like margarine spread between two pieces of
bread because of their nature there is also a high risk of slope failure in exposed beds in a
slope This risk is exacerbated if the bed contains a weak rock layer sandwiched
Imagine placing a glass panel on a slide and a block of wood on top of it to illustrate The
surfaces of contact between the slide glass and wood are angled downward bedding
planes Although the frictional force that keeps the block of wood on the glass strong the
connection of glass slide is weak causing the whole structure to erode downwards (Sinai
2012)
156 Joints and fractures
Joints and fractures are natural cracks that occur in rocks slope These are caused by
natural rock expansion due to cooling or erosion-related removal of overlying rocks The
cohesion between the rocks that make up the slope is greatly reduced for these cracks
increasing the likelihood of a slope landslide (Aaron amp Mcdougall 2019)
157 Sudden shocks
Finally sudden shocks such as hurricanes earthquakes blasting heavy truck passage
volcanic eruptions and others can trigger soils sudden mass movement in the slopes
(Mercier et al 2017)
8
16 Types of Slope Failure
161 Planar failure
Planar failure happens when an intermittence hits almost parallel to the seat of the slope
and the slope of the seat converges at a lower point allowing the material to slide over the
irregularity as shown in Figure 12 Variety can arise in the procedure if the slipping plane
is a mixture of joint sets that build up a straight path
Analyzing of a planar failure involves analyzing the slopes geometry and consideration of
two cases
A) Slope with tension crack in the upper face
b) Slope for tension crack in the face of the slope
Figure 12 Planner failure (Louis NY Wong 2014)
162 Wedge failure
The 3D wedge failures happen when two cutouts overlap so that the material wedge
formed over the cutouts can slide out in a way parallel to the intersection line between the
two cutouts It is particularly prevalent in the individual bench scale but may also provide
the mechanism of failure for a large slope where structures are very continuous and
thorough At the point when two cutouts strike at a slant over the slope face and their line
of convergence in the slope the rockrsquos wedge resting on these cutouts will slip down over
9
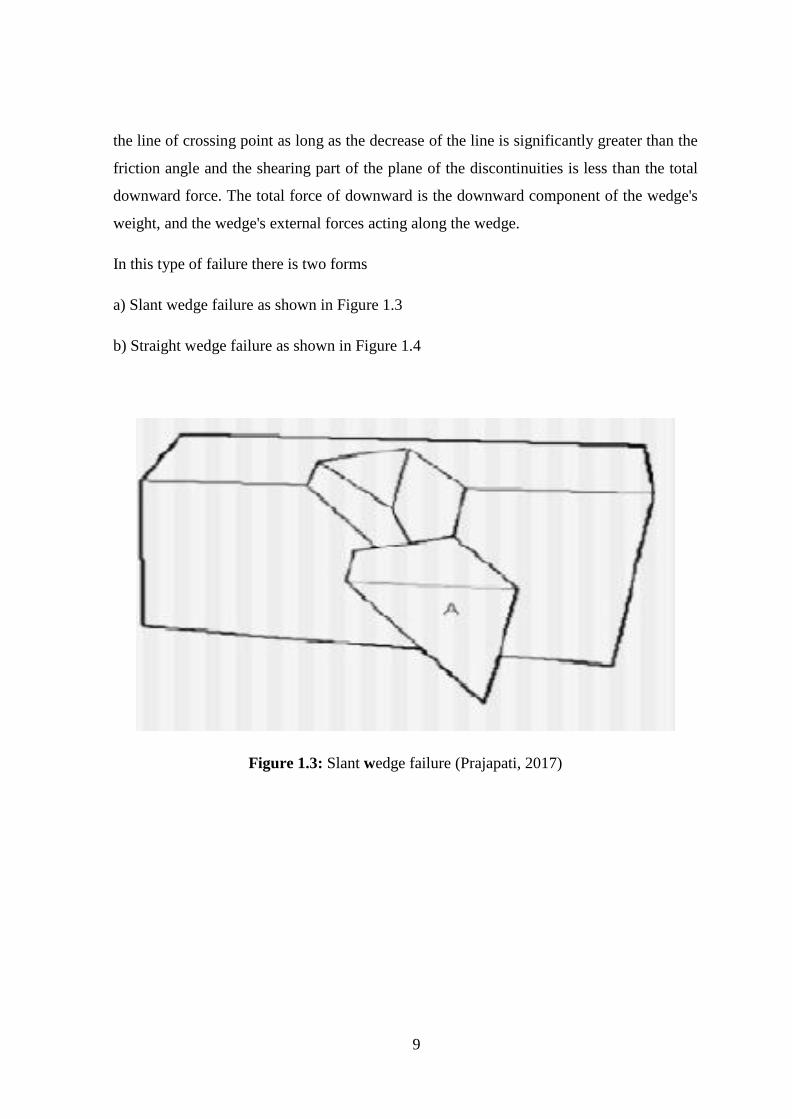
the line of crossing point as long as the decrease of the line is significantly greater than the
friction angle and the shearing part of the plane of the discontinuities is less than the total
downward force The total force of downward is the downward component of the wedges
weight and the wedges external forces acting along the wedge
In this type of failure there is two forms
a) Slant wedge failure as shown in Figure 13
b) Straight wedge failure as shown in Figure 14
Figure 13 Slant wedge failure (Prajapati 2017)
10
Figure 14 Straight wedge failure (Louis NY Wong2014)
163 Circulars failure
The great work in Sweden at the starting of the century assured that the shape of a circular
arc resembles the failure surface in spoil soil slopes or dumps as shown in Figure 15 This
failure may occur in soil slopes when the joint sets are not defined very well the circular
method occurs If the material of the slopes of the spoil dump is weak like soil heavily
joined or broken rock mass a single discontinuity surface defines the failure but tends to
follow a circular path The circular failure conditions are as follows
a When compared to the slope the individual soil or rock mass particles comprising the
slopes are small
b Because of their shape the particles are not locked and tend to behave as soil
11
Figure 15 Circular failure (Louis NY Wong 2014)
Types of circular failure
A) Slope failure in this kind the rupture surface arc meets the slope above the slope toe
this occurs when the angle of the slope is very high and the soil near the toe has the high
resistance
B) Toe failure the rupture surface arc meets the slope of the toe in this kind of failure
C) Base failure the arc of the failure passes underneath the toe and into the slope base in
this type of failure This happens when the angle of the slope is low and the soil under the
base is more plastic and softer than the soil which is above the base
164 Two block failure
These types of failures are significantly less rife way of slope failure of rock than single
square failures for example the planes and the 3 dimensional wedge and thusly are just
quickly thought to be here A few techniques for solution exist and each might be proper at
some dimension of examination
12
Figure 16 Two block failure (Stefano Utili 2015)
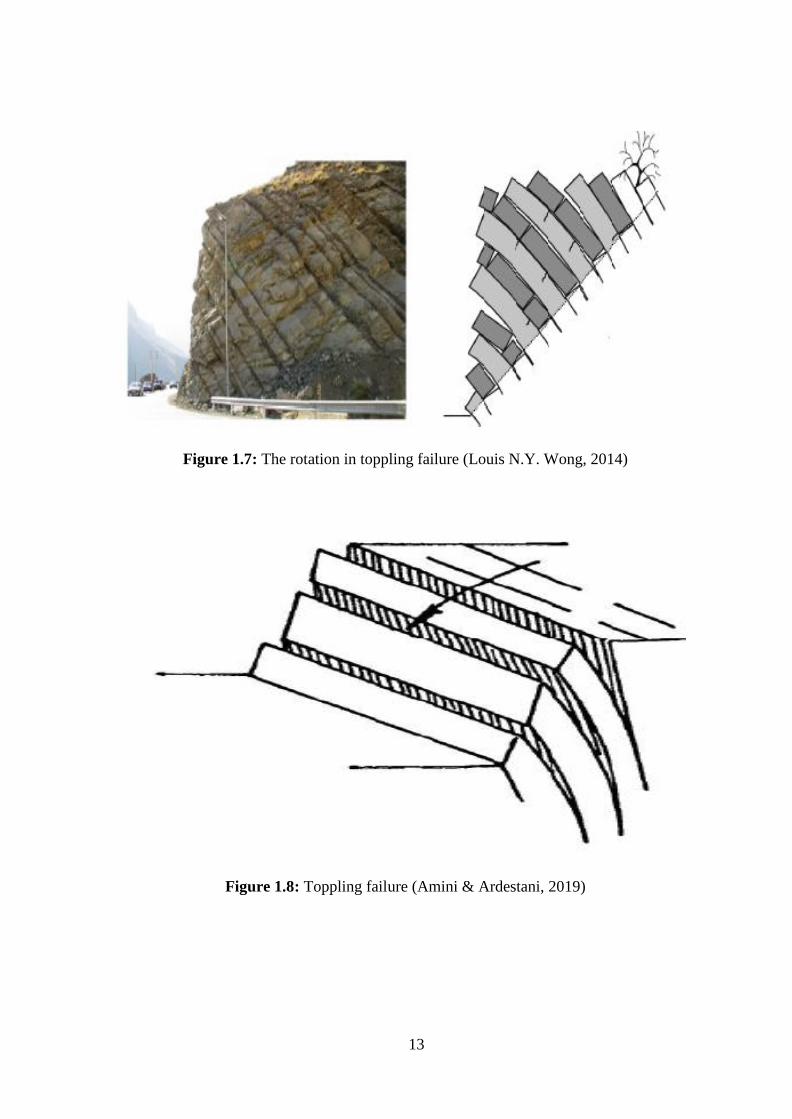
165 Toppling failure
Overturning or toppling was recognized as a mechanism for failure of rock slope by
several investigators and was postulated as the cause of several failures ranging from small
to large Very often stability depends on the stability of one or two key blocks in slopes
with near-vertical joints The system may collapse once they are disturbed or this failure
was assumed to be the reason of several failures ranging from small to massive as shown in
Figures 17 This type of failure involves rotation around some fixed base of rock blocks as
shown in Figure 18 In general when the slopes of the hill are very steep this type of
failure occurred
13
Figure 17 The rotation in toppling failure (Louis NY Wong 2014)
Figure 18 Toppling failure (Amini amp Ardestani 2019)
14
17 Factors Affecting Slope Stability
171 Slope geometry
Height the overall angle of slope and surface area of failure are the basic parameters of the
geometric design of the slope Stability of the slope decreases sharply when the slope
height increases The chances of failure at the rear of the crest increase when the overall
slope angle is increased and it must be considered in order to avoid any kind of ground
deformation at the periphery of the slope structure An overall angle of the slope 45 deg is
considered safe for mines under normal circumstances The slopes curvature also has a
strong impact on the instability Convex slopes section in slope design should be avoided
The slope is higher and steeper the stability is lower
172 Geological structure
The main geological structure in any structure (building mines railways etc) affecting the
stability of the slopes is
1 Dip quantity and direction
2 Zones of shear intra-formational
3 Joints and interruptions
a Reduce strength of the shear
b Permeability change
c Acts as sub-surface drain and failure plains
4 Faults
a Weathering and changing along with faults
b Act as conduits of groundwater
c Provides a likely failure plane
15
If strata dip in the excavations instability may occur Faults provide a very low strength
lateral or rear release plane and therefore the strata are greatly disturbed If there is some
kind of clay or soil band between two rock bands the stability will be greatly impeded
Joints and bedding planes also add weakness to the surface Stability of the slope also
depends on the available strength of the shear along the surface its orientation towards the
slope and the action of the water pressure on the surface The shear strength that can be
deployed along the joint surface based on the surfaces functional properties and the stress
that is transmitted to the surface as normal Joints can make a situation where a
combination of joint sets creates a surface cross
173 Lithology
Rock materials that form a pit slope determine the strength of the rock mass modified by
faulting weathering discontinuities past operations and folding The strength of low rock
mass is characterized by circular stability is restricted by ravelling and rock falling such
as the slope formation in a massive sandstone Pit slopes with weathered rocks or alluvium
on the surface have low shear strength and if water flows through them the strength will
be further reduced These kinds of slopes have to be flatter
174 Ground water
Following modifications the existence of ground water is the reason
a) It alters the parameters of cohesion and friction
b) It decrease the normal stress
It can cause increased thrust or even deriving forces and has a extremely adverse impact on
the stability of the slopes Both physical and chemical effects of water in joints can change
the friction and cohesion of the surface of discontinuity Physical influence decrease the
shearing resistance along a failure plane by elevating reducing the frictional resistance and
the joints so thus decreasing the normal stress
16
175 Dynamic forces
Due to the vibration induced by the blasting process shear stress is increased maximizing
the dynamic acceleration for the material which in turn creates slope plane instability That
accelerates ground motion resulting in rock fracturing Because of the blasting process the
angles of the bench face also increase The impacts of poor blasting methods are caused by
bench instability Because of back break and blast damage these variables also influence
rock mass failure ie bench face angle blasting vibrations Many soft blasting methods
have been implemented to decrease these implications for small-scale slopes In the event
of bigger slopes blasting has less adverse effects on the general stable slope angle due to
back break and blast harm of benches The high frequency waves generated as a result of
the blasting 12 P a g e method ban big rock masses in the displacement method Blasting-
induced defects are therefore a tiny issue for large-scale slopes
176 Internal friction angle
It is the angle between the resulting force and the normal force when the shearing stress
causes the failure to occur Internal friction angle is a measurement of any material capable
of withstanding shear stress amount The factors are responsible about soil grains
roundness quartz content and particle size
17
177 Cohesion
Cohesion is the property of material that measures to resist deforming or breaking force
As a result of the loading process it is also caused by negative capillary pressure and pore
pressure or by electrostatic forces for over-associated clay Slopes with less strength of
cohesion are less stable
Cohesive force factors are
a Friction
b Particular stickiness
c Grains cementation by silica or calcite
d Artificial reinforcement
e Content of water
f Repeated wetting and drying expansion or contraction
g Downhill in slopes
h Earthquake or blast vibrations
18 Factor of Safety
Simply FOS is the ratio of resisting force of driving force F = 119878
120591 (Duncan Wright amp
Brandon 2014) or ratio of shear strength to that needed to keep the slope stable in case
only stable slope without any structure on it
The collapse of any slope is due to the inability of the shear resistance of the sliding block
to overcome the shear stresses Safety action is the value through which the stability state
of the slopes is checked
As it is mentioned before there are two types of slopes soil slopes and rock slopes In this
study the soil slopes are modeled and analyzed but rock slopes will be discussed as well
Analysis of rock slopes stabilization is a branch of rock engineering that is extremely likely
to be treated with probabilism Probabilistic assessment of rock slope stabilization was
18
used as an efficient tool for assessing uncertainty in variables and gained significant
attention in the literature
Figure 19 illustrates planar sliding rock slope and its parameters The equation for
determining the factor of safety can be articulated for this type of sliding failure as
FOS =cA+(W(cosψpminusα sin ψp)minusUminusFwsinψp)tanOslash
W(sin ψp+α cos ψp)+Fw cos ψp )11)
Z = H(1-radic119888119900119905120595119891 119905119886119899120595119901 ) )12)
W =1205741198672
2[(1- (
119885
119867)2) 119888119900119905120595119901 minus cot 120595119891 )13)
U = 120574119908119885119908119860
2 )14)
Fw=120574119908119885119908
2
2 )15)
A=119867minus119885
119904119894119899120595119901 )16)
Figure 19 Rock slope geometrical definition with plane slipping (AJohari et al
2013)
Where
FOS the factor of safety contra slipping
19
Z tension crack depth
Zw water in tension crack depth
A wedge area
W rock wedge weight resting on failure surface
H the overall height of the slope
U uplift force due to water pressure for failure surface
Fw the horizontal force for water in crack a is the acceleration of horizontal earthquake
C cohesive strength over sliding surface
Oslash sliding surface friction angle
ψp failure surface angle ) measured from horizontal(
ψf slope face angle )measured from horizontal(
γr rockrsquos unit weight
γw water unit weight
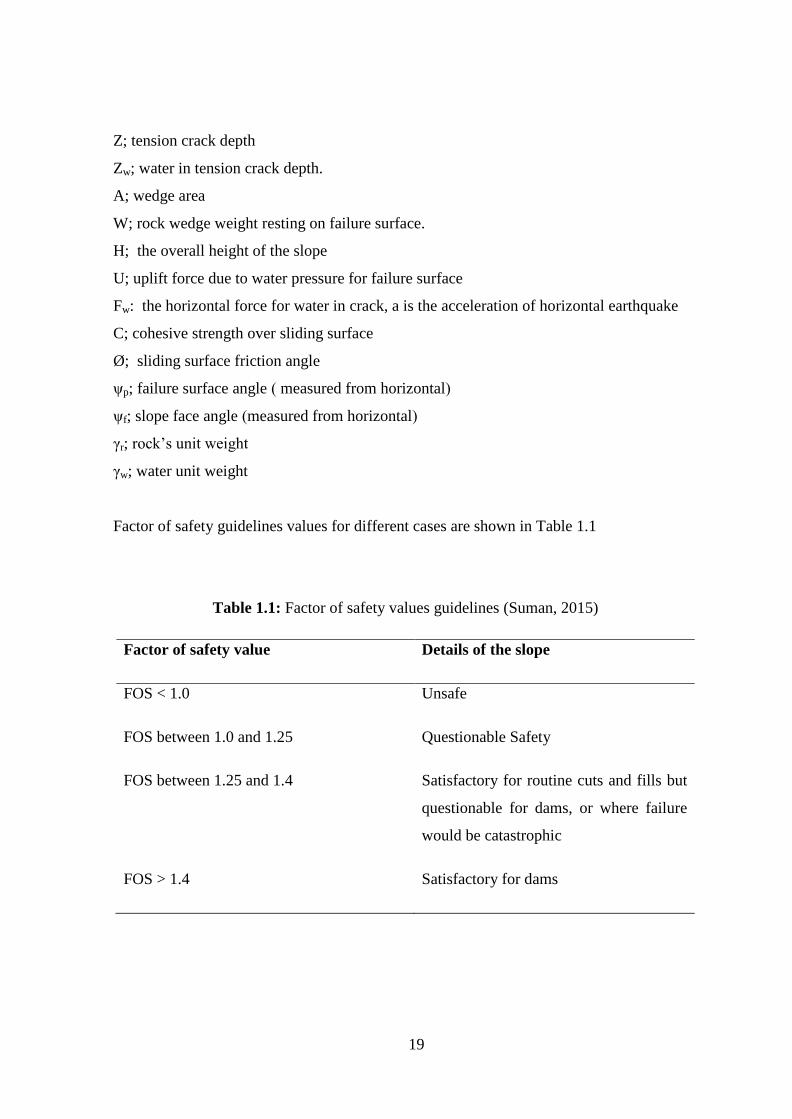
Factor of safety guidelines values for different cases are shown in Table 11
Table 11 Factor of safety values guidelines (Suman 2015)
Factor of safety value Details of the slope
FOS lt 10 Unsafe
FOS between 10 and 125 Questionable Safety
FOS between 125 and 14 Satisfactory for routine cuts and fills but
questionable for dams or where failure
would be catastrophic
FOS gt 14 Satisfactory for dams
20
For extremely unlikely loading conditions factor of safety can be as small as 12-125
even for dams Eg situations based on seismic impacts or where the water level in a
reservoir is rapidly declining (Suman 2015)
Mitchell et al 1993 and Duncan (1992) found that factor of safety which calculated by
using 3D analyzes will always be higher than or equal to the factor of safety calculated by
using 2D analyzes There are various methods for formulating factor of safety usually each
of the techniques of analysis has its own formula for FOS but the most popular formula
assumes that the FOS is constant and can be divided into two types Moment equilibrium
and Force equilibrium (Cheng amp Lau 2008)
21
19 Organization of Thesis
This thesis is made up of 5 chapters
Chapter 1 This chapter gives the general information regarding slope stability in addition
to its factors types and common cases of slope failure The aims objectives scope and
limitations of research are also stated
Chapter 2 This chapter presents literature review which it discussed stability of the slope
analysis methods a general view about infinite slopes and slip surface seeking approaches
comparison between slope stability analysis methods relationship between soil strength
parameters location of failure surface and overview about some previous studies about 2D and 3D
analyzing methods
Chapter 3 This chapter is the methodology which it introduces and discusses software
programs and methods that were used in this thesis
Chapter 4 This chapter presents the results of thesis which it studies the effect of each soil
strength parameter cohesion unit weight and internal friction angle (c γ and ϕ) on the
factor of safety FOS both together and separately In the first part of this study in order to
determine the trend of changes in FOS and failure surface the number of models have
been studied is limited and in the second part to find an accurate relationship between the
strength parameters of soil and the surface of failure various number of models were
analyzed After all the models were generated and analyzed figures were drawn to show
the effects of the variables on factor of safety and failure surface In addition the reasons
for these different behaviors were discussed
Chapter 5 This chapter presents the conclusions and recommendations for future actions
to be taken
At the end in the references part the resources used for this study are presented
22
CHAPTER 2
LITERATURE REVIEW
21 Introduction
In this part a studies will be presented on stability of the slope analysing methods a
general view about infinite slopes and slip surface seeking approaches and relationship
between soil strength factors and location of failure surface
As it has mentioned recently therersquore two types of slopes
Finite slopes
Infinite slopes
22 Infinite Slopes
This part shows the similar infinite slopes development descriptions and equations of
different cases to calculate FOS for infinite and long slopes The reason this study stems
from a renewed interest in the dynamics of deep landslides and the require for a more
basic method to long slope studies for depth variation in soil properties The Standard
utilize of infinite slopes equations for both cohesive and frictional soils provides a factor
of safety Assuming a critical failure plane and a homogeneous soil profile parallel to the
surface of the soil at the full depth of the soil (Griffiths et al 2010)
Some of the earlier studies on this topic concentrated on shear stress mechanisms
and stress in an infinite slope and also analysing of displacements and strains 1D and 2D
More specific (Runesson amp Wiberg 1984) and (Wiberg 1990) presented a finite element
method to infinite slopes on the basis of the principle of strain softening behavior and limit
equilibrium Another group of researchers like (Iverson (1990 and (Bromhead amp Martin
2004) found the impact of streams of groundwater and lateral (3D) streams on landslides
and estimated the effect of infiltration on surface slope stability using an infinite slope
analysis (Cho amp Lee 2002) and (Tsai amp Yang 2006) More previously (Yang 2007)
23
considered the impact of horizontal acceleration on land slide seismic stability through the
equations of slope stability
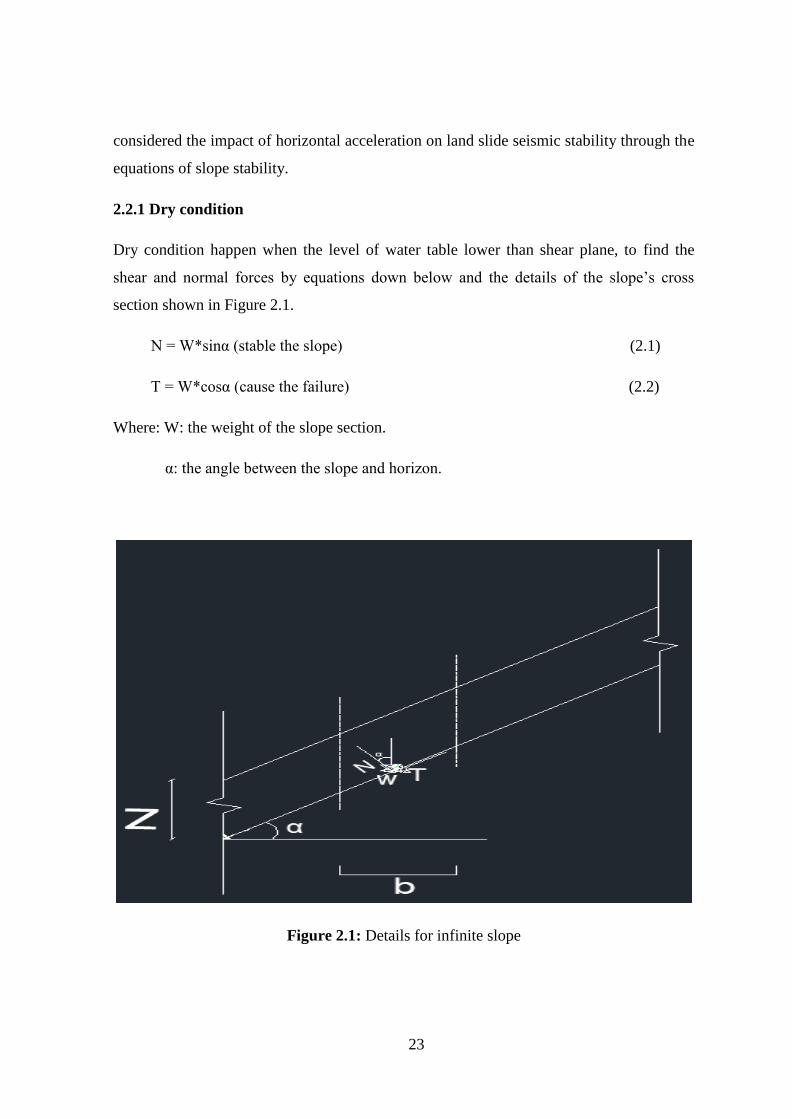
221 Dry condition
Dry condition happen when the level of water table lower than shear plane to find the
shear and normal forces by equations down below and the details of the slopersquos cross
section shown in Figure 21
N = Wsinα (stable the slope) (21)
T = Wcosα (cause the failure) (22)
Where W the weight of the slope section
α the angle between the slope and horizon
Figure 21 Details for infinite slope
24
W = ɤA = ɤbZ (23)
Ơ = 119873
119860 =
ɤlowast119887lowast119911lowast119888119900119904α119887
119888119900119904αlowast1
= ɤ Zcos2α (24)
Ꞇ = 119879
119860 =
ɤlowast119887lowast119911lowast119904119894119899α119887
119888119900119904αlowast1
= ɤZsinαcosα (25)
A is the area resist the collapse
The max stress soil can resist is Ꞇr = C + ơ tanOslash = C + ɤ Zcos2αtanOslash (26)
FOS = C + ɤlowast Zlowastcos2αlowasttanOslash
ɤlowastZlowastsinαlowastcosα (27)
FOS = C
ɤlowastZlowastsinαlowastcosα +
tanOslash
tanα this formula for C-Oslash soil
For Oslash-soil (C=0) FOS = tanOslash
tanα (28)
This formula is very important for site work because by finding the internal friction angle
of the soil needed to build on we can determine the slope angle by giving the factor of
safety value of 1 so the slope angle (α) will be equal to internal friction angle Oslash
222 Condition with seepage
FOS for infinite slopes in seepage case is the same of dry case but multiplied by the value
ɤ(sub)
ɤ(sat) as presented in equations down below
FOS = C
ɤlowastZlowastsinαlowastcosα +
tanOslash
tanα
ɤ(sub)
ɤ(sat) (29)
Example by giving specific gravity Gs and water content Wc to find void ratioe use the
equation
eSr = GsWc (210)
since the soil is saturated Sr = 1 so we can determine the value of e
Then find ɤsat and ɤsub by the formulas
ɤsub= ɤsat- ɤ (211)
25
ɤsat = 119866119904+119890
1+119890ɤw (212)
23 Finite Slopes
There are numerous methods available to select from and use to analyze the slope stability
As nowadays no method of analysing is prioritize atop other methods so the engineer is
entirely responsible for the reliability of any solution (Albataineh 2006)
The techniques are divided in two main types according to their procedure
Limit equilibrium methods
Finite element methods
231 Difference between LEM and FEM
Although limit equilibrium techniques are easier to utilize consumes less time and is
useable for hand calculations the limitations arises when it comes to calculating forces
specially in the slopersquos parts that localized stress focusing is high so because of the
limitations factor of safety in limit equilibrium techniques become a little higher (Arryal
2008 Khabbaz Fatahi amp Nucifora 2012) furthermore some executors think that finite
element techniques are more powerful especially in states with compound conditions
(Duncan 1996)
While also many of the executors think that the outputs of LEM and FEM are almost the
same (AzadmaneshampArafati 2012 Wright G 1969 Wright Kulhuwy amp Dumcan 1973)
also Chang thinks this convention except phi that is greater than 0 (Chang Lansivara amp
Wei 2007) Although both LEM and FEM have their disadvantages and advantages
neither of them are routinely analyzed is ascendant to the other one (Cheng Lansivara amp
Wei 2007) Each one of those techniques are divided into two groups depend on their
numbers of dimensions to two dimensional methods and three dimensional methods
26
232 Finite element methods
The FEM is a numerical analysing method to obtain accurate solutions for various
engineering troubles although it had originally been developed to be used `in the study of
stresses on structures of complex aircraft structures(Oghli 2011) but from that time it has
been developed to be widely applied in different engineering fields
Although the finite element method appeared in 1960 when it was used before by Clough
to solve flat flexibility issues the ideas of finite element analysis date back to a date
beyond In 1943 Variant Courant used the Vibrational methods then in 1956 Martin Topp
and Clough used the finite element method for calculating stiffness (Oghli 2011)
Analysis using finite element method
Finite element analysis depends on the following idea that any complex form can be
divided into a group of small elements to make it easy to deal with a very simple and
common idea used everywhere in the working life as in engineering
The solution is using the finite element method by following the steps
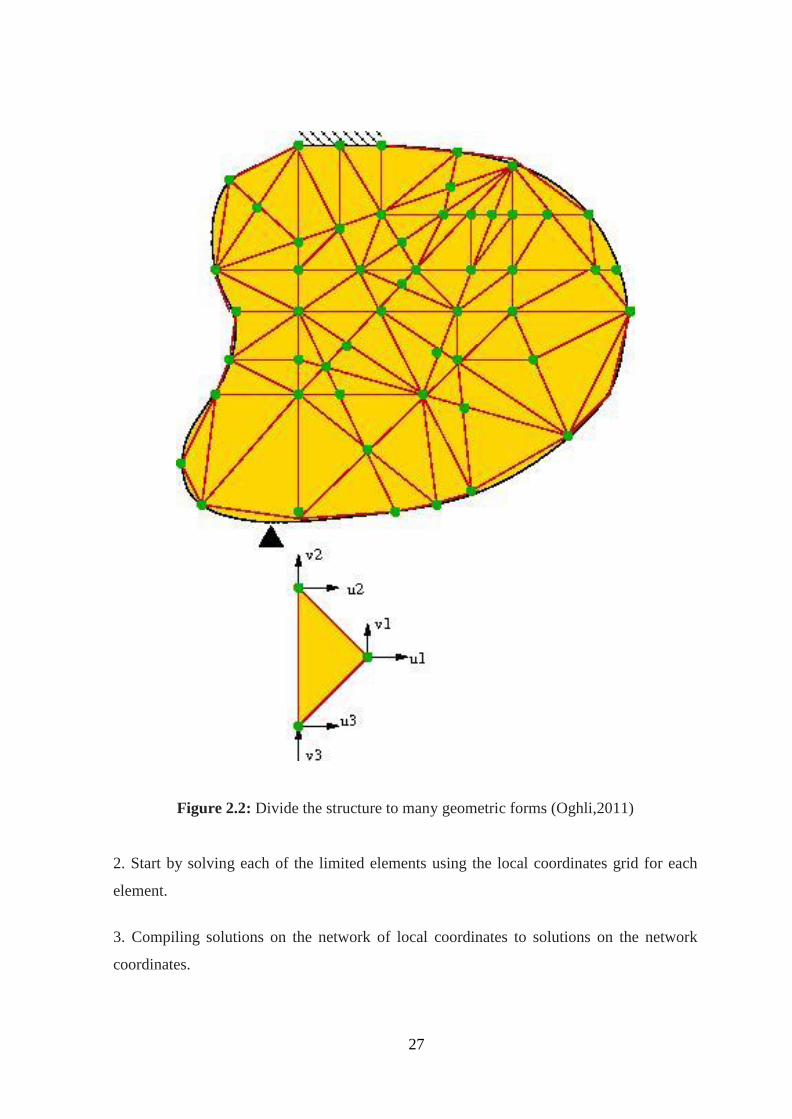
1 Divide the structure to be studied using the finite element method to a number of the
limited geometric forms as shown in Figure 22
27
Figure 22 Divide the structure to many geometric forms (Oghli2011)
2 Start by solving each of the limited elements using the local coordinates grid for each
element
3 Compiling solutions on the network of local coordinates to solutions on the network
coordinates
28
4 Checking solutions If the solutions are not convergent the 2 and 3 steps must be
repeated
5 Evaluating the solution when solutions converge
Before starting the solution it is necessary to define the element a small piece of body that
is characterized by
a- Elementsrsquos type if the element is structure span pillar or slope
b- Elementsrsquos dimensions if it is a linear element one deminsional1D such as spring
triangle and tube Or a standard element (2D) such as cortical plate membrane Or
a volume element (3D) such as finding transitions stresses and flow velocity
c- The number of degrees of freedom for each nodes transitions androtations
d- The shape of the element
Finite element technique uses a similar mechanism of failure to limit equilibrium methods
and the major difference between those procedures is the use of FEM capacity which does
not require simplification of the presumptions
In general this procedure firstly proposes a slip surface failure and then FOS which will
be calculated is implemented to compute the ratio of usable forces of resist to the deriving
forces
There are two more useful methods of FEM
Shear reduction method
Increase gravity method
Shear reduction method (SRM)
Since the factor of safety doesnrsquot defined by a single definition the most important one is
the definition it presented by Duncan (1996) which it ldquothe ratio of actual shear resistance
to the minimal shear resistance that necessary to prevent breakdownrdquo or the factor that
makes the shear resistance fall to the point where the slope becomes the edge of the
29
failure
Shear reduction method (SRM) based on the slope stability analysis studied using the
method of finite elements which depends on the analysis of the stresses and displacements
of the slope by reducing the shear resistance values from cohesion and friction (Oghli
2011)
The slope will reach a point where it cannot be achieved analysis of its stability using finite
element method where the transitions will be large on the slope and the collapse of the
slope will occur therefore we will get the value of FOS of the modeled slope without the
need to determine the shape or the surface of the sliding surface as well as the side forces
affecting the slides and slopes
In SRM the soil strength parameters will be reduced till the slope fall so the FOS become
the ratio between real strength parameters and critical parameters The factor of safety
definition in SRM is the same as that of limit equilibrium method (Griffiths amp Lane
1999)
Increasing gravity method is more frequently favored to test the slope stability in the
construction cases as its results are more credible meanwhile SRM is more effective to
test the existed slopes (Matsui amp San 1992)
Gravity increase method
In this method gravity forces increases little by little until slope fails This force value is
called the failure gravity 119892119891
Factor of safety in this method is the proportion of failure gravitational acceleration and the
actual acceleration of the gravity (Swan amp Seo 1999)
FOS = 119892119891
119892 (213)
When gf The raised gravity at the failure level
g The main gravity
30
233 Limit equilibrium methods
As it has mentioned before there are two types of methods two-dimensional methods and
three dimensional methods and since this study work on two dimensional methods so will
start with it
Two dimensional methods also subdivided in three different groups
1 Circular Methods
2 Non-Circular Method and
3 Methods of Slices
Circular methods
Swedish circle
The Swedish Circle method is the simplest procedure used in analyzing the short term
stability of slopes disrespect to its inhomogeneous or homogeneous state
This is a method that analyze the slopes stability by considering two simple assumptions a
rigid cylindrical block of soil can fall by rotating round its center with assuming Phi is 0
For that the only resist moment or force is going to be the cohesion and the driving
moment simply will be cylindrical failure soilrsquos weight
From this method the FOS was defined as ratio of resist (holding) force over driving force
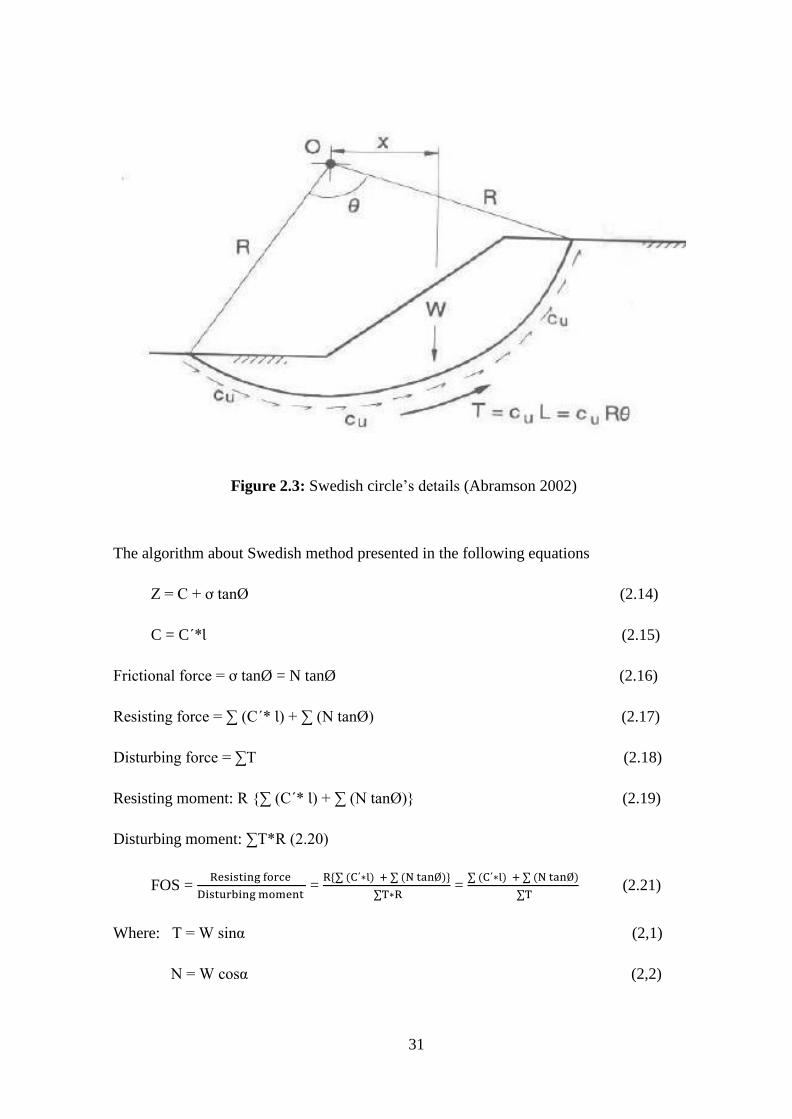
(Abramson 2002) The figure 24 demonstrates the holding forces and driving forces
applying on the soil block
31
Figure 23 Swedish circlersquos details (Abramson 2002)
The algorithm about Swedish method presented in the following equations
Z = C + ơ tanOslash (214)
C = C´Ɩ (215)
Frictional force = ơ tanOslash = N tanOslash (216)
Resisting force = sum (C´ Ɩ) + sum (N tanOslash) (217)
Disturbing force = sumT (218)
Resisting moment R sum (C´ Ɩ) + sum (N tanOslash) (219)
Disturbing moment sumTR (220)
FOS = Resisting force
Disturbing moment =
Rsum (C´lowastƖ) + sum (N tanOslash)
sumTlowastR =
sum (C´lowastƖ) + sum (N tanOslash)
sumT (221)
Where T = W sinα (21)
N = W cosα (22)
32
FOS = sum (C´lowastƖ) + sum (WcosαtanOslash)
sumW sinα (221)
The friction circle method
This procedure was developed in order study of homogeneous soils with internal friction
greater than 0 In this procedure the resulting shear strength (frictional and normal forces)
affect on the failed slip surface to form which is named as friction circle (FC) with a
radius of Rf Figure 26 demonstrates the FC Rf could be deduced by using the equation
below (Abramson 2002)
Rf = R sin Oslashm (221)
Where R radius of failure circle
Oslashm the affected friction angle could be computed by using
Oslashm=tanminus1 Oslash
119865Oslash
(222)
Where 119865120593 is factor of safety contra the resistance of friction
This precedure utilizes a repetitive computation Abramson et al (1996) recommended the
following methodology to find FOS
1) Finding out the slip weight (W)
2) Finding out the greatness and direction of the resultant pore water pressure (U)
3) Finding out the perpendicular length to the actionrsquos line Cm Rc that could be found
using
Rc=119871119886119904119904119904119903119888
119871119888ℎ119900119903119889 119877 (223)
The lengths are these the lengths of circular cord and arc define the mass of failure
4) Computing the effective weight resulting from U and W forces and the intersection of
33
Cm at A
5) Assuming a value for 119865120593
6) Calculating 120593119898
7) Using to draw the frictional angle
8) Drawing the polygon force with w suitably raised and pass over A
9) Drawing the direction of P resulting from the friction circles frictional and normal
forces tangential
10) Drawing Cm direction according to the chord inclination joining the end points of the
surface of the FC
11) Then the closed polygon gives the value of Cm
12) By finding the value of Cm finding the value Fc
F= 119888119871119888ℎ119900119903119889
119862119898 (224)
34
Figure 24 Friction circle method (Abramson 2002)
35
Non circular methods
Log spiral procedure
In this method the failure surface will be assumed and use the equation below to deduce
the radius to have a logarithmic composition
r = r0eθ tan
Oslashd (225)
Where 1199030 The initial radius
120579 Angle between r and 1199030
120593119889 The transposal Phi
The normal and shear strengths on the slip can be computed using the equations below
τ = 119862
119865 + σ
tanOslash
119865 (226)
τ = cd + σ tan Oslashd (227)
Where c 120593 the shear strength parameters
119888119889 120593119889 the developed friction angle and cohesion
F factor of safety
Assuming this particular shape shown in Figure 28 frictional force and normal force will
pass from the center of the spiral so there will be no momentum about the center The
developed cohesion and soil weight will therefore be the only moment producing forces
Having the developed friction presented in the r equation (225) This procedure is also a
repetitive process therefore to achieve a FOS that satisfies the formula (J Michel Duran amp
Wight 2005) several trials should be done
36
F =119862
119862119889=
119905119886119899120593
119905119886119899120593119889 (228)
Figure 25 Log Spiral procedure (Duran and Wight 2005)
In this procedure knowing the slip fail surface is very influential cause the method begins
by finding a center of the spiral and an R0
37
Methods of slices
In this method soil density over the fail area will be subdivided in many slices vertically
and the balance of every slice will be studied individually However the splitting of a
static trouble in many parts doesnrsquot make it statically found therefore to make it solvable
an assumption is needed These methods will be distinguished by classifying these
hypotheses
Again the important issue here is that knowing the surface of failure is important in these
methods as those techniques are primarily focused on the soil mass division of the slip
Number of more realistic techniques for this sort would be discussed
Ordinary method of slices
This method assume this the resulting inter slice forces in every vertical slice are parallel
to their basement and are therefore ignored and satisfied only at the balance moment
Researches (Whitnan Baley 1967) showed that FOSs computed using this technique is
sometime as conservative as 60 compared to more accurate techniques so this
procedure isnrsquot much used nowadays
In order to the slice shown in Figure 29 the Mohr Coulomb fail criterion is
s = crsquo+[σ ndash u] tanOslashprime (229)
Use FOS 119905 = 119904 119865 119875 = 119904 times 119879 = 119905 times 119897 the formula becomes
T = 1
119865[c´ l+ [P ndash ul]] tanOslash´ (230)
Having neglected inter slice force leads to make the normal forces at the basement of the
slice as follows
P = w cos α (231)
Where w the weight of slice
120572 the angle between center of slide base tangent and the global
38
vertical
The moment will be around the center of the shape of the slope failure
sum W R sin α = sum TR (232)
Therefore
FOS = sum(c
prime
l+wlowastcos αminusullowasttan Oslashprime)
sum Wlowastsin α (233)
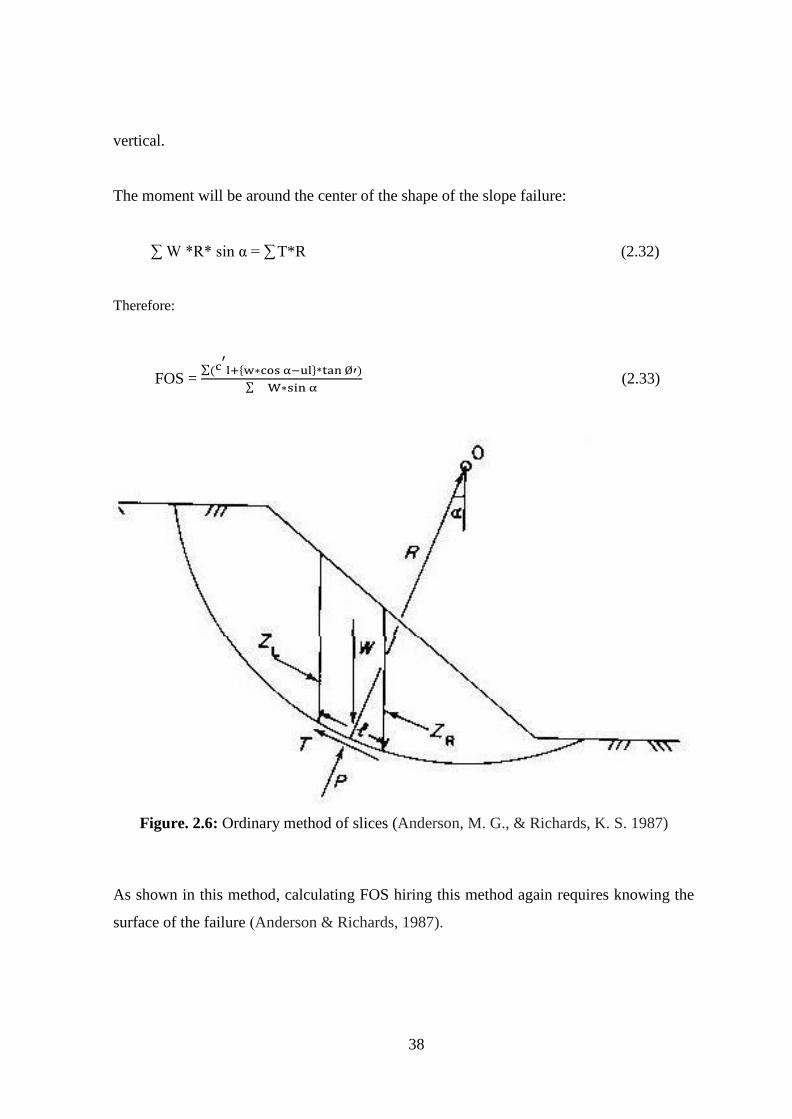
Figure 26 Ordinary method of slices (Anderson M G amp Richards K S 1987)
As shown in this method calculating FOS hiring this method again requires knowing the
surface of the failure )Anderson amp Richards 1987)
39
Simplified bishop method
By using this technique to find FOS we assume the fail occurs as shown in Figure 210 by
rotating the soil circular mass Meanwhile the forces in-between all the slices are regarded
horizontally between them there is no active shear stress Each slicersquos normal force (P) is
supposed to behave on the center of every base Using equation this stress can be
calculated
P = [Wminus1F(cprimelowastllowastsinαminusullowasttanOslashprimelowastsinα]
Ma (234)
Where
Ma = cosα +(sinαlowasttanOslashprime)
F (235)
By taking moment around the center of circle
F = Σ cprimelowastllowastcosα+(wminusullowastcosα)tanOslashprime
cosα+(sinαlowasttanOslashprimeF) ΣWsin (236)
This forces us to solve it iteratively As the equation demonstrates F is on both sides This
method is generally fast and gives-out a relatively accurate response with a 5 variation
in FEM so it is appropriate for hand computations (Andresen and Richard 1987)
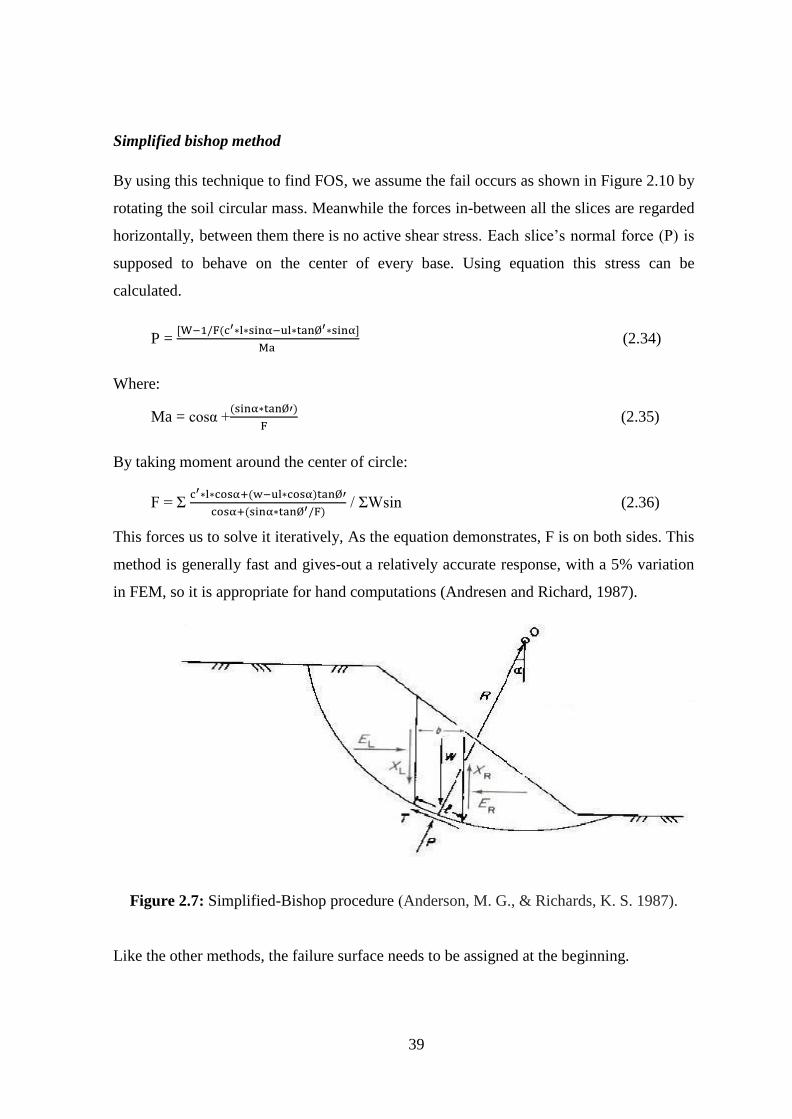
Figure 27 Simplified-Bishop procedure )Anderson M G amp Richards K S 1987)
Like the other methods the failure surface needs to be assigned at the beginning
40
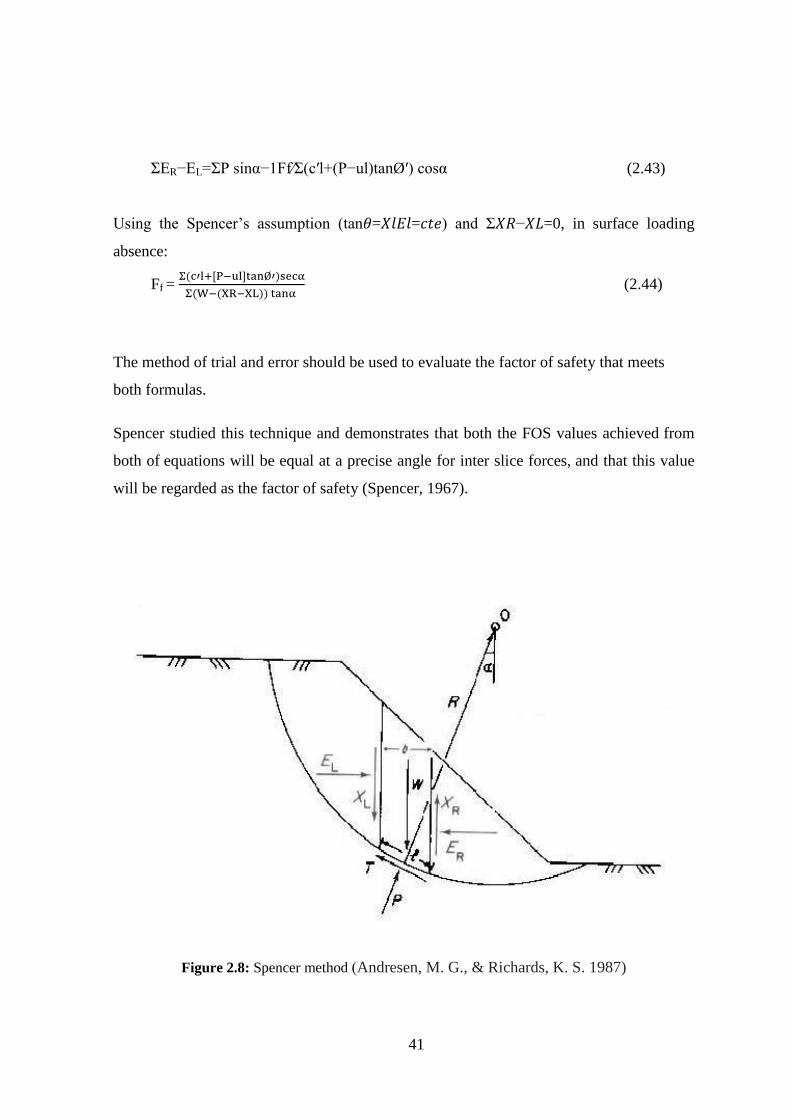
Spencer method
Even though the Spencer technique was described for the surface of circular failure by
assuming a frictional center of rotation it was easily extended for non - circular slips They
will have the same tendency by assuming parallel inter slices forces
tan θ = 1198831
1198641 =
119883119903
119864119903 (236)
Where 120579 the angle of the inter slices forces horizontally
The force at the base of the every slice is going to be as below by the summation of forces
perpendicular for the inter slices
P= Wminus(ErminusEl)tanθminus1F(cprimelsinαminusultanOslashprimesinα)
mα (237)
Where
mα = cosα (1+tanα tanOslashprimeF) (238)
Two different factor of safetys will be extracted by supposing the total moment and force
equilibrium in Figure 210 this is due to the over-specified maximum assumptions
From the moment of equilibrium to find FOS by taking moment around O
ΣWRsinα = ΣTR (239)
Where
T= 1
119865 (cprimel+(pminusul)tanOslashprime (240)
Fm=Σ(cprimel+(pminusul)tanOslashprimeΣWsinα (241)
FOS from force equilibrium while Σ1198651198670=0 in consideration
TcosαminusPsinα+ERminusEL=0 (242)
41
ΣERminusEL=ΣP sinαminus1FffraslΣ(cprimel+(Pminusul)tanOslashprime) cosα (243)
Using the Spencerrsquos assumption (tan120579=119883119897119864119897=119888119905119890) and Σ119883119877minus119883119871=0 in surface loading
absence
Ff = Σ(cprimel+[Pminusul]tanOslashprime)secα
Σ(Wminus(XRminusXL)) tanα (244)
The method of trial and error should be used to evaluate the factor of safety that meets
both formulas
Spencer studied this technique and demonstrates that both the FOS values achieved from
both of equations will be equal at a precise angle for inter slice forces and that this value
will be regarded as the factor of safety (Spencer 1967)
Figure 28 Spencer method )Andresen M G amp Richards K S 1987)
42
And again it is important to have the correct surface of failure in this method
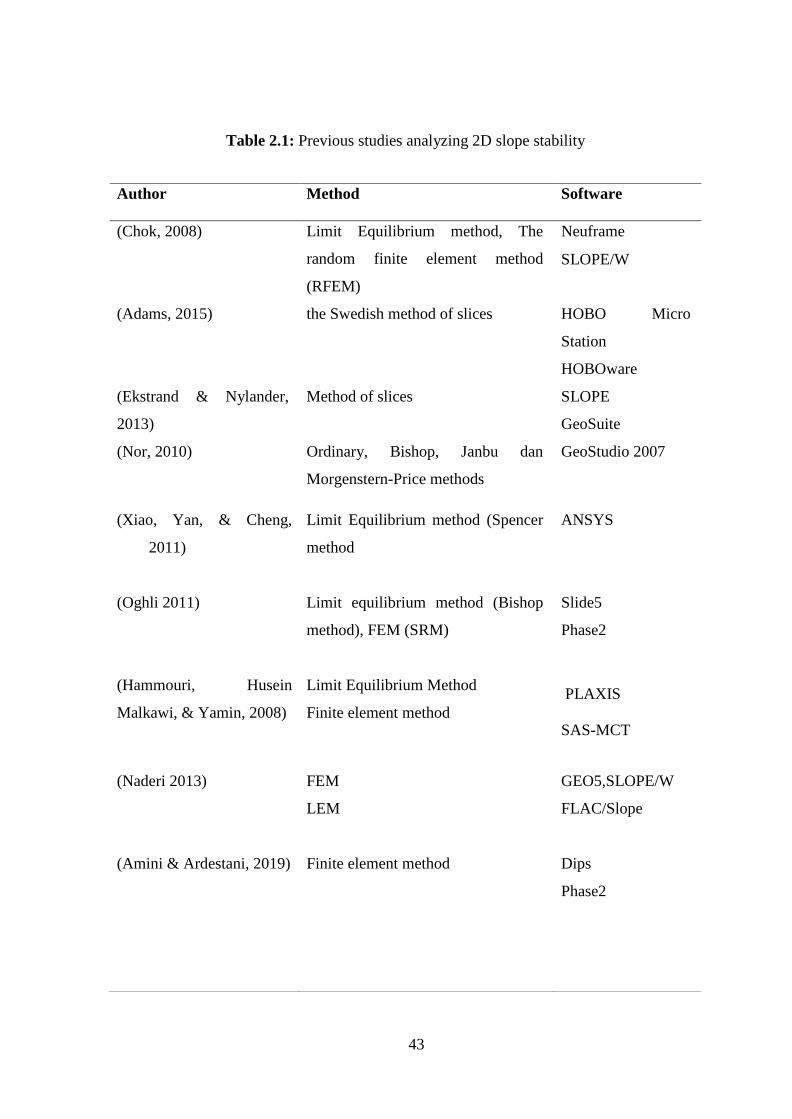
234 Previous studies on analyzing 2D slope stability
Table 22 shows some studies on 2D slope stability analyzing have done by researchers
and students
43
Table 21 Previous studies analyzing 2D slope stability
Author Method Software
(Chok 2008) Limit Equilibrium method The
random finite element method
(RFEM)
Neuframe
SLOPEW
(Adams 2015) the Swedish method of slices HOBO Micro
Station
HOBOware
(Ekstrand amp Nylander
2013)
Method of slices SLOPE
GeoSuite
(Nor 2010)
Ordinary Bishop Janbu dan
Morgenstern-Price methods
GeoStudio 2007
(Xiao Yan amp Cheng
2011)
Limit Equilibrium method (Spencer
method
ANSYS
(Oghli 2011) Limit equilibrium method (Bishop
method) FEM (SRM)
Slide5
Phase2
(Hammouri Husein
Malkawi amp Yamin 2008)
Limit Equilibrium Method
Finite element method
PLAXIS
SAS-MCT
(Naderi 2013) FEM
LEM
GEO5SLOPEW
FLACSlope
(Amini amp Ardestani 2019)
Finite element method Dips
Phase2
44
Author Method Software
(Kang Han Salgado amp
Li 2015)
Monte Carlo simulation
Gaussian process regression (GPR)
MATlab
(experiments)
(Suman 2015) LEM FLACSLOPE
Farah Ltifi amp Hassis
2011)
LEM
FEM
-
(Oh amp Lu 2015) LEM
FEM
-
(Widger 1976)
Bishoprsquos simplified method -
(Xing 1988) LEM -
(Zeroual Neacutee Dadouche
Lazhar amp Zennir 2011)
kinematic method of rigid solids
-
(Marquez D V Griffiths
2007)
methods of columns method of
slices
Limit equilibrium method
-
(Li Li Zhang Yang amp
Wang 2015)
Least squares support machine
algorithm
-
45
Chok )2008) focuses on researching and quantifying the impacts on the stability of natural
slopes of soil variation and vegetation The soil variation is quantified by the parameters
called coefficient of variation (COV) and fluctuation scale (SOF) while a slopes safety is
evaluated using failure probability Chok used the ANN and random finite element
method RFEM to explore the COV and SOF impact on the probability of a cohesive slope
failure (ie undrained clay slope) with distinct geometries The findings acquired from the
parametric research are then used to develop probabilistic stability charts These charts can
be used for a preliminary evaluation of a spatially random cohesive slopes probability of
failure
Adams (2015) presented a study by using HOBOware software the objective of his study
was to determine the circumstances on softly sloped terrain resulting in regular slope
instability A perched water table produced by excessive or intense precipitation events
was hypothesized to affect the slope stability in the region and result in intermittent
landslide motion Data collection operations included precipitation surveillance
Measurement of the height and magnitude of the perched water table that used a
piezometer array interpretation of the place and morphology of impermeable boundaries
with radar penetration and assessment of relative slide movements Field measurements
indicate a correlation between the quantity of rainfall received and the shift in height over
the impermeable surface of the water A slope stability analysis was conducted to quantify
the likely stability conditions Conditions leading to slope instability on gentle slopes were
recognized in this research as precipitation falling on soils with high ambient moisture
conditions resulting in a perched water table being formed The height of the perched
water table need for motion is encountered seasonally according to the safety assessment
factor Movement happened slowly because of the gentle slopes
Ekstrand amp Nylander (2013) designed a probabilistic slope stability model The
probabilistic model questions the ordinary assumptions taken when assessing a slopes
stability These assumptions contain the size of traffic loads how to apply water
concentrations and how to calculate the impacts of underlying structures Their research
involves an investigation of the impact on stability measurements of anisotropic clay
characteristics Their study gathered the information needed for the model from Previous
stability studies and soil investigation reports The model was intended with fundamental
46
statistical ideas and Swedish geotechnical guidelines from distinct geotechnical
engineering fields The final result shows which assumptions have the biggest effect on a
slopes calculated stability The findings suggest that underlying buildings and anisotropic
clay behavior are often neglect main factors when it comes to calculating a slopes factor of
safety
Nor (2010) presented in his study which happened in Malaysia sites to Determine the
adequate cost for the slope protection chosen and compare the different slope stability
analysis techniques used and thus His research was conducted using Ordinary Bishop
Janbu and Morgenstern-Price techniques based on two chosen slopes at Lot 4189 Bandar
Tanjong Bungah Jalan Selari Pantai Utara Pulau Pinang The analysis was conducted
using GeoStudio (GEOSLOPE) software The evaluation result showed that the
Morgenstem-Price technique was the realistic and acceptable technique that can be used to
analyze both of the chosen slopes while the Reinforced concrete holding wall provides the
optimum cost for both chosen slopes
Xiao Yan amp Cheng (2011) described an accurate technique that combines LE and
numerical analysis to identify prospective slide surfaces on slopes of soil In this method
the direction of the critical surface at any point in a slope is defined by the use of the
Coulomb strength principle and the extreme concept predicated on the ratio of the shear
strength to the shear stress at that point Once the soil slope stress field is acquired the
ratio which is regarded as an evaluation index can be calculated His paper provides
examples of the feasibility of the suggested technique programmed by macro instructions
in ANSYS software
Hammouri Husein Malkawi amp Yamin (2008) have used the main Both techniques are
used to analyze homogeneous and inhomogeneous slopes taking into consideration the
condition of rapid drawdown tension cracks and undrained clay soils PLAXIS (finite
element technique) and SAS-MCT 40 (limit equilibrium technique) were used to perform
the analyzes Comparison is made between the factor of safety and place of the critical slip
surface acquired from both techniques
Amini amp Ardestani (2019) presented a study after A failure occurred in the Daralou
copper open pit mines north-eastern slope in the 2015 season Geological and
47
geotechnical ground and sub-surface studies explained the mechanism of this instability
Next the latest analytical method for evaluating the static slide-toe-top pling failure has
been updated also new formulas have been made for dynamic failure analysis After that a
computerrsquos code has been developed to test the instability on the basis of the new formulas
The failed slope was analyzed in the next step using the system of code and FE tecnique
and the results of those analyzes have been compared to real conditions The analysis
demonstrated that the theoretical statistical and real tests were satisfactorily accepted
Thus these approaches were used in static and dynamic conditions to expect the final
slopes behavior Such analyses showed this if relocated materials are fully dug up and
taken out of the mine the total dip of the slope will be decreased the final slope gainst
ldquoslide toe toppling failurerdquo will be stable This study summarized the outcomes and
concluded that a slope can be analyzed against the secondary toppling mode by both the
adjusted analytical procedure and the FEM In addition the research shows this resloping
and unloading are two effective approaches that could be used to stabilize the failure
Farah Ltifi amp Hassis (2011) presented a solution of the slope stability problem analysis
procedure and studied slope stability reliability analysis with soil spatial variability By
assuming till yield criteria the elastic soil attitude assessed stresses mobilized through the
slip surface to evaluate the efficiency function and analyzed the outcomes of SFEM
(Stochastic FEM) and the LE method such as the simplified method used by Bishops to
check their efficiency and accuracy They conducted an optimization strategy to search for
critical slip surfaces and also conducted sensitivity studies to examine the impact of
random field variables used in soil spatial variation modeling
Naderi (2013) Used FLACSlope SLOPEW and GEO5 software programs to determine
the critical failure surface analyze the slope stability problems and investigated the
effectiveness and validity of these programs by giving values of shear strength parameters
soil unit weight (γ) cohesion (c) and internal friction angle (ϕ) and investigate their effect
on FOS value Comparison and discussion of the results that obtained from different
software programs The study results showed that the slopes FOS changes with varying
cohesion internal friction angle and the unit weight his results showed that compared to
SLOPEW GEO5 is more conservative slope stability analysis software It gives 5 less
48
factor of safety than SLOPEW In contrast to GEO5 and FLACSlope usually gives
greater value for FOS
Suman (2014) used the software program FLAC to carry out numerical models for rock
slopes on his thesis ldquoSoil Slope Stability Techniques A Comprehensive Analysis rdquo by
having different rock properties and various dimensions The numerical modelling is
performed for finding out the factor of safety For each slope the parameters are varied and
the factor of safety calculated for each step To find out how the factor of safety changes
with changing parameters these values are correlated with the bench parameters
Oghli (2011) studied slope stability by Bishop based on LEM and Shear Strength
Reduction SSR based on FEM and used the software packages SLIDE5 and PHASE2 So
she applied on the homogeneous slope in two sides First is a design side on the slope and
the extent of the effect on ratio HL on factor of safety by using the method SSR second is
mechanically by change the five parameters to the FOS by using finite element method
(cohesion friction density elasticity factor Poisson factor) and the extent of the effect on
FOS The results obtained were merged to a mathematical model through this model the
factor of safety could be calculated for a homogeneous slope which the values of the
factors affecting on FOS change by using the experimental design method
Fei Kang et al (2014) evaluated the probability of slope stability based on system called
Regression of the Gaussian method (GPR) and sampling of Latin hypercube
The analysis consists of three sections Firstly Latin hypercube sampling is used to create s
amples to build the surfaces response Then on the basis of the samples Gaussian process
regression which is a common machine learning method for nonlinear system simulation
is used to evaluate the reaction of surface to estimate the limiting of state function
Monte Carlo simulation is conducted via e GPR surfaces response to determine the slopersquos
probability system failure
(Zevgolis et al 2019) presented the landslide that happened on 12 June 2017 which was
definitely an unprecedented occurrence in Greek lignite mining history and is possibly one
of the biggest lignite mine landslides in the world The slipping mass shifted from south to
the north and occupied a huge area estimated to be between 298 and 356 km2 depending
on satellite images Two independent committees (one by the Ministry of Environment and
49
Energy and the other by PPC) have been requested to evaluate the event given the
disastrous effects of the landslide The two committees findings were not yet released
publicly Nevertheless a recent report released by the Greek Ombudsmans Independent
Authority discusses the main conclusion of the studies of the two committees
Three dimensional methods
Such procedures are centered on observing a fault surface 3D structure that is beneficial
for more geometrically complicated slopes or meanwhile the material of the slope is
strongly anisotropic or inhomogeneous
Alike two dimensional technique extra equations or in some situations both to obtain a
statically defined situation In general almost all of those techniques belong to the two
dimensional methods Even though the author wont debate about them in this research it
will introduce some of the most useful methods by name in Table 22 Please check the
references in this thesis reference section for more information about them
50
Table 22 3-D analyzing methods for slope stability (Duncan 1996)
Author Methods
(Anagnosti 1969 Extended Morgenston and Price
(Baligh and Azzouz 1975 Extended circular arc
(Giger and Krizek 1976 Upper bound theory of perfect plasticity
Baligh Azzouz amp Ladd 1977 Extended circular arc
Hovland 1979 Extended Ordinary method of slices
A Azzouz Baligh and Ladd
1981
Extended Swedish Circle
Chen and Chameau 1983 Extended Spencer
A S Azzouz and Baligh 1983 Extended Swedish Circle
D Leshchinsky Baker amp
Silver 1985
LE and variational analysis
Keizo Ugai 1985 LE and variational analysis
Dov Leshchinsky amp Baker
1986
LE and variational analysis
R Baker amp Leshchinsky 1987 LE and variational analysis
Cavoundis 1987 LEM
Hungr 1987 Extended Bishoprsquos modified
Gens Hutchinson amp
Cavounidis 1988
Extended Swedish circle
K Ugai 1988 Extended ordinary technique of slices
Janbu and Spencer modified Bishoprsquos
Xing 1988 LEM
Michalowski 1989 Kinematical theorem of limit plasticity
Seed Mitchell amp Seed 1990 Ad hoc 2D and 3D
Dov Leshchinsky amp Huang
1992
Limit equilibrium and variational analysis
51
24 Soil Slope Failure Surface Searching Methods
There are many variant methods utilized in analyzing soil slopes stability either natural
slopes or artificial Every one of them leads us to a variant FOS Several ones are quite
precise alike FEM some are more conservative such as that of ordinary method of slices
But such variations apply for only those of one slip fail and this must be the critical one
The method for finding this critical surface of fail has multiple techniques as well many
of them are complex whereas others are less complicated but most often they could be
accomplished only by using software programs and they are very hard to use for hand
computations The FOS is also very empathetic to the exact location of the critical solution
with a thin soils layer for complicated problems and there are large differences between
different methods of global optimization (Cheng Li Lansivaara Chi amp Sun 2008)
To optimize this procedure most of those techniques have been made on basis on trial and
error techniques so far Different methods of optimization have been developed such as
genetic algorithm (GA) annealing and so on
Some more recent methods are discussed in this section
241 Simulated annealing method
Optimization was accomplished in this method by implementing a method of annealing to
accomplish the lowest possible global for FOS It is focused on two first points identified
by the user (that fully defined as follows) and an additional upper limit
242 Simple genetic algorithm
This procedure provides a clear form of Calculation based upon Morgenstern Prices slope
stability analysis system for noncircular surfaces with pseudo-statics earthquake loading
(McCombie Wilkinson 2002) Thats simpler version of the genetic algorithm (Sengupta
Upadhyay 2009) In order to obtain the critical noncircular slip surface this method used
a simple genetic algorithm (SGA) The following figure (Figure 211) demonstrates the
technique utilized by this method to locate the slip (Zolfghari Heath amp Mccombie 2005)
52
Figure 29 Algorithm of simple genetic (Zolfghari Heath amp Mccombie 2005)
243 Leapfrog algorithm method
This approach is based on the methods used by Janbu and Spencer to analyze the stability
of the slope The cause the researchers used these techniques for their studies is that they
do not need any main geometry statement and the initiation of slip termination points is
not restricted in those techniques This allows the technique to generate a general form of
the slip surface
The author then claims that the most efficient procedure was the Leapfrog algorithm after
testing a number of optimization methods(Bolton Heymann amp Groenwold 2002)
53
244 Other methods
From other methods it is possible to count Monte Carlo techniques (Malkawi Hassan amp
Sarma 2001) and Particle swarm optimisation theory (Cheng Li Chi amp Wei 2007) which
in this thesis would not be considered
25 Potential Slope Failure Surface and Soil Strength Parameters
There have been numerous studies on the effect of soil strength parameters on factor of
safety But their impact on the surface of the slip was seldom taken into account One of a
handful studies (Lin amp Cao 2011) discusses the relationship in-between those parameters and
the potential surface of the slip and their impact on the surface of the failure this paper studies a
function of Phi cohesion c unit weight and slopersquos height (h) as follows
λ = c(γhtan Oslash ) (245)
This study debates this once the value of Lambda (λ) stays unchanged the surface of the
failure stay the same this is consistent with a previous study (Jiang amp Yamagami 2008)
which shows a special correlation between 119862
119905119886119899120593 and the slip surface In addition the higher
λ shows a deeper failure slip and the lower value of λ makes the surface of fail nearer to
the surface of the slope (Lin amp Cao 2012)
54
CHAPTER 3
METHODOLOGY
31 Introduction
In this chapter software programs and methods that will be used in this thesis will be
introduced and discussed
32 Methodology
As it has discussed before for each slope there are resisting forces and driving forces
which should be considered Driving forces are mostly a result of the weight of the soil
formed the slope that is in a direct proportion with the unit weight of the soil and resisting
forces are mostly a result of internal friction angle and cohesion of the soil In the first
part of the study the effect of cohesion (119888) internal friction angle (120601) and the unit weight
(ɤ) of the soil will be studied to compute the factor of safety FOS
In the second part of this study an adequate numbers of slopes will be analyzed and
modeled with different soil shear strength parameters cohesion unit weights and internal
fraction angle in addition to slope geometry by changing the angles length and height of
the slopes in order to make a database of failure surfaces for these slope parameters In
these first two parts the study will be analyzed by using the educational license of the
software package SLOPEW
Finally reanalyze the previous models with the same properties and conditions on another
software packages PLAXIS and FLAC and compare the results between them then
compare the outputs with the results of SLOPEW in order to check and control the
accuracy of SLOPEW results
The results data of the failure surfacersquos circle (center entry exit and radius) of the models
will be used to draw the slope by the version of Automatic Computer Aided Design
(AutoCAD) software 2014 to measure the length of the failure arc and locate the slip
surface entry and exit points by measuring the arc between them
55
The results of analyzing each model will be used by enter it into the version of Microsoft
Excel 2010 After this step using the software various figures are going to be generated
And find some equations of the results by this software The methodology appointed in
treating this thesis involves
1-Investigate the factor of safety variations by change soil unit weight (ɤ) cohesion (c)
and internal friction angle (ϕ) and their effect on the factor of safety
2- Create detailed scenarios including the geometry details and soil properties
3- Studying the background of the methodology for the 3 software programs PLAXIS
FLAC and SLOPEW (Finite Element Method Limit Equilibrium Method)
4- Cognize which software packages could be used in geotechnical stability for research
scenarios
5-Analyse after Create the concepts for each scenario
6- Research soil properties and each scenariorsquos parameters
7- Familiarise with each software and its ability
8- Analyze each scenario after modeling by using PLAXIS FLAC and SLOPEW and
discuss the results and benefits
9- From all the above steps discuss the benefits and limitations of each of the software
packages and make notes and recommendations
56
33 Materials
331 Soil
More than 100 soil types with different strength parameters have used in this study to be
modeled and analyzed In order to generate models with a good accuracy in finding the
relationship between the factor of safety and the soil strength parameters for different soil
types with small changes in soil parameters have been selected modeled and analyzed
Soil strength parameters
The range of soil strength parameters chosen for this study in the Table 31 below
Table 31 Soil strength parameters
Soil strength parameters The range The unit
Cohesion 15~32 kPa
Unit Weight 15~31 kNm3
Internal Friction Angle 15~32 deg
332 Water level
In thus study the soil has assumed dry because of time limitation thus effect of water
hasnrsquot studied deny its effect has done by assuming the water level being far away below
the slope level
57
34 Software and Programs
341 FLACSLOPE
FLACSlope is a mini-version of FLAC specifically designed to conduct slope stability
factor of safety calculations (ITASCA Consulting Group 2011)
This software is a two dimensional express limited distinction program for building
mechanics calculation This program recreates the conduct of a structure worked of soil
rock or different materials that may experience plastic stream FLAC finds the static
answers for an issue utilizing the two-dimensional plane-strain model In any case the
dynamic conditions of movement are incorporated into the plan to help model the unstable
and stable forces with the model this guarantees the scenario of an unexpected collapse
with the model is represented The required soil properties present in Table 32
Table 32 Required soil properties for FLACSLOPE
Definition Property Symbol Units
Unit weight of the
soil
Density ɤ kgm3
The cohesion
component of the
shear strength
Cohesion c Pa
Friction angle of the
soil
Phi Oslash ˚
Dilation angle of
the soil
Psi Ψ ˚
The dilation angle has been set to zero in this study suggesting no volume change during
output The role of the dilation angle was discussed in details elsewhere like Griffiths amp
Lane (1999)
58
Methodology of FLACSlope Analysis
To draw the model insert the coordinates needed for each point by using ldquoinputrdquo button
under the window ldquosketchrdquo as shown in Figure 31 after draw the slope divide it and cut
the edges and merge the points make a text for the model if there is any mistakes during
the drawing as shown in Figure 32
Figure 31 Insert slopersquos coordinates on FLACSLOPE
59
Figure 32 Check on slopersquos drawing
Assign and create the properties of materials is needed It has to be noted that FLAC
requires the density and Cohesion of the material inputted in kgm3 and Pascal respectively
as presented in Figure 33
60
Figure 33 Assign material properties on FLACSLOPE
Assign a mesh to the slope is required A medium mesh has been chosen in this thesis for
FLAC as it shown in Figure 34 down below In order to achieve the optimum size
suitable for meshing both fine and medium size mesh was tried for few models it was
found that the final result difference between fine and medium meshes for factor of safety
are about 0007 which could be neglected as it makes less than 1 difference (Figure 35)
Figure 34 FLACSLOPE Assign mesh
61
(a)
(b)
Figure 35 The difference between fine and medium meshes for the value 17 kNm3
of
unit weight (a) Fine mesh (b) Medium mesh
62
Finally the result of factor of safety will be given in small box and a shape of the slopersquos
displacements as shown in Figure 35
Figure 36 Factor of safety value on FLACSLOPE
342 SLOPEW
SLOPEW is software that uses LE method to compute the factor of safety FOS of rock
and soil slopes and earth The user of SLOPEW must have a background and knowledge
of the concepts and principles of geotechnics involved in the judgment and analysis is
required to assure that realistic soil properties are used to compute an accurate FOS The
version SLOPEW 2012 has been used in this study Although this software based on LE
method but it uses finite element method too for some slopes (GEO-SLOPE International
2015) For the number of increments 15 have been used for modeling the slopes for entry
and exit ranges The required soil properties presented in Table 33
Table 33 Required soil properties for SLOPEW
Definition Symbol Property Units
Soilrsquos Total Unit Weight ɤ Unit Weight kNm3
Soilrsquos Cohesion C Cohesion kPa
Soilrsquos Friction Angle Oslash Phi ˚
63
The Methodology of SLOPEW Analysis
Start SLOPEW by setting the units and some properties of the slope and slip surface draw
scale for the model so we can draw the axes after that as shown in Figure 36
Figure 37 SLOPEW set units
To draw the model using the inbuilt CAD is needed alike PLAXIS and unlike FLAC
which it needs to input the coordinates (X Y) of each point of the drawn slope
Assign and create the properties of material is needed which can be found under the menu
ldquoKeylnrdquo as cohesion unit weight and internal friction angle material dialogue box
presented in Figure 37
64
Figure 38 Assign and create the properties of material on SLOPEW
After defining soil strength parameters in the software and all inputs start calculate the
minimum factor of safety of the slope by clicking on ldquostartrdquo button the program will take
time to analyze the slope and that depends on the number of increments and the type of
mesh that chosen for the slope the computed model shown in Figure 38 show the case of
cohesion and internal friction angle both 16 kPa and ˚ respectively and unit weight 15
kNmsup3
65
Figure 39 SLOPEW factor of safety value
343 PLAXIS
PLAXIS is described as a finite element FE package for geotechnical analysis that can use
both three-dimensional and two-dimensional analysis in determining the moment of
inertia and shear forces of slopes stability deflection displacements and deformation
experienced by slopes PLAXIS provides itself to modeling more complex geotechnical
scenarios as it has the ability to simulate inhomogeneous soil properties and time
dependent scenarios The required Soil Properties presented in Table 34
Table 34 Required soil properties for PLAXIS
Definition Property Symbol Units
Soilrsquos Total Unit Weight ɤ Unit Weight kNm3
Soilrsquos Cohesion C Cohesion kPa
Friction angle of the soil Phi Oslash ˚
The ratio of lateral strain
to linear strain
Poissonrsquos Ratio ν -
Elastic modulus at the
reference depth
Reference
Elastic Modulus
Eref kNm2
66
The Methodology of PLAXIS Analysis
Start PLAXIS by setting the units and draw scale and slope limits (right left bottom
down) and grid spacing for the model as presented in Figure 39 so the axes can draw after
that
Figure 310 Set units on PLAXIS
Drawing in PLAXIS is easy because drawing the model can be done by using the inbuilt
CAD interface as shown in Figure 310 alike SLOPEW and unlike FLAC which it needs
to input the coordinates (X Y) of each point of the drawn slope
67
Figure 311 Drawing in PLAXIS
The model need to be fixed by hitting the button ldquostandard fixtiesrdquo from the tool bar so the
slope unmovable from continues sides (bottom and left sides) as shown in Figure 311
Figure 312 PLAXIS standard fixities
68
Assign and create the properties of material are needed but PLAXIS need advanced
properties the elastic parameters Youngs modulus and Poissons ratio were allocated
nominal values of 100 kNm2 and 03 respectively as they have little impact on the
computed factor of safety (Hammah Yacoub Corkum amp Curran 2005) as shown in
Figure 313
Figure 313 Assign and create the properties of material on PLAXIS
Generating the mesh is needed in this software A medium mesh is being used in this
study to help improve accuracy as shown in Figure 314 The mesh is presented in Figure
after generating in Figure 315
69
Figure 314 Determine the mesh size on PLAXIS
Figure 315 PLAXIS before generating mesh
By hitting calculate button in tool bar the program will ask to determine some points in
the slope for the expected failure surfce then calculte the fctor of safety after that as
shown in Figure 315
70
Figure 316 PLAXIS after generating the mesh
By hitting calculate button the software will show the deformed slope as shown in Figure
316 and calculate the factor of safety
Figure 317 Slope displacement on PLAXIS
71
CHAPTER4
RESULTS AND DISCUSSION
41 Introduction
In this chapter the effect of every soilrsquos strength parameter cohesion unit weight and
internal friction angle (c γ and ϕ) has been studied on factor of safety FOS and failure
surface both together and separately In the first section of the results in order to
determine the varying in FOS and slip surface a number of models were analyzed while in
the second section to find an accurate relationship between the strength parameters of soil
and the surface of failure and an adequate number of models were analyzed After all the
models were generated and analyzed the figures were drawn to demonstrate the influences
of the variables on FOS and failure surface In addition the reasons for these various
behaviors were debated
42 Impact of Soil Strength and Slope Geometry Parameters on the Factor of Safety
In this section three series of analyzing were performed in order to study the feasibility of
this study One of the parameters changed in each set of models while the other two
parameters kept constant these models were studied to see if there is any relation between
the position of the surfaces of failure and the soil parameters
421 Impact of unit weight on factor of safety
In order to study the influence of unit weight γ on FOS the values of unit weight have
been chosen from 15 to 30 kNm3 while the internal friction angle and the cohesion have
been chosen as 15˚ and 15 kPa respectively
72
Table 41 Effect unit weight on FOS
Model
number
Unit weight
[kNm3]
Internal friction
angle[deg]
Cohesion[kPa] Factor
of
safety
1 15 15 15 2411
2 16 15 15 2295
3 18 15 15 2173
4 20 15 15 2044
5 22 15 15 1956
6 24 15 15 1884
7 26 15 15 1822
8 28 15 15 1769
9 30 15 15 1724
In Table 41 the values showed that as the soilrsquos unit weight raise FOS values decrease
This reduction could be explained by weight of the soil as the unit weight increases weight
of soil as the main derivative force behind the failure increases Therefore increasing unit
weight causes the slope to become more unstable leading to a reduction in the FOS
Clayey and silty sands represent the value between 17-32 kNm3
of unite weight
(NAVFAC1986)
Extensive field experiments for (Feng S J et al 2019) were carried out in conjunction
with numerical simulation and LE analyzes to examine the major failure of an unfilled
landfill structure in Shanghai China The study also found the collapse happened in the
sandy silt with silt clay layer which represent 182 kNm3
73
(a)
(b)
Figure 41 (a) Impact of unit weight on slip surface (b) cropped portion of (a)
Figure 41(a) demonstrates the impact of unit weight on failure surface (whereas Figure
41(b) is a cropped variant of (a)) The tests follow a practical rule by maximizing unit
weight of the soil the failure surface is moved to the right leading in a smaller volume of
soil failure and thus decreasing the slip surface length Less resistant force is activated due
to the smaller surface for holding forces (friction and cohesion) For these reasons a lower
value for safety factor is accomplished
74
422 Impact of cohesion on factor of safety
To study the impact of cohesion on FOS the cohesion values diverge from 16 to 30 kPa
were chosen while the internal friction angle and unit weight of the soil chosen as 15˚ and
15 kNm3 respectively
The calculated values of FOS for different C values are shown in Table 42
Table 42 Impact C on FOS
Model
number
Unit Weight
[kNm3]
Internal
Friction Angle
[deg]
Cohesion
[kPa]
Factor
of
Safety
1 15 15 16 1355
2 15 15 18 1409
3 15 15 20 1463
4 15 15 22 1517
5 15 15 24 1572
6 15 15 26 1626
7 15 15 28 1680
8 15 15 30 1724
The values in Table 42 showed that as the cohesion of the soil raised FOS values
increased this increase is due to the raise up in cohesion value as mentioned before since
cohesion is one of the resisting forces Increasing cohesion caused the slope to become
more stable leading increasing in factor of safety
75
[a]
[b]
Figure 42 [a] Impact of C on slip surface [b] cropped portion of [a]
As it shown in Figure 42 tests follow a logical order by maximizing the cohesion value
failure surface and La increase to obtain the same cohesion force value (calculated by
multiplying cohesion by failure arc length) In addition a greater failure surface leads to a
greater weight value for the volume of failure (greater derivative force) and a greater
friction force value
76
Furthermore as the value of cohesion rises so the fault surface increased (including La)
FOS rises This suggests the increasing in the resistance forces is more prevalent than the
increasing in the influence of driving forces
423 Impact of internal friction angle on factor of safety
With the aim of testing the impact of friction angle on the factor of safety of the soil
various values of Oslash changing from 16 to 30 degrees were selected meanwhile the soilrsquos
unit weight and the cohesion were preserved constant respectively at 15 kNm3 and 15
kPa
Table 43 Effect Oslash on FOS
Model
number
Unit Weight
[kNm3]
Internal
friction angle
[deg]
Cohesion[kPa] Factor
of
Safety
1 15 16 15 1180
2 15 18 15 1259
3 15 20 15 1340
4 15 22 15 1399
5 15 24 15 1475
6 15 26 15 1556
7 15 28 15 1638
8 15 30 15 1724
In the Table 43 data demonstrates that factor of safety increased by increasing the friction
angle value As mentioned before since friction angle is one of the holding and resisting
factors The results obtained are in line with the concept
Figure 43 (a) demonstrates the impact of friction angle on failed surface (meanwhile
Figure 43 [b] is a cropped part from [a])
77
[a]
[b]
Figure 43 [a] Cohesion impact on slip surface [b] cropped portion of [a]
As it shown in the Figure 42 the same as the unit weight effect the tests succeed logical
trendacy by maximizing the friction angle
78
The failure surface and La decrease to accomplish the same friction force value (calculated
by multiplying the tangent of Oslash by La) In addition a small failure surface leads to a
smaller failurersquos weight volumersquos value (lower derivative factor) and a lower value of the
cohesion force
Furthermore an increase in internal friction angle (Oslash) results in a reduction in the slip
surface and La thus FOS increases This suggests that a reducing in the impact of
cohesion is more prevalent than reducing in driving factor
424 Impact of slope geometry on factor of safety
With constant soil strength parameters four different slopes shapes were analysed in order
to monitor the impact of the slope shape on the factor of safety c = 15 kPa ɤ = 15 kN m3
and Oslash = 15˚
Taking into account situations numbers 1 and 2 together 3 and 4 together as shown in
Table 44 it is obviously noticed that increase the surface soil angle (Alpha) as shown in
Figure 44) will result the slope to become less stable this may be due to the fact that this
amount of soil added to the upper part will act as an overhead load increase the driving
force and resulting in the factor of safety to decline
On the other hand taking into account states numbers 1 and 2 together 3 and 4 with each
other it is observed that increasing the angle of slope (Beta) is going to result the slope to
become more stable this maybe due to the fact that by increasing that angle and La
increases yield to more resistant force that will raise the factor of safety
79
Table 44 Impact of slope geometry on FOS
Model No
(shape No)
Unit
Weight
[kNm3]
Internal
Friction
Angle [deg]
Cohsion
[kPa]
Factor
of
Safety
1 15 15 15 2325
2 15 15 15 1794
3 15 15 15 1175
4 15 15 15 1142
Figure 44 Models for effect slope geometry on FOS
43 Impact of Geometry and Soil Strength Parameters on the Slip Surface
Based on what was debated in the past part (42) it is easy to estimate that a correlation
must be existed between the strength parameters of soil and the geometry of the slope and
80
the surface of failure the following analyzed models will be studied in order to examine
this condition
Many models were generated using SLOPEW software in this step The output in this
aspect will become the factor of safety and slip circle center coordinates as well as the
circular failure surface radius
The circles have been drawn using AutoCAD software to find out La and locate entry and
exit points in the slope failed area
Figure 45 reflects the general shape of the slope geometry that is going to be used in the
next 75 models
Figure 45 Slope model geometry
Various parameters of shear strength and soil unit weight were analyzed for the produced
designs Over the next sections the specifics of these parameters are given and discussed
81
431 Impact of cohesion C on slip surface
In this part at 15deg and 15 kNm3
respectively the internal friction angle and unit weight of
the soil remained constant and the cohesion changed from 15 to 32 kPa La and Oslash have
been referred to length of failure arc and internal friction angle respectively as shown in
table 45
Table 45 Cohesion impact on the slip surface
Model
No
Unit
Weight
(kNm3)
Oslash
(deg)
Cohesion
(kPa)
Entry
(XY)
(m)
Exit
(XY)
(m)
Radius
(m)
La
(m)
Factor
of
safety
1 15 15 15 17 139 25 608 2464 1007 1033
2 15 15 16 17 139 25 608 2464 1007 1081
3 15 15 17 17 139 25 609 2464 1007 1129
4 15 15 18 18 135 25 609 2391 1033 1158
5 15 15 19 18 135 25 609 2391 1033 1207
6 15 15 20 17 139 25 608 2464 1098 1272
7 15 15 21 16 142 25 607 255 1217 1340
8 15 15 22 16 142 25 607 255 1217 1387
9 15 15 23 18 135 25 609 239 1033 1401
10 15 15 24 16 142 25 607 2553 1217 1483
11 15 15 25 16 142 25 607 2553 1217 1530
12 15 15 26 16 142 25 607 2553 1217 1578
13 15 15 27 16 142 25 607 2553 1217 1626
14 15 15 28 15 146 25 607 2652 1320 1693
15 15 15 29 16 142 25 607 2553 1217 1721
16 15 15 30 15 146 25 606 2652 1320 1787
17 15 15 31 15 146 25 606 2652 1320 1834
18 15 15 32 15 146 25 606 2652 1320 1882
82
432 Impact of internal friction angle phi on slip surface
Unit weight and cohesion kept unchanged in this part at 15 kNm3 and 15 kPa
respectively while the angle of friction varied between 16deg and 32deg La and Oslash have been
referred to length of failure arc and internal friction angle respectively as shown in table
46
Table 46 Internal friction angle impact on slip surface
Model
No
Unit
Weight
(kNm3)
Oslash (deg) Cohesion
(kPa)
Entry
(XY)
(m)
Exit
(XY)
(m)
Radius
(m)
La
(m)
Factor
of
safety
19 15 16 15 18 135 25 609 239 10555 1033
20 15 17 15 18 135 25 609 239 10555 1054
21 15 18 15 18 135 25 609 239 10555 1074
22 15 19 15 19 132 25 61 234 95583 1070
23 15 20 15 19 132 25 61 234 95583 1089
24 15 21 15 20 128 25 62 12717 86434 1135
25 15 22 15 19 1316 25 607 1319 96773 1141
26 15 23 15 19 1316 25 61 2342 95583 1148
27 15 24 15 19 1316 25 61 2342 95583 1168
28 15 25 15 19 1316 25 61 2342 95583 1188
29 15 26 15 20 128 25 617 12717 86434 1215
30 15 27 15 19 1316 25 61 2342 95583 1230
31 15 28 15 20 128 25 617 12717 86434 1249
32 15 29 15 20 128 25 617 12717 86434 1266
33 15 30 15 20 128 25 617 12717 86434 1284
34 15 31 15 20 128 25 617 12717 86434 1301
35 15 32 15 20 128 25 617 12717 86434 1320
83
433 Impact of unit weight on slip surface
Friction angle and cohesion kept unchanged at 15deg and 15 kPa in this part meanwhile
soilrsquos unit weight ranged from 16 kNm3 to 31 kNm
3
La and Oslash have been referred to length of failure arc and internal friction angle respectively
as shown in table 47
Table 47 Impact of unit weight on the slip surface
Model
numb
er
Unit
Weight
(kNm3)
Oslash (deg) Cohesion
[kPa]
Entry
(XY)
[m]
Exit
(XY)
[m]
Radius
(m)
La
(m)
Factor
of
safety
36 16 15 15 18135 25 61 239 10555 0967
37 17 15 15 18135 25 61 239 10555 0927
38 18 15 15 19 132 25 61 234 95549 0874
39 19 15 15 18 135 25 61 239 10555 0860
40 20 15 15 19 132 25 61 132 92160 0817
41 21 15 15 19 132 25 61 2342 95549 0786
42 22 15 15 19 132 25 61 2342 95549 0762
43 23 15 15 19 132 25 61 2342 95549 0740
44 24 15 15 19 132 25 61 2342 95549 0720
45 25 15 15 19 132 25 61 2342 95549 0701
46 27 15 15 19132 25 61 2342 95549 0669
47 29 15 15 19 132 25 61 2342 95549 0640
48 31 15 15 20 128 25 617 12717 86434 0613
84
434 Impact of unit weight and cohesion on slip surface
The friction angle kept unchanged at 15deg in this part and the values varied from 16 to 31
for both parameters cohesion and unit weight kPa and kNm3 respectively
La and Oslash have been referred to length of failure arc and internal friction angle respectively
as shown in table 48
Table 48 Impact of cohesion and unit weight on the Slip Surface
Model
No
Unit
Weight
(kNm3)
Oslash
(deg)
Cohesion
(kPa)
Entry
(XY)
(m)
Exit
(XY)
(m)
Radius
(m)
La
(m)
Factor
of
Safety
49 16 15 16 17 139 25 608 2464 11474 1033
50 17 15 17 17 139 25 608 2464 11474 1033
51 19 15 19 17 139 25 608 2464 11474 1033
52 21 15 21 17 139 25 608 2464 11474 1033
53 23 15 23 17 139 25 608 2464 11474 1033
54 25 15 25 17 139 25 608 2464 11474 1033
55 27 15 27 17 139 25 608 2464 11474 1033
56 29 15 29 17 139 25 608 2464 11474 1033
57 31 15 31 17 139 25 608 2464 11474 1033
85
435 Impact of unit weight and friction angle on slip surface
Cohesion factor kept unchanged at 15 kPa in this part whilst the other parameters varied
between 15 and 31
La and Oslash have been referred to length of failure arc and internal friction angle respectively
as shown in table 49
Table 49 Impact of unit weight and friction angle on slip surface
Model
No
Unit
Weight
kNm3
Oslash
(deg)
Cohesion
(kPa)
Entry
(XY)
(m)
Exit
(XY)
(m)
Radius
(m)
La
(m)
Factor
of
Safety
58 16 16 15 18 1352 25 609 239 1147 0988
59 17 17 15 19 1316 25 61 2342 9520 0946
60 19 19 15 19 1316 25 61 2342 9520 0915
61 21 21 15 20 128 25 617 12717 8643 0895
62 23 23 15 21 1244 25 615 2387 7741 0833
63 25 25 15 21 1244 25 615 2387 7741 0830
64 27 27 15 21 1244 25 62 13048 7725 0820
65 29 29 15 21 1244 25 615 2387 7741 0816
66 31 31 15 22 121 25 624 14104 6763 0804
436 Impact of cohesion and friction angle on slip surface
friction angle and cohesion changed from 16 to 31 in this segment meanwhile soilrsquos unit
weight kept at 15 kNm3 La and Oslash have been referred to length of failure arc and internal
friction angle respectively as shown in table 410
86
Table 410 Impact of cohesion and friction angle on slip surface
Model
No
Unit
Weight
(kNm3)
Oslash
(deg)
Cohesion
(kPa)
Entry
(XY)
(m)
Exit
(XY)
(m)
Radius
(m)
La
(m)
Factor
Of
safety
67 15 16 16 17 139 25 608 2464 11215 1103
68 15 17 17 17 139 25 608 2464 11215 1173
69 15 19 19 17 139 25 608 2464 11215 1314
70 15 21 21 17 139 25 608 2464 11215 1456
71 15 23 23 17 139 25 608 2464 11215 1600
72 15 25 25 17 139 25 608 2464 11215 1745
73 15 27 27 17 139 25 608 2464 11215 1891
74 15 29 29 17 139 25 608 2464 11215 2040
75 15 31 31 17 139 25 608 2464 11215 2190
437 Impact of slope geometry on slip surface
Slope geometry were shown to have a direct relation with the stability of the slope as well
as the soil strengthrsquos properties (Namdar 2011)
In the last models series strength parameters of soil kept unchanged at the following
values whereas angles ranged from 0 deg to 634deg for (Beta) angle while (Alpha) angle
ranged from 0 deg to 198deg in slope geometry (shown in Figure 44)
Cohesion = 15 kPa internal angle of friction = 15deg unit weight = 15 kNm3
87
Table 411 Impact of slope geometry on slip surface
Model
No
α (˚) β (˚) Slope
Height
(m)
Entry (m) Exit (m) Radius
(m)
La (m) Factor
of
Safety
1 198 0 20 169 139 25 61 244 11467 1037
2 1775 0 19 179 132 25 61 229 10285 1033
3 156 0 18 189 126 25 62 213 91261 1047
4 135 0 17 189 125 25 618 204 90438 1058
5 113 0 16 2012 25 61 1056 74748 1042
6 91 0 15 199 118 25 618 1864 77090 1048
7 68 0 14 20 116 25 62 179 76002 1052
8 46 0 13 20 114 25 617 931 70123 1079
9 23 0 12 209 1116 25 62 8967 60907 1061
10 0 0 11 21 11 25 615 9018 59075 1053
11 0 113 11 193 11 25 608 1543 76643 1252
12 0 218 11 187 11 25 6 154 82403 1419
13 0 31 11 172 11 25 6 942 98461 1580
14 0 3875 11 181 11 25 604 88 89029 1642
15 0 45 11 175 11 249 61 653 98891 1774
16 0 502 11 167 11 247 63 658 10262 1928
17 0 545 11 158 11 25 602 716 11706 1978
18 0 58 11 146 11 25 603 763 13197 2088
19 0 61 11 136 11 254 6) 82 14834 2185
20 0 634 11 125 11 27 6 94 18053 2302
88
44 Impact of Geometry and Soil Strength Parameters on Factor of Safety
To evaluate the impact geometry and strength parameters of soil on the factor of safety
FOS versus the strength parameters was offered and drawn in the following figures
441 Impact of cohesion C on factor of safety
The cohesion effect on the factor of safety has been shown in this part Increasing the value
of cohesion as a resistant holding force as expected raised the value of the factor of
safety Figure 46 shows the linear correlation between cohesion and factor of safety FOS
is nearly linear with a R2
factor of 099
Figure 46 Effect of cohesion on the FOS
89
442 Impact of internal friction angle on the factor of safety
The effect of the friction angle on the factor of safety was shown in this part Increasing the
internal friction angle value which is also a holding force as expected increased the factor
of safety value As it shown in Figure 47 the correlation between FOS and the internal
friction angle
Figure 47 Internal friction angle impact on factor of safety
443 Impact of unit weight ɤ on factor of safety
Figure 48 shows the influence of soil unit weight ɤ on the factor of safety As could be
shown from the Figure 48 ɤ is inversely proportional to factor of safety as the major
derivative factor on soil mass was applied
90
Figure 48 Impact of unit weight on the FOS
444The combined impact of unit weight and cohesion on factor of safety
In this section the impact of cohesion and the soil unit weight ɤ on factor of safety was
studied Cohesion and soil unit weight were raised altogether here but the ratio kept
unchanged The outputs dictate that the potential surface of the slip is affected by
combining of Phi and C the function which is defined as λ equivalent to
λ= C (ɤhtanOslash ) (245)
Figure 49 shows the impact of cohesion and unit weight on FOS while lambda value stays
constant
91
Figure 49 The combined effect of unit weight and cohesion the on FOS
445 The combined impact of friction angle Oslash and unit weight on factor of safety
In this section by increasing both the values of Phi and unit weight ɤ Therefore in
Figure 410 the factor of safety versus Phi and γ curve was presented
Figure 410 The impact of friction angle Oslash and unit weight on factor of safety
92
As shown in Figure 410 decrease in the value of FOS was achieved by raising the value
of Oslash and γ This is due to the failure surface movements to the upper side thus reducing
the La and so reducing the influence of resisting and holding forces
446The combined Impact of friction angle Phi and cohesion C on factor of safety
In this section since the surface of potential failure is expected to be influenced by both of
C and Oslash values Figure 411 shows the relationship between the factor of safety and C Oslash
Because both of these parameters of shear strength are holding factors increasing those
two parameters results in a raise in the value of the factor of safety FOS is nearly linear
with R2 factor of 09999
Figure 411 The impact of Phi and cohesion on FOS
93
447 Impact of the slope geometry on factor of safety
In the methodology section two slope angles α and β were introduced and used to test the
impact of geometry on factor of safety and their impact on the factor of safety was
observed The results will be presented in the figures below
Figure 412 Alpha angle impact on factor of safety
Figure 412 represents that no noticeable variation is observed in the factor of safety except
the value of FOS between angles 46˚ and 68˚ it decreased unpretentiously after the angle
68˚ although it was increasing slightly before that value of Alpha angle These decrease
because it is possible by increase the Alpha angle as if adding an additional overhead load
on the surface of the slope But before the angle 68˚ it causes increases the surface of the
failure and thus increases the length of the arc it generates more resistant force and makes
the factor of safety constant While this rise in the surface of failure produces more
resistant force it simultaneously produces an increase in derivative force(weight of the
surface of failure) The factor of safety therefore remains constant For angles more than
68˚ the rise in derivativeforceapproaches the value of the resisting force and from this
angle value onwards the derivative force becomes greater than the resisting force and for
that a decrease can could seen in the value of factor of safety
94
Figure 413 Beta angle impact on factor of safety
Figure 411 represents the factor of safety significantly increases by increasing Beta angle
The reason for this behavior is that only the failure arc length increases as holding force
and the weight of the failure shape as driving force stays constant by increasing the beta
angle For that by increasing the length of the arc result an increase in the resisting force
and thus the factor of safety
45 Impact of Soil Strength and Geometry Parameters on Slip Surface
To study the impact of every soil parameter on the slip surface the length of the failure arc
was selected to be studied as a quantitative variable To demonstrate this impact the
following figures will be provided
95
451 Impact of cohesion on La length of failure arc
The impact of cohesion La is shown in Figure 412
Figure 414 Cohesion impact on La lengthoffailure arc
The figure represents that the length of the failure surface will increase with an increase in
value of cohesion The cause is that in the state of the constant location of the failed
surface as the cohesion force raises the holding force becomes greater the same thing for
the FOS The deriving force must raise which could be accomplished by increase the area
of slope fail in order to determine the minimum value of FOS (that is initial objective for
slope stability analysing) This results in a larger arc failure length and so a greater value of
FOS
452 Impact of friction angle Phi on length of failurearc
The impact of Phi on failure surface length is shown in Figure 413
96
Figure 415 Internal friction angle impact on length of failure arc
In the previous section referring to the same explanation it could be anticipated that La
must be in a proportional correlation with Oslash but as could be seen in Figure 413 L and Oslash
are related inversely
This inverse relationship is consistent with the study of (Jiang amp Yamagami 2006) that
sets that when the distribution of geometry of the slope unit weight in a homogeneous soil
slope is given the critical slip surface location for specifically slice method is only related
to the ratio 119862
tan (120593) of that slope This study indicates that the slip surface position and
therefore La is in the inverse relationship to the angle of the friction
453 Impact of unit weight ɤ on lengthoffailurearc
In this part the impact of unit weight on failure length arc has been studied
97
Figure 416 Effect of unit weight on La
As shown in Figure 414 by raising soil unit weight the weight of the fallen area rises
resulting a small factor of safety To say it in another word by considering lambda the
surface of the failure slip shifts towards the face of the slope while by reducing La the
impact of the friction angle and cohesion as the forces of resistance reduce thus achieving
a smaller factor of safety
454 The combined impact of cohesion C and unit weight on length of failure arc
La
In this section unit weight and cohesion increased altogether in a way the ratio remain
unchanged The results shown in Figure 415
98
Figure 417 The combined impact of cohesion and unit weight on La
Constant c over unit weight ratio which results in a constant λ As noted in the study
of(Lin amp Cao2011) this means the same shape of failure and therefore a unchanged value
of La
455 The combined impact of friction angle Phi and unit weight ɤ on La
In this part unit weight and Phi increased together The results shown in Figure 415 to
show the variation impact for both of the strength factors
99
Figure 418 The combined impact of internal friction angle and unit weight on the length
of failure arc
It can be seen that there will be a reduction in the length of the surface failure by increasing
the value of 120574 and tan120593 It is consists when talking about the 120582 value by maximizing this
value 120582 declines smaller value of 120582 means surface of failure nearer to surface of the slope
and thus a smaller La
456 The combined impact of cohesion and internal friction angle on the length of
failure arc
The following figure illustrates the combined impact on the length of the failure arc of
variable internal friction angle and cohesion the results have been drawn in Figure 417
100
Figure 419 The combined impact of cohesion and Phi on La length of failure arc
From the Figure 417 it could be seen that La will remain relatively unchanged at value
(11215 m) when both of the factors cohesion and internal friction angle remain constant
between the values (16-32) Since constant C and tan(Oslash) results in a constant lambda and
constant lambda means a constant surface of failure the length of the arc also remains
constant
457 Impact of slope geometry on length of failure arc
In Figure 418 and Figure 419 La were measured and drawn as a numerical value to show
the impact of slope geometry on the surface of the failure
101
Figure 420 The impact of Alpha angle on the La
Results of analysis of the models indicate that the position of the failure surface does not
differ significantly by increasing the Alpha angle The cause for increasing La is only the
slope surface motion and therefore the failure arc extension
Figure 421 Beta angle impact on La
102
By raising Beta angle value (the other factors in Eq (245) will not change and therefore do
not affect the value of lambda) the failure surface depth does not change At the other side
a raise in the Beta angle can shift the surface of the slope to the right so this going to cause
the arc to extend as shown in Figure 419
[a]
[b]
Figure 422 [a] Alpha angle impact on length of Arc and [b] zoomed portion of [a]
103
46 Reanalyzing Models by PLAXIS and Comparison of Results
The studied models were reanalyzed using PLAXIS software program to assure the outputs
of SLOPEW program acquired in part 43 Table 412 shows the results of these analyzes
Table 412 Models of cohesion values chosen for the factor of safety analysis - PLAXIS
Model
number
Unit
weight
[kNm3]
Internal
Friction
angle [deg]
Cohesion
[kPa]
Factor
of
safety
2 15 15 16 1051
4 15 15 18 1107
6 15 15 20 1254
8 15 15 22 1328
10 15 15 24 1419
12 15 15 26 1532
14 15 15 28 1634
16 15 15 30 1722
104
Table 413 Models of friction angle Phi values selected for the factor of safety analysis
for PLAXIS software
Model
No
Unit
Weight
(kNm3)
Internal
Friction
Angle (deg)
Cohesion
(kPa)
Factor
of
Safety
19 15 16 15 1047
21 15 18 15 1061
23 15 20 15 1073
25 15 22 15 1108
27 15 24 15 1152
29 15 26 15 1237
31 15 28 15 1271
33 15 30 15 1316
Table 414 Models of unit weight values chosen for factor of safety analysis for -
PLAXIS
Model
number
Unit
weight
[kNm3]
Internal
Friction
angle [deg]
Cohesion
[kPa]
Factor
of
safety
37 17 15 15 0867
39 19 15 15 0796
41 21 15 15 0752
43 23 15 15 0713
45 25 15 15 0689
46 27 15 15 0635
47 29 15 15 0608
48 31 15 15 0594
105
Table 415 Models of unit weight and C values chosen for FOS analysis by PLAXIS
software
Table 416 Models of unit weight and internal friction angle values chosen for the FOS
analysis for PLAXIS software
Model
number
Unit weight
[kNm3]
Internal friction
angle [deg]
Cohesion
[kPa]
Factor of
safety
58 16 16 15 0954
59 17 17 15 0937
60 19 19 15 0912
61 21 21 15 0900
62 23 23 15 0868
63 25 25 15 0838
64 27 27 15 0824
65 29 29 15 0809
66 31 31 15 0792
Model
No
Unit weight
[kNm3]
Internal friction
angle [deg]
Cohesion
[kPa]
Factor of
safety
49 16 15 16 1024
50 17 15 17 1024
51 19 15 19 1024
52 21 15 21 1024
53 23 15 23 1024
54 25 15 25 1024
55 27 15 27 1024
56 29 15 29 1024
57 31 15 31 1024
106
Table 417 Models of cohesion c and friction angle Phi values chosen for the factor of
safety analysis for PLAXIS software
Model
number
Unit
weight
[kNm3]
Internal
friction
angle [deg]
Cohesion
[kPa]
Factor
of
safety
67 15 16 16 1048
68 15 17 17 1120
69 15 19 19 1224
70 15 21 21 1391
71 15 23 23 1493
72 15 25 25 1617
73 15 27 27 1803
74 15 29 29 1947
75 15 31 31 2113
Table 418 summarizes the distinction between the FOS acquired from both programs
(PLAXIS and SLOPEW) and compares these results using the following formula
Difference = FOS(SLOPEW)minusFOS(PLAXIS)
FOS (PLAXIS) 100 (41)
107
Table 418 the difference of FOS between PLAXIS and SLOPEW
Model No SLOPEW
FOS
PLAXIS
FOS
Difference
2 1081 1051 29
4 1158 1107 46
6 1272 1254 14
8 1387 1328 44
10 1483 1419 48
12 1578 1532 3
14 1693 1634 36
16 1787 1722 38
19 1033 1047 -13
21 1074 1061 12
23 1089 1073 15
25 1141 1108 29
27 1168 1152 14
29 1215 1237 -18
31 1249 1271 -17
33 1284 1316 -2
37 0927 0867 3
39 086 0796 32
41 0786 0752 17
43 074 0713 135
45 0701 0689 06
46 0669 0635 17
47 064 0608 16
48 0613 0594 095
49 1033 1024 045
108
Table 418 the difference of FOS between PLAXIS and SLOPEW
Model No SLOPEW
FOS
PLAXIS
FOS
Difference
50 1033 1024 045
51 1033 1024 045
52 1033 1024 045
53 1033 1024 045
54 1033 1024 045
55 1033 1024 045
56 1033 1024 045
57 1033 1024 045
58 0988 0954 17
59 0946 0937 045
60 0915 0912 015
61 0895 09 -025
62 0833 0868 -175
63 083 0838 -04
64 082 0824 -02
65 0816 0809 035
66 0804 0792 152
67 1103 1048 275
68 1173 112 265
69 1314 1224 45
70 1456 1391 46
71 16 1553 3
72 1745 1687 34
73 1891 1803 44
74 204 1947 47
75 219 211 38
109
Table 419 Effect of slope geometry on the slip surface - PLAXIS
Model
number
α [˚] β [˚] Slope
Height
(m)
Factor of
Safety
1 198 0 20 1013
2 1775 0 19 1029
3 156 0 18 1042
4 135 0 17 1061
5 113 0 16 1057
6 91 0 15 1064
7 68 0 14 1052
8 46 0 13 1057
9 23 0 12 1055
10 0 0 11 1048
11 0 113 11 1216
12 0 218 11 1365
13 0 31 11 1521
14 0 38 11 1609
15 0 45 11 1693
16 0 502 11 1877
17 0 545 11 1951
18 0 58 11 2029
19 0 61 11 2129
20 0 634 11 2274
110
Table 421 The difference of FOS between PLAXIS and SLOPEW for slope geometry
Model No SLOPEW
FOS
PLAXIS
FOS
Difference
()
1 1037 1013 12
2 1033 1029 02
3 1047 1042 025
4 1058 1061 -015
5 1042 1057 -075
6 1048 1064 -08
7 1052 1052 0
8 1079 1057 11
9 1061 1055 03
10 1053 1048 025
11 1252 1216 18
12 1419 1365 27
13 158 1521 295
14 1642 1609 165
15 1774 1693 405
16 1928 1877 255
17 1978 1951 135
18 2088 2029 295
19 2185 2129 28
20 2302 2274 14
It can be seen in Table 418 that PLAXIS is a more conservative designing program On
average PLAXIS gives less than 5 lower FOS (except few models) which gave FOS
greater than SLOPEW software that will make PLAXIS more conservative and therefore
safer to design and analyze more significant slopes
111
By comparison giving SLOPEW a higher FOS makes it more beneficial to analyze and
design less important slopes
47 Reanalyzing the Past Models by FLACSlope
To inspect the results of PLAXIS and SLOPEW a sample of the models were chosen up
to their properties and by using the FLAC program these models have been reanalyzed as
shown in Tables 422 and 423 Considering that FLAC is not software with a complete
LEM the results may show a distinction between three software
Table 422 Reanalyze models by using FLAC software (shear strength parameters
models)
Model
number
Unit
weight
[kNm3]
Internal
Friction
angle[deg]
Cohesion
[kPa]
Factor
of
safety
6 15 15 20 1029
11 15 15 25 1221
23 15 20 15 0932
28 15 25 15 1049
45 25 15 15 0607
54 25 15 25 0842
63 25 25 15 0764
72 15 25 25 1436
112
Table 423 Reanalyze models by using FLAC software (slope geometry models)
Model No α (˚) β (˚) Factor of Safety
6 91 0 0869
15 0 45 1827
Table 424 The difference between the three software packages (shear strength
parameters models)
Table 425 The difference between the three software packages (slope geometry models)
Model no Factor of safety of Difference between FLAC
and
FLAC SLOPEW PLAXIS SLOPEW
()
PLAXIS ()
6 1029 1272 1254 236152 218659
23 0932 1089 1073 16846 151288
45 0607 0701 0689 15486 135091
54 0842 1053 1024 250594 216152
63 0764 083 0838 86387 96859
72 1436 1745 1617 215181 126045
Model no Factor of safety of Difference between FLAC
and
FLAC SLOPEW PLAXIS SLOPEW
()
PLAXIS
()
6 0869 1048 1064 205984 195
15 1827 1774 1774 2901 -53
113
As shown in Tables 424 and 425 the average distinction between FLACSLOPE and the
others programs is less than 1 percent which is appropriate In addition it is noticeable
that FOSs obtained from FLAC are lower than the other two programs in 75 of the
models
114
CHAPTER 5
CONCLUSIONS AND RECOMMENDATIONS
51 Conclusions
The conclusions were drawn on the basis of the slope stability analyzes by using the
software packages PLAXIS SLOPEW and FLAC
1 Cohesion (c) and friction angle (Oslash) as resistance forces are directly related to the factor
of safety while unit weight as deriving force is inversely related to the factor of safety
2 The outputs of this study showed that regarding their friction angle the slopes formed by
smaller grains of soil will be more stable moreover silty and well-graded soils are more
stable than soils with coarse grains such as gravel and sandy soils Also slopes with the
heavier soil in terms of unit weight have less stability
3 Slopes made of boulders or the ones with high content of discrete large grains have less
stability than slopes formed of gravelly soil
4 In this study it is found that clayey and silty sands which represent the soil with unit
weight values more than 15 kNm3
with constant values of cohesion and friction angle
have failed for all slopes On the other hand in silty clayey soils with value of cohesion 15
kPa and unit weight and friction angle differing values the slope would still unstable
5 According to the dimensionless function λ and the results showed that an increase in the
cohesion value results to higher value for length of failure arc (La) On the other hand an
increase in the friction angle and the unit weight of soil values result to reduce the length of
failure arc (La) value
6 An increase in the value of Alpha angle to a specific value doesnrsquot have any noticeable
influence on FOS while an increase in the value of the Beta angle affects directly on the
factor of safety
115
7 The greater value of the Alpha angle leads to a greater value of La However varying
the value of Beta angle doesnrsquot affect as much as Alpha does on the value of La
8 PLAXIS is more conservative software for slope stability studies comparing to
SLOPEW which it gives about 5 lower value for factor of safety
9 FLACSlope is the most complicated software to deal with and usually gave out the
lowest value for factor of safety in comparison with PLAXIS and SLOPEW
10 No significant relation between length of failure arc (La) and factor of safety FOS was
found
52 Recommendations
The following recommendations analysis can be performed for other studies in connection
with this thesis
1 Analysis and modeling wider range in parameters of soil strength
2 Including the level of water content and consideration of unsaturated soils and the effect
of water pressure
3 Including more slope geometry variables as the angle of the slope itself and the length of
the slope
4 Conducting a real-scale study to verify the validation of the equations acquired to locate
the critical surface of the failure
116
REFERENCES
Aaron J amp Mcdougall S (2019) Rock avalanche mobility The role of path material
Engineering Geology 257 105-126
Adams C (2015) Slope stability analysis of a small intermittent failure (Doctoral
dissertation California State University Chico)
Albataineh N (2006) Slope stability analysis using 2D and 3D methods (Doctoral
dissertation University of Akron Ohio USA
Amini M amp Ardestani A (2019) Stability analysis of the north-eastern slope of Daralou
copper open pit mine against a secondary toppling failure Engineering Geology 249
89ndash101
Anagnosti P (1969) Three-dimensional stability of fill dams In Proceeding of 7th
International Conference on Soil Mechanics and Foundation Engineering Mexico
(pp 275-280)
Anderson M G amp Richards K S (1987) Modelling slope stability the complimentary
nature of geotechnical and geomorphological approaches Slope Stability
Geotechnical Engineering and Geomorphology New York John Wiley and Sons p
1-9
Aryal K P (2008 October) Differences between LE and FE methods used in slope
stability evaluations In 12th International Conference of International Association
for Computer Methods and Advances in Geomechanics (IACMAG) (pp 1-6)
Azadmanesh M amp Arafati N (2012) A comparison on slope stability analysis of
aydoghmoosh earth dam by limit equilibrium finite element and finite difference
methods International Journal of Civil Engineering and Building Materials 2(3)
115-123 (ISSN 2223-487X)
Azimi S R (2016) Soil slope stability techniques A comprehensive analysis (Doctoral
dissertation) Curtin University Perth Australia
117
Azzouz A S amp Baligh M M (1983) Loaded areas on cohesive slopes Journal of
Geotechnical Engineering 109(5) 724-729
Azzouz A S Baligh M M amp Ladd C C (1981) Three-dimensional stability analyses
of four embankment failures In Proc 10th Int Conf on Soil Mechanics and
Foundation Engineering (Vol 3 pp 343-346)
Johari A Fazeli A amp Javadi A A (2013) An investigation into application of jointly
distributed random variables method in reliability assessment of rock slope
stability Computers and Geotechnics 47 42-47
Baker R amp Leshchinsky D (1987) Stability analysis of conical heaps Soils and
Foundations 27(4) 99-110
Baligh M M amp Azzouz A S (1975) End effects on stability of cohesive slopes
Journal of Geotechnical and Geoenvironmental Engineering 101(ASCE 11705
Proceeding)
Baligh M M Azzouz A S amp Ladd C C (1977) Line loads on cohesive slopes In
Proceedings of the Ninth International Conference on Soil Mechanics and
Foundation Engineering Tokyo Japan[sn] (pp 13-17)
Bolton H Heymann G amp Groenwold A (2003) Global search for critical failure
surface in slope stability analysis Engineering Optimization 35(1) 51-65
Bromhead E N (1992) The stability of slopes blackie academic and professional Lond
UK
Bromhead E N amp Martin P L (2004) Three-dimensional limit equilibrium analysis of
the Taren landslide In Advances in geotechnical engineering The Skempton
conference Proceedings of a three day conference on advances in geotechnical
engineering organised by the Institution of Civil Engineers and held at the Royal
Geographical Society London UK on 29ndash31 (pp 789-802) Thomas Telford
Publishing
Cavounidis S (1987) On the ratio of factors of safety in slope stability
118
analyses Geotechnique 37(2) 207-210
Chen R H amp Chameau J L (1983) Three-dimensional limit equilibrium analysis of
slopes Geotechnique 33(1) 31-40
Cheng Y M amp Lau C K (2014) Slope stability analysis and stabilization new methods
and insight CRC Press
Cheng Y M Lansivaara T amp Siu J (2008) Impact of convergence on slope stability
analysis and design Computers and Geotechnics 35(1) 105ndash113
Cheng Y M Li L Chi S chun amp Wei W B (2007) Particle swarm optimization
algorithm for the location of the critical non-circular failure surface in two-
dimensional slope stability analysis Computers and Geotechnics 34(2) 92ndash103
Cheng Y M (2003) Location of critical failure surface and some further studies on slope
stability analysis Computers and Geotechnics 30(3) 255ndash267
Cheng Y M Li L Lansivaara T Chi S C amp Sun Y J (2008) An improved
harmony search minimization algorithm using different slip surface generation
methods for slope stability analysis Engineering Optimization 40(2) 95ndash115
Chok Y H (2009) Modelling the effects of soil variability and vegetation on the stability
of natural slopes The University of Adelaide School (Doctoral dissertation)
Adelaide Australia
Cho S E amp Lee S R (2002) Evaluation of surficial stability for homogeneous slopes
considering rainfall characteristics Journal of Geotechnical and Geoenvironmental
Engineering 128(9) 756-763
Cheng Y M Lansivaara T amp Siu J (2008) Impact of convergence on slope stability
analysis and design Computers and Geotechnics 35(1) 105ndash113
Duncan J M Wright S G amp Brandon T L (2014) Soil strength and slope stability
Canada John Wiley amp Sons Inc
Duncan J M (1996) State of the Art Limit Equilibrium and Finite-Element Analysis of
119
Slopes Journal of Geotechnical Engineering 122(7) 577ndash596
Duncan J M (1992) State-of-the-art Static stability and deformation analysis In Proc of
Specialty Conf Stability and Performance of Slopes and Embankments-II (Vol 1 pp
222-266) ASCE
EKSTRAND D amp NYLANDER P Probabilistic Approach to Slope Stability
Department of Civil and Environmental Engineering Masterrsquos Thesis chalmers
university of technology Goumlteborg Sweden
Farah K Ltifi M amp Hassis H (2011) Reliability analysis of slope stability using
stochastic finite element method Procedia Engineering 10 1402ndash1407
Feng S J Chang J Y Shi H Zheng Q T Guo X Y amp Zhang X L (2019) Failure
of an unfilled landfill cell due to an adjacent steep slope and a high groundwater
level A case study Engineering Geology 262 105320
Fredlund D G (1987) Slope stability analysis incorporating the effect of soil
suction Slope Stability 113-144
Gens A Hutchinson J N amp Cavounidis S (1988) Three-dimensional analysis of slides
in cohesive soils Geotechnique 38(1) 1-23
GEO-SLOPE International (2015) Stability Modeling with SLOPE W 2007 Version In
GEO-SLOPE International Ltd Methods
Giger M W amp Krizek R J (1976) Stability of vertical corner cut with concentrated
surcharge load ASCE J Geotech Eng Div 102(1) 31-40
Griffiths D V Huang J amp Dewolfe G F (2011) Numerical and analytical
observations on long and infinite slopes International Journal for Numerical and
Analytical Methods in Geomechanics 35(5) 569-585
Griffiths D V amp Lane P A (1999) Slope stability analysis by finite
elements Geotechnique 49(3) 387-403
Griffiths D V amp Marquez R M (2007) Three-dimensional slope stability analysis by
elasto-plastic finite elements Geotechnique 57(6) 537-546
120
Hammah R Yacoub T Corkum B amp Curran J (2010) A comparison of finite
element slope stability analysis with conventional limit-equilibrium investigation
University of Toronto Toronto Canada
Hammouri N A Malkawi A I H amp Yamin M M (2008) Stability analysis of slopes
using the finite element method and limiting equilibrium approach Bulletin of
Engineering Geology and the Environment 67(4) 471
Hovland H J (1979) Three-dimensional slope stability analysis method Journal of
Geotechnical and Geoenvironmental Engineering 105(ASCE 14549 Proceeding)
Hungr O (1987) An extension of Bishops simplified method of slope stability analysis to
three dimensions Geotechnique 37 113-117
Huvenne V A Croker P F amp Henriet J P (2002) A refreshing 3D view of an ancient
sediment collapse and slope failure Terra Nova 14(1) 33-40
Itasca U D E C amp Code U D E (2011) Version 50 Itasca Consulting Group Inc
Minneapolis
Iverson R M (1990) Groundwater flow fields in infinite slopes Geotechnique 40(1)
139-143
J Jiang J C amp Yamagami T (2006) Charts for estimating strength parameters from slips
in homogeneous slopes Computers and Geotechnics 33(6-7) 294-304
Jiang J C amp Yamagami T (2008) A new back analysis of strength parameters from
single slips Computers and Geotechnics 35(2) 286-291
Johari A Fazeli A amp Javadi A A (2013) An investigation into application of jointly
distributed random variables method in reliability assessment of rock slope
stability Computers and Geotechnics 47 42-47
Kang F Han S Salgado R amp Li J (2015) System probabilistic stability analysis of
soil slopes using Gaussian process regression with Latin hypercube
sampling Computers and Geotechnics 63 13-25
121
Khabbaz H Fatahi B amp Nucifora C (2012) Finite element methods against limit
equilibrium approaches for slope stability analysis In Australia New Zealand
Conference on Geomechanics Geomechanical Society and New Zealand
Geotechnical Society
Leshchinsky D O V Baker R amp Silver M L (1985) Three dimensional analysis of
sslope stability International Journal for Numerical and Analytical Methods in
Geomechanics 9(3) 199-223
Leshchinsky D O V amp Baker R (1986) Three-dimensional slope stability end effects
Soils and Foundations 26(4) 98-110
Leshchinsky D amp Huang C C (1992) Generalized three-dimensional slope-stability
analysis Journal of geotechnical engineering 118(11) 1748-1764
Lin H amp Cao P (2012) Limit Equilibrium Analysis for the Relationships Among Slope
c Oslash and Slip Surface Electronic Journal of Geotechnical Engineering 17 185-195
Lin H amp Cao P (2011) Potential slip surfaces of slope with strength parameters
In Advanced Materials Research (Vol 243 pp 3315-3318) Trans Tech
Publications
Li B Li D Zhang Z Yang S amp Wang F (2015) Slope stability analysis based on
quantum-behaved particle swarm optimization and least squares support vector
machine Applied Mathematical Modelling 39(17) 5253-5264
Louis NY Wong (2014) Rock slope failure along non persistent joints insights from
fracture mechanics approach Nanyang Technological University Singapore
Malkawi A I H Hassan W F amp Sarma S K (2001) Global search method for
locating general slip surface using Monte Carlo techniques Journal of geotechnical
and geoenvironmental engineering 127(8) 688-698
Matsui T amp San K C (1992) Finite element slope stability analysis by shear strength
reduction technique Soils and foundations 32(1) 59-70
McCombie P amp Wilkinson P (2002) The use of the simple genetic algorithm in finding
122
the critical factor of safety in slope stability analysis Computers and Geotechnics
29(8) 699ndash714
Mercier D Coquin J Feuillet T Decaulne A Cossart E Pall H amp Saeligmundsson THORN
(2017) Geomorphology Are Icelandic rock-slope failures paraglacial Age
evaluation of seventeen rock-slope failures in the Skagafjoumlrethur area based on
geomorphological stacking radiocarbon dating and tephrochronology 296 45ndash58
Michalowski R L (1989) Three-dimensional analysis of locally loaded slopes
Geotechnique 39(1) 27-38
Mitchell J K Chang M Seed R B Mitchell J K Chang M Cahill E G amp
Cahill J R (1993) The Kettleman Hills Landfill Failure A Retrospective View of
the Failure Investigations and Lessons Learned In International Conference on Case
Histories in Geotechnical Engineering pp 1ndash15
Naderi M A (2013) Determination of the critical slip surface in slope stability
analysis (Master dissertation) Eastern Mediterranean University (EMU) Doğu
Akdeniz Uumlniversitesi (DAUuml) Famagusta TRNC
Namdar A (2011) Geometry in Slope Modeling and Design E-Journal of Science amp
Technology (C) 9ndash21
NAVFAC D 701 (1986)ldquo Soil Mechanicsrdquo Design Manual 7(01)
Nor A M (2010) Optimization of Cost Effectiveness for Slope Stability (Doctoral
dissertation) UMP
Oghli Z (2011) Analyzing slop stability by using shear strength reduction method
(Master dissertation) Aleppo University Aleppo Syria
Oh S amp Lu N (2015) Slope stability analysis under unsaturated conditions Case studies
of rainfall-induced failure of cut slopes Engineering Geology 184 96ndash103
Oh S amp Lu N (2015) Slope stability analysis under unsaturated conditions Case studies
of rainfall-induced failure of cut slopes Engineering Geology 184 96ndash103
123
Prajapati G 8 2017) Types of slope failure Retrieved from
httpswwwslidesharenetGhanshyamPrajapati3types-of-slope-failures
Runesson K amp Wiberg N E (1984) Stability analysis of natural slopes in clay by use of
the finite element method Chalmers University of Technology
Sengupta A amp Upadhyay A (2009) Locating the critical failure surface in a slope
stability analysis by genetic algorithm Applied Soft Computing Journal 9(1) 387ndash
392
SerraM (2013) Geotechnical stability analysis using student versions of FLAC PLAXIS
and SLOPEW Bachelor project University of Southern Queensland Australia
Seed R B Mitchell J K amp Seed H B (1990) Kettleman hills waste landfill slope
failure II stability analyses Journal of Geotechnical Engineering 116(4) 669-690
Sinai C (2012) Common Causes of Slope Failure Retrieved from
httpwwwsinaiconstructionnetLA-foundation-retrofit-blogcauses-of-slope-failure
Spencer E (1967) A method of analysis of the stability of embankments assuming
parallel inter-slice forces Geotechnique 17(1) 11-26
Stefano Utili G B C (2015) Landslide Hazards Risks and Disasters Retrieved from
httpswwwsciencedirectcomtopicsearth-and-planetary-sciencesslope-stability
Suman S (2015) Slope Stability Analysis Using Numerical Modelling (Doctoral
dissertation) National Institute of Technology Rourkela India
Swan C C amp Seo Y K (1999) Limit state analysis of earthen slopes using dual
continuumFEM approaches International Journal for Numerical and Analytical
Methods in Geomechanics 23(12) 1359-1371
Tsai T L amp Yang J C (2006) Modeling of rainfall-triggered shallow landslide
Environmental Geology 50(4) 525ndash534
Ugai K (1985) Three-dimensional stability analysis of vertical cohesive slopes Soils and
Foundations 25(3) 41-48
124
Ugai K (1988) Three-dimensional slope stability analysis by slice methods In Proc 6th
Inter Conf on Numer Meth in Geomech Innsbruck Austria
Wiberg N E Koponen M amp Runesson K (1990) Finite element analysis of
progressive failure in long slopes International Journal for Numerical and
Analytical Methods in Geomechanics 14(9) 599-612
Whitman R V amp Bailey W A (1967) Use of computers for slope stability analysis
Journal of Soil Mechanics amp Foundations Div
Widger R A (1976) Slope stability in unsaturated soils (Doctoral dissertation
University of Saskatchewan) Canada
Wright S G (1969) A study of slope stability and the undrained shear strength of clay
shales (Vol 2) University of California Berkeley
Wright S G Kulhawy F G amp Duncan J M (1973) Accuracy of equilibrium slope
stability analysis Journal of Soil Mechanics amp Foundations Div 99(Proc Paper
10097)
Xiao S Yan L amp Cheng Z (2011) A method combining numerical analysis and limit
equilibrium theory to determine potential slip surfaces in soil slopes Journal of
Mountain Science 8(5) 718ndash727
Xing Z (1988) Three-dimensional stability analysis of concave slopes in plan view
Journal of Geotechnical Engineering 114(6) 658-671
Zeroual Neacutee Dadouche F Lazhar B amp Zennir A (2011) Probabilistic analysis of slope
stability towards the slip by the kinematic method Physics Procedia 21 93ndash100
Zevgolis I E Deliveris A V amp Koukouzas N C (2019) Slope failure incidents and
other stability concerns in surface lignite mines in Greece Journal of Sustainable
Mining 18(4) 182-197
Zolfaghari A R Heath A C amp Mccombie P F (2005) Simple genetic algorithm
search for critical non-circular failure surface in slope stability analysis 32 139ndash152
125
APPENDIECS
126
APPENDIX 1
A11 Factor of safety of failed slopes
A111 Samples of failed slopes by SLOPEW software program
Figure A11 Failed slope at value 17 kNm3 of unit weight
127
Figure A12 Failed slope at value 21 kNm3 of unit weight by using SLOPEW
Figure A13 Failed slope at value 31 kNm3 of unit weight by using SLOPEW
128
Figure A14 Failed slope at value 16 of unit weight and internal friction angle by using
SLOPEW
Figure A15 Failed slope at value 21 of unit weight and internal friction angle by using
SLOPEW
129
Figure A16 Failed slope at value 31 of unit weight and internal friction angle by using
SLOPEW
130
A112 Factor of safety values for failed slopes by FLACSLOPE software program
Figure A17 Failed slope at value 25 kNm3 of unit weight by using FLACSLOPE
Figure A18 Failed slope at value 25 of unit weight and internal friction angle by using
FLACSLOPE
131
APPENDIX2
Failure arc possibilities of failed slope by SLOPEW
Figure A21 Failure arc possibilities for the value 17 kNm3 of unit weight
Figure A22 Failure arc possibilities for the value 21 kNm3 of unit weight
132
Figure A23 Failure arc possibilities for the value 31 kNm3 of unit weight
Figure A24 Failure arc possibilities for the value 16 of unit weight and internal friction
angle
133
Figure A25 Failure arc possibilities for the value 21 of unit weight and internal friction
angle
Figure A26 Failure arc possibilities for the value 31 of unit weight and internal friction
angle
COMPARATIVE STUDY OF SLOPE STABILITY BY
GEOTECHNICAL SOFTWARE PROGRAMS
A THESIS SUBMITTED TO THE GRADUATE
SCHOOL OF APPLIED SCIENCES OF NEAR EAST
UNIVERSITY
By
ABDALLA SHLASH
In Partial Fulfillment of the Requirements for the
Degree of Master of Science
in
Civil Engineering
NICOSIA 2020
Abdalla SHLASH COMPARATIVE STUDY OF SLOPE STABILITY BY
GEOTECHNICAL SOFTWARE PROGRAMS
Approval of Director of Graduate School of
Applied Sciences
Prof Dr Nadire CcedilAVUŞ
We certify this thesis is satisfactory for the award of the degree of
Master of Science in Civil Engineering
Examining Committee in Charge
Assoc Prof Dr Rifat Reşatoğlu Committee Chairman Department of Civil
Engineering Near East University
Assist Prof Dr Youssef Kassem Department of Mechanical
Engineering Near East University
Assist Prof Dr Anoosheh Iravanian Supervisor Department of Civil
Engineering Near East University
I hereby declare that all information in this document has been obtained and presented in
accordance with academic rules and ethical conduct I also declare that as required by
these rules and conduct I have fully cited and referenced all material and results that are
not original to this work
Name Last name Abdalla SHLASH
Signature
Date
ii
ACKNOWLEDGEMENTS
Foremost Irsquod like to express my sincere gratitude my supervisor Assist Prof Dr
Anoosheh Iravanian of the Civil Engineering Department at Near East University for her
patience motivation and valuable guidance The door to Assist Prof Dr Iravanian office
was always open whenever had a question about my research or when I ran into a trouble
This thesis would not have been possible without her
Fınally I want to express my very profound gratitude to my pacemaker my prestigious
father Dr Mohammed Saleh Shlash for his unlimited support and my sparking mother and
sisters for their love and pray and my beloved brother Dr Mohammed Noor
iii
To my familyhellip
iv
ABSTRACT
Soil slopes analysis and design has always been a major field in geotechnical engineering
Different methods have been developed and created to examine two and three dimensional
slopes based on various methods of assumption and assessment The factor of safety can
only be acquired accurately if the slopes critical failure surface is appropriately detected
Different software programs for analyzing and examining slope stability were used and
compared by knowing the parameters of soil strength
Throughout this study software programs such as PLAXIS SLOPEW and FLACSlope
were used to examine the difficulties of slope stability and determine the critical surface of
failure Different values of shear strength parameters were chosen to investigate the
authenticity and efficiency of these programs cohesion (c) soilrsquos unit weight (ɤ) and
internal friction angle (Oslash) and their effect on the value of the factor of safety were
examined Eventually to obtain from various software programs the results have been
contrasted and shared The research findings showed that the slopes factor of safety
changes with changing cohesion soils unit weight and internal friction angle In addition
the slip surface is affected by (λ) the dimensionless function associated with the cohesion
the internal friction angle and the unit weight
The conclusions showed that compared to SLOPEW PLAXIS is easier to use as slope
stability assessment software It gives about 5 lower factor of safety value than
SLOPEW On the other hand FLACSlope is the most complicated software and usually
gives lower value for the factor of safety than SLOPEW and PLAXIS
Keywords slope stability PLAXIS SLOPEW FLACSLOPE factor of safety length of
failure arc
v
OumlZET
Zemin şev stabilitesive tasarımı jeoteknik muumlhendisliğinde her zaman oumlnemli bir alan
olmuştur Ccedileşitli varsayım ve değerlendirme youmlntemlerine dayanarak iki ve uumlccedil boyutlu
eğimleri incelemek iccedilin farklı youmlntemler geliştirildi ve yaratıldı Guumlvenlik faktoumlruuml ancak
eğimin kritik kayma yuumlzeyi uygun şekilde tespit edildiğinde doğru bir şekilde elde
edilebilir Şev stabilitesini analiz etmek ve incelemek iccedilin farklı yazılım programları
kullanılmış ve zemin dayanımı parametreleri karşılaştırılmıştır
Bu ccedilalışma boyunca şev stabilitesinin zorluklarını incelemek ve kritik kayma yuumlzeyini
belirlemek iccedilin PLAXIS SLOPEW ve FLACSlope gibi yazılım programları
kullanılmıştır Bu programların gerccedilekliğini ve verimliliğini araştırmak iccedilin farklı kayma
dayanımı parametrelerinin değerleri seccedililmiştir kohezyon zeminin birim hacim ağırlığı ve
iccedil suumlrtuumlnme accedilısı ve bunların guumlvenlik faktoumlruumlnuumln değeri uumlzerindeki etkileri incelenmiştir
Sonunda ccedileşitli yazılım programlarından elde edilen sonuccedillar karşılaştırıldı ve paylaşıldı
Araştırma bulguları eğimin guumlvenlik faktoumlruumlnuumln değişen kohezyon zeminin birim hacim
ağırlığı ve iccedil suumlrtuumlnme accedilısı ile değiştiğini goumlstermiştir Ek olarak kayma yuumlzeyi
kohezyon iccedil suumlrtuumlnme accedilısı ve birim hacim ağırlık ile ilişkili boyutsuz bir fonksiyondan
(λ) etkilenir
Elde edilen sonuccedillar SLOPEW ile karşılaştırıldığında PLAXISin şev stabilitesi
değerlendirme yazılımının daha kolay olduğunu goumlstermiştir SLOPEWden yaklaşık 5
daha duumlşuumlk guumlvenlik faktoumlruuml verir Oumlte yandan FLACSLOPE guumlvenlik faktoumlruuml iccedilin
SLOPEW ve PLAXISten daha duumlşuumlk bir değer verir
Anahtar Kelimeler şev stabilitesi PLAXIS SLOPEW FLACSLOPE emniyet faktoumlruuml
arıza uzunluğu
vi
TABLE OF CONTENTS
ACKNOWLEDGMENTS ii
ABSTRACT iv
OumlZET v
TABLE OF CONTENTS vi
LIST OF TABLES x
LIST OF FIGURES xii
LIST OF SYMBOLS AND ABBREVIATIONS helliphelliphelliphelliphelliphelliphelliphelliphelliphelliphelliphelliphelliphellip xiv
CHAPTER 1 INTRODUCTION
11 Overview 1
12 Importance of Research 2
13 Aim of the Study 3
14 The Shear Strength Parameters as Input Data 4
15 Common Causes of Slope Failure 5
151 Steepness of the slope 5
152 Water and drainage 6
153 Soil composition 6
154 Vegetation 6
155 Bedding planes 7
156 Joints and fractures 7
157 Sudden shocks 7
16 Types of Slope Failure 8
161 Planar failure 8
162 Wedge failure 8
163 Circulars failure 10
164 Two block failure 11
165 Toppling failure 12
17 Factors affecting Slope Stability 14
171 Slope geometry 14
vii
172 Geological structure 14
173 Lithology 15
174 Ground water 15
175 Dynamic forces 16
176 Internal friction anglehelliphelliphelliphelliphelliphelliphelliphelliphelliphelliphelliphelliphelliphelliphelliphelliphelliphelliphelliphellip 16
177 Cohesion 17
18 Factor of Safety 17
19 Organization of Thesishelliphelliphelliphelliphelliphelliphelliphelliphelliphelliphelliphelliphelliphelliphelliphelliphelliphelliphelliphelliphelliphelliphellip 21
CHAPTER 2 LITERATURE REVIEW
21 Introduction 22
22 Infinite Slopes 22
221Dry condition 23
222 Condition with seepage 24
23 Finite Slopes 25
231 Difference between LE and FE methods 25
232 Finite element methods 26
233 Limit equilibrium methods 30
232 Previous studies on analyzing 2D slope stability 42
24 Soil Slope Failure Surface Searching Methods 51
241 Simulated annealing method 51
242 Simple genetic algorithm 51
243 Leapfrog algorithm method 52
244 Other methods 53
25 Potential Slope Failure Surface and Soil Strength Parameters 53
CHAPTER 3 METHODOLOGY
31 Introduction 54
32 Methodology 54
33 Materials 56
331 Soil 56
viii
332 Water level 56
34 Software and Programs 57
341 FLACSLOPE 57
342 SLOPEW 62
343 PLAXIS 65
CHAPTER4 RESULTS AND DISCUSSION
41 Introduction 71
42 Impact of Soil Strength and Slope Geometry Parameters on Factor of Safety 71
421 Impact of Unit weight γ on the factor of safety 71
422 Impact of Cohesion c on the Factor of Safety FS 74
423 Impact of Friction Angle Oslash on the Factor of Safety FS 76
424 Impact of slope geometry on the factor of safety 78
43 Impact of Soil Strength and Geometry Parameters on Slip Surface 79
431 Impact of cohesion on the slip surface 81
432 Impact of internal friction angle on the slip surface 82
433 Impact of unit weight on the slip surface 83
434 Impact of cohesion and unit weight on the Slip Surface 84
435 Impact of internal friction angle and unit weight on the slip surface 85
436 Impact of internal friction angle and cohesion on the slip surface 85
437 Impact of slope geometry on the slip surface 86
44 Impact of Soil Strength and Geometry Parameters on Factor of Safety 88
441 Impact of cohesion on the factor of safety 88
442 Impact of internal friction angle on the factor of safety 89
443 Impact of unit weight on the factor of safety 89
444 The combined impact of unit weight and cohesion the on factor of safety 90
445 The Combined impact of internal friction angle and ɤ on factor of safety 91
446 The combined effect of internal friction angle and cohesion on factor of
safety 92
447 Impact of slope geometry on the factor of safety 93
45 Impact of soil strength and geometry parameters on slip surface 94
451 Impact of Cohesion on the Length of Failure Arc 95
ix
452 Impact of internal friction angle on the length of failure arc 95
453 Impact of unit weight on the length of failure arc 96
454 The combined impact of cohesion and ɤ on the length of failure arc 97
455 The combined impact of internal friction angle and the unit weight on the
length of failure arc 98
456 The combined impact of internal friction angle and cohesion on the length of
failure arc 99
457 Impact of slope geometry on the length of failure arc 100
46 Re-Analyzing Models by PLAXIS and Comparison of Results 103
47 Re-Analyzing the Previous Models by FLACSlope 111
CHAPTER 5 CONCLUSION AND RECOMMENDATIONS
51 Conclusions helliphelliphelliphelliphelliphelliphelliphelliphelliphelliphelliphelliphelliphelliphelliphelliphelliphelliphelliphelliphelliphelliphelliphelliphelliphelliphellip 114
52 Recommendations helliphelliphelliphelliphelliphelliphelliphelliphelliphelliphelliphelliphelliphelliphelliphelliphelliphelliphelliphelliphelliphelliphelliphelliphellip 115
REFERENCES helliphelliphelliphelliphelliphelliphelliphelliphelliphelliphelliphelliphelliphelliphelliphelliphelliphelliphelliphelliphelliphelliphelliphelliphelliphelliphellip 116
APPENDICES
Appendix 1 Factor of safety of failed slopes helliphelliphelliphelliphelliphelliphelliphelliphelliphelliphelliphelliphelliphelliphellip 126
Appendix 2 Failure arc possibilities of failed slope by SLOPEWhelliphelliphelliphelliphelliphelliphellip 130
x
LIST OF TABLES
Table 11 Factor of safety values guidelines 19
Table 2 1 Previous studies analyzing 2D slope stability 43
Table 2 2 Methods of Analyzing 3D Slope Stability 50
Table 3 1 Soil strength parameters 56
Table 3 2 Required soil properties for FLACSLOPE 57
Table 3 3 Required soil properties for SLOPEW 62
Table 3 4 Required Soil Properties for PLAXIS 65
Table 4 1 effect unit weight on FOS 72
Table 4 2 Effect C on FOS 74
Table 4 3 effect Oslash on FOS 76
Table 4 4 Effect of slope geometry on FOS 79
Table 4 5 Effect of cohesion on the slip surface 81
Table 4 6 Effect of internal friction angle on the slip surface 82
Table 4 7 Effect of unit weight on the slip surface 83
Table 4 8 Effect of cohesion and unit weight on the Slip Surface 84
Table 4 9 Effect of internal friction angle and unit weight on the slip surface 85
Table 4 10 Effect of internal friction angle and cohesion on the slip surface 86
Table 4 11 Effect of slope geometry on the slip surface 87
Table 4 12 Models of cohesion values chosen for the factor of safety analysis-
PLAXIShelliphelliphelliphelliphelliphelliphelliphelliphelliphelliphelliphelliphelliphelliphelliphelliphelliphelliphelliphelliphelliphelliphelliphelliphellip 103
Table 4 13 Models of internal friction angle values selected for the factor of safety
analysis for PLAXIS softwarehellip 104
Table 4 14 Models of unit weight values chosen for factor of safety analysis for -
PLAXIS 104
Table 4 15 Models of ɤ and C values chosen for FOS analysis by PLAXIS software
helliphelliphelliphelliphelliphelliphelliphelliphelliphelliphelliphelliphelliphelliphelliphelliphelliphelliphelliphelliphelliphelliphelliphelliphelliphelliphelliphellip 105
Table 4 16 Models of ɤ and Phi values chosen for the FOS analysis for PLAXIS
software 105
Table 4 17 Models of internal friction angle and cohesion values chosen for the
factor of safety analysis for PLAXIS softwarehelliphelliphelliphelliphelliphelliphelliphelliphellip 106
xi
Table 4 18 the difference of FOS between PLAXIS and SLOPEW 107
Table 4 19 Effect of slope geometry on the slip surface - PLAXIS 109
Table 4 20 The difference of FOS between PLAXIS and SLOPEW for slope
geomerty 110
Table 4 21 Reanalyze models by using FLAC software (shear strength parameters
models) 111
Table 4 22 Reanalyze models by using FLAC software (slope geometry models) 112
Table 4 23 The difference between the three software packages (shear
strength parameters models) 112
Table 4 24 The difference between the three software packages (slope geometry
models) 112
xii
LIST OF FIGURES
Figure 1 1 Steepness of the Slope (Guumlzelyurt) 5
Figure 1 2 Planner failure 8
Figure 1 3 Slant wedge failure 9
Figure 1 4 Straight wedge failure 10
Figure 1 5 Circular failure 11
Figure 1 6 Two block failure 12
Figure 1 7 The rotation in toppling failure 13
Figure 1 8 Toppling failure 13
Figure 1 9 Geometrical definition of rock slope stability with plane sliding 19
Figure 2 1 Details for infinite slope 23
Figure 2 2 Divide the structure to many geometric forms 27
Figure 2 3 Swedish Circle 31
Figure 2 4 Friction Circle Method 34
Figure 2 5 Log-Spiral Method 36
Figure 2 6 Ordinary Method of Slices 38
Figure 2 7 Simplified Bishop Method 39
Figure 2 8 Spencerrsquos Method 42
Figure 2 9 Simple Genetic Algorithm 52
Figure 3 1 Insert slopersquos coordinates on FLACSLOPE 58
Figure 3 2 Check on slopersquos drawing 59
Figure 3 3 Assign material properties on FLACSLOPE 60
Figure 3 4 FLACSLOPE Assign mesh 60
Figure 3 5 The difference between fine and medium meshes for the value 17 kNm3 of
unit weight (a) Fine mesh (b) Medium mesh 61
Figure 3 6 Factor of safety value on FLACSLOPE 62
Figure 3 7 SLOPEW set units 63
Figure 3 8 Assign and create the properties of material on SLOPEW 64
Figure 3 9 SLOPEW factor of safety value 65
Figure 3 10 Set units on PLAXIS 66
Figure 3 11 Drawing in PLAXIS 67
xiii
Figure 3 12 PLAXIS standard fixties 67
Figure 3 13 Assign and create the properties of material on PLAXIS 68
Figure 3 14 Determine the mesh size on PLAXIS 69
Figure 3 15 PLAXIS before generating mesh 69
Figure 3 16 PLAXIS after generating the mesh 70
Figure 3 17 Slope displacement on PLAXIS 70
Figure 4 1 (a) Effect of unit weight on Slip Surface (b) Exaggerated Part of (a) 73
Figure 4 2 (a) Effect of C on Slip Surface (b) Exaggerated Part of (a) 75
Figure 4 3 (a) Effect of C on Slip Surface (b) Exaggerated Part of (a) 77
Figure 4 4 Models for effect slope geometry on FOS 79
Figure 4 5 Slope model geometry 80
Figure 4 6 Effect of cohesion on the factor of safety 88
Figure 4 7 Effect of internal friction angle on the factor of safety 89
Figure 4 8 Effect of ɤ on the factor of safety 90
Figure 4 9 The combined effect of unit weight and cohesion the on factor of safety 91
Figure 4 10 The combined effect of internal friction angle and ɤ on factor of safety 91
Figure 4 11 The combined effect of internal friction angle and cohesion on factor of
safety 92
Figure 4 12 Effect of Alpha angle on factor of safety 93
Figure 4 13 Effect of Beta angle on factor of safety 94
Figure 4 14 Effect of cohesion on the length of failure arc 95
Figure 4 15 Effect of internal friction angle on the length of failure arc 96
Figure 4 16 Effect of ɤ on the length of failure arc 97
Figure 4 17 The combined effect of cohesion and ɤ on the length of failure arc 98
Figure 4 18 The combined effect of internal friction angle and ɤ on the length of
failure arc 99
Figure 4 19 The combined effect of cohesion and internal friction angle on the
length of failure arc 100
Figure 4 20 The effect of Alpha angle on the length of failure arc 101
Figure 4 21 The effect of Beta angle on the length of failure arc 101
Figure 4 22 (a) Effect of Alpha angle on length of Arc and (b) zoomed Part of (a) 102
xiv
LIST OF SYMBOLS AND ABBREVIATIONS
FOS Factor of Safety
FEM Finite Elements Method
LEM Limit Equilibrium Method
C Cohesion
γ Unit Weight
Oslash Internal Friction Angle
α Horizontal Angle of Slope (Figure 44)
β Vertical Angle of Slope (Figure 44)
AutoCAD Automatic Computer Aided Design
FLAC Fast Lagrangian Analysis of Continua
H Height of Slope
La Length of Failure Arc
Le Slope Surface Entry Distance
1
CHAPTER 1
INTRODUCTION
11 Overview
There are many problems encountered by the engineer student or executor when it comes
to slope stability subject The groundwork should be set up for predicting such problems
and devising appropriate solutions in case of failure occurrence One of the common cases
that is needed to be studied is the balance and stability of the earthworks in some
installation cases such as buildings and archaeological walls on slopes Practically every
phenomenon in nature geological or mechanical could be described with the help of
geotechnical laws so the use of mathematical models for studying the behavior of
geotechnical structures is an important part of geometrical analysis hence the importance
of understanding is how to handle modeling the software programs
The goal of any natural or manmade slopes stability analysis is to determine the failure
surface with the minimum value of factor of safety It is important to identify the critical
failure surface for the specified slope to find the minimum factor of safety Therefore
different methods of searching and optimizing have been used in the past They all
however have the same limitation which is the problem of using hand calculations
Throughout this study the impact of parameters of soil on the slopersquos failure surface and
factor of safety was studied It is possible to determine the critical failure surface for a
given slope by comparing the factor of safety from several experiment slip surfaces The
surface of the slip with the smallest factor of safety is viewed to be the surface of critical
failure
Basically therersquore two types of slopes natural and manmade (artificial) Each of these
types may be composed of rock or soil Natural slopes are also divided into two types
infinite slopes eg the highway between two cities with different sea level rise or
mountains The other type of natural slopes is finite slopes (eg hills) This study is about
finite slopes but will discuss about infinite slops too and how it is analyzed
2
Instances for natural slopes could be named as slope of the mountains slopes on both
sides of the rivers slope of the bottoms of the rivers from the source up to the downstream
Examples on manmade slopes could be counted as slopes of the bridges and slopes of sides
of roads railways and dams
These slopes have internal forces make them balanced against the forces that cause the
collapse of the slope The failure triggering forces could be named as gravity the forces of
water flow through the soil and the low value of cohesion of soil granules On the other
hand the force that resists the collapse of slope is mainly shear force (AbdelRahman
2019) If λ (the correlation between shear strength parameters and potential slip surface Eq
245) is constant the surface of the slip does not adjust with the switch in the parameters of
the shear strength
With the development in technology software packages using the finite difference and
finite element methods have increased in popularity as they head to possess a wide range of
characteristics (Hammouri et al 2008)
The outputs of this study showed that the slopes formed of smaller grains of soil the more
stable will be silty and well-graded soils are more stable than soils with coarse grains such
as gravel and sandy soils also slopes with the heavier soil in terms of unit weight has less
stability Slopes made from boulders or the ones with high content of larger grains have
less stability than slopes formed by gravelly soil
In this study it found that all slopes failed when soil unit weight value more than 15 kNm3
and the other two parameters are constant which represent clayey and silty sands also
when both parameters ɤ and Oslash changed together and the third parameter cohesion is
constant (which represent silty clay) the slopes have failed as well
12 Importance of Research
During the 1960s the science of soil mechanic was adopted on theory and limited empirical
information (Oghli 2011) Modeling of soils with heterogeneous and variable
characteristics varying with ambient conditions was very difficult especially experimental
techniques were doing simple tests when computers were not available at the time but
3
given the rapid scientific development of the world and the computer revolution using
programming that relies on numerical methods has become easier and contributes to the
solution of many geotechnical issues The design of the complex installations of our time
relies on the use of modern computer and software to complete the design in its optimal
form
This research focuses on theory and practice in which we hope to help narrow the gap
between theory and practice by contributing to the use and selection of the best modeling
software packages that are being used by geotechnical engineers globally thus enable
colleague engineers to use these programs and to realize how to deal with the results
obtained from this software
Combining the analysis of slope stability within the design will help to prevent any
geotechnical collapse during the life of the design and throughout construction (Bromhead
1992)
13 Aim of the Study
The widespread use of computers in engineering is the result of progress in production of
easy to use software and the proliferation of personal computers in the world So it can be
said that the design of structures or complexed slopes without the use of computers have
become very rare The design of complex installations of our time relies on the use of
modern computer and software to complete the design in its optimal form
At present the problem of slope stability is one of the main issues facing workers and
engineers in soil field there is still a big distinction between the scientists about the best
way to calculate the stability of the slopes (Oghli 2011)
The main objectives of this study are as follows
1- Extensive literature review to study the theoretical background of the most widely and
commonly used methods of analyzing slope stability as well as analyses of critical surface
techniques
4
2- Using various slope stability analysis software programs to evaluate the impacts of soil
strength parameters (cohesion unit weight internal friction angle) and slope geometry
parameters (Height of the slope vertical angle of the studied slope Alpha and the
horizontal angle of the slope Beta) as shown in Figure 44 on factor of safety and critical
slip surface
3- Compare the results of the different analysis software programs of slope stability in this
thesis
4- Correlate the relationship between parameters of soil strength and slope geometry and
critical slip surface and obtain a numerical equations about the relation between failure
arcrsquos length and soil strength parameters
14 The Shear Strength Parameters as Input Data
Cohesion unit weight and internal friction angle are the shear strength parameters were
chosen as input for software the reason can be mainly explained as
a- Main soil properties and altering each of them is possible in real life not only by
software packages but by many methods (eg injections) which it happened in two areas in
Hong Kong Fung Fae Terrance and Thorpe Manor (Fredlund 1987)
b- Cohesion (c) internal friction angle (Oslash) and soil unit weight (ɤ) are the interpolation of
the software used in this study
c- Cohesion internal friction angle and unit weight are the only factors affecting the length
of failure arc (Naderi 2013)
d- The increase of C Oslash positively affect FOS on the other hand increasing of unit weight
decrease Factor of Safety FOS so it will be a combination of decreasing and increasing
FOS and soil parameters Realizing the range can change each of these parameters which it
will help in predicting the situation in real life
5
15 Common Causes of Slope Failure
To determine where to start the prevention of slope failure in the property first of all we
need to take the time to understand the factors that lead to slope failure All things
considered slope restoration is definitely not a one size fits all arrangement Each slope is
diverse with regards to geography soil creation vegetation and several other variables
Therefore for any slope stability strategy to viably prevent the risk of avalanches and
mudslides it ought to be tailor-fit to the slope on which it is to be implemented on and the
factors of the instability of such a slope Here are some of the common reasons of slope
failure
151 Steepness of the slope
Its known that the steeper a slope is the more volatile it becomes Its valid for making
sand castles and its valid for making hillside homes The natural response of steep slopes
is to move a portion of its materials downwards until it achieves a natural angle of repose
Any type of slope adjustment regardless of whether it is through natural methods for
example a stream undercutting the banks of a river or by laborers expelling an area of the
slopes base to construct streets will affect the slopes stability (Sinai 2012) Figure 11
shows a steep slope in Northern Cyprus
Figure 11 Steepness of the Slope (Guumlzelyurt-Cyprus)
6
152 Water and drainage
Water is denser than air multiple times Amid overwhelming downpours when the water
replaces air between the grains of soil the earth in slopes turns significantly heavier
This turns into an issue when the earth is being kept down by a retaining wall at its base In
particular if the heaviness of the earth behind the retaining wall surpasses the retaining
wallrsquos capacity limit the retaining wall will collapse in a disastrous deluge
And likewise water decreases grain-to-grain contact which lessens the cohesiveness
Beside changes in the groundwater fluid weight in slope rocks amid the rainy season water
saturation increases downslope mass movementrsquos probability
153 Soil composition
The structure of the slopes soil is an imperative factor with regards to preventing slope
failure Distinctive sorts of soils will have altogether different qualities with regards to
frictional resistance from erosion and cohesion among the grains For example loose soil
or sand has low cohesion and will effectively erode when immersed in water Soils that
have a lot of clay then again will in general enlarge when saturated by water this makes
them heavier and progressively tends to motion (Aaron amp Mcdougall 2019)
154 Vegetation
The quantity and type of vegetation in a slope is also proportional to that slopersquos strength
Vegetation (especially its roots) holds the soil in position and makes it more erosion
resistant The more widespread of vegetation the more roots are so the more it can hold the
soil in position The more vegetation there is also the more steady the slope is probably
going to be This is the reason behind why slopes that have had their vegetation removed
or annihilated by fires are prime reason for slope failures in the rainy season (Huvenne
Croker amp Henriet 2002)
7
155 Bedding planes
A bedding plane is fundamentally a surface that isolates a stratified rock layer or bed from
another layer (Mercier et al 2017) It seems like margarine spread between two pieces of
bread because of their nature there is also a high risk of slope failure in exposed beds in a
slope This risk is exacerbated if the bed contains a weak rock layer sandwiched
Imagine placing a glass panel on a slide and a block of wood on top of it to illustrate The
surfaces of contact between the slide glass and wood are angled downward bedding
planes Although the frictional force that keeps the block of wood on the glass strong the
connection of glass slide is weak causing the whole structure to erode downwards (Sinai
2012)
156 Joints and fractures
Joints and fractures are natural cracks that occur in rocks slope These are caused by
natural rock expansion due to cooling or erosion-related removal of overlying rocks The
cohesion between the rocks that make up the slope is greatly reduced for these cracks
increasing the likelihood of a slope landslide (Aaron amp Mcdougall 2019)
157 Sudden shocks
Finally sudden shocks such as hurricanes earthquakes blasting heavy truck passage
volcanic eruptions and others can trigger soils sudden mass movement in the slopes
(Mercier et al 2017)
8
16 Types of Slope Failure
161 Planar failure
Planar failure happens when an intermittence hits almost parallel to the seat of the slope
and the slope of the seat converges at a lower point allowing the material to slide over the
irregularity as shown in Figure 12 Variety can arise in the procedure if the slipping plane
is a mixture of joint sets that build up a straight path
Analyzing of a planar failure involves analyzing the slopes geometry and consideration of
two cases
A) Slope with tension crack in the upper face
b) Slope for tension crack in the face of the slope
Figure 12 Planner failure (Louis NY Wong 2014)
162 Wedge failure
The 3D wedge failures happen when two cutouts overlap so that the material wedge
formed over the cutouts can slide out in a way parallel to the intersection line between the
two cutouts It is particularly prevalent in the individual bench scale but may also provide
the mechanism of failure for a large slope where structures are very continuous and
thorough At the point when two cutouts strike at a slant over the slope face and their line
of convergence in the slope the rockrsquos wedge resting on these cutouts will slip down over
9
the line of crossing point as long as the decrease of the line is significantly greater than the
friction angle and the shearing part of the plane of the discontinuities is less than the total
downward force The total force of downward is the downward component of the wedges
weight and the wedges external forces acting along the wedge
In this type of failure there is two forms
a) Slant wedge failure as shown in Figure 13
b) Straight wedge failure as shown in Figure 14
Figure 13 Slant wedge failure (Prajapati 2017)
10
Figure 14 Straight wedge failure (Louis NY Wong2014)
163 Circulars failure
The great work in Sweden at the starting of the century assured that the shape of a circular
arc resembles the failure surface in spoil soil slopes or dumps as shown in Figure 15 This
failure may occur in soil slopes when the joint sets are not defined very well the circular
method occurs If the material of the slopes of the spoil dump is weak like soil heavily
joined or broken rock mass a single discontinuity surface defines the failure but tends to
follow a circular path The circular failure conditions are as follows
a When compared to the slope the individual soil or rock mass particles comprising the
slopes are small
b Because of their shape the particles are not locked and tend to behave as soil
11
Figure 15 Circular failure (Louis NY Wong 2014)
Types of circular failure
A) Slope failure in this kind the rupture surface arc meets the slope above the slope toe
this occurs when the angle of the slope is very high and the soil near the toe has the high
resistance
B) Toe failure the rupture surface arc meets the slope of the toe in this kind of failure
C) Base failure the arc of the failure passes underneath the toe and into the slope base in
this type of failure This happens when the angle of the slope is low and the soil under the
base is more plastic and softer than the soil which is above the base
164 Two block failure
These types of failures are significantly less rife way of slope failure of rock than single
square failures for example the planes and the 3 dimensional wedge and thusly are just
quickly thought to be here A few techniques for solution exist and each might be proper at
some dimension of examination
12
Figure 16 Two block failure (Stefano Utili 2015)
165 Toppling failure
Overturning or toppling was recognized as a mechanism for failure of rock slope by
several investigators and was postulated as the cause of several failures ranging from small
to large Very often stability depends on the stability of one or two key blocks in slopes
with near-vertical joints The system may collapse once they are disturbed or this failure
was assumed to be the reason of several failures ranging from small to massive as shown in
Figures 17 This type of failure involves rotation around some fixed base of rock blocks as
shown in Figure 18 In general when the slopes of the hill are very steep this type of
failure occurred
13
Figure 17 The rotation in toppling failure (Louis NY Wong 2014)
Figure 18 Toppling failure (Amini amp Ardestani 2019)
14
17 Factors Affecting Slope Stability
171 Slope geometry
Height the overall angle of slope and surface area of failure are the basic parameters of the
geometric design of the slope Stability of the slope decreases sharply when the slope
height increases The chances of failure at the rear of the crest increase when the overall
slope angle is increased and it must be considered in order to avoid any kind of ground
deformation at the periphery of the slope structure An overall angle of the slope 45 deg is
considered safe for mines under normal circumstances The slopes curvature also has a
strong impact on the instability Convex slopes section in slope design should be avoided
The slope is higher and steeper the stability is lower
172 Geological structure
The main geological structure in any structure (building mines railways etc) affecting the
stability of the slopes is
1 Dip quantity and direction
2 Zones of shear intra-formational
3 Joints and interruptions
a Reduce strength of the shear
b Permeability change
c Acts as sub-surface drain and failure plains
4 Faults
a Weathering and changing along with faults
b Act as conduits of groundwater
c Provides a likely failure plane
15
If strata dip in the excavations instability may occur Faults provide a very low strength
lateral or rear release plane and therefore the strata are greatly disturbed If there is some
kind of clay or soil band between two rock bands the stability will be greatly impeded
Joints and bedding planes also add weakness to the surface Stability of the slope also
depends on the available strength of the shear along the surface its orientation towards the
slope and the action of the water pressure on the surface The shear strength that can be
deployed along the joint surface based on the surfaces functional properties and the stress
that is transmitted to the surface as normal Joints can make a situation where a
combination of joint sets creates a surface cross
173 Lithology
Rock materials that form a pit slope determine the strength of the rock mass modified by
faulting weathering discontinuities past operations and folding The strength of low rock
mass is characterized by circular stability is restricted by ravelling and rock falling such
as the slope formation in a massive sandstone Pit slopes with weathered rocks or alluvium
on the surface have low shear strength and if water flows through them the strength will
be further reduced These kinds of slopes have to be flatter
174 Ground water
Following modifications the existence of ground water is the reason
a) It alters the parameters of cohesion and friction
b) It decrease the normal stress
It can cause increased thrust or even deriving forces and has a extremely adverse impact on
the stability of the slopes Both physical and chemical effects of water in joints can change
the friction and cohesion of the surface of discontinuity Physical influence decrease the
shearing resistance along a failure plane by elevating reducing the frictional resistance and
the joints so thus decreasing the normal stress
16
175 Dynamic forces
Due to the vibration induced by the blasting process shear stress is increased maximizing
the dynamic acceleration for the material which in turn creates slope plane instability That
accelerates ground motion resulting in rock fracturing Because of the blasting process the
angles of the bench face also increase The impacts of poor blasting methods are caused by
bench instability Because of back break and blast damage these variables also influence
rock mass failure ie bench face angle blasting vibrations Many soft blasting methods
have been implemented to decrease these implications for small-scale slopes In the event
of bigger slopes blasting has less adverse effects on the general stable slope angle due to
back break and blast harm of benches The high frequency waves generated as a result of
the blasting 12 P a g e method ban big rock masses in the displacement method Blasting-
induced defects are therefore a tiny issue for large-scale slopes
176 Internal friction angle
It is the angle between the resulting force and the normal force when the shearing stress
causes the failure to occur Internal friction angle is a measurement of any material capable
of withstanding shear stress amount The factors are responsible about soil grains
roundness quartz content and particle size
17
177 Cohesion
Cohesion is the property of material that measures to resist deforming or breaking force
As a result of the loading process it is also caused by negative capillary pressure and pore
pressure or by electrostatic forces for over-associated clay Slopes with less strength of
cohesion are less stable
Cohesive force factors are
a Friction
b Particular stickiness
c Grains cementation by silica or calcite
d Artificial reinforcement
e Content of water
f Repeated wetting and drying expansion or contraction
g Downhill in slopes
h Earthquake or blast vibrations
18 Factor of Safety
Simply FOS is the ratio of resisting force of driving force F = 119878
120591 (Duncan Wright amp
Brandon 2014) or ratio of shear strength to that needed to keep the slope stable in case
only stable slope without any structure on it
The collapse of any slope is due to the inability of the shear resistance of the sliding block
to overcome the shear stresses Safety action is the value through which the stability state
of the slopes is checked
As it is mentioned before there are two types of slopes soil slopes and rock slopes In this
study the soil slopes are modeled and analyzed but rock slopes will be discussed as well
Analysis of rock slopes stabilization is a branch of rock engineering that is extremely likely
to be treated with probabilism Probabilistic assessment of rock slope stabilization was
18
used as an efficient tool for assessing uncertainty in variables and gained significant
attention in the literature
Figure 19 illustrates planar sliding rock slope and its parameters The equation for
determining the factor of safety can be articulated for this type of sliding failure as
FOS =cA+(W(cosψpminusα sin ψp)minusUminusFwsinψp)tanOslash
W(sin ψp+α cos ψp)+Fw cos ψp )11)
Z = H(1-radic119888119900119905120595119891 119905119886119899120595119901 ) )12)
W =1205741198672
2[(1- (
119885
119867)2) 119888119900119905120595119901 minus cot 120595119891 )13)
U = 120574119908119885119908119860
2 )14)
Fw=120574119908119885119908
2
2 )15)
A=119867minus119885
119904119894119899120595119901 )16)
Figure 19 Rock slope geometrical definition with plane slipping (AJohari et al
2013)
Where
FOS the factor of safety contra slipping
19
Z tension crack depth
Zw water in tension crack depth
A wedge area
W rock wedge weight resting on failure surface
H the overall height of the slope
U uplift force due to water pressure for failure surface
Fw the horizontal force for water in crack a is the acceleration of horizontal earthquake
C cohesive strength over sliding surface
Oslash sliding surface friction angle
ψp failure surface angle ) measured from horizontal(
ψf slope face angle )measured from horizontal(
γr rockrsquos unit weight
γw water unit weight
Factor of safety guidelines values for different cases are shown in Table 11
Table 11 Factor of safety values guidelines (Suman 2015)
Factor of safety value Details of the slope
FOS lt 10 Unsafe
FOS between 10 and 125 Questionable Safety
FOS between 125 and 14 Satisfactory for routine cuts and fills but
questionable for dams or where failure
would be catastrophic
FOS gt 14 Satisfactory for dams
20
For extremely unlikely loading conditions factor of safety can be as small as 12-125
even for dams Eg situations based on seismic impacts or where the water level in a
reservoir is rapidly declining (Suman 2015)
Mitchell et al 1993 and Duncan (1992) found that factor of safety which calculated by
using 3D analyzes will always be higher than or equal to the factor of safety calculated by
using 2D analyzes There are various methods for formulating factor of safety usually each
of the techniques of analysis has its own formula for FOS but the most popular formula
assumes that the FOS is constant and can be divided into two types Moment equilibrium
and Force equilibrium (Cheng amp Lau 2008)
21
19 Organization of Thesis
This thesis is made up of 5 chapters
Chapter 1 This chapter gives the general information regarding slope stability in addition
to its factors types and common cases of slope failure The aims objectives scope and
limitations of research are also stated
Chapter 2 This chapter presents literature review which it discussed stability of the slope
analysis methods a general view about infinite slopes and slip surface seeking approaches
comparison between slope stability analysis methods relationship between soil strength
parameters location of failure surface and overview about some previous studies about 2D and 3D
analyzing methods
Chapter 3 This chapter is the methodology which it introduces and discusses software
programs and methods that were used in this thesis
Chapter 4 This chapter presents the results of thesis which it studies the effect of each soil
strength parameter cohesion unit weight and internal friction angle (c γ and ϕ) on the
factor of safety FOS both together and separately In the first part of this study in order to
determine the trend of changes in FOS and failure surface the number of models have
been studied is limited and in the second part to find an accurate relationship between the
strength parameters of soil and the surface of failure various number of models were
analyzed After all the models were generated and analyzed figures were drawn to show
the effects of the variables on factor of safety and failure surface In addition the reasons
for these different behaviors were discussed
Chapter 5 This chapter presents the conclusions and recommendations for future actions
to be taken
At the end in the references part the resources used for this study are presented
22
CHAPTER 2
LITERATURE REVIEW
21 Introduction
In this part a studies will be presented on stability of the slope analysing methods a
general view about infinite slopes and slip surface seeking approaches and relationship
between soil strength factors and location of failure surface
As it has mentioned recently therersquore two types of slopes
Finite slopes
Infinite slopes
22 Infinite Slopes
This part shows the similar infinite slopes development descriptions and equations of
different cases to calculate FOS for infinite and long slopes The reason this study stems
from a renewed interest in the dynamics of deep landslides and the require for a more
basic method to long slope studies for depth variation in soil properties The Standard
utilize of infinite slopes equations for both cohesive and frictional soils provides a factor
of safety Assuming a critical failure plane and a homogeneous soil profile parallel to the
surface of the soil at the full depth of the soil (Griffiths et al 2010)
Some of the earlier studies on this topic concentrated on shear stress mechanisms
and stress in an infinite slope and also analysing of displacements and strains 1D and 2D
More specific (Runesson amp Wiberg 1984) and (Wiberg 1990) presented a finite element
method to infinite slopes on the basis of the principle of strain softening behavior and limit
equilibrium Another group of researchers like (Iverson (1990 and (Bromhead amp Martin
2004) found the impact of streams of groundwater and lateral (3D) streams on landslides
and estimated the effect of infiltration on surface slope stability using an infinite slope
analysis (Cho amp Lee 2002) and (Tsai amp Yang 2006) More previously (Yang 2007)
23
considered the impact of horizontal acceleration on land slide seismic stability through the
equations of slope stability
221 Dry condition
Dry condition happen when the level of water table lower than shear plane to find the
shear and normal forces by equations down below and the details of the slopersquos cross
section shown in Figure 21
N = Wsinα (stable the slope) (21)
T = Wcosα (cause the failure) (22)
Where W the weight of the slope section
α the angle between the slope and horizon
Figure 21 Details for infinite slope
24
W = ɤA = ɤbZ (23)
Ơ = 119873
119860 =
ɤlowast119887lowast119911lowast119888119900119904α119887
119888119900119904αlowast1
= ɤ Zcos2α (24)
Ꞇ = 119879
119860 =
ɤlowast119887lowast119911lowast119904119894119899α119887
119888119900119904αlowast1
= ɤZsinαcosα (25)
A is the area resist the collapse
The max stress soil can resist is Ꞇr = C + ơ tanOslash = C + ɤ Zcos2αtanOslash (26)
FOS = C + ɤlowast Zlowastcos2αlowasttanOslash
ɤlowastZlowastsinαlowastcosα (27)
FOS = C
ɤlowastZlowastsinαlowastcosα +
tanOslash
tanα this formula for C-Oslash soil
For Oslash-soil (C=0) FOS = tanOslash
tanα (28)
This formula is very important for site work because by finding the internal friction angle
of the soil needed to build on we can determine the slope angle by giving the factor of
safety value of 1 so the slope angle (α) will be equal to internal friction angle Oslash
222 Condition with seepage
FOS for infinite slopes in seepage case is the same of dry case but multiplied by the value
ɤ(sub)
ɤ(sat) as presented in equations down below
FOS = C
ɤlowastZlowastsinαlowastcosα +
tanOslash
tanα
ɤ(sub)
ɤ(sat) (29)
Example by giving specific gravity Gs and water content Wc to find void ratioe use the
equation
eSr = GsWc (210)
since the soil is saturated Sr = 1 so we can determine the value of e
Then find ɤsat and ɤsub by the formulas
ɤsub= ɤsat- ɤ (211)
25
ɤsat = 119866119904+119890
1+119890ɤw (212)
23 Finite Slopes
There are numerous methods available to select from and use to analyze the slope stability
As nowadays no method of analysing is prioritize atop other methods so the engineer is
entirely responsible for the reliability of any solution (Albataineh 2006)
The techniques are divided in two main types according to their procedure
Limit equilibrium methods
Finite element methods
231 Difference between LEM and FEM
Although limit equilibrium techniques are easier to utilize consumes less time and is
useable for hand calculations the limitations arises when it comes to calculating forces
specially in the slopersquos parts that localized stress focusing is high so because of the
limitations factor of safety in limit equilibrium techniques become a little higher (Arryal
2008 Khabbaz Fatahi amp Nucifora 2012) furthermore some executors think that finite
element techniques are more powerful especially in states with compound conditions
(Duncan 1996)
While also many of the executors think that the outputs of LEM and FEM are almost the
same (AzadmaneshampArafati 2012 Wright G 1969 Wright Kulhuwy amp Dumcan 1973)
also Chang thinks this convention except phi that is greater than 0 (Chang Lansivara amp
Wei 2007) Although both LEM and FEM have their disadvantages and advantages
neither of them are routinely analyzed is ascendant to the other one (Cheng Lansivara amp
Wei 2007) Each one of those techniques are divided into two groups depend on their
numbers of dimensions to two dimensional methods and three dimensional methods
26
232 Finite element methods
The FEM is a numerical analysing method to obtain accurate solutions for various
engineering troubles although it had originally been developed to be used `in the study of
stresses on structures of complex aircraft structures(Oghli 2011) but from that time it has
been developed to be widely applied in different engineering fields
Although the finite element method appeared in 1960 when it was used before by Clough
to solve flat flexibility issues the ideas of finite element analysis date back to a date
beyond In 1943 Variant Courant used the Vibrational methods then in 1956 Martin Topp
and Clough used the finite element method for calculating stiffness (Oghli 2011)
Analysis using finite element method
Finite element analysis depends on the following idea that any complex form can be
divided into a group of small elements to make it easy to deal with a very simple and
common idea used everywhere in the working life as in engineering
The solution is using the finite element method by following the steps
1 Divide the structure to be studied using the finite element method to a number of the
limited geometric forms as shown in Figure 22
27
Figure 22 Divide the structure to many geometric forms (Oghli2011)
2 Start by solving each of the limited elements using the local coordinates grid for each
element
3 Compiling solutions on the network of local coordinates to solutions on the network
coordinates
28
4 Checking solutions If the solutions are not convergent the 2 and 3 steps must be
repeated
5 Evaluating the solution when solutions converge
Before starting the solution it is necessary to define the element a small piece of body that
is characterized by
a- Elementsrsquos type if the element is structure span pillar or slope
b- Elementsrsquos dimensions if it is a linear element one deminsional1D such as spring
triangle and tube Or a standard element (2D) such as cortical plate membrane Or
a volume element (3D) such as finding transitions stresses and flow velocity
c- The number of degrees of freedom for each nodes transitions androtations
d- The shape of the element
Finite element technique uses a similar mechanism of failure to limit equilibrium methods
and the major difference between those procedures is the use of FEM capacity which does
not require simplification of the presumptions
In general this procedure firstly proposes a slip surface failure and then FOS which will
be calculated is implemented to compute the ratio of usable forces of resist to the deriving
forces
There are two more useful methods of FEM
Shear reduction method
Increase gravity method
Shear reduction method (SRM)
Since the factor of safety doesnrsquot defined by a single definition the most important one is
the definition it presented by Duncan (1996) which it ldquothe ratio of actual shear resistance
to the minimal shear resistance that necessary to prevent breakdownrdquo or the factor that
makes the shear resistance fall to the point where the slope becomes the edge of the
29
failure
Shear reduction method (SRM) based on the slope stability analysis studied using the
method of finite elements which depends on the analysis of the stresses and displacements
of the slope by reducing the shear resistance values from cohesion and friction (Oghli
2011)
The slope will reach a point where it cannot be achieved analysis of its stability using finite
element method where the transitions will be large on the slope and the collapse of the
slope will occur therefore we will get the value of FOS of the modeled slope without the
need to determine the shape or the surface of the sliding surface as well as the side forces
affecting the slides and slopes
In SRM the soil strength parameters will be reduced till the slope fall so the FOS become
the ratio between real strength parameters and critical parameters The factor of safety
definition in SRM is the same as that of limit equilibrium method (Griffiths amp Lane
1999)
Increasing gravity method is more frequently favored to test the slope stability in the
construction cases as its results are more credible meanwhile SRM is more effective to
test the existed slopes (Matsui amp San 1992)
Gravity increase method
In this method gravity forces increases little by little until slope fails This force value is
called the failure gravity 119892119891
Factor of safety in this method is the proportion of failure gravitational acceleration and the
actual acceleration of the gravity (Swan amp Seo 1999)
FOS = 119892119891
119892 (213)
When gf The raised gravity at the failure level
g The main gravity
30
233 Limit equilibrium methods
As it has mentioned before there are two types of methods two-dimensional methods and
three dimensional methods and since this study work on two dimensional methods so will
start with it
Two dimensional methods also subdivided in three different groups
1 Circular Methods
2 Non-Circular Method and
3 Methods of Slices
Circular methods
Swedish circle
The Swedish Circle method is the simplest procedure used in analyzing the short term
stability of slopes disrespect to its inhomogeneous or homogeneous state
This is a method that analyze the slopes stability by considering two simple assumptions a
rigid cylindrical block of soil can fall by rotating round its center with assuming Phi is 0
For that the only resist moment or force is going to be the cohesion and the driving
moment simply will be cylindrical failure soilrsquos weight
From this method the FOS was defined as ratio of resist (holding) force over driving force
(Abramson 2002) The figure 24 demonstrates the holding forces and driving forces
applying on the soil block
31
Figure 23 Swedish circlersquos details (Abramson 2002)
The algorithm about Swedish method presented in the following equations
Z = C + ơ tanOslash (214)
C = C´Ɩ (215)
Frictional force = ơ tanOslash = N tanOslash (216)
Resisting force = sum (C´ Ɩ) + sum (N tanOslash) (217)
Disturbing force = sumT (218)
Resisting moment R sum (C´ Ɩ) + sum (N tanOslash) (219)
Disturbing moment sumTR (220)
FOS = Resisting force
Disturbing moment =
Rsum (C´lowastƖ) + sum (N tanOslash)
sumTlowastR =
sum (C´lowastƖ) + sum (N tanOslash)
sumT (221)
Where T = W sinα (21)
N = W cosα (22)
32
FOS = sum (C´lowastƖ) + sum (WcosαtanOslash)
sumW sinα (221)
The friction circle method
This procedure was developed in order study of homogeneous soils with internal friction
greater than 0 In this procedure the resulting shear strength (frictional and normal forces)
affect on the failed slip surface to form which is named as friction circle (FC) with a
radius of Rf Figure 26 demonstrates the FC Rf could be deduced by using the equation
below (Abramson 2002)
Rf = R sin Oslashm (221)
Where R radius of failure circle
Oslashm the affected friction angle could be computed by using
Oslashm=tanminus1 Oslash
119865Oslash
(222)
Where 119865120593 is factor of safety contra the resistance of friction
This precedure utilizes a repetitive computation Abramson et al (1996) recommended the
following methodology to find FOS
1) Finding out the slip weight (W)
2) Finding out the greatness and direction of the resultant pore water pressure (U)
3) Finding out the perpendicular length to the actionrsquos line Cm Rc that could be found
using
Rc=119871119886119904119904119904119903119888
119871119888ℎ119900119903119889 119877 (223)
The lengths are these the lengths of circular cord and arc define the mass of failure
4) Computing the effective weight resulting from U and W forces and the intersection of
33
Cm at A
5) Assuming a value for 119865120593
6) Calculating 120593119898
7) Using to draw the frictional angle
8) Drawing the polygon force with w suitably raised and pass over A
9) Drawing the direction of P resulting from the friction circles frictional and normal
forces tangential
10) Drawing Cm direction according to the chord inclination joining the end points of the
surface of the FC
11) Then the closed polygon gives the value of Cm
12) By finding the value of Cm finding the value Fc
F= 119888119871119888ℎ119900119903119889
119862119898 (224)
34
Figure 24 Friction circle method (Abramson 2002)
35
Non circular methods
Log spiral procedure
In this method the failure surface will be assumed and use the equation below to deduce
the radius to have a logarithmic composition
r = r0eθ tan
Oslashd (225)
Where 1199030 The initial radius
120579 Angle between r and 1199030
120593119889 The transposal Phi
The normal and shear strengths on the slip can be computed using the equations below
τ = 119862
119865 + σ
tanOslash
119865 (226)
τ = cd + σ tan Oslashd (227)
Where c 120593 the shear strength parameters
119888119889 120593119889 the developed friction angle and cohesion
F factor of safety
Assuming this particular shape shown in Figure 28 frictional force and normal force will
pass from the center of the spiral so there will be no momentum about the center The
developed cohesion and soil weight will therefore be the only moment producing forces
Having the developed friction presented in the r equation (225) This procedure is also a
repetitive process therefore to achieve a FOS that satisfies the formula (J Michel Duran amp
Wight 2005) several trials should be done
36
F =119862
119862119889=
119905119886119899120593
119905119886119899120593119889 (228)
Figure 25 Log Spiral procedure (Duran and Wight 2005)
In this procedure knowing the slip fail surface is very influential cause the method begins
by finding a center of the spiral and an R0
37
Methods of slices
In this method soil density over the fail area will be subdivided in many slices vertically
and the balance of every slice will be studied individually However the splitting of a
static trouble in many parts doesnrsquot make it statically found therefore to make it solvable
an assumption is needed These methods will be distinguished by classifying these
hypotheses
Again the important issue here is that knowing the surface of failure is important in these
methods as those techniques are primarily focused on the soil mass division of the slip
Number of more realistic techniques for this sort would be discussed
Ordinary method of slices
This method assume this the resulting inter slice forces in every vertical slice are parallel
to their basement and are therefore ignored and satisfied only at the balance moment
Researches (Whitnan Baley 1967) showed that FOSs computed using this technique is
sometime as conservative as 60 compared to more accurate techniques so this
procedure isnrsquot much used nowadays
In order to the slice shown in Figure 29 the Mohr Coulomb fail criterion is
s = crsquo+[σ ndash u] tanOslashprime (229)
Use FOS 119905 = 119904 119865 119875 = 119904 times 119879 = 119905 times 119897 the formula becomes
T = 1
119865[c´ l+ [P ndash ul]] tanOslash´ (230)
Having neglected inter slice force leads to make the normal forces at the basement of the
slice as follows
P = w cos α (231)
Where w the weight of slice
120572 the angle between center of slide base tangent and the global
38
vertical
The moment will be around the center of the shape of the slope failure
sum W R sin α = sum TR (232)
Therefore
FOS = sum(c
prime
l+wlowastcos αminusullowasttan Oslashprime)
sum Wlowastsin α (233)
Figure 26 Ordinary method of slices (Anderson M G amp Richards K S 1987)
As shown in this method calculating FOS hiring this method again requires knowing the
surface of the failure )Anderson amp Richards 1987)
39
Simplified bishop method
By using this technique to find FOS we assume the fail occurs as shown in Figure 210 by
rotating the soil circular mass Meanwhile the forces in-between all the slices are regarded
horizontally between them there is no active shear stress Each slicersquos normal force (P) is
supposed to behave on the center of every base Using equation this stress can be
calculated
P = [Wminus1F(cprimelowastllowastsinαminusullowasttanOslashprimelowastsinα]
Ma (234)
Where
Ma = cosα +(sinαlowasttanOslashprime)
F (235)
By taking moment around the center of circle
F = Σ cprimelowastllowastcosα+(wminusullowastcosα)tanOslashprime
cosα+(sinαlowasttanOslashprimeF) ΣWsin (236)
This forces us to solve it iteratively As the equation demonstrates F is on both sides This
method is generally fast and gives-out a relatively accurate response with a 5 variation
in FEM so it is appropriate for hand computations (Andresen and Richard 1987)
Figure 27 Simplified-Bishop procedure )Anderson M G amp Richards K S 1987)
Like the other methods the failure surface needs to be assigned at the beginning
40
Spencer method
Even though the Spencer technique was described for the surface of circular failure by
assuming a frictional center of rotation it was easily extended for non - circular slips They
will have the same tendency by assuming parallel inter slices forces
tan θ = 1198831
1198641 =
119883119903
119864119903 (236)
Where 120579 the angle of the inter slices forces horizontally
The force at the base of the every slice is going to be as below by the summation of forces
perpendicular for the inter slices
P= Wminus(ErminusEl)tanθminus1F(cprimelsinαminusultanOslashprimesinα)
mα (237)
Where
mα = cosα (1+tanα tanOslashprimeF) (238)
Two different factor of safetys will be extracted by supposing the total moment and force
equilibrium in Figure 210 this is due to the over-specified maximum assumptions
From the moment of equilibrium to find FOS by taking moment around O
ΣWRsinα = ΣTR (239)
Where
T= 1
119865 (cprimel+(pminusul)tanOslashprime (240)
Fm=Σ(cprimel+(pminusul)tanOslashprimeΣWsinα (241)
FOS from force equilibrium while Σ1198651198670=0 in consideration
TcosαminusPsinα+ERminusEL=0 (242)
41
ΣERminusEL=ΣP sinαminus1FffraslΣ(cprimel+(Pminusul)tanOslashprime) cosα (243)
Using the Spencerrsquos assumption (tan120579=119883119897119864119897=119888119905119890) and Σ119883119877minus119883119871=0 in surface loading
absence
Ff = Σ(cprimel+[Pminusul]tanOslashprime)secα
Σ(Wminus(XRminusXL)) tanα (244)
The method of trial and error should be used to evaluate the factor of safety that meets
both formulas
Spencer studied this technique and demonstrates that both the FOS values achieved from
both of equations will be equal at a precise angle for inter slice forces and that this value
will be regarded as the factor of safety (Spencer 1967)
Figure 28 Spencer method )Andresen M G amp Richards K S 1987)
42
And again it is important to have the correct surface of failure in this method
234 Previous studies on analyzing 2D slope stability
Table 22 shows some studies on 2D slope stability analyzing have done by researchers
and students
43
Table 21 Previous studies analyzing 2D slope stability
Author Method Software
(Chok 2008) Limit Equilibrium method The
random finite element method
(RFEM)
Neuframe
SLOPEW
(Adams 2015) the Swedish method of slices HOBO Micro
Station
HOBOware
(Ekstrand amp Nylander
2013)
Method of slices SLOPE
GeoSuite
(Nor 2010)
Ordinary Bishop Janbu dan
Morgenstern-Price methods
GeoStudio 2007
(Xiao Yan amp Cheng
2011)
Limit Equilibrium method (Spencer
method
ANSYS
(Oghli 2011) Limit equilibrium method (Bishop
method) FEM (SRM)
Slide5
Phase2
(Hammouri Husein
Malkawi amp Yamin 2008)
Limit Equilibrium Method
Finite element method
PLAXIS
SAS-MCT
(Naderi 2013) FEM
LEM
GEO5SLOPEW
FLACSlope
(Amini amp Ardestani 2019)
Finite element method Dips
Phase2
44
Author Method Software
(Kang Han Salgado amp
Li 2015)
Monte Carlo simulation
Gaussian process regression (GPR)
MATlab
(experiments)
(Suman 2015) LEM FLACSLOPE
Farah Ltifi amp Hassis
2011)
LEM
FEM
-
(Oh amp Lu 2015) LEM
FEM
-
(Widger 1976)
Bishoprsquos simplified method -
(Xing 1988) LEM -
(Zeroual Neacutee Dadouche
Lazhar amp Zennir 2011)
kinematic method of rigid solids
-
(Marquez D V Griffiths
2007)
methods of columns method of
slices
Limit equilibrium method
-
(Li Li Zhang Yang amp
Wang 2015)
Least squares support machine
algorithm
-
45
Chok )2008) focuses on researching and quantifying the impacts on the stability of natural
slopes of soil variation and vegetation The soil variation is quantified by the parameters
called coefficient of variation (COV) and fluctuation scale (SOF) while a slopes safety is
evaluated using failure probability Chok used the ANN and random finite element
method RFEM to explore the COV and SOF impact on the probability of a cohesive slope
failure (ie undrained clay slope) with distinct geometries The findings acquired from the
parametric research are then used to develop probabilistic stability charts These charts can
be used for a preliminary evaluation of a spatially random cohesive slopes probability of
failure
Adams (2015) presented a study by using HOBOware software the objective of his study
was to determine the circumstances on softly sloped terrain resulting in regular slope
instability A perched water table produced by excessive or intense precipitation events
was hypothesized to affect the slope stability in the region and result in intermittent
landslide motion Data collection operations included precipitation surveillance
Measurement of the height and magnitude of the perched water table that used a
piezometer array interpretation of the place and morphology of impermeable boundaries
with radar penetration and assessment of relative slide movements Field measurements
indicate a correlation between the quantity of rainfall received and the shift in height over
the impermeable surface of the water A slope stability analysis was conducted to quantify
the likely stability conditions Conditions leading to slope instability on gentle slopes were
recognized in this research as precipitation falling on soils with high ambient moisture
conditions resulting in a perched water table being formed The height of the perched
water table need for motion is encountered seasonally according to the safety assessment
factor Movement happened slowly because of the gentle slopes
Ekstrand amp Nylander (2013) designed a probabilistic slope stability model The
probabilistic model questions the ordinary assumptions taken when assessing a slopes
stability These assumptions contain the size of traffic loads how to apply water
concentrations and how to calculate the impacts of underlying structures Their research
involves an investigation of the impact on stability measurements of anisotropic clay
characteristics Their study gathered the information needed for the model from Previous
stability studies and soil investigation reports The model was intended with fundamental
46
statistical ideas and Swedish geotechnical guidelines from distinct geotechnical
engineering fields The final result shows which assumptions have the biggest effect on a
slopes calculated stability The findings suggest that underlying buildings and anisotropic
clay behavior are often neglect main factors when it comes to calculating a slopes factor of
safety
Nor (2010) presented in his study which happened in Malaysia sites to Determine the
adequate cost for the slope protection chosen and compare the different slope stability
analysis techniques used and thus His research was conducted using Ordinary Bishop
Janbu and Morgenstern-Price techniques based on two chosen slopes at Lot 4189 Bandar
Tanjong Bungah Jalan Selari Pantai Utara Pulau Pinang The analysis was conducted
using GeoStudio (GEOSLOPE) software The evaluation result showed that the
Morgenstem-Price technique was the realistic and acceptable technique that can be used to
analyze both of the chosen slopes while the Reinforced concrete holding wall provides the
optimum cost for both chosen slopes
Xiao Yan amp Cheng (2011) described an accurate technique that combines LE and
numerical analysis to identify prospective slide surfaces on slopes of soil In this method
the direction of the critical surface at any point in a slope is defined by the use of the
Coulomb strength principle and the extreme concept predicated on the ratio of the shear
strength to the shear stress at that point Once the soil slope stress field is acquired the
ratio which is regarded as an evaluation index can be calculated His paper provides
examples of the feasibility of the suggested technique programmed by macro instructions
in ANSYS software
Hammouri Husein Malkawi amp Yamin (2008) have used the main Both techniques are
used to analyze homogeneous and inhomogeneous slopes taking into consideration the
condition of rapid drawdown tension cracks and undrained clay soils PLAXIS (finite
element technique) and SAS-MCT 40 (limit equilibrium technique) were used to perform
the analyzes Comparison is made between the factor of safety and place of the critical slip
surface acquired from both techniques
Amini amp Ardestani (2019) presented a study after A failure occurred in the Daralou
copper open pit mines north-eastern slope in the 2015 season Geological and
47
geotechnical ground and sub-surface studies explained the mechanism of this instability
Next the latest analytical method for evaluating the static slide-toe-top pling failure has
been updated also new formulas have been made for dynamic failure analysis After that a
computerrsquos code has been developed to test the instability on the basis of the new formulas
The failed slope was analyzed in the next step using the system of code and FE tecnique
and the results of those analyzes have been compared to real conditions The analysis
demonstrated that the theoretical statistical and real tests were satisfactorily accepted
Thus these approaches were used in static and dynamic conditions to expect the final
slopes behavior Such analyses showed this if relocated materials are fully dug up and
taken out of the mine the total dip of the slope will be decreased the final slope gainst
ldquoslide toe toppling failurerdquo will be stable This study summarized the outcomes and
concluded that a slope can be analyzed against the secondary toppling mode by both the
adjusted analytical procedure and the FEM In addition the research shows this resloping
and unloading are two effective approaches that could be used to stabilize the failure
Farah Ltifi amp Hassis (2011) presented a solution of the slope stability problem analysis
procedure and studied slope stability reliability analysis with soil spatial variability By
assuming till yield criteria the elastic soil attitude assessed stresses mobilized through the
slip surface to evaluate the efficiency function and analyzed the outcomes of SFEM
(Stochastic FEM) and the LE method such as the simplified method used by Bishops to
check their efficiency and accuracy They conducted an optimization strategy to search for
critical slip surfaces and also conducted sensitivity studies to examine the impact of
random field variables used in soil spatial variation modeling
Naderi (2013) Used FLACSlope SLOPEW and GEO5 software programs to determine
the critical failure surface analyze the slope stability problems and investigated the
effectiveness and validity of these programs by giving values of shear strength parameters
soil unit weight (γ) cohesion (c) and internal friction angle (ϕ) and investigate their effect
on FOS value Comparison and discussion of the results that obtained from different
software programs The study results showed that the slopes FOS changes with varying
cohesion internal friction angle and the unit weight his results showed that compared to
SLOPEW GEO5 is more conservative slope stability analysis software It gives 5 less
48
factor of safety than SLOPEW In contrast to GEO5 and FLACSlope usually gives
greater value for FOS
Suman (2014) used the software program FLAC to carry out numerical models for rock
slopes on his thesis ldquoSoil Slope Stability Techniques A Comprehensive Analysis rdquo by
having different rock properties and various dimensions The numerical modelling is
performed for finding out the factor of safety For each slope the parameters are varied and
the factor of safety calculated for each step To find out how the factor of safety changes
with changing parameters these values are correlated with the bench parameters
Oghli (2011) studied slope stability by Bishop based on LEM and Shear Strength
Reduction SSR based on FEM and used the software packages SLIDE5 and PHASE2 So
she applied on the homogeneous slope in two sides First is a design side on the slope and
the extent of the effect on ratio HL on factor of safety by using the method SSR second is
mechanically by change the five parameters to the FOS by using finite element method
(cohesion friction density elasticity factor Poisson factor) and the extent of the effect on
FOS The results obtained were merged to a mathematical model through this model the
factor of safety could be calculated for a homogeneous slope which the values of the
factors affecting on FOS change by using the experimental design method
Fei Kang et al (2014) evaluated the probability of slope stability based on system called
Regression of the Gaussian method (GPR) and sampling of Latin hypercube
The analysis consists of three sections Firstly Latin hypercube sampling is used to create s
amples to build the surfaces response Then on the basis of the samples Gaussian process
regression which is a common machine learning method for nonlinear system simulation
is used to evaluate the reaction of surface to estimate the limiting of state function
Monte Carlo simulation is conducted via e GPR surfaces response to determine the slopersquos
probability system failure
(Zevgolis et al 2019) presented the landslide that happened on 12 June 2017 which was
definitely an unprecedented occurrence in Greek lignite mining history and is possibly one
of the biggest lignite mine landslides in the world The slipping mass shifted from south to
the north and occupied a huge area estimated to be between 298 and 356 km2 depending
on satellite images Two independent committees (one by the Ministry of Environment and
49
Energy and the other by PPC) have been requested to evaluate the event given the
disastrous effects of the landslide The two committees findings were not yet released
publicly Nevertheless a recent report released by the Greek Ombudsmans Independent
Authority discusses the main conclusion of the studies of the two committees
Three dimensional methods
Such procedures are centered on observing a fault surface 3D structure that is beneficial
for more geometrically complicated slopes or meanwhile the material of the slope is
strongly anisotropic or inhomogeneous
Alike two dimensional technique extra equations or in some situations both to obtain a
statically defined situation In general almost all of those techniques belong to the two
dimensional methods Even though the author wont debate about them in this research it
will introduce some of the most useful methods by name in Table 22 Please check the
references in this thesis reference section for more information about them
50
Table 22 3-D analyzing methods for slope stability (Duncan 1996)
Author Methods
(Anagnosti 1969 Extended Morgenston and Price
(Baligh and Azzouz 1975 Extended circular arc
(Giger and Krizek 1976 Upper bound theory of perfect plasticity
Baligh Azzouz amp Ladd 1977 Extended circular arc
Hovland 1979 Extended Ordinary method of slices
A Azzouz Baligh and Ladd
1981
Extended Swedish Circle
Chen and Chameau 1983 Extended Spencer
A S Azzouz and Baligh 1983 Extended Swedish Circle
D Leshchinsky Baker amp
Silver 1985
LE and variational analysis
Keizo Ugai 1985 LE and variational analysis
Dov Leshchinsky amp Baker
1986
LE and variational analysis
R Baker amp Leshchinsky 1987 LE and variational analysis
Cavoundis 1987 LEM
Hungr 1987 Extended Bishoprsquos modified
Gens Hutchinson amp
Cavounidis 1988
Extended Swedish circle
K Ugai 1988 Extended ordinary technique of slices
Janbu and Spencer modified Bishoprsquos
Xing 1988 LEM
Michalowski 1989 Kinematical theorem of limit plasticity
Seed Mitchell amp Seed 1990 Ad hoc 2D and 3D
Dov Leshchinsky amp Huang
1992
Limit equilibrium and variational analysis
51
24 Soil Slope Failure Surface Searching Methods
There are many variant methods utilized in analyzing soil slopes stability either natural
slopes or artificial Every one of them leads us to a variant FOS Several ones are quite
precise alike FEM some are more conservative such as that of ordinary method of slices
But such variations apply for only those of one slip fail and this must be the critical one
The method for finding this critical surface of fail has multiple techniques as well many
of them are complex whereas others are less complicated but most often they could be
accomplished only by using software programs and they are very hard to use for hand
computations The FOS is also very empathetic to the exact location of the critical solution
with a thin soils layer for complicated problems and there are large differences between
different methods of global optimization (Cheng Li Lansivaara Chi amp Sun 2008)
To optimize this procedure most of those techniques have been made on basis on trial and
error techniques so far Different methods of optimization have been developed such as
genetic algorithm (GA) annealing and so on
Some more recent methods are discussed in this section
241 Simulated annealing method
Optimization was accomplished in this method by implementing a method of annealing to
accomplish the lowest possible global for FOS It is focused on two first points identified
by the user (that fully defined as follows) and an additional upper limit
242 Simple genetic algorithm
This procedure provides a clear form of Calculation based upon Morgenstern Prices slope
stability analysis system for noncircular surfaces with pseudo-statics earthquake loading
(McCombie Wilkinson 2002) Thats simpler version of the genetic algorithm (Sengupta
Upadhyay 2009) In order to obtain the critical noncircular slip surface this method used
a simple genetic algorithm (SGA) The following figure (Figure 211) demonstrates the
technique utilized by this method to locate the slip (Zolfghari Heath amp Mccombie 2005)
52
Figure 29 Algorithm of simple genetic (Zolfghari Heath amp Mccombie 2005)
243 Leapfrog algorithm method
This approach is based on the methods used by Janbu and Spencer to analyze the stability
of the slope The cause the researchers used these techniques for their studies is that they
do not need any main geometry statement and the initiation of slip termination points is
not restricted in those techniques This allows the technique to generate a general form of
the slip surface
The author then claims that the most efficient procedure was the Leapfrog algorithm after
testing a number of optimization methods(Bolton Heymann amp Groenwold 2002)
53
244 Other methods
From other methods it is possible to count Monte Carlo techniques (Malkawi Hassan amp
Sarma 2001) and Particle swarm optimisation theory (Cheng Li Chi amp Wei 2007) which
in this thesis would not be considered
25 Potential Slope Failure Surface and Soil Strength Parameters
There have been numerous studies on the effect of soil strength parameters on factor of
safety But their impact on the surface of the slip was seldom taken into account One of a
handful studies (Lin amp Cao 2011) discusses the relationship in-between those parameters and
the potential surface of the slip and their impact on the surface of the failure this paper studies a
function of Phi cohesion c unit weight and slopersquos height (h) as follows
λ = c(γhtan Oslash ) (245)
This study debates this once the value of Lambda (λ) stays unchanged the surface of the
failure stay the same this is consistent with a previous study (Jiang amp Yamagami 2008)
which shows a special correlation between 119862
119905119886119899120593 and the slip surface In addition the higher
λ shows a deeper failure slip and the lower value of λ makes the surface of fail nearer to
the surface of the slope (Lin amp Cao 2012)
54
CHAPTER 3
METHODOLOGY
31 Introduction
In this chapter software programs and methods that will be used in this thesis will be
introduced and discussed
32 Methodology
As it has discussed before for each slope there are resisting forces and driving forces
which should be considered Driving forces are mostly a result of the weight of the soil
formed the slope that is in a direct proportion with the unit weight of the soil and resisting
forces are mostly a result of internal friction angle and cohesion of the soil In the first
part of the study the effect of cohesion (119888) internal friction angle (120601) and the unit weight
(ɤ) of the soil will be studied to compute the factor of safety FOS
In the second part of this study an adequate numbers of slopes will be analyzed and
modeled with different soil shear strength parameters cohesion unit weights and internal
fraction angle in addition to slope geometry by changing the angles length and height of
the slopes in order to make a database of failure surfaces for these slope parameters In
these first two parts the study will be analyzed by using the educational license of the
software package SLOPEW
Finally reanalyze the previous models with the same properties and conditions on another
software packages PLAXIS and FLAC and compare the results between them then
compare the outputs with the results of SLOPEW in order to check and control the
accuracy of SLOPEW results
The results data of the failure surfacersquos circle (center entry exit and radius) of the models
will be used to draw the slope by the version of Automatic Computer Aided Design
(AutoCAD) software 2014 to measure the length of the failure arc and locate the slip
surface entry and exit points by measuring the arc between them
55
The results of analyzing each model will be used by enter it into the version of Microsoft
Excel 2010 After this step using the software various figures are going to be generated
And find some equations of the results by this software The methodology appointed in
treating this thesis involves
1-Investigate the factor of safety variations by change soil unit weight (ɤ) cohesion (c)
and internal friction angle (ϕ) and their effect on the factor of safety
2- Create detailed scenarios including the geometry details and soil properties
3- Studying the background of the methodology for the 3 software programs PLAXIS
FLAC and SLOPEW (Finite Element Method Limit Equilibrium Method)
4- Cognize which software packages could be used in geotechnical stability for research
scenarios
5-Analyse after Create the concepts for each scenario
6- Research soil properties and each scenariorsquos parameters
7- Familiarise with each software and its ability
8- Analyze each scenario after modeling by using PLAXIS FLAC and SLOPEW and
discuss the results and benefits
9- From all the above steps discuss the benefits and limitations of each of the software
packages and make notes and recommendations
56
33 Materials
331 Soil
More than 100 soil types with different strength parameters have used in this study to be
modeled and analyzed In order to generate models with a good accuracy in finding the
relationship between the factor of safety and the soil strength parameters for different soil
types with small changes in soil parameters have been selected modeled and analyzed
Soil strength parameters
The range of soil strength parameters chosen for this study in the Table 31 below
Table 31 Soil strength parameters
Soil strength parameters The range The unit
Cohesion 15~32 kPa
Unit Weight 15~31 kNm3
Internal Friction Angle 15~32 deg
332 Water level
In thus study the soil has assumed dry because of time limitation thus effect of water
hasnrsquot studied deny its effect has done by assuming the water level being far away below
the slope level
57
34 Software and Programs
341 FLACSLOPE
FLACSlope is a mini-version of FLAC specifically designed to conduct slope stability
factor of safety calculations (ITASCA Consulting Group 2011)
This software is a two dimensional express limited distinction program for building
mechanics calculation This program recreates the conduct of a structure worked of soil
rock or different materials that may experience plastic stream FLAC finds the static
answers for an issue utilizing the two-dimensional plane-strain model In any case the
dynamic conditions of movement are incorporated into the plan to help model the unstable
and stable forces with the model this guarantees the scenario of an unexpected collapse
with the model is represented The required soil properties present in Table 32
Table 32 Required soil properties for FLACSLOPE
Definition Property Symbol Units
Unit weight of the
soil
Density ɤ kgm3
The cohesion
component of the
shear strength
Cohesion c Pa
Friction angle of the
soil
Phi Oslash ˚
Dilation angle of
the soil
Psi Ψ ˚
The dilation angle has been set to zero in this study suggesting no volume change during
output The role of the dilation angle was discussed in details elsewhere like Griffiths amp
Lane (1999)
58
Methodology of FLACSlope Analysis
To draw the model insert the coordinates needed for each point by using ldquoinputrdquo button
under the window ldquosketchrdquo as shown in Figure 31 after draw the slope divide it and cut
the edges and merge the points make a text for the model if there is any mistakes during
the drawing as shown in Figure 32
Figure 31 Insert slopersquos coordinates on FLACSLOPE
59
Figure 32 Check on slopersquos drawing
Assign and create the properties of materials is needed It has to be noted that FLAC
requires the density and Cohesion of the material inputted in kgm3 and Pascal respectively
as presented in Figure 33
60
Figure 33 Assign material properties on FLACSLOPE
Assign a mesh to the slope is required A medium mesh has been chosen in this thesis for
FLAC as it shown in Figure 34 down below In order to achieve the optimum size
suitable for meshing both fine and medium size mesh was tried for few models it was
found that the final result difference between fine and medium meshes for factor of safety
are about 0007 which could be neglected as it makes less than 1 difference (Figure 35)
Figure 34 FLACSLOPE Assign mesh
61
(a)
(b)
Figure 35 The difference between fine and medium meshes for the value 17 kNm3
of
unit weight (a) Fine mesh (b) Medium mesh
62
Finally the result of factor of safety will be given in small box and a shape of the slopersquos
displacements as shown in Figure 35
Figure 36 Factor of safety value on FLACSLOPE
342 SLOPEW
SLOPEW is software that uses LE method to compute the factor of safety FOS of rock
and soil slopes and earth The user of SLOPEW must have a background and knowledge
of the concepts and principles of geotechnics involved in the judgment and analysis is
required to assure that realistic soil properties are used to compute an accurate FOS The
version SLOPEW 2012 has been used in this study Although this software based on LE
method but it uses finite element method too for some slopes (GEO-SLOPE International
2015) For the number of increments 15 have been used for modeling the slopes for entry
and exit ranges The required soil properties presented in Table 33
Table 33 Required soil properties for SLOPEW
Definition Symbol Property Units
Soilrsquos Total Unit Weight ɤ Unit Weight kNm3
Soilrsquos Cohesion C Cohesion kPa
Soilrsquos Friction Angle Oslash Phi ˚
63
The Methodology of SLOPEW Analysis
Start SLOPEW by setting the units and some properties of the slope and slip surface draw
scale for the model so we can draw the axes after that as shown in Figure 36
Figure 37 SLOPEW set units
To draw the model using the inbuilt CAD is needed alike PLAXIS and unlike FLAC
which it needs to input the coordinates (X Y) of each point of the drawn slope
Assign and create the properties of material is needed which can be found under the menu
ldquoKeylnrdquo as cohesion unit weight and internal friction angle material dialogue box
presented in Figure 37
64
Figure 38 Assign and create the properties of material on SLOPEW
After defining soil strength parameters in the software and all inputs start calculate the
minimum factor of safety of the slope by clicking on ldquostartrdquo button the program will take
time to analyze the slope and that depends on the number of increments and the type of
mesh that chosen for the slope the computed model shown in Figure 38 show the case of
cohesion and internal friction angle both 16 kPa and ˚ respectively and unit weight 15
kNmsup3
65
Figure 39 SLOPEW factor of safety value
343 PLAXIS
PLAXIS is described as a finite element FE package for geotechnical analysis that can use
both three-dimensional and two-dimensional analysis in determining the moment of
inertia and shear forces of slopes stability deflection displacements and deformation
experienced by slopes PLAXIS provides itself to modeling more complex geotechnical
scenarios as it has the ability to simulate inhomogeneous soil properties and time
dependent scenarios The required Soil Properties presented in Table 34
Table 34 Required soil properties for PLAXIS
Definition Property Symbol Units
Soilrsquos Total Unit Weight ɤ Unit Weight kNm3
Soilrsquos Cohesion C Cohesion kPa
Friction angle of the soil Phi Oslash ˚
The ratio of lateral strain
to linear strain
Poissonrsquos Ratio ν -
Elastic modulus at the
reference depth
Reference
Elastic Modulus
Eref kNm2
66
The Methodology of PLAXIS Analysis
Start PLAXIS by setting the units and draw scale and slope limits (right left bottom
down) and grid spacing for the model as presented in Figure 39 so the axes can draw after
that
Figure 310 Set units on PLAXIS
Drawing in PLAXIS is easy because drawing the model can be done by using the inbuilt
CAD interface as shown in Figure 310 alike SLOPEW and unlike FLAC which it needs
to input the coordinates (X Y) of each point of the drawn slope
67
Figure 311 Drawing in PLAXIS
The model need to be fixed by hitting the button ldquostandard fixtiesrdquo from the tool bar so the
slope unmovable from continues sides (bottom and left sides) as shown in Figure 311
Figure 312 PLAXIS standard fixities
68
Assign and create the properties of material are needed but PLAXIS need advanced
properties the elastic parameters Youngs modulus and Poissons ratio were allocated
nominal values of 100 kNm2 and 03 respectively as they have little impact on the
computed factor of safety (Hammah Yacoub Corkum amp Curran 2005) as shown in
Figure 313
Figure 313 Assign and create the properties of material on PLAXIS
Generating the mesh is needed in this software A medium mesh is being used in this
study to help improve accuracy as shown in Figure 314 The mesh is presented in Figure
after generating in Figure 315
69
Figure 314 Determine the mesh size on PLAXIS
Figure 315 PLAXIS before generating mesh
By hitting calculate button in tool bar the program will ask to determine some points in
the slope for the expected failure surfce then calculte the fctor of safety after that as
shown in Figure 315
70
Figure 316 PLAXIS after generating the mesh
By hitting calculate button the software will show the deformed slope as shown in Figure
316 and calculate the factor of safety
Figure 317 Slope displacement on PLAXIS
71
CHAPTER4
RESULTS AND DISCUSSION
41 Introduction
In this chapter the effect of every soilrsquos strength parameter cohesion unit weight and
internal friction angle (c γ and ϕ) has been studied on factor of safety FOS and failure
surface both together and separately In the first section of the results in order to
determine the varying in FOS and slip surface a number of models were analyzed while in
the second section to find an accurate relationship between the strength parameters of soil
and the surface of failure and an adequate number of models were analyzed After all the
models were generated and analyzed the figures were drawn to demonstrate the influences
of the variables on FOS and failure surface In addition the reasons for these various
behaviors were debated
42 Impact of Soil Strength and Slope Geometry Parameters on the Factor of Safety
In this section three series of analyzing were performed in order to study the feasibility of
this study One of the parameters changed in each set of models while the other two
parameters kept constant these models were studied to see if there is any relation between
the position of the surfaces of failure and the soil parameters
421 Impact of unit weight on factor of safety
In order to study the influence of unit weight γ on FOS the values of unit weight have
been chosen from 15 to 30 kNm3 while the internal friction angle and the cohesion have
been chosen as 15˚ and 15 kPa respectively
72
Table 41 Effect unit weight on FOS
Model
number
Unit weight
[kNm3]
Internal friction
angle[deg]
Cohesion[kPa] Factor
of
safety
1 15 15 15 2411
2 16 15 15 2295
3 18 15 15 2173
4 20 15 15 2044
5 22 15 15 1956
6 24 15 15 1884
7 26 15 15 1822
8 28 15 15 1769
9 30 15 15 1724
In Table 41 the values showed that as the soilrsquos unit weight raise FOS values decrease
This reduction could be explained by weight of the soil as the unit weight increases weight
of soil as the main derivative force behind the failure increases Therefore increasing unit
weight causes the slope to become more unstable leading to a reduction in the FOS
Clayey and silty sands represent the value between 17-32 kNm3
of unite weight
(NAVFAC1986)
Extensive field experiments for (Feng S J et al 2019) were carried out in conjunction
with numerical simulation and LE analyzes to examine the major failure of an unfilled
landfill structure in Shanghai China The study also found the collapse happened in the
sandy silt with silt clay layer which represent 182 kNm3
73
(a)
(b)
Figure 41 (a) Impact of unit weight on slip surface (b) cropped portion of (a)
Figure 41(a) demonstrates the impact of unit weight on failure surface (whereas Figure
41(b) is a cropped variant of (a)) The tests follow a practical rule by maximizing unit
weight of the soil the failure surface is moved to the right leading in a smaller volume of
soil failure and thus decreasing the slip surface length Less resistant force is activated due
to the smaller surface for holding forces (friction and cohesion) For these reasons a lower
value for safety factor is accomplished
74
422 Impact of cohesion on factor of safety
To study the impact of cohesion on FOS the cohesion values diverge from 16 to 30 kPa
were chosen while the internal friction angle and unit weight of the soil chosen as 15˚ and
15 kNm3 respectively
The calculated values of FOS for different C values are shown in Table 42
Table 42 Impact C on FOS
Model
number
Unit Weight
[kNm3]
Internal
Friction Angle
[deg]
Cohesion
[kPa]
Factor
of
Safety
1 15 15 16 1355
2 15 15 18 1409
3 15 15 20 1463
4 15 15 22 1517
5 15 15 24 1572
6 15 15 26 1626
7 15 15 28 1680
8 15 15 30 1724
The values in Table 42 showed that as the cohesion of the soil raised FOS values
increased this increase is due to the raise up in cohesion value as mentioned before since
cohesion is one of the resisting forces Increasing cohesion caused the slope to become
more stable leading increasing in factor of safety
75
[a]
[b]
Figure 42 [a] Impact of C on slip surface [b] cropped portion of [a]
As it shown in Figure 42 tests follow a logical order by maximizing the cohesion value
failure surface and La increase to obtain the same cohesion force value (calculated by
multiplying cohesion by failure arc length) In addition a greater failure surface leads to a
greater weight value for the volume of failure (greater derivative force) and a greater
friction force value
76
Furthermore as the value of cohesion rises so the fault surface increased (including La)
FOS rises This suggests the increasing in the resistance forces is more prevalent than the
increasing in the influence of driving forces
423 Impact of internal friction angle on factor of safety
With the aim of testing the impact of friction angle on the factor of safety of the soil
various values of Oslash changing from 16 to 30 degrees were selected meanwhile the soilrsquos
unit weight and the cohesion were preserved constant respectively at 15 kNm3 and 15
kPa
Table 43 Effect Oslash on FOS
Model
number
Unit Weight
[kNm3]
Internal
friction angle
[deg]
Cohesion[kPa] Factor
of
Safety
1 15 16 15 1180
2 15 18 15 1259
3 15 20 15 1340
4 15 22 15 1399
5 15 24 15 1475
6 15 26 15 1556
7 15 28 15 1638
8 15 30 15 1724
In the Table 43 data demonstrates that factor of safety increased by increasing the friction
angle value As mentioned before since friction angle is one of the holding and resisting
factors The results obtained are in line with the concept
Figure 43 (a) demonstrates the impact of friction angle on failed surface (meanwhile
Figure 43 [b] is a cropped part from [a])
77
[a]
[b]
Figure 43 [a] Cohesion impact on slip surface [b] cropped portion of [a]
As it shown in the Figure 42 the same as the unit weight effect the tests succeed logical
trendacy by maximizing the friction angle
78
The failure surface and La decrease to accomplish the same friction force value (calculated
by multiplying the tangent of Oslash by La) In addition a small failure surface leads to a
smaller failurersquos weight volumersquos value (lower derivative factor) and a lower value of the
cohesion force
Furthermore an increase in internal friction angle (Oslash) results in a reduction in the slip
surface and La thus FOS increases This suggests that a reducing in the impact of
cohesion is more prevalent than reducing in driving factor
424 Impact of slope geometry on factor of safety
With constant soil strength parameters four different slopes shapes were analysed in order
to monitor the impact of the slope shape on the factor of safety c = 15 kPa ɤ = 15 kN m3
and Oslash = 15˚
Taking into account situations numbers 1 and 2 together 3 and 4 together as shown in
Table 44 it is obviously noticed that increase the surface soil angle (Alpha) as shown in
Figure 44) will result the slope to become less stable this may be due to the fact that this
amount of soil added to the upper part will act as an overhead load increase the driving
force and resulting in the factor of safety to decline
On the other hand taking into account states numbers 1 and 2 together 3 and 4 with each
other it is observed that increasing the angle of slope (Beta) is going to result the slope to
become more stable this maybe due to the fact that by increasing that angle and La
increases yield to more resistant force that will raise the factor of safety
79
Table 44 Impact of slope geometry on FOS
Model No
(shape No)
Unit
Weight
[kNm3]
Internal
Friction
Angle [deg]
Cohsion
[kPa]
Factor
of
Safety
1 15 15 15 2325
2 15 15 15 1794
3 15 15 15 1175
4 15 15 15 1142
Figure 44 Models for effect slope geometry on FOS
43 Impact of Geometry and Soil Strength Parameters on the Slip Surface
Based on what was debated in the past part (42) it is easy to estimate that a correlation
must be existed between the strength parameters of soil and the geometry of the slope and
80
the surface of failure the following analyzed models will be studied in order to examine
this condition
Many models were generated using SLOPEW software in this step The output in this
aspect will become the factor of safety and slip circle center coordinates as well as the
circular failure surface radius
The circles have been drawn using AutoCAD software to find out La and locate entry and
exit points in the slope failed area
Figure 45 reflects the general shape of the slope geometry that is going to be used in the
next 75 models
Figure 45 Slope model geometry
Various parameters of shear strength and soil unit weight were analyzed for the produced
designs Over the next sections the specifics of these parameters are given and discussed
81
431 Impact of cohesion C on slip surface
In this part at 15deg and 15 kNm3
respectively the internal friction angle and unit weight of
the soil remained constant and the cohesion changed from 15 to 32 kPa La and Oslash have
been referred to length of failure arc and internal friction angle respectively as shown in
table 45
Table 45 Cohesion impact on the slip surface
Model
No
Unit
Weight
(kNm3)
Oslash
(deg)
Cohesion
(kPa)
Entry
(XY)
(m)
Exit
(XY)
(m)
Radius
(m)
La
(m)
Factor
of
safety
1 15 15 15 17 139 25 608 2464 1007 1033
2 15 15 16 17 139 25 608 2464 1007 1081
3 15 15 17 17 139 25 609 2464 1007 1129
4 15 15 18 18 135 25 609 2391 1033 1158
5 15 15 19 18 135 25 609 2391 1033 1207
6 15 15 20 17 139 25 608 2464 1098 1272
7 15 15 21 16 142 25 607 255 1217 1340
8 15 15 22 16 142 25 607 255 1217 1387
9 15 15 23 18 135 25 609 239 1033 1401
10 15 15 24 16 142 25 607 2553 1217 1483
11 15 15 25 16 142 25 607 2553 1217 1530
12 15 15 26 16 142 25 607 2553 1217 1578
13 15 15 27 16 142 25 607 2553 1217 1626
14 15 15 28 15 146 25 607 2652 1320 1693
15 15 15 29 16 142 25 607 2553 1217 1721
16 15 15 30 15 146 25 606 2652 1320 1787
17 15 15 31 15 146 25 606 2652 1320 1834
18 15 15 32 15 146 25 606 2652 1320 1882
82
432 Impact of internal friction angle phi on slip surface
Unit weight and cohesion kept unchanged in this part at 15 kNm3 and 15 kPa
respectively while the angle of friction varied between 16deg and 32deg La and Oslash have been
referred to length of failure arc and internal friction angle respectively as shown in table
46
Table 46 Internal friction angle impact on slip surface
Model
No
Unit
Weight
(kNm3)
Oslash (deg) Cohesion
(kPa)
Entry
(XY)
(m)
Exit
(XY)
(m)
Radius
(m)
La
(m)
Factor
of
safety
19 15 16 15 18 135 25 609 239 10555 1033
20 15 17 15 18 135 25 609 239 10555 1054
21 15 18 15 18 135 25 609 239 10555 1074
22 15 19 15 19 132 25 61 234 95583 1070
23 15 20 15 19 132 25 61 234 95583 1089
24 15 21 15 20 128 25 62 12717 86434 1135
25 15 22 15 19 1316 25 607 1319 96773 1141
26 15 23 15 19 1316 25 61 2342 95583 1148
27 15 24 15 19 1316 25 61 2342 95583 1168
28 15 25 15 19 1316 25 61 2342 95583 1188
29 15 26 15 20 128 25 617 12717 86434 1215
30 15 27 15 19 1316 25 61 2342 95583 1230
31 15 28 15 20 128 25 617 12717 86434 1249
32 15 29 15 20 128 25 617 12717 86434 1266
33 15 30 15 20 128 25 617 12717 86434 1284
34 15 31 15 20 128 25 617 12717 86434 1301
35 15 32 15 20 128 25 617 12717 86434 1320
83
433 Impact of unit weight on slip surface
Friction angle and cohesion kept unchanged at 15deg and 15 kPa in this part meanwhile
soilrsquos unit weight ranged from 16 kNm3 to 31 kNm
3
La and Oslash have been referred to length of failure arc and internal friction angle respectively
as shown in table 47
Table 47 Impact of unit weight on the slip surface
Model
numb
er
Unit
Weight
(kNm3)
Oslash (deg) Cohesion
[kPa]
Entry
(XY)
[m]
Exit
(XY)
[m]
Radius
(m)
La
(m)
Factor
of
safety
36 16 15 15 18135 25 61 239 10555 0967
37 17 15 15 18135 25 61 239 10555 0927
38 18 15 15 19 132 25 61 234 95549 0874
39 19 15 15 18 135 25 61 239 10555 0860
40 20 15 15 19 132 25 61 132 92160 0817
41 21 15 15 19 132 25 61 2342 95549 0786
42 22 15 15 19 132 25 61 2342 95549 0762
43 23 15 15 19 132 25 61 2342 95549 0740
44 24 15 15 19 132 25 61 2342 95549 0720
45 25 15 15 19 132 25 61 2342 95549 0701
46 27 15 15 19132 25 61 2342 95549 0669
47 29 15 15 19 132 25 61 2342 95549 0640
48 31 15 15 20 128 25 617 12717 86434 0613
84
434 Impact of unit weight and cohesion on slip surface
The friction angle kept unchanged at 15deg in this part and the values varied from 16 to 31
for both parameters cohesion and unit weight kPa and kNm3 respectively
La and Oslash have been referred to length of failure arc and internal friction angle respectively
as shown in table 48
Table 48 Impact of cohesion and unit weight on the Slip Surface
Model
No
Unit
Weight
(kNm3)
Oslash
(deg)
Cohesion
(kPa)
Entry
(XY)
(m)
Exit
(XY)
(m)
Radius
(m)
La
(m)
Factor
of
Safety
49 16 15 16 17 139 25 608 2464 11474 1033
50 17 15 17 17 139 25 608 2464 11474 1033
51 19 15 19 17 139 25 608 2464 11474 1033
52 21 15 21 17 139 25 608 2464 11474 1033
53 23 15 23 17 139 25 608 2464 11474 1033
54 25 15 25 17 139 25 608 2464 11474 1033
55 27 15 27 17 139 25 608 2464 11474 1033
56 29 15 29 17 139 25 608 2464 11474 1033
57 31 15 31 17 139 25 608 2464 11474 1033
85
435 Impact of unit weight and friction angle on slip surface
Cohesion factor kept unchanged at 15 kPa in this part whilst the other parameters varied
between 15 and 31
La and Oslash have been referred to length of failure arc and internal friction angle respectively
as shown in table 49
Table 49 Impact of unit weight and friction angle on slip surface
Model
No
Unit
Weight
kNm3
Oslash
(deg)
Cohesion
(kPa)
Entry
(XY)
(m)
Exit
(XY)
(m)
Radius
(m)
La
(m)
Factor
of
Safety
58 16 16 15 18 1352 25 609 239 1147 0988
59 17 17 15 19 1316 25 61 2342 9520 0946
60 19 19 15 19 1316 25 61 2342 9520 0915
61 21 21 15 20 128 25 617 12717 8643 0895
62 23 23 15 21 1244 25 615 2387 7741 0833
63 25 25 15 21 1244 25 615 2387 7741 0830
64 27 27 15 21 1244 25 62 13048 7725 0820
65 29 29 15 21 1244 25 615 2387 7741 0816
66 31 31 15 22 121 25 624 14104 6763 0804
436 Impact of cohesion and friction angle on slip surface
friction angle and cohesion changed from 16 to 31 in this segment meanwhile soilrsquos unit
weight kept at 15 kNm3 La and Oslash have been referred to length of failure arc and internal
friction angle respectively as shown in table 410
86
Table 410 Impact of cohesion and friction angle on slip surface
Model
No
Unit
Weight
(kNm3)
Oslash
(deg)
Cohesion
(kPa)
Entry
(XY)
(m)
Exit
(XY)
(m)
Radius
(m)
La
(m)
Factor
Of
safety
67 15 16 16 17 139 25 608 2464 11215 1103
68 15 17 17 17 139 25 608 2464 11215 1173
69 15 19 19 17 139 25 608 2464 11215 1314
70 15 21 21 17 139 25 608 2464 11215 1456
71 15 23 23 17 139 25 608 2464 11215 1600
72 15 25 25 17 139 25 608 2464 11215 1745
73 15 27 27 17 139 25 608 2464 11215 1891
74 15 29 29 17 139 25 608 2464 11215 2040
75 15 31 31 17 139 25 608 2464 11215 2190
437 Impact of slope geometry on slip surface
Slope geometry were shown to have a direct relation with the stability of the slope as well
as the soil strengthrsquos properties (Namdar 2011)
In the last models series strength parameters of soil kept unchanged at the following
values whereas angles ranged from 0 deg to 634deg for (Beta) angle while (Alpha) angle
ranged from 0 deg to 198deg in slope geometry (shown in Figure 44)
Cohesion = 15 kPa internal angle of friction = 15deg unit weight = 15 kNm3
87
Table 411 Impact of slope geometry on slip surface
Model
No
α (˚) β (˚) Slope
Height
(m)
Entry (m) Exit (m) Radius
(m)
La (m) Factor
of
Safety
1 198 0 20 169 139 25 61 244 11467 1037
2 1775 0 19 179 132 25 61 229 10285 1033
3 156 0 18 189 126 25 62 213 91261 1047
4 135 0 17 189 125 25 618 204 90438 1058
5 113 0 16 2012 25 61 1056 74748 1042
6 91 0 15 199 118 25 618 1864 77090 1048
7 68 0 14 20 116 25 62 179 76002 1052
8 46 0 13 20 114 25 617 931 70123 1079
9 23 0 12 209 1116 25 62 8967 60907 1061
10 0 0 11 21 11 25 615 9018 59075 1053
11 0 113 11 193 11 25 608 1543 76643 1252
12 0 218 11 187 11 25 6 154 82403 1419
13 0 31 11 172 11 25 6 942 98461 1580
14 0 3875 11 181 11 25 604 88 89029 1642
15 0 45 11 175 11 249 61 653 98891 1774
16 0 502 11 167 11 247 63 658 10262 1928
17 0 545 11 158 11 25 602 716 11706 1978
18 0 58 11 146 11 25 603 763 13197 2088
19 0 61 11 136 11 254 6) 82 14834 2185
20 0 634 11 125 11 27 6 94 18053 2302
88
44 Impact of Geometry and Soil Strength Parameters on Factor of Safety
To evaluate the impact geometry and strength parameters of soil on the factor of safety
FOS versus the strength parameters was offered and drawn in the following figures
441 Impact of cohesion C on factor of safety
The cohesion effect on the factor of safety has been shown in this part Increasing the value
of cohesion as a resistant holding force as expected raised the value of the factor of
safety Figure 46 shows the linear correlation between cohesion and factor of safety FOS
is nearly linear with a R2
factor of 099
Figure 46 Effect of cohesion on the FOS
89
442 Impact of internal friction angle on the factor of safety
The effect of the friction angle on the factor of safety was shown in this part Increasing the
internal friction angle value which is also a holding force as expected increased the factor
of safety value As it shown in Figure 47 the correlation between FOS and the internal
friction angle
Figure 47 Internal friction angle impact on factor of safety
443 Impact of unit weight ɤ on factor of safety
Figure 48 shows the influence of soil unit weight ɤ on the factor of safety As could be
shown from the Figure 48 ɤ is inversely proportional to factor of safety as the major
derivative factor on soil mass was applied
90
Figure 48 Impact of unit weight on the FOS
444The combined impact of unit weight and cohesion on factor of safety
In this section the impact of cohesion and the soil unit weight ɤ on factor of safety was
studied Cohesion and soil unit weight were raised altogether here but the ratio kept
unchanged The outputs dictate that the potential surface of the slip is affected by
combining of Phi and C the function which is defined as λ equivalent to
λ= C (ɤhtanOslash ) (245)
Figure 49 shows the impact of cohesion and unit weight on FOS while lambda value stays
constant
91
Figure 49 The combined effect of unit weight and cohesion the on FOS
445 The combined impact of friction angle Oslash and unit weight on factor of safety
In this section by increasing both the values of Phi and unit weight ɤ Therefore in
Figure 410 the factor of safety versus Phi and γ curve was presented
Figure 410 The impact of friction angle Oslash and unit weight on factor of safety
92
As shown in Figure 410 decrease in the value of FOS was achieved by raising the value
of Oslash and γ This is due to the failure surface movements to the upper side thus reducing
the La and so reducing the influence of resisting and holding forces
446The combined Impact of friction angle Phi and cohesion C on factor of safety
In this section since the surface of potential failure is expected to be influenced by both of
C and Oslash values Figure 411 shows the relationship between the factor of safety and C Oslash
Because both of these parameters of shear strength are holding factors increasing those
two parameters results in a raise in the value of the factor of safety FOS is nearly linear
with R2 factor of 09999
Figure 411 The impact of Phi and cohesion on FOS
93
447 Impact of the slope geometry on factor of safety
In the methodology section two slope angles α and β were introduced and used to test the
impact of geometry on factor of safety and their impact on the factor of safety was
observed The results will be presented in the figures below
Figure 412 Alpha angle impact on factor of safety
Figure 412 represents that no noticeable variation is observed in the factor of safety except
the value of FOS between angles 46˚ and 68˚ it decreased unpretentiously after the angle
68˚ although it was increasing slightly before that value of Alpha angle These decrease
because it is possible by increase the Alpha angle as if adding an additional overhead load
on the surface of the slope But before the angle 68˚ it causes increases the surface of the
failure and thus increases the length of the arc it generates more resistant force and makes
the factor of safety constant While this rise in the surface of failure produces more
resistant force it simultaneously produces an increase in derivative force(weight of the
surface of failure) The factor of safety therefore remains constant For angles more than
68˚ the rise in derivativeforceapproaches the value of the resisting force and from this
angle value onwards the derivative force becomes greater than the resisting force and for
that a decrease can could seen in the value of factor of safety
94
Figure 413 Beta angle impact on factor of safety
Figure 411 represents the factor of safety significantly increases by increasing Beta angle
The reason for this behavior is that only the failure arc length increases as holding force
and the weight of the failure shape as driving force stays constant by increasing the beta
angle For that by increasing the length of the arc result an increase in the resisting force
and thus the factor of safety
45 Impact of Soil Strength and Geometry Parameters on Slip Surface
To study the impact of every soil parameter on the slip surface the length of the failure arc
was selected to be studied as a quantitative variable To demonstrate this impact the
following figures will be provided
95
451 Impact of cohesion on La length of failure arc
The impact of cohesion La is shown in Figure 412
Figure 414 Cohesion impact on La lengthoffailure arc
The figure represents that the length of the failure surface will increase with an increase in
value of cohesion The cause is that in the state of the constant location of the failed
surface as the cohesion force raises the holding force becomes greater the same thing for
the FOS The deriving force must raise which could be accomplished by increase the area
of slope fail in order to determine the minimum value of FOS (that is initial objective for
slope stability analysing) This results in a larger arc failure length and so a greater value of
FOS
452 Impact of friction angle Phi on length of failurearc
The impact of Phi on failure surface length is shown in Figure 413
96
Figure 415 Internal friction angle impact on length of failure arc
In the previous section referring to the same explanation it could be anticipated that La
must be in a proportional correlation with Oslash but as could be seen in Figure 413 L and Oslash
are related inversely
This inverse relationship is consistent with the study of (Jiang amp Yamagami 2006) that
sets that when the distribution of geometry of the slope unit weight in a homogeneous soil
slope is given the critical slip surface location for specifically slice method is only related
to the ratio 119862
tan (120593) of that slope This study indicates that the slip surface position and
therefore La is in the inverse relationship to the angle of the friction
453 Impact of unit weight ɤ on lengthoffailurearc
In this part the impact of unit weight on failure length arc has been studied
97
Figure 416 Effect of unit weight on La
As shown in Figure 414 by raising soil unit weight the weight of the fallen area rises
resulting a small factor of safety To say it in another word by considering lambda the
surface of the failure slip shifts towards the face of the slope while by reducing La the
impact of the friction angle and cohesion as the forces of resistance reduce thus achieving
a smaller factor of safety
454 The combined impact of cohesion C and unit weight on length of failure arc
La
In this section unit weight and cohesion increased altogether in a way the ratio remain
unchanged The results shown in Figure 415
98
Figure 417 The combined impact of cohesion and unit weight on La
Constant c over unit weight ratio which results in a constant λ As noted in the study
of(Lin amp Cao2011) this means the same shape of failure and therefore a unchanged value
of La
455 The combined impact of friction angle Phi and unit weight ɤ on La
In this part unit weight and Phi increased together The results shown in Figure 415 to
show the variation impact for both of the strength factors
99
Figure 418 The combined impact of internal friction angle and unit weight on the length
of failure arc
It can be seen that there will be a reduction in the length of the surface failure by increasing
the value of 120574 and tan120593 It is consists when talking about the 120582 value by maximizing this
value 120582 declines smaller value of 120582 means surface of failure nearer to surface of the slope
and thus a smaller La
456 The combined impact of cohesion and internal friction angle on the length of
failure arc
The following figure illustrates the combined impact on the length of the failure arc of
variable internal friction angle and cohesion the results have been drawn in Figure 417
100
Figure 419 The combined impact of cohesion and Phi on La length of failure arc
From the Figure 417 it could be seen that La will remain relatively unchanged at value
(11215 m) when both of the factors cohesion and internal friction angle remain constant
between the values (16-32) Since constant C and tan(Oslash) results in a constant lambda and
constant lambda means a constant surface of failure the length of the arc also remains
constant
457 Impact of slope geometry on length of failure arc
In Figure 418 and Figure 419 La were measured and drawn as a numerical value to show
the impact of slope geometry on the surface of the failure
101
Figure 420 The impact of Alpha angle on the La
Results of analysis of the models indicate that the position of the failure surface does not
differ significantly by increasing the Alpha angle The cause for increasing La is only the
slope surface motion and therefore the failure arc extension
Figure 421 Beta angle impact on La
102
By raising Beta angle value (the other factors in Eq (245) will not change and therefore do
not affect the value of lambda) the failure surface depth does not change At the other side
a raise in the Beta angle can shift the surface of the slope to the right so this going to cause
the arc to extend as shown in Figure 419
[a]
[b]
Figure 422 [a] Alpha angle impact on length of Arc and [b] zoomed portion of [a]
103
46 Reanalyzing Models by PLAXIS and Comparison of Results
The studied models were reanalyzed using PLAXIS software program to assure the outputs
of SLOPEW program acquired in part 43 Table 412 shows the results of these analyzes
Table 412 Models of cohesion values chosen for the factor of safety analysis - PLAXIS
Model
number
Unit
weight
[kNm3]
Internal
Friction
angle [deg]
Cohesion
[kPa]
Factor
of
safety
2 15 15 16 1051
4 15 15 18 1107
6 15 15 20 1254
8 15 15 22 1328
10 15 15 24 1419
12 15 15 26 1532
14 15 15 28 1634
16 15 15 30 1722
104
Table 413 Models of friction angle Phi values selected for the factor of safety analysis
for PLAXIS software
Model
No
Unit
Weight
(kNm3)
Internal
Friction
Angle (deg)
Cohesion
(kPa)
Factor
of
Safety
19 15 16 15 1047
21 15 18 15 1061
23 15 20 15 1073
25 15 22 15 1108
27 15 24 15 1152
29 15 26 15 1237
31 15 28 15 1271
33 15 30 15 1316
Table 414 Models of unit weight values chosen for factor of safety analysis for -
PLAXIS
Model
number
Unit
weight
[kNm3]
Internal
Friction
angle [deg]
Cohesion
[kPa]
Factor
of
safety
37 17 15 15 0867
39 19 15 15 0796
41 21 15 15 0752
43 23 15 15 0713
45 25 15 15 0689
46 27 15 15 0635
47 29 15 15 0608
48 31 15 15 0594
105
Table 415 Models of unit weight and C values chosen for FOS analysis by PLAXIS
software
Table 416 Models of unit weight and internal friction angle values chosen for the FOS
analysis for PLAXIS software
Model
number
Unit weight
[kNm3]
Internal friction
angle [deg]
Cohesion
[kPa]
Factor of
safety
58 16 16 15 0954
59 17 17 15 0937
60 19 19 15 0912
61 21 21 15 0900
62 23 23 15 0868
63 25 25 15 0838
64 27 27 15 0824
65 29 29 15 0809
66 31 31 15 0792
Model
No
Unit weight
[kNm3]
Internal friction
angle [deg]
Cohesion
[kPa]
Factor of
safety
49 16 15 16 1024
50 17 15 17 1024
51 19 15 19 1024
52 21 15 21 1024
53 23 15 23 1024
54 25 15 25 1024
55 27 15 27 1024
56 29 15 29 1024
57 31 15 31 1024
106
Table 417 Models of cohesion c and friction angle Phi values chosen for the factor of
safety analysis for PLAXIS software
Model
number
Unit
weight
[kNm3]
Internal
friction
angle [deg]
Cohesion
[kPa]
Factor
of
safety
67 15 16 16 1048
68 15 17 17 1120
69 15 19 19 1224
70 15 21 21 1391
71 15 23 23 1493
72 15 25 25 1617
73 15 27 27 1803
74 15 29 29 1947
75 15 31 31 2113
Table 418 summarizes the distinction between the FOS acquired from both programs
(PLAXIS and SLOPEW) and compares these results using the following formula
Difference = FOS(SLOPEW)minusFOS(PLAXIS)
FOS (PLAXIS) 100 (41)
107
Table 418 the difference of FOS between PLAXIS and SLOPEW
Model No SLOPEW
FOS
PLAXIS
FOS
Difference
2 1081 1051 29
4 1158 1107 46
6 1272 1254 14
8 1387 1328 44
10 1483 1419 48
12 1578 1532 3
14 1693 1634 36
16 1787 1722 38
19 1033 1047 -13
21 1074 1061 12
23 1089 1073 15
25 1141 1108 29
27 1168 1152 14
29 1215 1237 -18
31 1249 1271 -17
33 1284 1316 -2
37 0927 0867 3
39 086 0796 32
41 0786 0752 17
43 074 0713 135
45 0701 0689 06
46 0669 0635 17
47 064 0608 16
48 0613 0594 095
49 1033 1024 045
108
Table 418 the difference of FOS between PLAXIS and SLOPEW
Model No SLOPEW
FOS
PLAXIS
FOS
Difference
50 1033 1024 045
51 1033 1024 045
52 1033 1024 045
53 1033 1024 045
54 1033 1024 045
55 1033 1024 045
56 1033 1024 045
57 1033 1024 045
58 0988 0954 17
59 0946 0937 045
60 0915 0912 015
61 0895 09 -025
62 0833 0868 -175
63 083 0838 -04
64 082 0824 -02
65 0816 0809 035
66 0804 0792 152
67 1103 1048 275
68 1173 112 265
69 1314 1224 45
70 1456 1391 46
71 16 1553 3
72 1745 1687 34
73 1891 1803 44
74 204 1947 47
75 219 211 38
109
Table 419 Effect of slope geometry on the slip surface - PLAXIS
Model
number
α [˚] β [˚] Slope
Height
(m)
Factor of
Safety
1 198 0 20 1013
2 1775 0 19 1029
3 156 0 18 1042
4 135 0 17 1061
5 113 0 16 1057
6 91 0 15 1064
7 68 0 14 1052
8 46 0 13 1057
9 23 0 12 1055
10 0 0 11 1048
11 0 113 11 1216
12 0 218 11 1365
13 0 31 11 1521
14 0 38 11 1609
15 0 45 11 1693
16 0 502 11 1877
17 0 545 11 1951
18 0 58 11 2029
19 0 61 11 2129
20 0 634 11 2274
110
Table 421 The difference of FOS between PLAXIS and SLOPEW for slope geometry
Model No SLOPEW
FOS
PLAXIS
FOS
Difference
()
1 1037 1013 12
2 1033 1029 02
3 1047 1042 025
4 1058 1061 -015
5 1042 1057 -075
6 1048 1064 -08
7 1052 1052 0
8 1079 1057 11
9 1061 1055 03
10 1053 1048 025
11 1252 1216 18
12 1419 1365 27
13 158 1521 295
14 1642 1609 165
15 1774 1693 405
16 1928 1877 255
17 1978 1951 135
18 2088 2029 295
19 2185 2129 28
20 2302 2274 14
It can be seen in Table 418 that PLAXIS is a more conservative designing program On
average PLAXIS gives less than 5 lower FOS (except few models) which gave FOS
greater than SLOPEW software that will make PLAXIS more conservative and therefore
safer to design and analyze more significant slopes
111
By comparison giving SLOPEW a higher FOS makes it more beneficial to analyze and
design less important slopes
47 Reanalyzing the Past Models by FLACSlope
To inspect the results of PLAXIS and SLOPEW a sample of the models were chosen up
to their properties and by using the FLAC program these models have been reanalyzed as
shown in Tables 422 and 423 Considering that FLAC is not software with a complete
LEM the results may show a distinction between three software
Table 422 Reanalyze models by using FLAC software (shear strength parameters
models)
Model
number
Unit
weight
[kNm3]
Internal
Friction
angle[deg]
Cohesion
[kPa]
Factor
of
safety
6 15 15 20 1029
11 15 15 25 1221
23 15 20 15 0932
28 15 25 15 1049
45 25 15 15 0607
54 25 15 25 0842
63 25 25 15 0764
72 15 25 25 1436
112
Table 423 Reanalyze models by using FLAC software (slope geometry models)
Model No α (˚) β (˚) Factor of Safety
6 91 0 0869
15 0 45 1827
Table 424 The difference between the three software packages (shear strength
parameters models)
Table 425 The difference between the three software packages (slope geometry models)
Model no Factor of safety of Difference between FLAC
and
FLAC SLOPEW PLAXIS SLOPEW
()
PLAXIS ()
6 1029 1272 1254 236152 218659
23 0932 1089 1073 16846 151288
45 0607 0701 0689 15486 135091
54 0842 1053 1024 250594 216152
63 0764 083 0838 86387 96859
72 1436 1745 1617 215181 126045
Model no Factor of safety of Difference between FLAC
and
FLAC SLOPEW PLAXIS SLOPEW
()
PLAXIS
()
6 0869 1048 1064 205984 195
15 1827 1774 1774 2901 -53
113
As shown in Tables 424 and 425 the average distinction between FLACSLOPE and the
others programs is less than 1 percent which is appropriate In addition it is noticeable
that FOSs obtained from FLAC are lower than the other two programs in 75 of the
models
114
CHAPTER 5
CONCLUSIONS AND RECOMMENDATIONS
51 Conclusions
The conclusions were drawn on the basis of the slope stability analyzes by using the
software packages PLAXIS SLOPEW and FLAC
1 Cohesion (c) and friction angle (Oslash) as resistance forces are directly related to the factor
of safety while unit weight as deriving force is inversely related to the factor of safety
2 The outputs of this study showed that regarding their friction angle the slopes formed by
smaller grains of soil will be more stable moreover silty and well-graded soils are more
stable than soils with coarse grains such as gravel and sandy soils Also slopes with the
heavier soil in terms of unit weight have less stability
3 Slopes made of boulders or the ones with high content of discrete large grains have less
stability than slopes formed of gravelly soil
4 In this study it is found that clayey and silty sands which represent the soil with unit
weight values more than 15 kNm3
with constant values of cohesion and friction angle
have failed for all slopes On the other hand in silty clayey soils with value of cohesion 15
kPa and unit weight and friction angle differing values the slope would still unstable
5 According to the dimensionless function λ and the results showed that an increase in the
cohesion value results to higher value for length of failure arc (La) On the other hand an
increase in the friction angle and the unit weight of soil values result to reduce the length of
failure arc (La) value
6 An increase in the value of Alpha angle to a specific value doesnrsquot have any noticeable
influence on FOS while an increase in the value of the Beta angle affects directly on the
factor of safety
115
7 The greater value of the Alpha angle leads to a greater value of La However varying
the value of Beta angle doesnrsquot affect as much as Alpha does on the value of La
8 PLAXIS is more conservative software for slope stability studies comparing to
SLOPEW which it gives about 5 lower value for factor of safety
9 FLACSlope is the most complicated software to deal with and usually gave out the
lowest value for factor of safety in comparison with PLAXIS and SLOPEW
10 No significant relation between length of failure arc (La) and factor of safety FOS was
found
52 Recommendations
The following recommendations analysis can be performed for other studies in connection
with this thesis
1 Analysis and modeling wider range in parameters of soil strength
2 Including the level of water content and consideration of unsaturated soils and the effect
of water pressure
3 Including more slope geometry variables as the angle of the slope itself and the length of
the slope
4 Conducting a real-scale study to verify the validation of the equations acquired to locate
the critical surface of the failure
116
REFERENCES
Aaron J amp Mcdougall S (2019) Rock avalanche mobility The role of path material
Engineering Geology 257 105-126
Adams C (2015) Slope stability analysis of a small intermittent failure (Doctoral
dissertation California State University Chico)
Albataineh N (2006) Slope stability analysis using 2D and 3D methods (Doctoral
dissertation University of Akron Ohio USA
Amini M amp Ardestani A (2019) Stability analysis of the north-eastern slope of Daralou
copper open pit mine against a secondary toppling failure Engineering Geology 249
89ndash101
Anagnosti P (1969) Three-dimensional stability of fill dams In Proceeding of 7th
International Conference on Soil Mechanics and Foundation Engineering Mexico
(pp 275-280)
Anderson M G amp Richards K S (1987) Modelling slope stability the complimentary
nature of geotechnical and geomorphological approaches Slope Stability
Geotechnical Engineering and Geomorphology New York John Wiley and Sons p
1-9
Aryal K P (2008 October) Differences between LE and FE methods used in slope
stability evaluations In 12th International Conference of International Association
for Computer Methods and Advances in Geomechanics (IACMAG) (pp 1-6)
Azadmanesh M amp Arafati N (2012) A comparison on slope stability analysis of
aydoghmoosh earth dam by limit equilibrium finite element and finite difference
methods International Journal of Civil Engineering and Building Materials 2(3)
115-123 (ISSN 2223-487X)
Azimi S R (2016) Soil slope stability techniques A comprehensive analysis (Doctoral
dissertation) Curtin University Perth Australia
117
Azzouz A S amp Baligh M M (1983) Loaded areas on cohesive slopes Journal of
Geotechnical Engineering 109(5) 724-729
Azzouz A S Baligh M M amp Ladd C C (1981) Three-dimensional stability analyses
of four embankment failures In Proc 10th Int Conf on Soil Mechanics and
Foundation Engineering (Vol 3 pp 343-346)
Johari A Fazeli A amp Javadi A A (2013) An investigation into application of jointly
distributed random variables method in reliability assessment of rock slope
stability Computers and Geotechnics 47 42-47
Baker R amp Leshchinsky D (1987) Stability analysis of conical heaps Soils and
Foundations 27(4) 99-110
Baligh M M amp Azzouz A S (1975) End effects on stability of cohesive slopes
Journal of Geotechnical and Geoenvironmental Engineering 101(ASCE 11705
Proceeding)
Baligh M M Azzouz A S amp Ladd C C (1977) Line loads on cohesive slopes In
Proceedings of the Ninth International Conference on Soil Mechanics and
Foundation Engineering Tokyo Japan[sn] (pp 13-17)
Bolton H Heymann G amp Groenwold A (2003) Global search for critical failure
surface in slope stability analysis Engineering Optimization 35(1) 51-65
Bromhead E N (1992) The stability of slopes blackie academic and professional Lond
UK
Bromhead E N amp Martin P L (2004) Three-dimensional limit equilibrium analysis of
the Taren landslide In Advances in geotechnical engineering The Skempton
conference Proceedings of a three day conference on advances in geotechnical
engineering organised by the Institution of Civil Engineers and held at the Royal
Geographical Society London UK on 29ndash31 (pp 789-802) Thomas Telford
Publishing
Cavounidis S (1987) On the ratio of factors of safety in slope stability
118
analyses Geotechnique 37(2) 207-210
Chen R H amp Chameau J L (1983) Three-dimensional limit equilibrium analysis of
slopes Geotechnique 33(1) 31-40
Cheng Y M amp Lau C K (2014) Slope stability analysis and stabilization new methods
and insight CRC Press
Cheng Y M Lansivaara T amp Siu J (2008) Impact of convergence on slope stability
analysis and design Computers and Geotechnics 35(1) 105ndash113
Cheng Y M Li L Chi S chun amp Wei W B (2007) Particle swarm optimization
algorithm for the location of the critical non-circular failure surface in two-
dimensional slope stability analysis Computers and Geotechnics 34(2) 92ndash103
Cheng Y M (2003) Location of critical failure surface and some further studies on slope
stability analysis Computers and Geotechnics 30(3) 255ndash267
Cheng Y M Li L Lansivaara T Chi S C amp Sun Y J (2008) An improved
harmony search minimization algorithm using different slip surface generation
methods for slope stability analysis Engineering Optimization 40(2) 95ndash115
Chok Y H (2009) Modelling the effects of soil variability and vegetation on the stability
of natural slopes The University of Adelaide School (Doctoral dissertation)
Adelaide Australia
Cho S E amp Lee S R (2002) Evaluation of surficial stability for homogeneous slopes
considering rainfall characteristics Journal of Geotechnical and Geoenvironmental
Engineering 128(9) 756-763
Cheng Y M Lansivaara T amp Siu J (2008) Impact of convergence on slope stability
analysis and design Computers and Geotechnics 35(1) 105ndash113
Duncan J M Wright S G amp Brandon T L (2014) Soil strength and slope stability
Canada John Wiley amp Sons Inc
Duncan J M (1996) State of the Art Limit Equilibrium and Finite-Element Analysis of
119
Slopes Journal of Geotechnical Engineering 122(7) 577ndash596
Duncan J M (1992) State-of-the-art Static stability and deformation analysis In Proc of
Specialty Conf Stability and Performance of Slopes and Embankments-II (Vol 1 pp
222-266) ASCE
EKSTRAND D amp NYLANDER P Probabilistic Approach to Slope Stability
Department of Civil and Environmental Engineering Masterrsquos Thesis chalmers
university of technology Goumlteborg Sweden
Farah K Ltifi M amp Hassis H (2011) Reliability analysis of slope stability using
stochastic finite element method Procedia Engineering 10 1402ndash1407
Feng S J Chang J Y Shi H Zheng Q T Guo X Y amp Zhang X L (2019) Failure
of an unfilled landfill cell due to an adjacent steep slope and a high groundwater
level A case study Engineering Geology 262 105320
Fredlund D G (1987) Slope stability analysis incorporating the effect of soil
suction Slope Stability 113-144
Gens A Hutchinson J N amp Cavounidis S (1988) Three-dimensional analysis of slides
in cohesive soils Geotechnique 38(1) 1-23
GEO-SLOPE International (2015) Stability Modeling with SLOPE W 2007 Version In
GEO-SLOPE International Ltd Methods
Giger M W amp Krizek R J (1976) Stability of vertical corner cut with concentrated
surcharge load ASCE J Geotech Eng Div 102(1) 31-40
Griffiths D V Huang J amp Dewolfe G F (2011) Numerical and analytical
observations on long and infinite slopes International Journal for Numerical and
Analytical Methods in Geomechanics 35(5) 569-585
Griffiths D V amp Lane P A (1999) Slope stability analysis by finite
elements Geotechnique 49(3) 387-403
Griffiths D V amp Marquez R M (2007) Three-dimensional slope stability analysis by
elasto-plastic finite elements Geotechnique 57(6) 537-546
120
Hammah R Yacoub T Corkum B amp Curran J (2010) A comparison of finite
element slope stability analysis with conventional limit-equilibrium investigation
University of Toronto Toronto Canada
Hammouri N A Malkawi A I H amp Yamin M M (2008) Stability analysis of slopes
using the finite element method and limiting equilibrium approach Bulletin of
Engineering Geology and the Environment 67(4) 471
Hovland H J (1979) Three-dimensional slope stability analysis method Journal of
Geotechnical and Geoenvironmental Engineering 105(ASCE 14549 Proceeding)
Hungr O (1987) An extension of Bishops simplified method of slope stability analysis to
three dimensions Geotechnique 37 113-117
Huvenne V A Croker P F amp Henriet J P (2002) A refreshing 3D view of an ancient
sediment collapse and slope failure Terra Nova 14(1) 33-40
Itasca U D E C amp Code U D E (2011) Version 50 Itasca Consulting Group Inc
Minneapolis
Iverson R M (1990) Groundwater flow fields in infinite slopes Geotechnique 40(1)
139-143
J Jiang J C amp Yamagami T (2006) Charts for estimating strength parameters from slips
in homogeneous slopes Computers and Geotechnics 33(6-7) 294-304
Jiang J C amp Yamagami T (2008) A new back analysis of strength parameters from
single slips Computers and Geotechnics 35(2) 286-291
Johari A Fazeli A amp Javadi A A (2013) An investigation into application of jointly
distributed random variables method in reliability assessment of rock slope
stability Computers and Geotechnics 47 42-47
Kang F Han S Salgado R amp Li J (2015) System probabilistic stability analysis of
soil slopes using Gaussian process regression with Latin hypercube
sampling Computers and Geotechnics 63 13-25
121
Khabbaz H Fatahi B amp Nucifora C (2012) Finite element methods against limit
equilibrium approaches for slope stability analysis In Australia New Zealand
Conference on Geomechanics Geomechanical Society and New Zealand
Geotechnical Society
Leshchinsky D O V Baker R amp Silver M L (1985) Three dimensional analysis of
sslope stability International Journal for Numerical and Analytical Methods in
Geomechanics 9(3) 199-223
Leshchinsky D O V amp Baker R (1986) Three-dimensional slope stability end effects
Soils and Foundations 26(4) 98-110
Leshchinsky D amp Huang C C (1992) Generalized three-dimensional slope-stability
analysis Journal of geotechnical engineering 118(11) 1748-1764
Lin H amp Cao P (2012) Limit Equilibrium Analysis for the Relationships Among Slope
c Oslash and Slip Surface Electronic Journal of Geotechnical Engineering 17 185-195
Lin H amp Cao P (2011) Potential slip surfaces of slope with strength parameters
In Advanced Materials Research (Vol 243 pp 3315-3318) Trans Tech
Publications
Li B Li D Zhang Z Yang S amp Wang F (2015) Slope stability analysis based on
quantum-behaved particle swarm optimization and least squares support vector
machine Applied Mathematical Modelling 39(17) 5253-5264
Louis NY Wong (2014) Rock slope failure along non persistent joints insights from
fracture mechanics approach Nanyang Technological University Singapore
Malkawi A I H Hassan W F amp Sarma S K (2001) Global search method for
locating general slip surface using Monte Carlo techniques Journal of geotechnical
and geoenvironmental engineering 127(8) 688-698
Matsui T amp San K C (1992) Finite element slope stability analysis by shear strength
reduction technique Soils and foundations 32(1) 59-70
McCombie P amp Wilkinson P (2002) The use of the simple genetic algorithm in finding
122
the critical factor of safety in slope stability analysis Computers and Geotechnics
29(8) 699ndash714
Mercier D Coquin J Feuillet T Decaulne A Cossart E Pall H amp Saeligmundsson THORN
(2017) Geomorphology Are Icelandic rock-slope failures paraglacial Age
evaluation of seventeen rock-slope failures in the Skagafjoumlrethur area based on
geomorphological stacking radiocarbon dating and tephrochronology 296 45ndash58
Michalowski R L (1989) Three-dimensional analysis of locally loaded slopes
Geotechnique 39(1) 27-38
Mitchell J K Chang M Seed R B Mitchell J K Chang M Cahill E G amp
Cahill J R (1993) The Kettleman Hills Landfill Failure A Retrospective View of
the Failure Investigations and Lessons Learned In International Conference on Case
Histories in Geotechnical Engineering pp 1ndash15
Naderi M A (2013) Determination of the critical slip surface in slope stability
analysis (Master dissertation) Eastern Mediterranean University (EMU) Doğu
Akdeniz Uumlniversitesi (DAUuml) Famagusta TRNC
Namdar A (2011) Geometry in Slope Modeling and Design E-Journal of Science amp
Technology (C) 9ndash21
NAVFAC D 701 (1986)ldquo Soil Mechanicsrdquo Design Manual 7(01)
Nor A M (2010) Optimization of Cost Effectiveness for Slope Stability (Doctoral
dissertation) UMP
Oghli Z (2011) Analyzing slop stability by using shear strength reduction method
(Master dissertation) Aleppo University Aleppo Syria
Oh S amp Lu N (2015) Slope stability analysis under unsaturated conditions Case studies
of rainfall-induced failure of cut slopes Engineering Geology 184 96ndash103
Oh S amp Lu N (2015) Slope stability analysis under unsaturated conditions Case studies
of rainfall-induced failure of cut slopes Engineering Geology 184 96ndash103
123
Prajapati G 8 2017) Types of slope failure Retrieved from
httpswwwslidesharenetGhanshyamPrajapati3types-of-slope-failures
Runesson K amp Wiberg N E (1984) Stability analysis of natural slopes in clay by use of
the finite element method Chalmers University of Technology
Sengupta A amp Upadhyay A (2009) Locating the critical failure surface in a slope
stability analysis by genetic algorithm Applied Soft Computing Journal 9(1) 387ndash
392
SerraM (2013) Geotechnical stability analysis using student versions of FLAC PLAXIS
and SLOPEW Bachelor project University of Southern Queensland Australia
Seed R B Mitchell J K amp Seed H B (1990) Kettleman hills waste landfill slope
failure II stability analyses Journal of Geotechnical Engineering 116(4) 669-690
Sinai C (2012) Common Causes of Slope Failure Retrieved from
httpwwwsinaiconstructionnetLA-foundation-retrofit-blogcauses-of-slope-failure
Spencer E (1967) A method of analysis of the stability of embankments assuming
parallel inter-slice forces Geotechnique 17(1) 11-26
Stefano Utili G B C (2015) Landslide Hazards Risks and Disasters Retrieved from
httpswwwsciencedirectcomtopicsearth-and-planetary-sciencesslope-stability
Suman S (2015) Slope Stability Analysis Using Numerical Modelling (Doctoral
dissertation) National Institute of Technology Rourkela India
Swan C C amp Seo Y K (1999) Limit state analysis of earthen slopes using dual
continuumFEM approaches International Journal for Numerical and Analytical
Methods in Geomechanics 23(12) 1359-1371
Tsai T L amp Yang J C (2006) Modeling of rainfall-triggered shallow landslide
Environmental Geology 50(4) 525ndash534
Ugai K (1985) Three-dimensional stability analysis of vertical cohesive slopes Soils and
Foundations 25(3) 41-48
124
Ugai K (1988) Three-dimensional slope stability analysis by slice methods In Proc 6th
Inter Conf on Numer Meth in Geomech Innsbruck Austria
Wiberg N E Koponen M amp Runesson K (1990) Finite element analysis of
progressive failure in long slopes International Journal for Numerical and
Analytical Methods in Geomechanics 14(9) 599-612
Whitman R V amp Bailey W A (1967) Use of computers for slope stability analysis
Journal of Soil Mechanics amp Foundations Div
Widger R A (1976) Slope stability in unsaturated soils (Doctoral dissertation
University of Saskatchewan) Canada
Wright S G (1969) A study of slope stability and the undrained shear strength of clay
shales (Vol 2) University of California Berkeley
Wright S G Kulhawy F G amp Duncan J M (1973) Accuracy of equilibrium slope
stability analysis Journal of Soil Mechanics amp Foundations Div 99(Proc Paper
10097)
Xiao S Yan L amp Cheng Z (2011) A method combining numerical analysis and limit
equilibrium theory to determine potential slip surfaces in soil slopes Journal of
Mountain Science 8(5) 718ndash727
Xing Z (1988) Three-dimensional stability analysis of concave slopes in plan view
Journal of Geotechnical Engineering 114(6) 658-671
Zeroual Neacutee Dadouche F Lazhar B amp Zennir A (2011) Probabilistic analysis of slope
stability towards the slip by the kinematic method Physics Procedia 21 93ndash100
Zevgolis I E Deliveris A V amp Koukouzas N C (2019) Slope failure incidents and
other stability concerns in surface lignite mines in Greece Journal of Sustainable
Mining 18(4) 182-197
Zolfaghari A R Heath A C amp Mccombie P F (2005) Simple genetic algorithm
search for critical non-circular failure surface in slope stability analysis 32 139ndash152
125
APPENDIECS
126
APPENDIX 1
A11 Factor of safety of failed slopes
A111 Samples of failed slopes by SLOPEW software program
Figure A11 Failed slope at value 17 kNm3 of unit weight
127
Figure A12 Failed slope at value 21 kNm3 of unit weight by using SLOPEW
Figure A13 Failed slope at value 31 kNm3 of unit weight by using SLOPEW
128
Figure A14 Failed slope at value 16 of unit weight and internal friction angle by using
SLOPEW
Figure A15 Failed slope at value 21 of unit weight and internal friction angle by using
SLOPEW
129
Figure A16 Failed slope at value 31 of unit weight and internal friction angle by using
SLOPEW
130
A112 Factor of safety values for failed slopes by FLACSLOPE software program
Figure A17 Failed slope at value 25 kNm3 of unit weight by using FLACSLOPE
Figure A18 Failed slope at value 25 of unit weight and internal friction angle by using
FLACSLOPE
131
APPENDIX2
Failure arc possibilities of failed slope by SLOPEW
Figure A21 Failure arc possibilities for the value 17 kNm3 of unit weight
Figure A22 Failure arc possibilities for the value 21 kNm3 of unit weight
132
Figure A23 Failure arc possibilities for the value 31 kNm3 of unit weight
Figure A24 Failure arc possibilities for the value 16 of unit weight and internal friction
angle
133
Figure A25 Failure arc possibilities for the value 21 of unit weight and internal friction
angle
Figure A26 Failure arc possibilities for the value 31 of unit weight and internal friction
angle