Embed Size (px)
Citation preview
International Journal of Architecture, Engineering and ConstructionVol 6, No 1, March 2017, 29-40
Comparative Slope Stability Analysis and Factor of
Safety Evaluation of Gambhar Landslide
R.K. Sharma1,∗, B.S. Mehta1, Pardeep Kumar1 and C.S. Jamwal2
1Civil Engineering Department, National Institute of Technology, Hamirpur, India
2No. 326, Sector 7A, Chandigarh, India
Abstract: Geotechnical studies of major landslides that threaten the traffic flow along National Highways are essential formitigation and to draw a long term plan. There are various methods for analyzing slope stability and the preference was givento simple and logical methods. The type and materials that constitute Gambhar landslide, the choice of adopting Bishop’ssimplified method of slices, circular failure charts (CFCs) incorporating varied ground parameters and computer based softwareGEO5 were used for determining values of factor for safety. The factor of safety derived from three different methods forvaried slope conditions indicate that the slopes were critically stable as the factor of safety relating to these slope failuresare closer to one. For Gambhar slide, all the adopted methods gave nearly identical values with comparatively lower factorof safety values by CFC method. However, factor of safety values computed by GEO5 are very low indicating very unstableslope even on dry slope condition.
Keywords: Slope stability, back analysis, circular failure, factor of safety, Bishop’s method, CFC method, GEO5
DOI: http://dx.doi.org/10.7492/IJAEC.2017.004
1 INTRODUCTION
Constructing and maintaining National Highways (NH) in Hi-malayan region have consistently been a major challenge forthe agencies that are engaged in the maintenance of thesehighways. The disruption of the strategic routes during mon-soon period is inevitable due to the frequent occurrences oflandslides, sometimes stretching for days together. Predic-tion and mitigation of landslide hazards of these terrainsalong with strategic routes traverse, requires detailed studiesof individual terrains unearthing the causative factors respon-sible for triggering landslides. Most of the studies conducted inthe Himalayan region include recognition, analysis and zona-tion of slope instability and landslide inventory. This is beingdone by constructing and superimposition of thematic ma-ps of contributing causative factors manually or by GIS-basedtechniques in the identification of vulnerable or landslide sus-ceptibility zones (Valdiya 1987; Gupta and Joshi 1990; Anbal-agan 1992; Pachauri and Pant 1992; Gupta et al. 1993; Sarkaret al. 1995; Mehrotra et al. 1996; Shroder 1998; Rautela andThakur 1999; Paul et al. 2000; Ghosh et al. 2002; Kanun-go et al. 2006). The detailed studies of individual landslidebased on geotechnical parameters in the Himalayan terrain arevery limited. An attempt has been made to study the Gamb-har landslide in detail for back analysis incorporating differentgeotechnical parameters to ascertain the mechanism, and todetermine the factor of safety adopting two varied techniques
propounded by Bishop (1955), Bishop and Morgenstern (1960)and Janbu (1954); and Hoek and Bray (1981). The classifica-tion and type of landslide in the study area are based on typeof movement and material type proposed by Varnes (1978)and Varnes (1996).
2 METHODOLOGY
The Gambhar landslide can be divided into circular failureof Varnes (1978) and Varnes (1996) in which the failure sur-face is not defined by any preexisting weak plane. To studythis landslide, a combined approach of Bishop’s and Janbu’ssimplified method of slices and simple technique mainly usingthe application of circular failure charts incorporating variedground parameters proposed by Hoek and Bray (1981) wasadopted to determine values of safety factor. In the stabili-ty analysis using circular failure charts, the assumptions onground condition i.e. height and average angle of slope, thecomposition and shear strength characterized by cohesion andangle of friction of the slope forming materials and range ofgroundwater conditions varying from dry slope to completelysaturated slope are made. Besides, the assumption of homoge-neous slope forming materials, a vertical tension crack on theupper surface or in the face of the concerned slope and loca-tion of tension crack and circular failure surface for minimizingfactor of safety have been added.
*Corresponding author. Email: [email protected]
29
Sharma et al./International Journal of Architecture, Engineering and Construction 6 (2017) 29-40
The analytical techniques used for the determination of safe-ty factor by Bishop’s simplified method of slices (Janbu 1954;Bishop 1955; Bishop and Morgenstern 1960) is more accuratecompared to circular failure charts as this method incorpo-rates variation into size parameters of slide as well as its ge-ometry, and can be presented in a systematic and stepwisepattern assuming uniform property of slope forming materialand the plane of failure passing through the toe of slope. Afterthe drawing of actual or designed vertical profile, preferablydrawn on a large scale, defining the geometry of the slope andplane of circular failure the location of critical failure surfaceand critical tension crack on drained and undrained slopes aredetermined by using different graphs (Hoek and Bray 1981) tothe point that the lowest factor of safety value is obtained. InBishop’s (1955) simplified method of slices, the sliding mass isdivided into number of vertical slices minimum to five. Each s-lice should be measured for its tangential angle (α) at the base,the vertical stress on the base of the slice (vertical height, h× unit weight of soil, γ), the uplift water pressure (height ofthe phreatic surface, hw × unit weight of water, γw) and thewidth of slice, ∆x. By defining the slice and shear strengthparameters, the value of X, Y , Z and Q are calculated byapplying:
X =(c′ + (γh− γwhw))∆x
cosα
Y = tanαtanϕ′
Z = γh∆x sinα
Q =12γwz
2α
R
(1)
X is the horizontal distance between the point of rotationcenter of critical circle and point of failure through toe of slope,Y is the vertical distance from the point of failure through toeof slope and the centre of rotation of critical circle, Z is theweight of each slice acting parallel to the slide surface, Q is thewater force, R is the radius of the critical circle and α is thevertical distance from the centre of rotation of critical circleand the water force of slice. An initial estimate of F = 1.00 isused for the solution of factor of safety equation:
F =∑
X/(1 + Y/F )/∑
Z +Q (2)
If the difference between the assumed and calculated factorof safety is greater than 0.001, the calculated ∆x factor ofsafety is used as a second estimate of F for repeat calculationtill the difference between the successive factor of safety valuesis less than 0.001. In this method, sometimes seven iterationcycles may be required to achieve the required result.
3 THE STUDY AREA
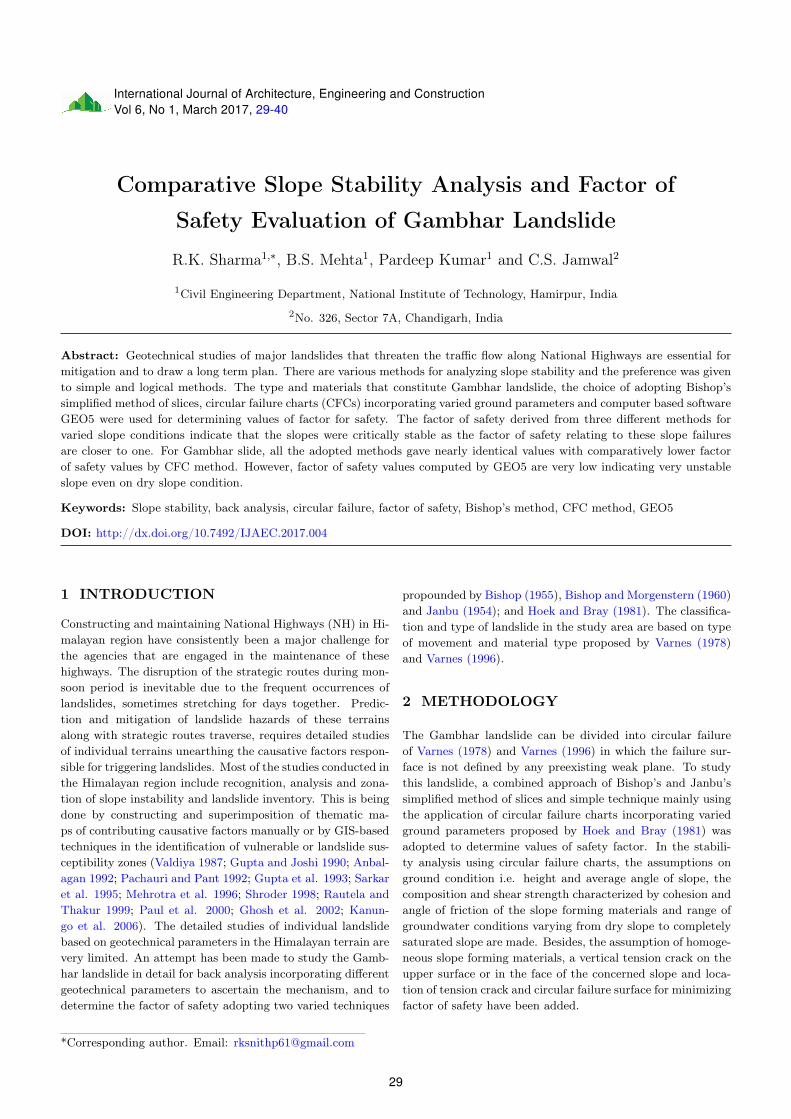
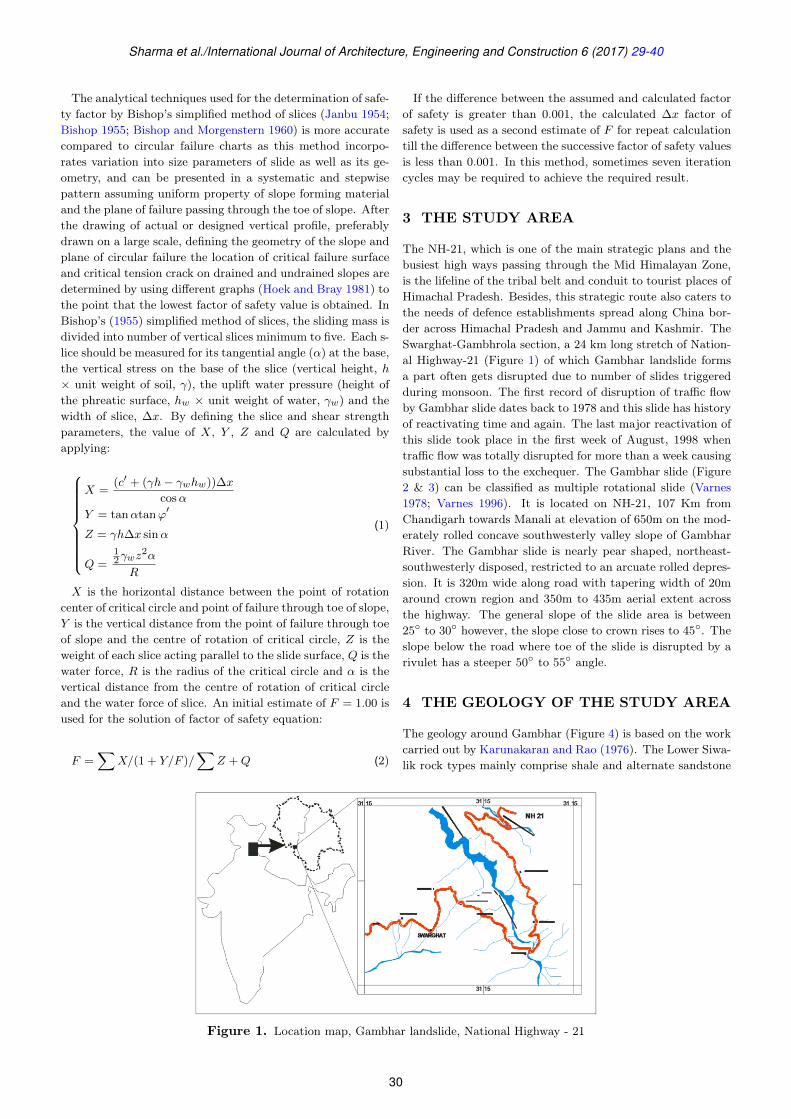
The NH-21, which is one of the main strategic plans and thebusiest high ways passing through the Mid Himalayan Zone,is the lifeline of the tribal belt and conduit to tourist places ofHimachal Pradesh. Besides, this strategic route also caters tothe needs of defence establishments spread along China bor-der across Himachal Pradesh and Jammu and Kashmir. TheSwarghat-Gambhrola section, a 24 km long stretch of Nation-al Highway-21 (Figure 1) of which Gambhar landslide formsa part often gets disrupted due to number of slides triggeredduring monsoon. The first record of disruption of traffic flowby Gambhar slide dates back to 1978 and this slide has historyof reactivating time and again. The last major reactivation ofthis slide took place in the first week of August, 1998 whentraffic flow was totally disrupted for more than a week causingsubstantial loss to the exchequer. The Gambhar slide (Figure2 & 3) can be classified as multiple rotational slide (Varnes1978; Varnes 1996). It is located on NH-21, 107 Km fromChandigarh towards Manali at elevation of 650m on the mod-erately rolled concave southwesterly valley slope of GambharRiver. The Gambhar slide is nearly pear shaped, northeast-southwesterly disposed, restricted to an arcuate rolled depres-sion. It is 320m wide along road with tapering width of 20maround crown region and 350m to 435m aerial extent acrossthe highway. The general slope of the slide area is between25◦ to 30◦ however, the slope close to crown rises to 45◦. Theslope below the road where toe of the slide is disrupted by arivulet has a steeper 50◦ to 55◦ angle.
4 THE GEOLOGY OF THE STUDY AREA
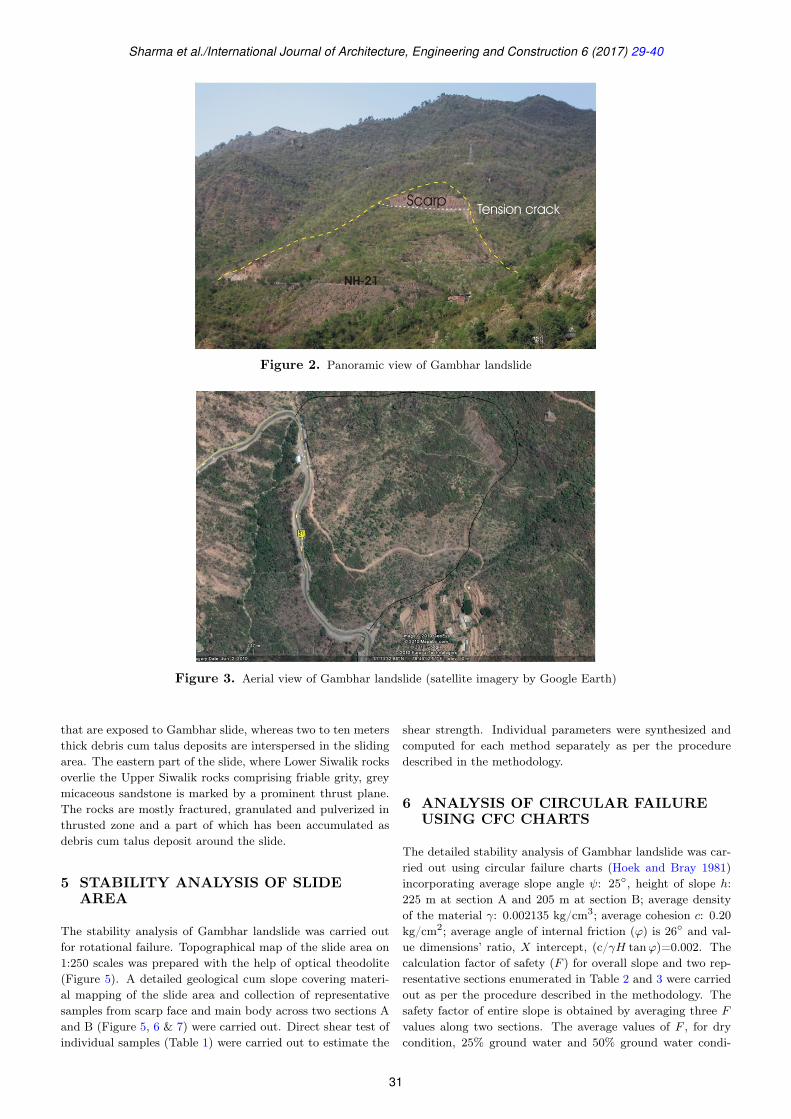
The geology around Gambhar (Figure 4) is based on the workcarried out by Karunakaran and Rao (1976). The Lower Siwa-lik rock types mainly comprise shale and alternate sandstone
Figure 1. Location map, Gambhar landslide, National Highway - 21
30
Sharma et al./International Journal of Architecture, Engineering and Construction 6 (2017) 29-40
Figure 2. Panoramic view of Gambhar landslide
Figure 3. Aerial view of Gambhar landslide (satellite imagery by Google Earth)
that are exposed to Gambhar slide, whereas two to ten metersthick debris cum talus deposits are interspersed in the slidingarea. The eastern part of the slide, where Lower Siwalik rocksoverlie the Upper Siwalik rocks comprising friable grity, greymicaceous sandstone is marked by a prominent thrust plane.The rocks are mostly fractured, granulated and pulverized inthrusted zone and a part of which has been accumulated asdebris cum talus deposit around the slide.
5 STABILITY ANALYSIS OF SLIDEAREA
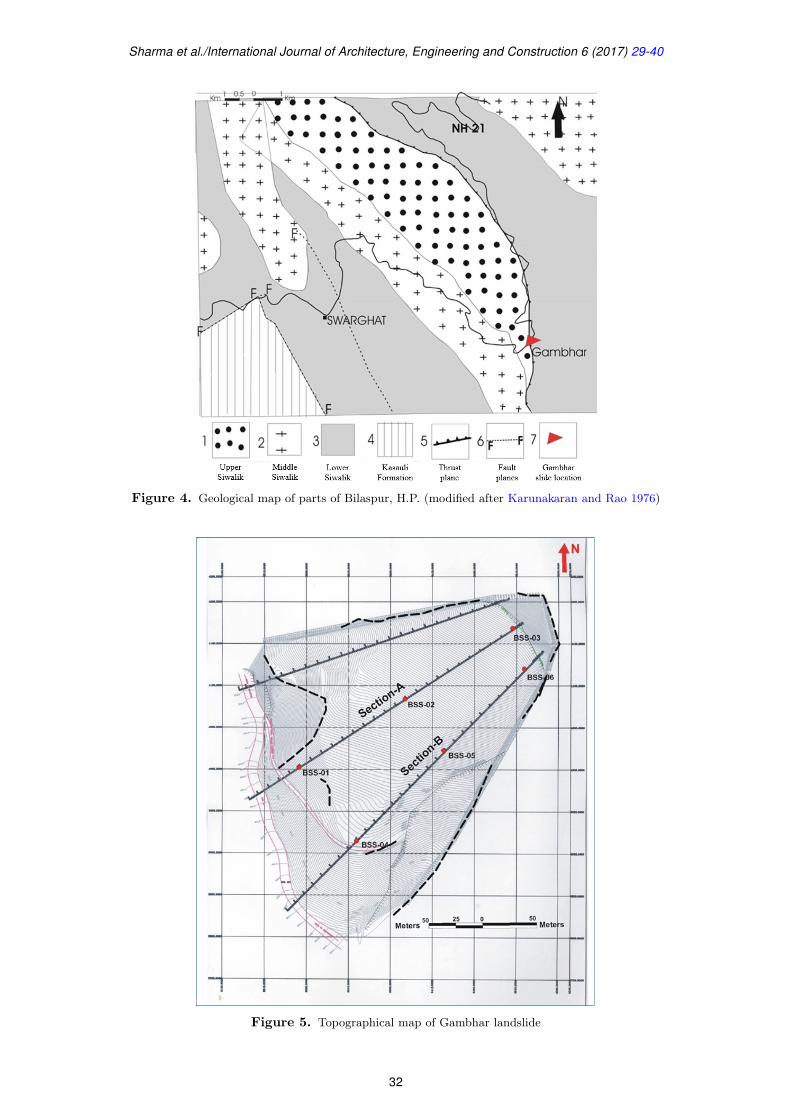
The stability analysis of Gambhar landslide was carried outfor rotational failure. Topographical map of the slide area on1:250 scales was prepared with the help of optical theodolite(Figure 5). A detailed geological cum slope covering materi-al mapping of the slide area and collection of representativesamples from scarp face and main body across two sections Aand B (Figure 5, 6 & 7) were carried out. Direct shear test ofindividual samples (Table 1) were carried out to estimate the
shear strength. Individual parameters were synthesized andcomputed for each method separately as per the proceduredescribed in the methodology.
6 ANALYSIS OF CIRCULAR FAILUREUSING CFC CHARTS
The detailed stability analysis of Gambhar landslide was car-ried out using circular failure charts (Hoek and Bray 1981)incorporating average slope angle ψ: 25◦, height of slope h:225 m at section A and 205 m at section B; average densityof the material γ: 0.002135 kg/cm3; average cohesion c: 0.20kg/cm2; average angle of internal friction (ϕ) is 26◦ and val-ue dimensions’ ratio, X intercept, (c/γH tanϕ)=0.002. Thecalculation factor of safety (F ) for overall slope and two rep-resentative sections enumerated in Table 2 and 3 were carriedout as per the procedure described in the methodology. Thesafety factor of entire slope is obtained by averaging three Fvalues along two sections. The average values of F , for drycondition, 25% ground water and 50% ground water condi-
31
Sharma et al./International Journal of Architecture, Engineering and Construction 6 (2017) 29-40
Figure 4. Geological map of parts of Bilaspur, H.P. (modified after Karunakaran and Rao 1976)
Figure 5. Topographical map of Gambhar landslide
32

Sharma et al./International Journal of Architecture, Engineering and Construction 6 (2017) 29-40
Figure 6. Slope profile of Gambhar landslide along section A
Figure 7. Slope profile of Gambhar landslide along section B
Table 1. Shear strength parameters determined using direct shear test
Sample Moisturecontent (%)
Peak shearstress at normalload=0.5kg/cm2
Peak shearstress at normalload=1.0kg/cm2
Peak shearstress at normalload=1.5kg/cm2
Peak shearstress at normalload=2.0kg/cm2
Cohesion(c)kg/cm2
Angle ofinternal
friction (θ◦)BSS01/a 6.3 0.38 0.7 1 1.3 0.09 26BSS02/a 6.2 0.38 0.64 0.92 1.2 0.1 26BSS03/a 6.2 0.37 0.78 1.1 1.38 0.2 24BSS04/b 6.3 0.4 0.75 1.08 1.4 0.19 26BSS05/b 6.3 0.37 0.65 0.94 1.37 0.18 26BSS06/b 6.7 0.51 0.84 1.2 1.59 0.23 24
33
Sharma et al./International Journal of Architecture, Engineering and Construction 6 (2017) 29-40
tions are 0.88, 0.71 and 0.62 respectively. The factor of safetylower than 1 in dry condition indicates that the slope is notcritically stable and can become unstable on getting saturatedduring the rainy seasons and can fail repeatedly.
7 ANALYTICAL ANALYSIS OFCIRCULAR FAILURE USING BISHOP’SSIMPLIFIED METHOD OF SLICES
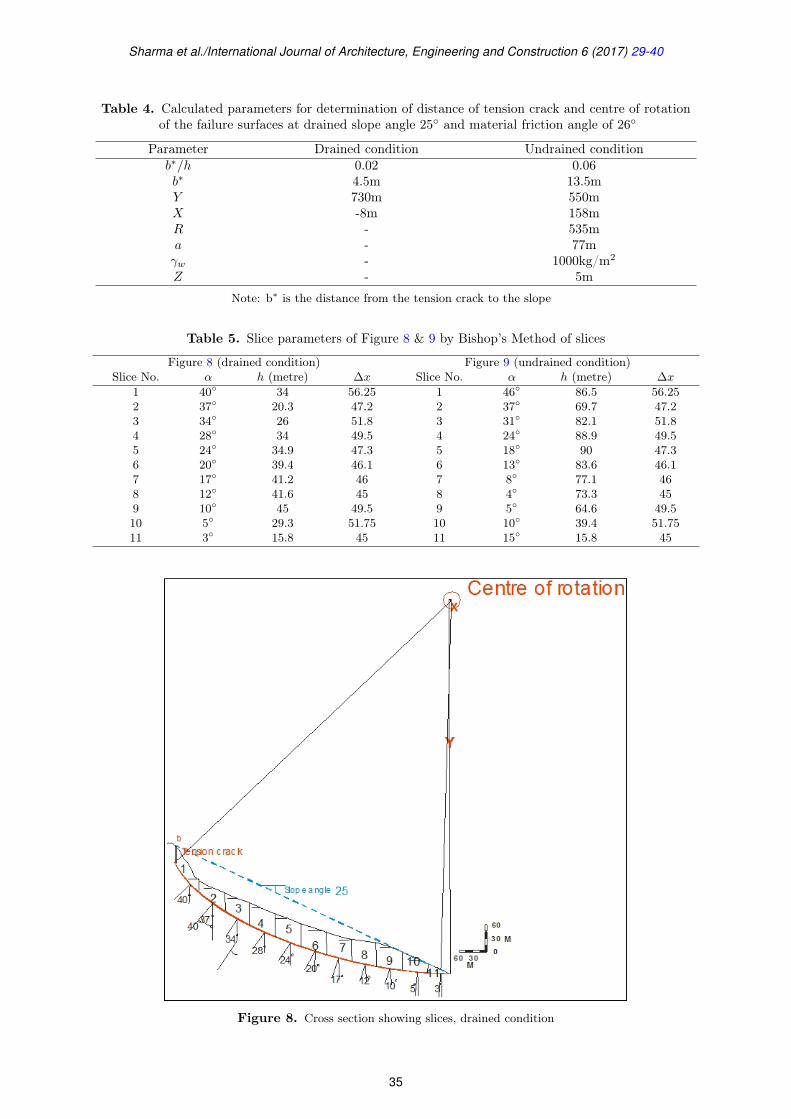
Bishop’s simplified method of slices (Bishop 1955) was usedfor calculation of safety factor taking into consideration thefollowing parameters; slope material: clay, silt and sand dom-inated with 20% to 32% boulder-gravel; average slope angle ψ:25◦; height of slope h: 225 m; average density of the materi-al: 2.135 g/cc; average cohesion (c) 0.20 kg/cm2 and averageangle of internal friction (ϕ) 26◦ the distance of the tensioncracks (b) and centre of rotation of the critical failure sur-faces (X and Y coordinate values) for drained condition andundrained condition with assumed 5m ground water table)were determined (Table 4).
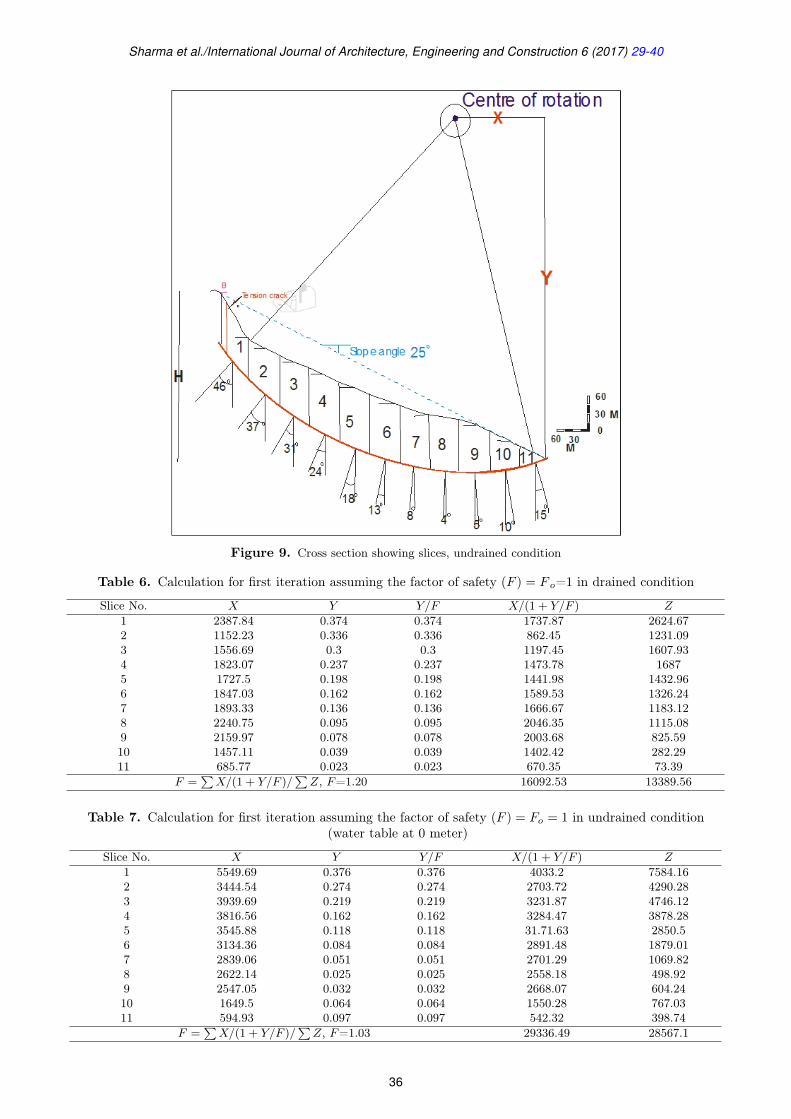
By applying the determined parameters from Table 5 crosssections (Figure 8 & 9) of the drained slope with eleven sliceswere drawn. Evaluation of angle of tangent drawn at centrepoint of base (α) height (h) and thickness (∆x) of the individ-ual slice for drained condition and undrained condition (Table5) were derived from Figure 8 and Figure 9 respectively.
The computed values of each slice from Table 5 are a-gain recalculated for the computation of X, Y and Z asper the formulae described in the methodology. The cal-culated values of these parameters enumerated in Table 6and 7 were re-synthesized, followed by the formula F =∑X/(1 + Y/F )/
∑Z to calculate factor of safety after as-
suming F=1 (or Fo) for the first iteration. After 4th it-eration, when the difference between the assumed and theactual Factor of safety came to 0.001 (Table 8), the val-ue of F (=1.236) was satisfactorily considered as the actu-al F value for the entire slope in drained condition. Af-ter first iteration, (Table 9) the value of safety factor (F=1.02) calculated for undrained condition where the water ta-
ble was assumed at 0 m level. While putting the value ofQ = 1/2γwz
2α/R; R = 535m; α = 77m and γw = 1000kg/m3
derived from calculated and determined parameters on the for-mula F =
∑X/(1 + Y/F )/
∑Z+Q, the factor of safety F =
0.95 was obtained for the slope with water table depth (z) =5m. The lower value of factor of safety in undrained conditionmay be due to the emergence of sub-surface water (phreaticsurface) in form of spring at two different points across theroad section encircling the toe area. The values very close to1 indicate that the slope is critically stable and can becomeunstable with slight increase in percentage of saturation espe-cially during monsoon.
8 ANALYTICAL ANALYSIS USINGSOFTWARE GEO5
Two sections of the Gambhar slide across section A and B wereconsidered for slope stability analysis using software GEO5.After feeding the different physical attributes of slope formingmaterial as well as slope of the Gambhar slide, the geometryof two sections (Figure 10) was generated.
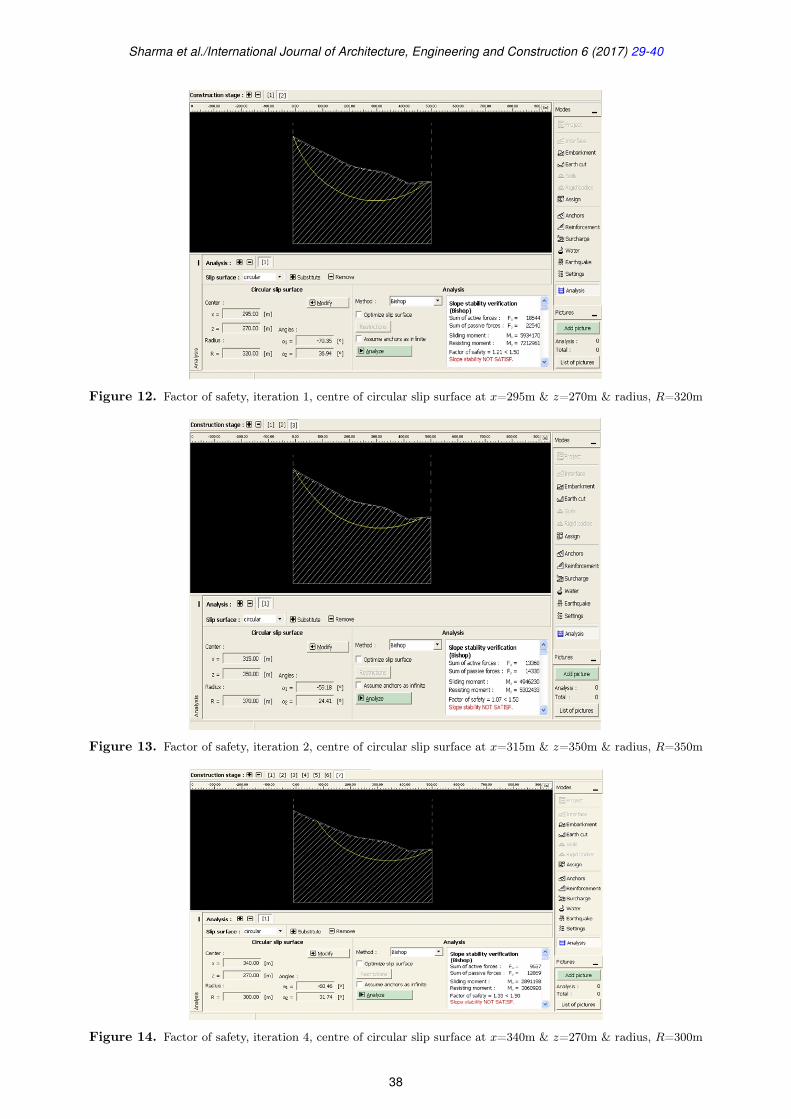
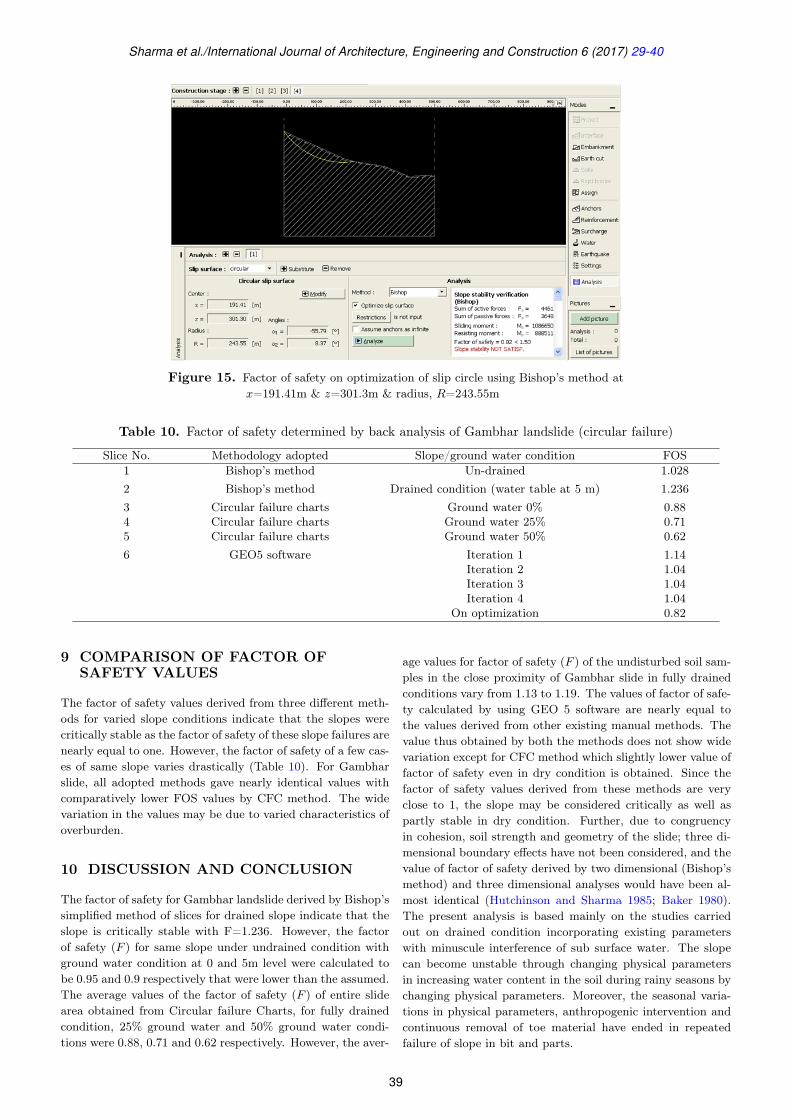
Another section (Figure 11) was generated first by addingphysical parameters of soil, and later incorporating water ta-ble at a depth 5m below the ground surface. Factor of safetyFOS=1.21 (Figure 12) was obtained on iteration: 1, whencentre of circular slip surface at x=295m and z=270m andradius R=320m. On iteration 2, when centre of circular slipsurface at x=315m, z=350m and radius R=350m (Figure 13),FOS=1.07 was derived. So on iteration 3 FOS was 1.06 andon iteration 4, FOS=1.33 was obtained when centre of circu-lar slip surface was at x=340m, z=270m and radius R=300m(Figure 14). FOS=0.82, was obtained on optimization of slipcircle at x=191.41m, z=301.3m and radius R= 243.55m (Fig-ure 15). Same procedure was adopted for determination offactor of safety across section B. On four successive iterationsFOS=1.14, 1.04, 1.04 and 1.04 for iteration: 1, iteration: 2,iteration: 3 and iteration: 4 respectively were obtained for thesection B. Besides, FOS=0.82 was obtained on optimizationof slip circle.
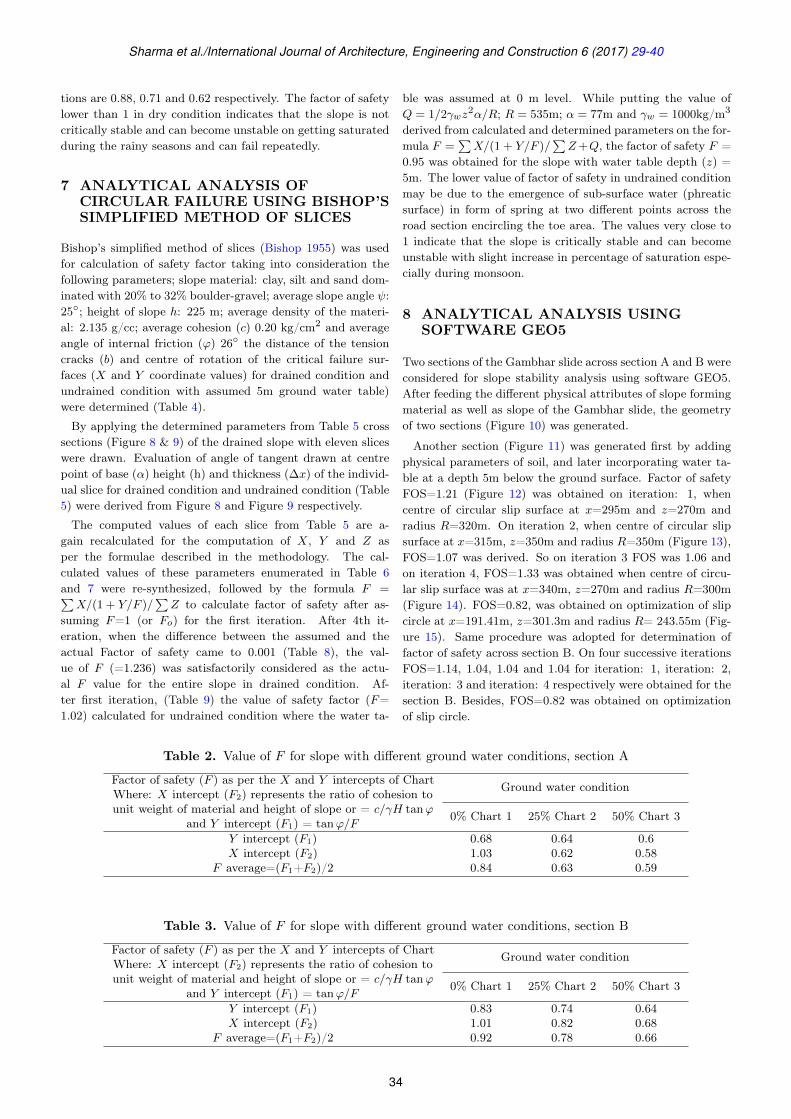
Table 2. Value of F for slope with different ground water conditions, section A
Factor of safety (F ) as per the X and Y intercepts of ChartWhere: X intercept (F2) represents the ratio of cohesion tounit weight of material and height of slope or = c/γH tanϕ
and Y intercept (F1) = tanϕ/F
Ground water condition
0% Chart 1 25% Chart 2 50% Chart 3
Y intercept (F1) 0.68 0.64 0.6X intercept (F2) 1.03 0.62 0.58
F average=(F1+F2)/2 0.84 0.63 0.59
Table 3. Value of F for slope with different ground water conditions, section B
Factor of safety (F ) as per the X and Y intercepts of ChartWhere: X intercept (F2) represents the ratio of cohesion tounit weight of material and height of slope or = c/γH tanϕ
and Y intercept (F1) = tanϕ/F
Ground water condition
0% Chart 1 25% Chart 2 50% Chart 3
Y intercept (F1) 0.83 0.74 0.64X intercept (F2) 1.01 0.82 0.68
F average=(F1+F2)/2 0.92 0.78 0.66
34
Sharma et al./International Journal of Architecture, Engineering and Construction 6 (2017) 29-40
Table 4. Calculated parameters for determination of distance of tension crack and centre of rotationof the failure surfaces at drained slope angle 25◦ and material friction angle of 26◦
Parameter Drained condition Undrained conditionb∗/h 0.02 0.06b∗ 4.5m 13.5mY 730m 550mX -8m 158mR - 535ma - 77mγw - 1000kg/m2
Z - 5m
Note: b∗ is the distance from the tension crack to the slope
Table 5. Slice parameters of Figure 8 & 9 by Bishop’s Method of slices
Figure 8 (drained condition) Figure 9 (undrained condition)Slice No. α h (metre) ∆x Slice No. α h (metre) ∆x
1 40◦ 34 56.25 1 46◦ 86.5 56.252 37◦ 20.3 47.2 2 37◦ 69.7 47.23 34◦ 26 51.8 3 31◦ 82.1 51.84 28◦ 34 49.5 4 24◦ 88.9 49.55 24◦ 34.9 47.3 5 18◦ 90 47.36 20◦ 39.4 46.1 6 13◦ 83.6 46.17 17◦ 41.2 46 7 8◦ 77.1 468 12◦ 41.6 45 8 4◦ 73.3 459 10◦ 45 49.5 9 5◦ 64.6 49.510 5◦ 29.3 51.75 10 10◦ 39.4 51.7511 3◦ 15.8 45 11 15◦ 15.8 45
Figure 8. Cross section showing slices, drained condition
35
Sharma et al./International Journal of Architecture, Engineering and Construction 6 (2017) 29-40
Figure 9. Cross section showing slices, undrained condition
Table 6. Calculation for first iteration assuming the factor of safety (F ) = F o=1 in drained condition
Slice No. X Y Y/F X/(1 + Y/F ) Z
1 2387.84 0.374 0.374 1737.87 2624.672 1152.23 0.336 0.336 862.45 1231.093 1556.69 0.3 0.3 1197.45 1607.934 1823.07 0.237 0.237 1473.78 16875 1727.5 0.198 0.198 1441.98 1432.966 1847.03 0.162 0.162 1589.53 1326.247 1893.33 0.136 0.136 1666.67 1183.128 2240.75 0.095 0.095 2046.35 1115.089 2159.97 0.078 0.078 2003.68 825.5910 1457.11 0.039 0.039 1402.42 282.2911 685.77 0.023 0.023 670.35 73.39
F =∑X/(1 + Y/F )/
∑Z, F=1.20 16092.53 13389.56
Table 7. Calculation for first iteration assuming the factor of safety (F ) = Fo = 1 in undrained condition(water table at 0 meter)
Slice No. X Y Y/F X/(1 + Y/F ) Z
1 5549.69 0.376 0.376 4033.2 7584.162 3444.54 0.274 0.274 2703.72 4290.283 3939.69 0.219 0.219 3231.87 4746.124 3816.56 0.162 0.162 3284.47 3878.285 3545.88 0.118 0.118 31.71.63 2850.56 3134.36 0.084 0.084 2891.48 1879.017 2839.06 0.051 0.051 2701.29 1069.828 2622.14 0.025 0.025 2558.18 498.929 2547.05 0.032 0.032 2668.07 604.2410 1649.5 0.064 0.064 1550.28 767.0311 594.93 0.097 0.097 542.32 398.74
F =∑X/(1 + Y/F )/
∑Z, F=1.03 29336.49 28567.1
36

Sharma et al./International Journal of Architecture, Engineering and Construction 6 (2017) 29-40
Table 8. Iteration stages and F values with error percentage for drained slope Gambhar landslide
Assumed value of F for 1st iteration = 1 Iteration stages1st 2nd 3rd 4th
Actual value of F after nth iteration 1.2 1.23 1.235 1.236Difference: Fn − Fn−1 (n=1 to 4) 0.2 0.03 0.005 0.001Error percentage 16.6 2.44 0.4 0.08
Table 9. Iteration stages and F values with error percentage for un-drained slope ofGambhar landslide (water table at 0 meter)
Assumed value of F for 1st iteration = 1 Iteration stages1st 2nd 3rd 4th
Actual value of F after nth iteration 1.02 1. 025 1.027 1.028Difference: Fn − Fn−1 (n=1 to 4) 0.02 0.005 0.002 0.001Error percentage 2.91 0.48 0.19 0.09
Figure 10. Slope stability analysis after generating geometry of section-A of Gambhar landslide using GEO5
Figure 11. Slope stability analysis after addition of soil properties and incorporating water table at depth5m below the ground surface - section-A of Gambhar landslide using GEO5
37
Sharma et al./International Journal of Architecture, Engineering and Construction 6 (2017) 29-40
Figure 12. Factor of safety, iteration 1, centre of circular slip surface at x=295m & z=270m & radius, R=320m
Figure 13. Factor of safety, iteration 2, centre of circular slip surface at x=315m & z=350m & radius, R=350m
Figure 14. Factor of safety, iteration 4, centre of circular slip surface at x=340m & z=270m & radius, R=300m
38
Sharma et al./International Journal of Architecture, Engineering and Construction 6 (2017) 29-40
Figure 15. Factor of safety on optimization of slip circle using Bishop’s method atx=191.41m & z=301.3m & radius, R=243.55m
Table 10. Factor of safety determined by back analysis of Gambhar landslide (circular failure)
Slice No. Methodology adopted Slope/ground water condition FOS1 Bishop’s method Un-drained 1.0282 Bishop’s method Drained condition (water table at 5 m) 1.2363 Circular failure charts Ground water 0% 0.884 Circular failure charts Ground water 25% 0.715 Circular failure charts Ground water 50% 0.626 GEO5 software Iteration 1 1.14
Iteration 2 1.04Iteration 3 1.04Iteration 4 1.04
On optimization 0.82
9 COMPARISON OF FACTOR OFSAFETY VALUES
The factor of safety values derived from three different meth-ods for varied slope conditions indicate that the slopes werecritically stable as the factor of safety of these slope failures arenearly equal to one. However, the factor of safety of a few cas-es of same slope varies drastically (Table 10). For Gambharslide, all adopted methods gave nearly identical values withcomparatively lower FOS values by CFC method. The widevariation in the values may be due to varied characteristics ofoverburden.
10 DISCUSSION AND CONCLUSION
The factor of safety for Gambhar landslide derived by Bishop’ssimplified method of slices for drained slope indicate that theslope is critically stable with F=1.236. However, the factorof safety (F ) for same slope under undrained condition withground water condition at 0 and 5m level were calculated tobe 0.95 and 0.9 respectively that were lower than the assumed.The average values of the factor of safety (F ) of entire slidearea obtained from Circular failure Charts, for fully drainedcondition, 25% ground water and 50% ground water condi-tions were 0.88, 0.71 and 0.62 respectively. However, the aver-
age values for factor of safety (F ) of the undisturbed soil sam-ples in the close proximity of Gambhar slide in fully drainedconditions vary from 1.13 to 1.19. The values of factor of safe-ty calculated by using GEO 5 software are nearly equal tothe values derived from other existing manual methods. Thevalue thus obtained by both the methods does not show widevariation except for CFC method which slightly lower value offactor of safety even in dry condition is obtained. Since thefactor of safety values derived from these methods are veryclose to 1, the slope may be considered critically as well aspartly stable in dry condition. Further, due to congruencyin cohesion, soil strength and geometry of the slide; three di-mensional boundary effects have not been considered, and thevalue of factor of safety derived by two dimensional (Bishop’smethod) and three dimensional analyses would have been al-most identical (Hutchinson and Sharma 1985; Baker 1980).The present analysis is based mainly on the studies carriedout on drained condition incorporating existing parameterswith minuscule interference of sub surface water. The slopecan become unstable through changing physical parametersin increasing water content in the soil during rainy seasons bychanging physical parameters. Moreover, the seasonal varia-tions in physical parameters, anthropogenic intervention andcontinuous removal of toe material have ended in repeatedfailure of slope in bit and parts.
39
Sharma et al./International Journal of Architecture, Engineering and Construction 6 (2017) 29-40
REFERENCES
Anbalagan, R. (1992). “Landslide hazard evaluation and zona-tion mapping in mountainous terrain.” Engineering Geology,32(4), 269–277.
Baker, R. (1980). “Determination of the critical slip surfacein slope stability computations.” International Journal forNumerical and Analytical Methods in Geomechanics, 4(4),333–359.
Bishop, A. and Morgenstern, N. (1960). “Stability coefficientsfor earth slopes.” Geotechnique, 10(4), 129–153.
Bishop, A. W. (1955). “The use of the slip circle in the stabilityanalysis of slopes.” Geotechnique, 5(1), 7–17.
Ghosh, S., Paul, C., Sarkar, N., and Bhattacharya, A. (2002).“Geotechnical evaluation of Lanta Khola debris flow onNorth Sikkim Highway, North District, Sikkim, an area forfuture site-specific deterministic probing.” Engineering Ge-ology, 29, 141–147.
Gupta, R. and Joshi, B. (1990). “Landslide hazard zoning us-ing the gis approach - a case study from the Ramgangacatchment, Himalayas.” Engineering Geology, 28(1-2), 119–131.
Gupta, V., Sah, M., Virdi, N., and Bartarya, S. (1993). “Land-slide hazard zonation in the upper Satlej valley, DistrictKinnaur, Himachal Pradesh.” Journal of Himalayan Geolo-gy, 4(1), 81–93.
Hoek, E. and Bray, J. D. (1981). Rock Slope Engineering. CRCPress, Boca Raton, United States.
Hutchinson, J. and Sharma, S. (1985). “Discussion of three-dimension limit equilibrium analysis of slope.” Geotech-nique, 35(2), 215–216.
Janbu, N. (1954). “Stability analysis of slopes with dimension-less parameters.” Harvard Soil Mechanics Series, 46, 81.
Kanungo, D., Arora, M., Sarkar, S., and Gupta, R. (2006). “Acomparative study of conventional, ANN black box, fuzzy
and combined neural and fuzzy weighting procedures forlandslide susceptibility zonation in Darjeeling Himalayas.”Engineering Geology, 85(3), 347–366.
Karunakaran, C. and Rao, A. R. (1976). Status of explorationfor hydro-carbon in Himalayan region: Contribution to s-tratigraphy and structure. Hind Law House, Maharashtra,India.
Mehrotra, G., Sarkar, S., Kanungo, D., and Mahadevaiah, K.(1996). “Terrain analysis and spatial assessment of landslidehazards in parts of Sikkim Himalaya.” Geological Society ofIndia, 47(4), 491–498.
Pachauri, A. and Pant, M. (1992). “Landslide hazard map-ping based on geological attributes.” Engineering Geology,32(1-2), 81–100.
Paul, S., Bartarya, S., Rautela, P., and Mahajan, A. (2000).“Catastrophic mass movement of 1998 monsoons at Malpain Kali valley, Kumaun Himalaya (India).” Geomorphology,35(3), 169–180.
Rautela, P. and Thakur, V. (1999). “Landslide hazard Zona-tion in Kaliganga and Madhyamaheshwar valleys of Garhw-al Himalaya: A GIS based approach.” Himalayan Geology,20(2), 31–44.
Sarkar, S., Kanungo, D., and Mehrotra, G. (1995). “Landslidehazard zonation: A case study in Garhwal Himalaya, India.”Mountain Research and Development, 15(4), 301–309.
Shroder, J. F. (1998). “Slope failure and denudation in thewestern Himalaya.” Geomorphology, 26(1), 81–105.
Valdiya, K. S. (1987). Environmental geology, Indian context.Tata McGraw-Hill, New Delhi, India.
Varnes, D. J. (1978). “Slope movement types and processes.”Transportation Research Board Special Report, 176, 11–13.
Varnes, D. J. (1996). “Landslide types and processes.” Land-slides: Investigation and mitigation : Special Report 247,Transportation Research Board, Washington, D.C., UnitedStates.
40