Embed Size (px)
Citation preview

MMACROECONOMYACROECONOMY ANDAND
SSTOCKS TOCKS
Portfolio Management
Ali Nejadmalayeri
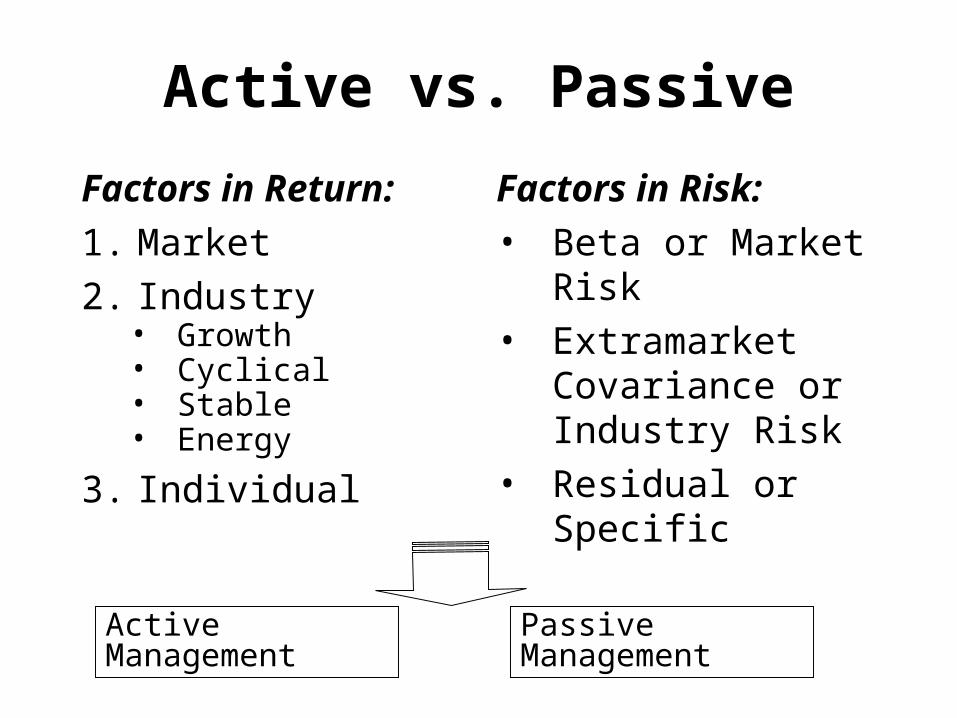
Active vs. Passive
Factors in Return:
1. Market
2. Industry• Growth• Cyclical• Stable• Energy
3. Individual
Factors in Risk:• Beta or Market Risk• Extramarket
Covariance or Industry Risk
• Residual or Specific
Active Management Passive Management
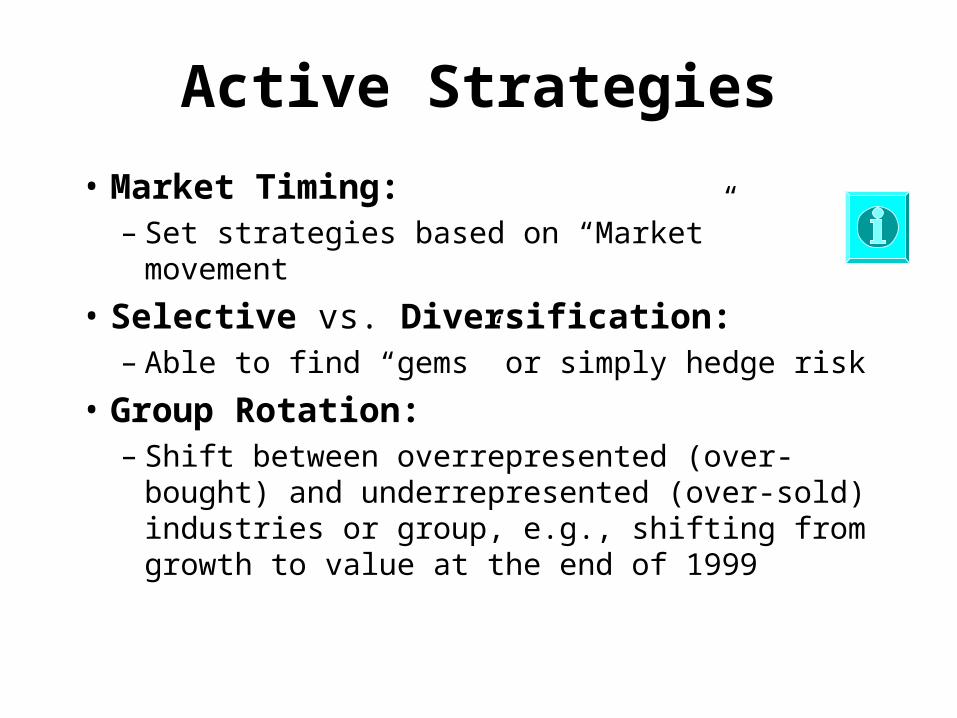
Active Strategies
• Market Timing:– Set strategies based on “Market” movement
• Selective vs. Diversification:– Able to find “gems” or simply hedge risk
• Group Rotation:– Shift between overrepresented (over-bought)
and underrepresented (over-sold) industries or group, e.g., shifting from growth to value at the end of 1999
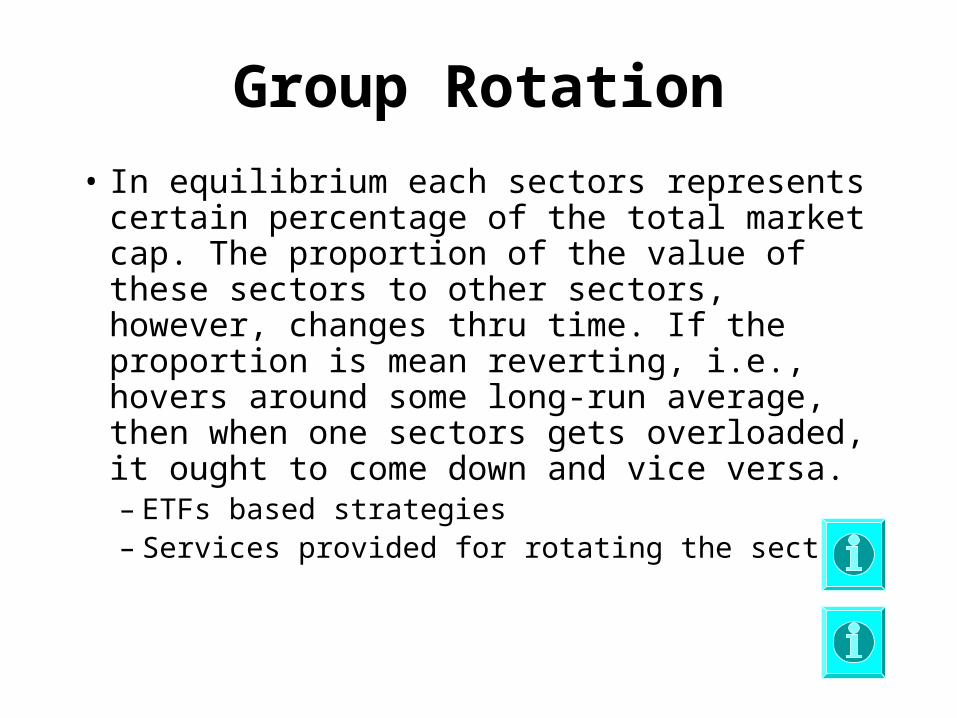
Group Rotation
• In equilibrium each sectors represents certain percentage of the total market cap. The proportion of the value of these sectors to other sectors, however, changes thru time. If the proportion is mean reverting, i.e., hovers around some long-run average, then when one sectors gets overloaded, it ought to come down and vice versa.– ETFs based strategies– Services provided for rotating the sectors
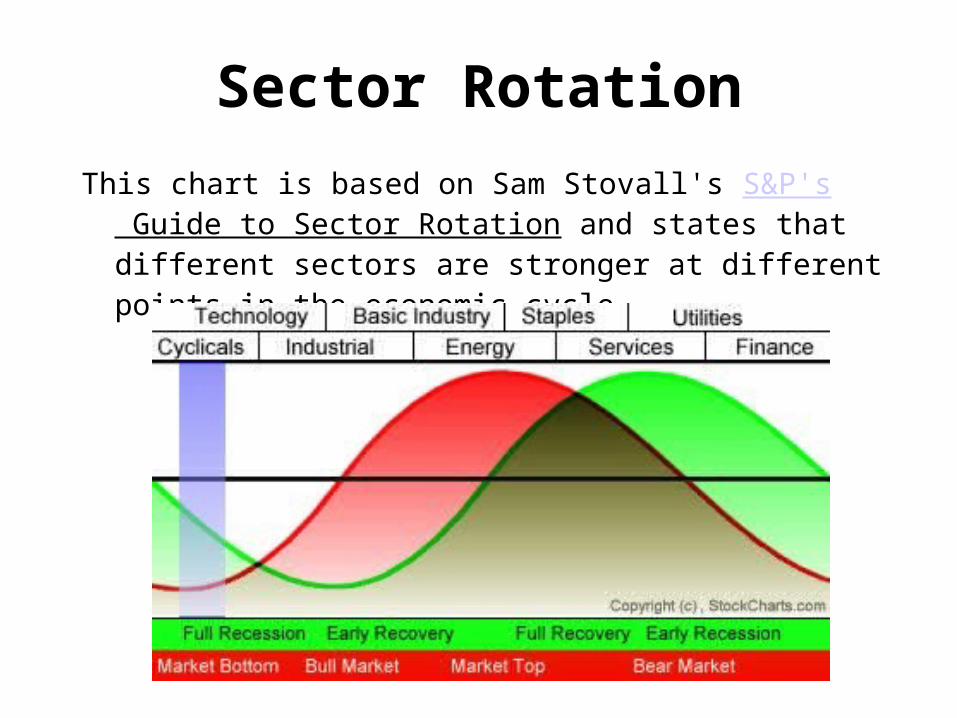
Sector Rotation
This chart is based on Sam Stovall's S&P's Guide to Sector Rotation and states that different sectors are stronger at different points in the economic cycle.
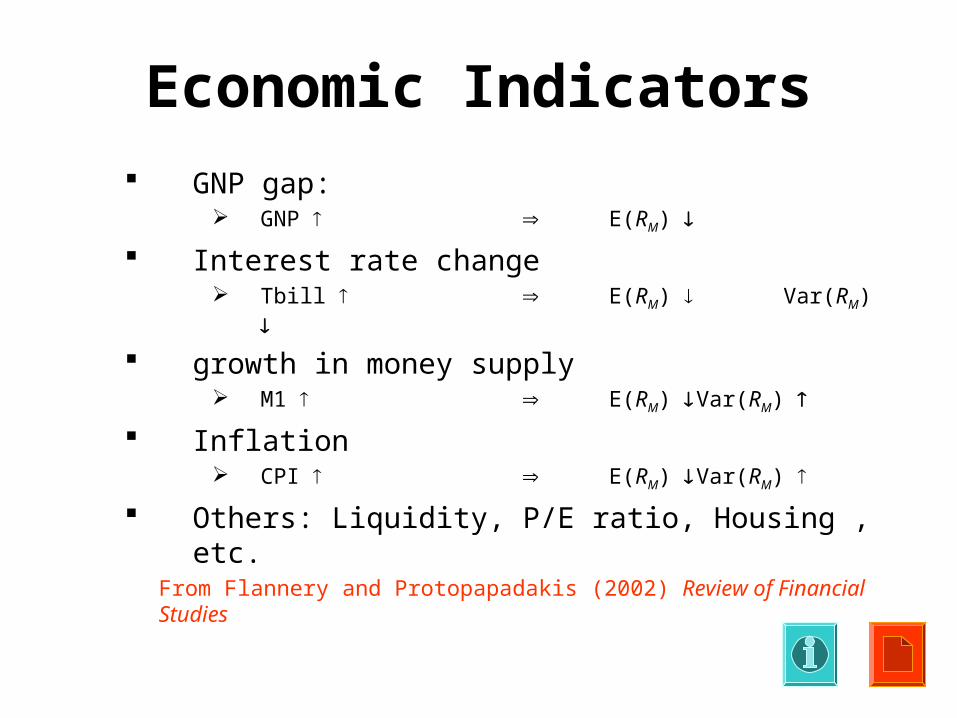
Economic Indicators
GNP gap: GNP E(RM)
Interest rate change Tbill E(RM)
Var(RM)
growth in money supply M1 E(RM)
Var(RM)
Inflation CPI E(RM)
Var(RM)
Others: Liquidity, P/E ratio, Housing , etc.From Flannery and Protopapadakis (2002) Review of Financial Studies
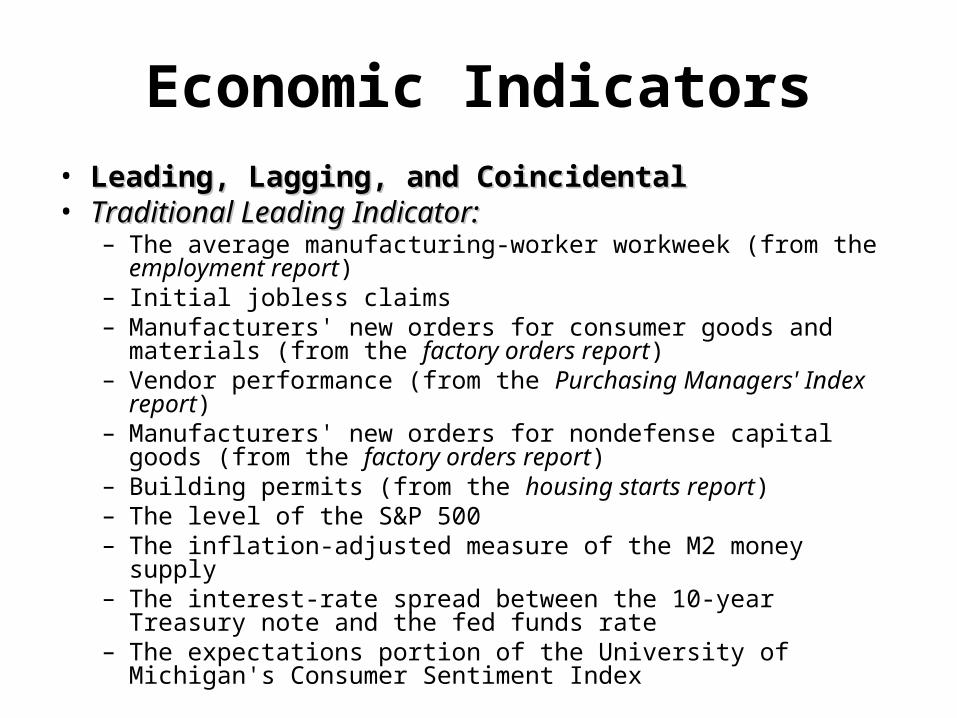
Economic Indicators• Leading, Lagging, and CoincidentalLeading, Lagging, and Coincidental• Traditional Leading Indicator:Traditional Leading Indicator:
– The average manufacturing-worker workweek (from the employment report)
– Initial jobless claims – Manufacturers' new orders for consumer goods and materials (from
the factory orders report) – Vendor performance (from the Purchasing Managers' Index report) – Manufacturers' new orders for nondefense capital goods (from the
factory orders report) – Building permits (from the housing starts report) – The level of the S&P 500 – The inflation-adjusted measure of the M2 money supply – The interest-rate spread between the 10-year Treasury note and the
fed funds rate – The expectations portion of the University of Michigan's Consumer
Sentiment Index
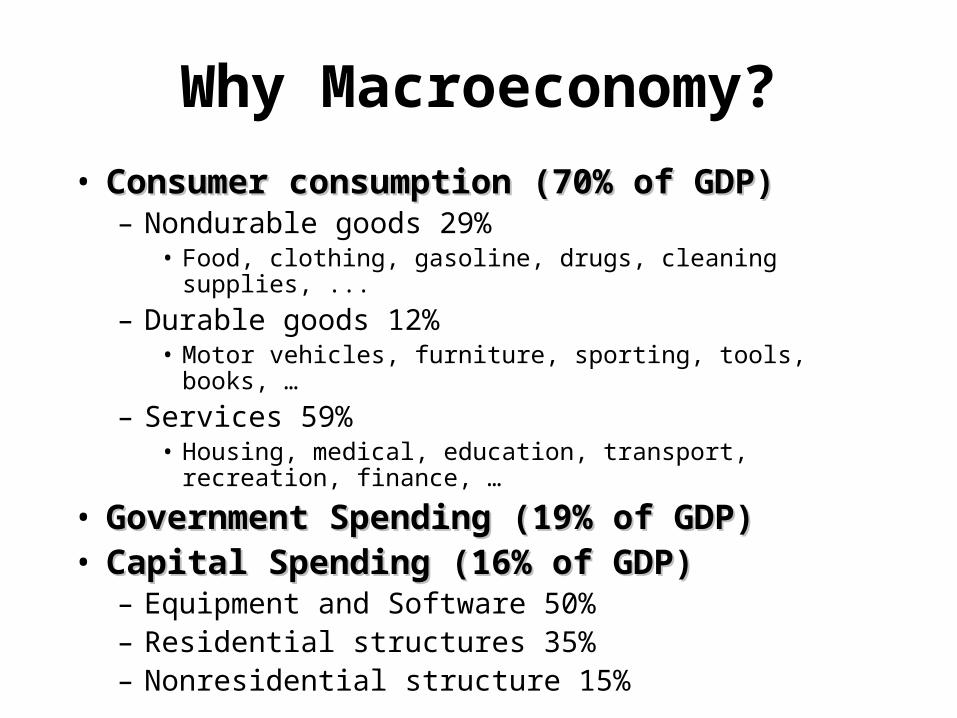
Why Macroeconomy?
• Consumer consumption (70% of GDP)Consumer consumption (70% of GDP)– Nondurable goods 29%
• Food, clothing, gasoline, drugs, cleaning supplies, ...
– Durable goods 12%• Motor vehicles, furniture, sporting, tools, books, …
– Services 59%• Housing, medical, education, transport, recreation, finance, …
• Government Spending (19% of GDP)Government Spending (19% of GDP)• Capital Spending (16% of GDP)Capital Spending (16% of GDP)
– Equipment and Software 50%– Residential structures 35%– Nonresidential structure 15%
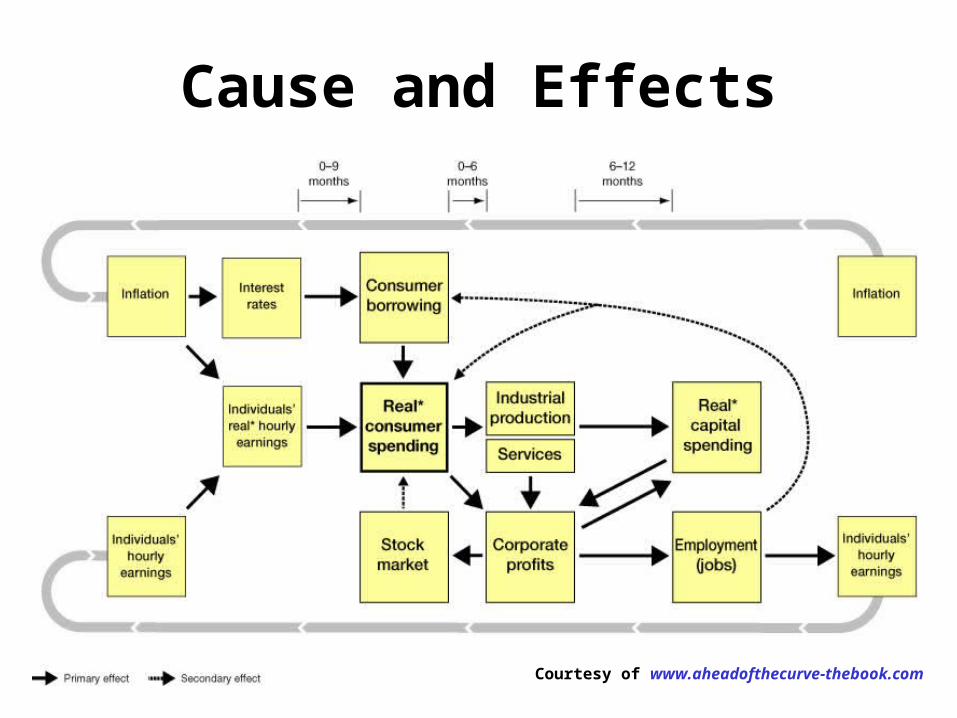
Cause and Effects
Courtesy of www.aheadofthecurve-thebook.com
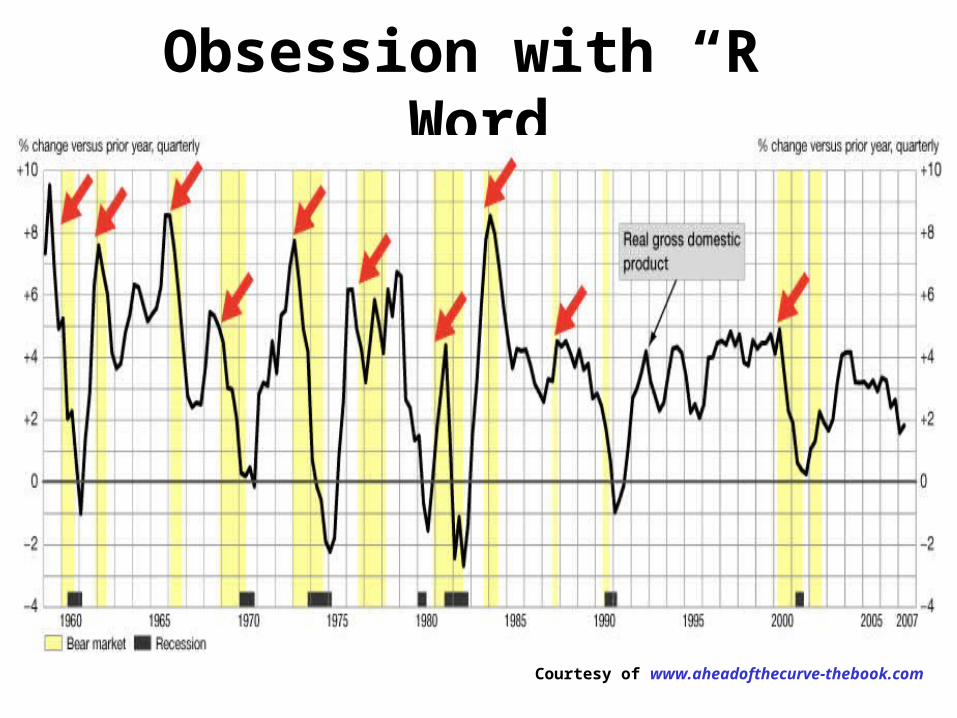
Obsession with “R” Word
Courtesy of www.aheadofthecurve-thebook.com
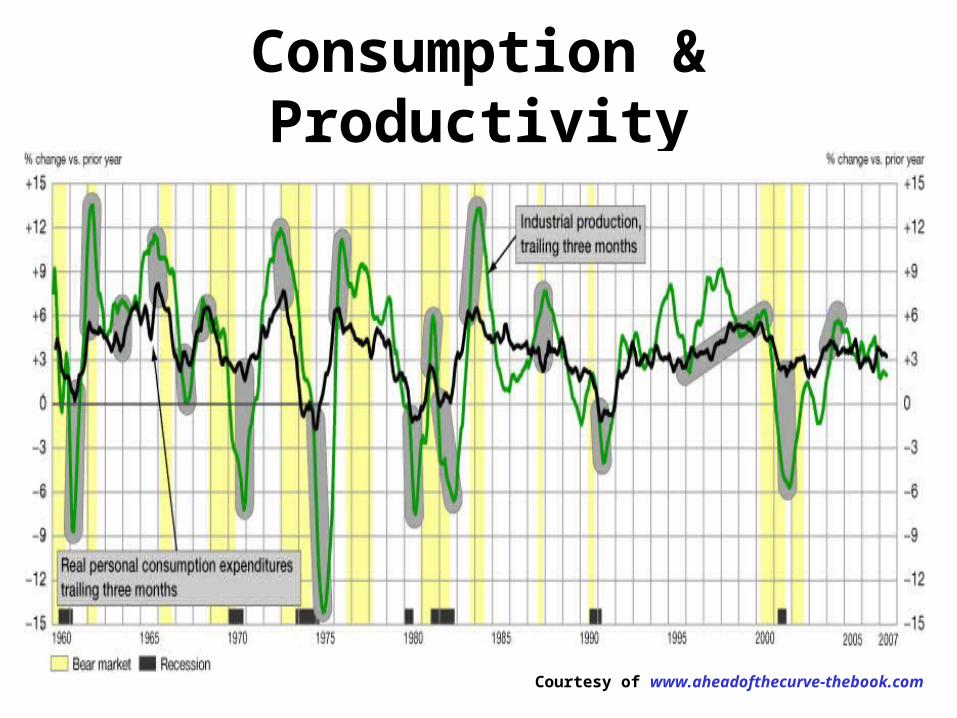
Consumption & Productivity
Courtesy of www.aheadofthecurve-thebook.com
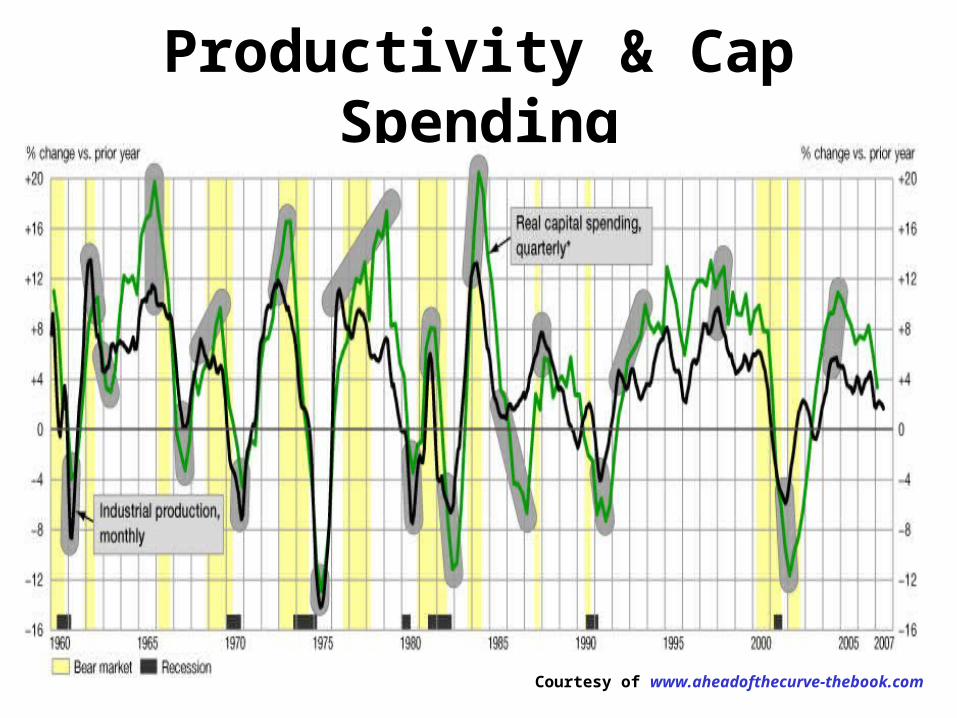
Productivity & Cap Spending
Courtesy of www.aheadofthecurve-thebook.com
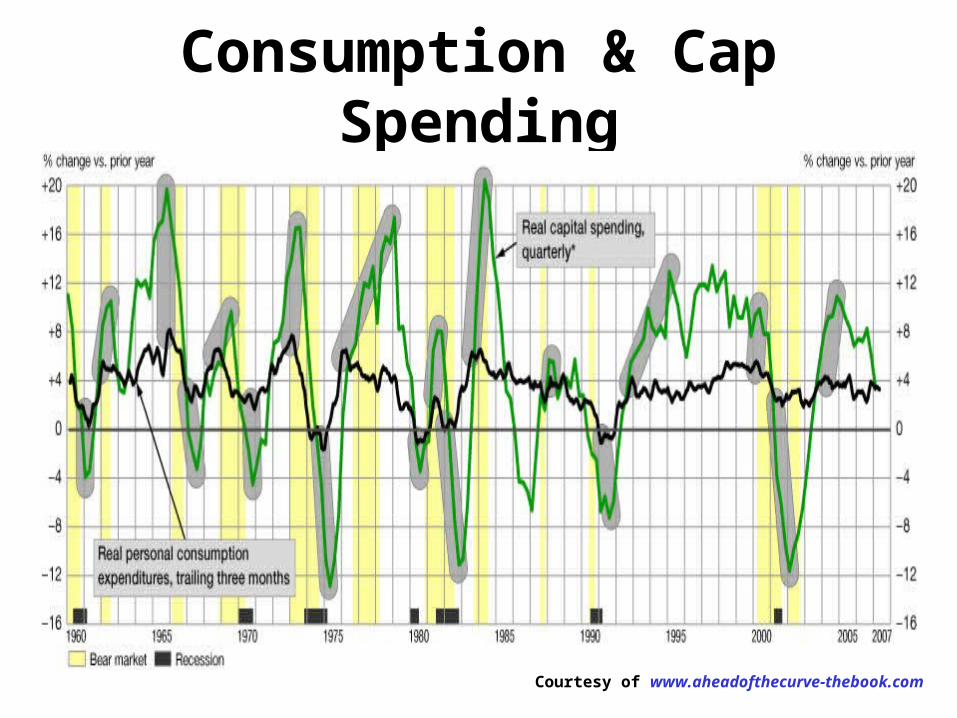
Consumption & Cap Spending
Courtesy of www.aheadofthecurve-thebook.com
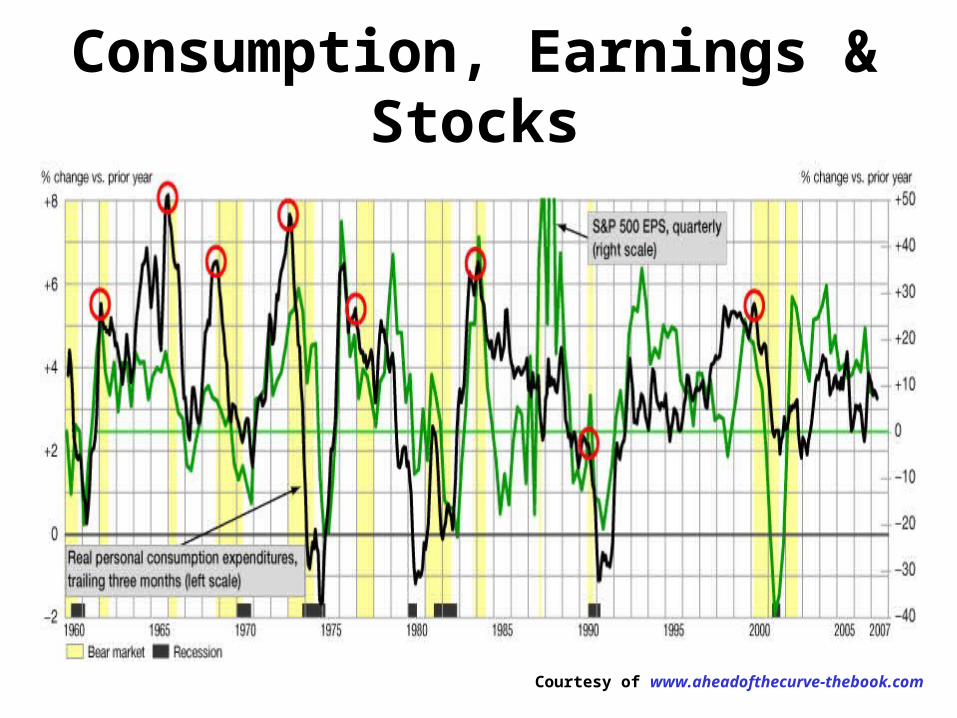
Consumption, Earnings & Stocks
Courtesy of www.aheadofthecurve-thebook.com